analysis of thermal hysteresis protein hydration using the
TRANSCRIPT
Biophysical Chemistry 105(2003) 195–209
0301-4622/03/$ - see front matter� 2003 Elsevier Science B.V. All rights reserved.doi:10.1016/S0301-4622Ž03.00087-5
Analysis of thermal hysteresis protein hydration using the randomnetwork model
Kelly Ryan Gallagher, Kim A. Sharp*
E.R. Johnson Research Foundation, Department of Biochemistry and Biophysics, University of Pennsylvania,3700 Hamilton Walk, Philadelphia, PA 19104-6059, USA
Received 24 June 2002; received in revised form 22 August 2002; accepted 22 August 2002
Abstract
The hydration of polar and apolar groups can be explained quantitatively, via the random network model of water,in terms of differential distortions in first hydration shell water–water hydrogen bonding angle. This method ofanalyzing solute induced structural distortions of water is applied to study the ice-binding type III thermal hysteresisprotein. The analysis reveals subtle but significant differences in solvent structuring of the ice-binding surface,compared to non-ice binding protein surface. The major differences in hydration in the ice-binding region are(i)polar groups have a very apolar-like hydration.(ii) there is more uniform hydration structure. Overall, this surfacestrongly enhances the tetrahedral, or ice-like, hydration within the primary hydration shell. It is concluded that thesetwo specific features of the hydration structure are important for this surface to recognize, and preferentially interactwith nascent ice crystals forming in liquid water.� 2003 Elsevier Science B.V. All rights reserved.
Keywords: Hydration; Thermal hysteresis protein; Liquid water; Random network mode
1. Introduction
It is well established that the unique propertiesof water dictate much of a protein’s structure andfunction. One central theme that has emerged isthat hydrophobic, or solvophobic, interactionsdrive or influence many molecular ‘transactions’w1–6x. In the past, descriptions of this effect havefocused on the entropic penalty for ordering wateraround an apolar solutew7x. Yet the hydration ofpolar solutes is also usually accompanied by a
*Corresponding author. Tel.:q1-215-573-3506; fax:q1-215-898-4217.
E-mail address: [email protected](K.A. Sharp).
decrease in entropy. In contrast, the hydration heatcapacities of these two types of hydration havedifferent signsw8–12x and thus are a more reveal-ing indicator of the difference between apolar andpolar hydration. We have previously directed ourefforts towards developing a deeper understandingof heat capacity changes using as a starting pointthe random network model(rnm) of Henn andKauzmannw13x. A combination of explicit watersimulations and this rnm yields quantitative agree-ment between measured and calculated hydrationheat capacitiesw2,14,15x, as well as a revealingdescription of the change in water structureinduced by apolar and polar solutesw16x. The main
196 K.R. Gallagher, K.A. Sharp / Biophysical Chemistry 105 (2003) 195–209
features of this picture are: The bulk water–waterangular distribution function(P(u)) is bimodal,with a low angle population and a high anglepopulation, centered at approximately 128 andapproximately 548, respectively. Solutes perturbthe structure of water principally in their firsthydration shell by changing the ratio of these twopopulations, apolar solutes increasing the lowangle population, polar solutes increasing the highangle population. There is a direct link betweenthese angular structural changes in the waterhydrogen bond network in the first hydration shellof the solute and heat capacity changes. Changesin water–water distance in the first hydration shellare highly correlated with these angle changes, butare much smaller, explaining why previous exper-imental and theoretical analyses of water using theusual analyses of radial distribution functionsw17,18x show apparently little change in waterstructure due to apolar solvationw14x.The sensitivity ofP(u) as a reporter of solute
induced structure changes suggests that it could beused more generally to enhance our understandingof protein and nucleic acid hydration. A particu-larly intriguing potential application is that of anti-freeze or thermal hysteresis proteins(THPs).These proteins are produced by a variety of organ-isms, including fish, spiders, insects and bacteria,in order to facilitate their survival at sub-freezingtemperatures. Although the precise mechanism isunclear, these proteins act to depress the freezingpoint of a solution below the melting point in anon-colligative manner by accumulating at thesurface and inhibiting the growth of ice crystalsw19x. The ice-binding sites on several THPs havebeen identified and are distinguished by the rela-tive planarity and nonpolar character of the surface(67% type I THP, 59% type III THP) w20,21x. Thetype III THP is a 66-residue protein that, unlikethe a-helical type I THP, consists mainly ofb-strands connected by large loops. Although type ITHPs present regular arrays of hydrogen bondinggroups on their surface, the geometric arrangementof potential hydrogen bonding groups cannot fullyexplain their ice-binding propertiesw25x. Recentstudies have also identified an important role forhydrophobic interactions in the type I ice-bindingmechanismw44x. An ice-binding face of the type
III THP molecule has been proposed based onseveral studiesw22–24x, and it is notable for itsflatnessw21x and hydrophobicity. Thus, many ques-tions remain regarding the mechanism of specific-ity and affinity in these proteins, the principal onebeing how such a hydrophobic surface is able tomanifest a strong enough interaction with the faceof an ice crystal in order to preferentially bind toice nuclei even in the presence of a large excess(55 M) of liquid water.The goals of this paper were: First, to refine our
previous analysis of the effect of solutes on thewater–water angular distribution function, andextend it to the study of protein hydration. Second,to apply the analysis to a type III THP protein inorder to better understand its ice binding proper-ties. Two specific questions include(i) whetherthere are significant differences in the hydrationstructure of the highly hydrophobic THP III ice-binding surface compared to either its non-bindingsurface, or an equivalently hydrophobic bindingsurface of a non-THP protein.(ii) Whether thisanalysis can shed light on the interaction betweenthe THP III binding site and the ice surface.
2. Methods
2.1. Selection of proteins
In addition to the analysis of a type III THP, itis also necessary to apply the analysis to a non-THP of similar general physical properties as acontrol. The selection of both the THP and controlwas guided by several criteria:(i) Availability ofa high-resolution crystal structure.(ii) Moderatesize, in order to be able to include a sufficientnumber of explicit water molecules to form atleast two complete hydration shells around theprotein, yet run the simulations to convergence ina reasonable time.(iii ) No post-translational mod-ifications or heteroatoms. This both simplifies thesimulation procedure and contributes to the gen-erality of our results.(iv) Monomeric, so thatdimer interfaces did not complicate our analysisof surface hydration. It is also desirable that thetwo proteins be of similar size and constructed ofmainly the same type of secondary structure. Twoproteins that fulfilled these requirements were the
197K.R. Gallagher, K.A. Sharp / Biophysical Chemistry 105 (2003) 195–209
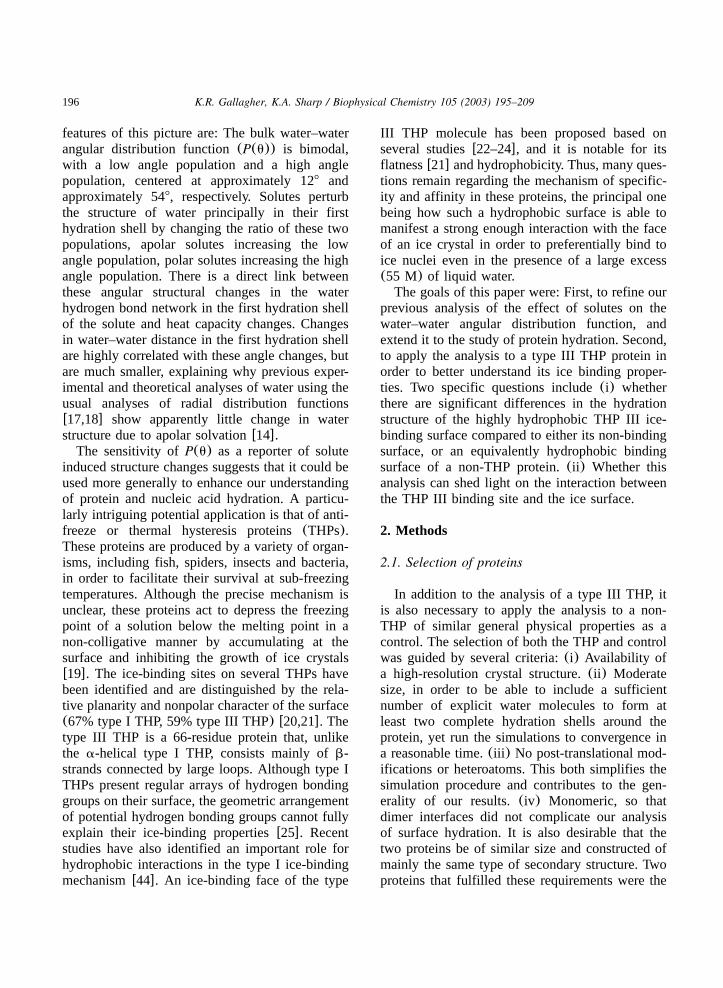
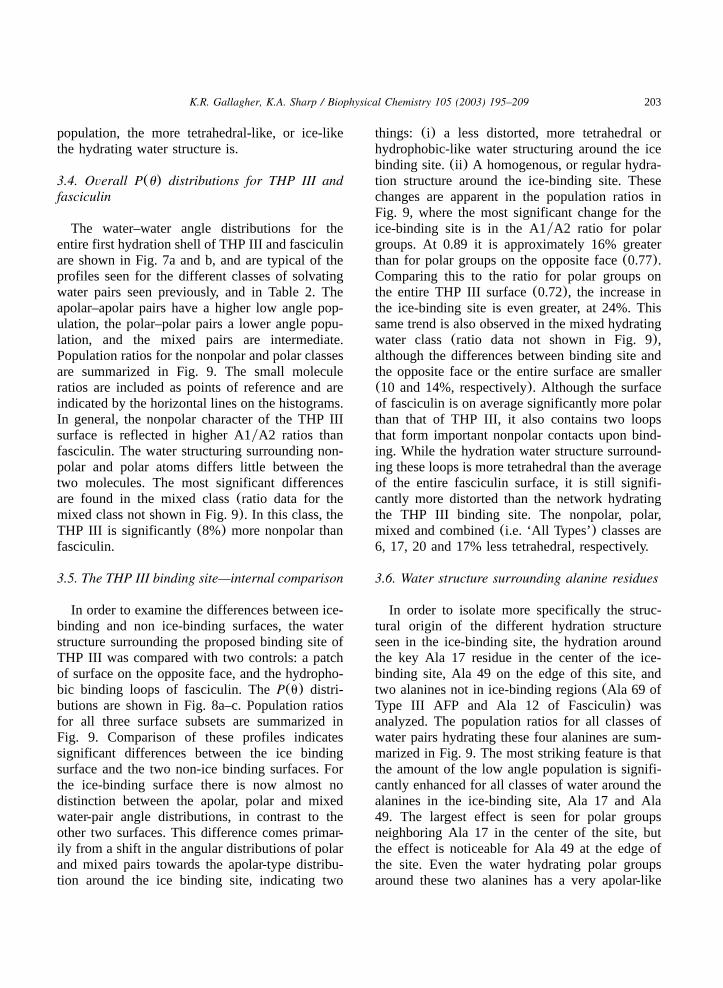
Fig. 1. THP.(a) Secondary structure. The ice binding face is on the left. Ala 17 in the center of the ice-binding site, Ala 49 is onthe edge, and Ala 66 is on the opposite side, shown in CPK representation. Molecular surface in the same orientation(b) androtated 908 to show binding face(c). Apolar residue surface is white, polar residue surface is dark grey.
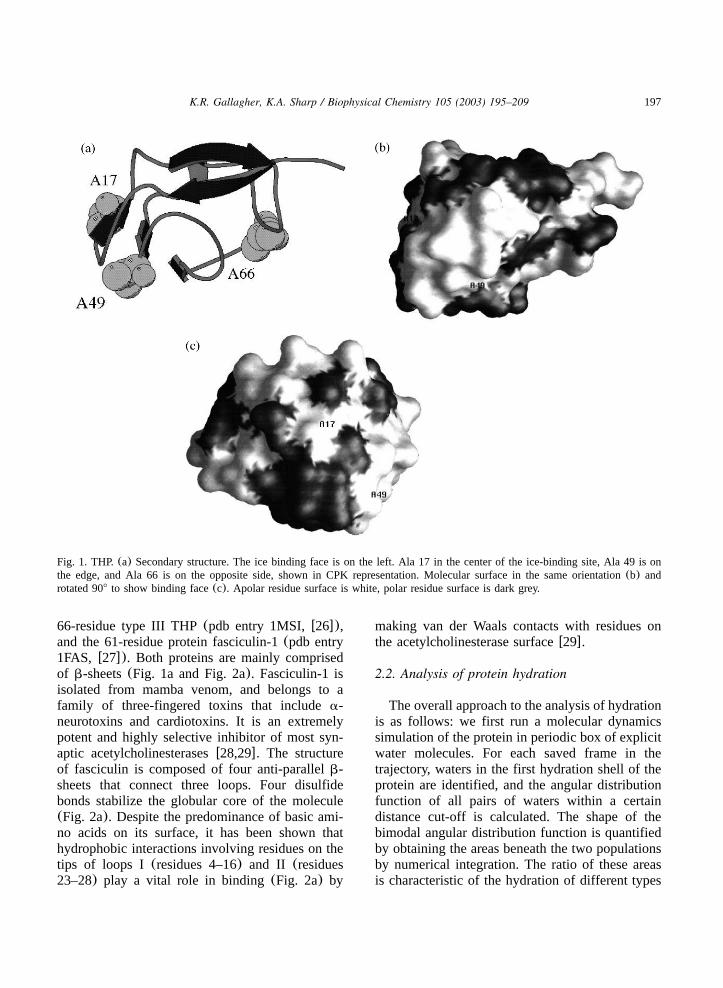
66-residue type III THP(pdb entry 1MSI,w26x),and the 61-residue protein fasciculin-1(pdb entry1FAS, w27x). Both proteins are mainly comprisedof b-sheets(Fig. 1a and Fig. 2a). Fasciculin-1 isisolated from mamba venom, and belongs to afamily of three-fingered toxins that includea-neurotoxins and cardiotoxins. It is an extremelypotent and highly selective inhibitor of most syn-aptic acetylcholinesterasesw28,29x. The structureof fasciculin is composed of four anti-parallelb-sheets that connect three loops. Four disulfidebonds stabilize the globular core of the molecule(Fig. 2a). Despite the predominance of basic ami-no acids on its surface, it has been shown thathydrophobic interactions involving residues on thetips of loops I (residues 4–16) and II (residues23–28) play a vital role in binding(Fig. 2a) by
making van der Waals contacts with residues onthe acetylcholinesterase surfacew29x.
2.2. Analysis of protein hydration
The overall approach to the analysis of hydrationis as follows: we first run a molecular dynamicssimulation of the protein in periodic box of explicitwater molecules. For each saved frame in thetrajectory, waters in the first hydration shell of theprotein are identified, and the angular distributionfunction of all pairs of waters within a certaindistance cut-off is calculated. The shape of thebimodal angular distribution function is quantifiedby obtaining the areas beneath the two populationsby numerical integration. The ratio of these areasis characteristic of the hydration of different types
198 K.R. Gallagher, K.A. Sharp / Biophysical Chemistry 105 (2003) 195–209
Fig. 2. Fasciculin-1.(a) The secondary structure. The singlesurface alanine on the biding loop is shown in CPK represen-tation. (b) Molecular surface in the same orientation. Apolarresidue surface is white, polar residue surface is dark grey.
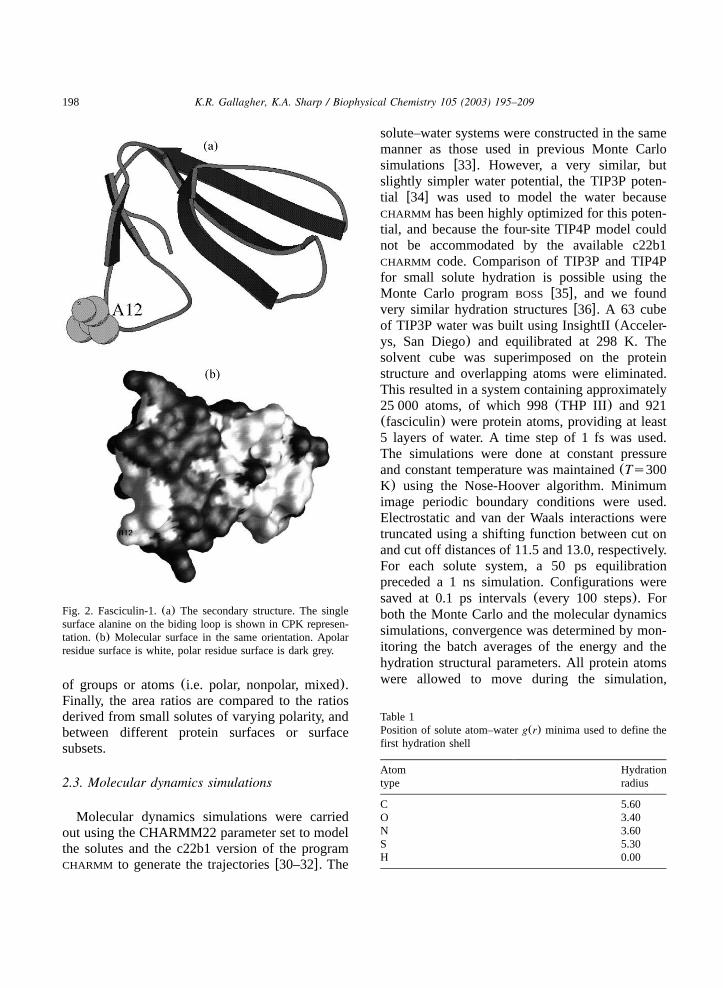
Table 1Position of solute atom–waterg(r) minima used to define thefirst hydration shell
Atom Hydrationtype radius
C 5.60O 3.40N 3.60S 5.30H 0.00
of groups or atoms(i.e. polar, nonpolar, mixed).Finally, the area ratios are compared to the ratiosderived from small solutes of varying polarity, andbetween different protein surfaces or surfacesubsets.
2.3. Molecular dynamics simulations
Molecular dynamics simulations were carriedout using the CHARMM22 parameter set to modelthe solutes and the c22b1 version of the programCHARMM to generate the trajectoriesw30–32x. The
solute–water systems were constructed in the samemanner as those used in previous Monte Carlosimulations w33x. However, a very similar, butslightly simpler water potential, the TIP3P poten-tial w34x was used to model the water becauseCHARMM has been highly optimized for this poten-tial, and because the four-site TIP4P model couldnot be accommodated by the available c22b1CHARMM code. Comparison of TIP3P and TIP4Pfor small solute hydration is possible using theMonte Carlo programBOSS w35x, and we foundvery similar hydration structuresw36x. A 63 cubeof TIP3P water was built using InsightII(Acceler-ys, San Diego) and equilibrated at 298 K. Thesolvent cube was superimposed on the proteinstructure and overlapping atoms were eliminated.This resulted in a system containing approximately25 000 atoms, of which 998(THP III) and 921(fasciculin) were protein atoms, providing at least5 layers of water. A time step of 1 fs was used.The simulations were done at constant pressureand constant temperature was maintained(Ts300K) using the Nose-Hoover algorithm. Minimumimage periodic boundary conditions were used.Electrostatic and van der Waals interactions weretruncated using a shifting function between cut onand cut off distances of 11.5 and 13.0, respectively.For each solute system, a 50 ps equilibrationpreceded a 1 ns simulation. Configurations weresaved at 0.1 ps intervals(every 100 steps). Forboth the Monte Carlo and the molecular dynamicssimulations, convergence was determined by mon-itoring the batch averages of the energy and thehydration structural parameters. All protein atomswere allowed to move during the simulation,
199K.R. Gallagher, K.A. Sharp / Biophysical Chemistry 105 (2003) 195–209
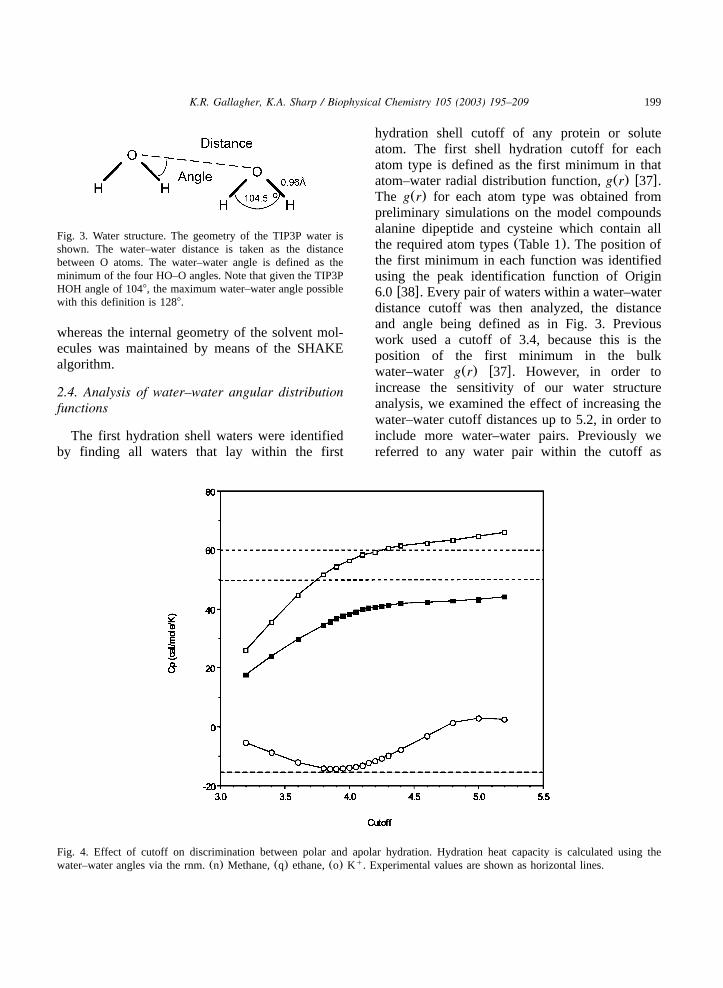
Fig. 3. Water structure. The geometry of the TIP3P water isshown. The water–water distance is taken as the distancebetween O atoms. The water–water angle is defined as theminimum of the four HO–O angles. Note that given the TIP3PHOH angle of 1048, the maximum water–water angle possiblewith this definition is 1288.
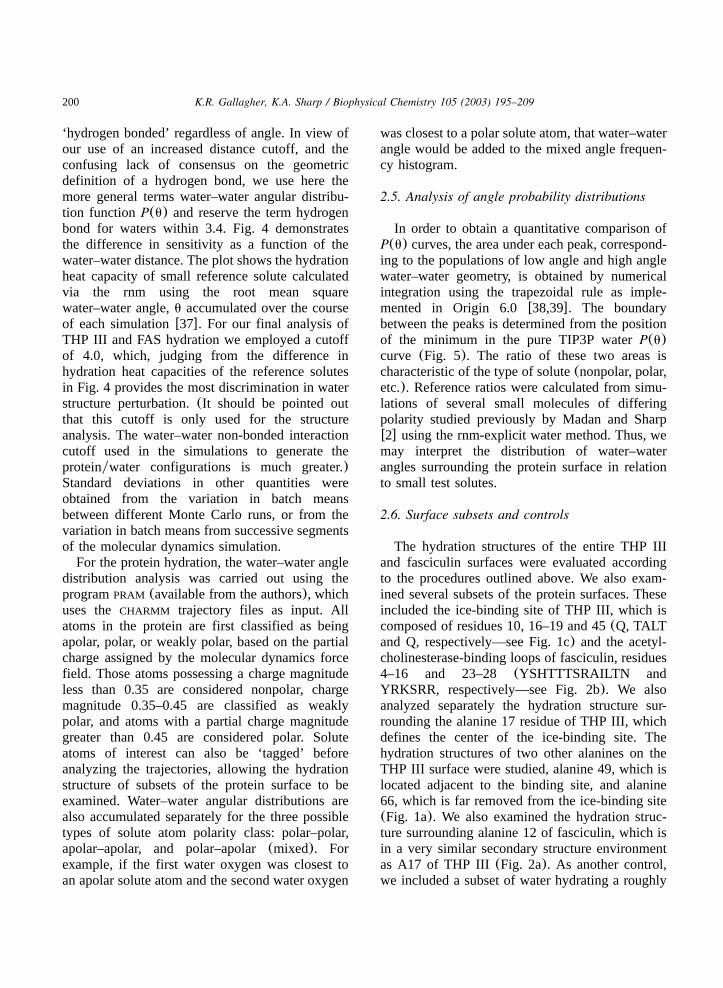
Fig. 4. Effect of cutoff on discrimination between polar and apolar hydration. Hydration heat capacity is calculated using thewater–water angles via the rnm.(n) Methane,(q) ethane,(o) K . Experimental values are shown as horizontal lines.q
whereas the internal geometry of the solvent mol-ecules was maintained by means of the SHAKEalgorithm.
2.4. Analysis of water–water angular distributionfunctions
The first hydration shell waters were identifiedby finding all waters that lay within the first
hydration shell cutoff of any protein or soluteatom. The first shell hydration cutoff for eachatom type is defined as the first minimum in thatatom–water radial distribution function,g(r) w37x.The g(r) for each atom type was obtained frompreliminary simulations on the model compoundsalanine dipeptide and cysteine which contain allthe required atom types(Table 1). The position ofthe first minimum in each function was identifiedusing the peak identification function of Origin6.0 w38x. Every pair of waters within a water–waterdistance cutoff was then analyzed, the distanceand angle being defined as in Fig. 3. Previouswork used a cutoff of 3.4, because this is theposition of the first minimum in the bulkwater–water g(r) w37x. However, in order toincrease the sensitivity of our water structureanalysis, we examined the effect of increasing thewater–water cutoff distances up to 5.2, in order toinclude more water–water pairs. Previously wereferred to any water pair within the cutoff as
200 K.R. Gallagher, K.A. Sharp / Biophysical Chemistry 105 (2003) 195–209
‘hydrogen bonded’ regardless of angle. In view ofour use of an increased distance cutoff, and theconfusing lack of consensus on the geometricdefinition of a hydrogen bond, we use here themore general terms water–water angular distribu-tion functionP(u) and reserve the term hydrogenbond for waters within 3.4. Fig. 4 demonstratesthe difference in sensitivity as a function of thewater–water distance. The plot shows the hydrationheat capacity of small reference solute calculatedvia the rnm using the root mean squarewater–water angle,u accumulated over the courseof each simulationw37x. For our final analysis ofTHP III and FAS hydration we employed a cutoffof 4.0, which, judging from the difference inhydration heat capacities of the reference solutesin Fig. 4 provides the most discrimination in waterstructure perturbation.(It should be pointed outthat this cutoff is only used for the structureanalysis. The water–water non-bonded interactioncutoff used in the simulations to generate theproteinywater configurations is much greater.)Standard deviations in other quantities wereobtained from the variation in batch meansbetween different Monte Carlo runs, or from thevariation in batch means from successive segmentsof the molecular dynamics simulation.For the protein hydration, the water–water angle
distribution analysis was carried out using theprogramPRAM (available from the authors), whichuses theCHARMM trajectory files as input. Allatoms in the protein are first classified as beingapolar, polar, or weakly polar, based on the partialcharge assigned by the molecular dynamics forcefield. Those atoms possessing a charge magnitudeless than 0.35 are considered nonpolar, chargemagnitude 0.35–0.45 are classified as weaklypolar, and atoms with a partial charge magnitudegreater than 0.45 are considered polar. Soluteatoms of interest can also be ‘tagged’ beforeanalyzing the trajectories, allowing the hydrationstructure of subsets of the protein surface to beexamined. Water–water angular distributions arealso accumulated separately for the three possibletypes of solute atom polarity class: polar–polar,apolar–apolar, and polar–apolar(mixed). Forexample, if the first water oxygen was closest toan apolar solute atom and the second water oxygen
was closest to a polar solute atom, that water–waterangle would be added to the mixed angle frequen-cy histogram.
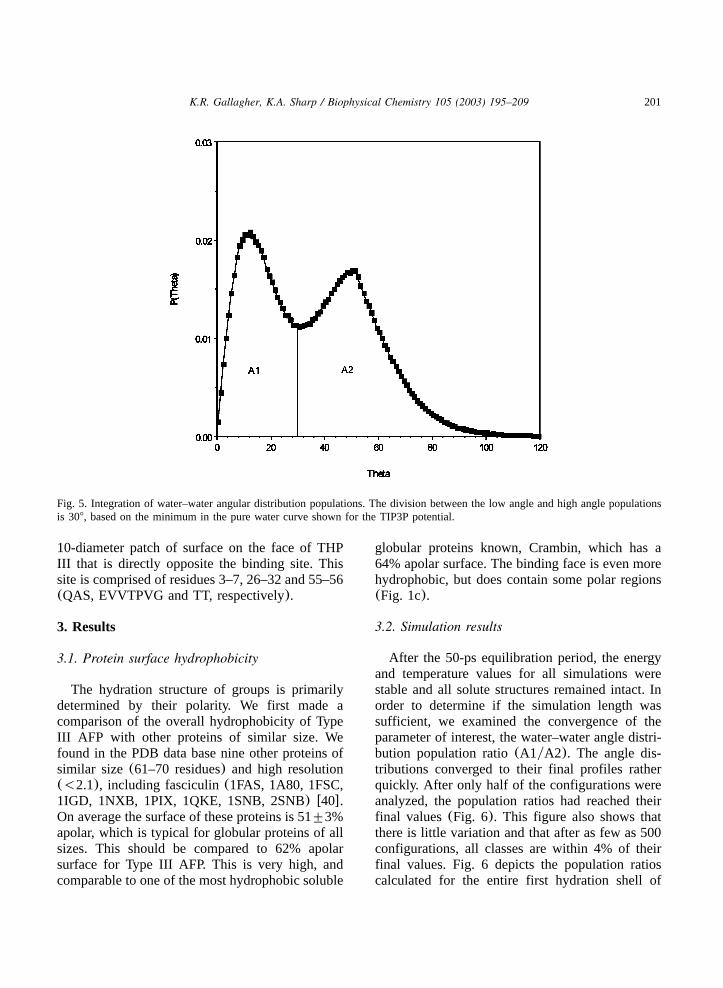
2.5. Analysis of angle probability distributions
In order to obtain a quantitative comparison ofP(u) curves, the area under each peak, correspond-ing to the populations of low angle and high anglewater–water geometry, is obtained by numericalintegration using the trapezoidal rule as imple-mented in Origin 6.0 w38,39x. The boundarybetween the peaks is determined from the positionof the minimum in the pure TIP3P waterP(u)curve (Fig. 5). The ratio of these two areas ischaracteristic of the type of solute(nonpolar, polar,etc.). Reference ratios were calculated from simu-lations of several small molecules of differingpolarity studied previously by Madan and Sharpw2x using the rnm-explicit water method. Thus, wemay interpret the distribution of water–waterangles surrounding the protein surface in relationto small test solutes.
2.6. Surface subsets and controls
The hydration structures of the entire THP IIIand fasciculin surfaces were evaluated accordingto the procedures outlined above. We also exam-ined several subsets of the protein surfaces. Theseincluded the ice-binding site of THP III, which iscomposed of residues 10, 16–19 and 45(Q, TALTand Q, respectively—see Fig. 1c) and the acetyl-cholinesterase-binding loops of fasciculin, residues4–16 and 23–28 (YSHTTTSRAILTN andYRKSRR, respectively—see Fig. 2b). We alsoanalyzed separately the hydration structure sur-rounding the alanine 17 residue of THP III, whichdefines the center of the ice-binding site. Thehydration structures of two other alanines on theTHP III surface were studied, alanine 49, which islocated adjacent to the binding site, and alanine66, which is far removed from the ice-binding site(Fig. 1a). We also examined the hydration struc-ture surrounding alanine 12 of fasciculin, which isin a very similar secondary structure environmentas A17 of THP III (Fig. 2a). As another control,we included a subset of water hydrating a roughly
201K.R. Gallagher, K.A. Sharp / Biophysical Chemistry 105 (2003) 195–209
Fig. 5. Integration of water–water angular distribution populations. The division between the low angle and high angle populationsis 308, based on the minimum in the pure water curve shown for the TIP3P potential.
10-diameter patch of surface on the face of THPIII that is directly opposite the binding site. Thissite is comprised of residues 3–7, 26–32 and 55–56(QAS, EVVTPVG and TT, respectively).
3. Results
3.1. Protein surface hydrophobicity
The hydration structure of groups is primarilydetermined by their polarity. We first made acomparison of the overall hydrophobicity of TypeIII AFP with other proteins of similar size. Wefound in the PDB data base nine other proteins ofsimilar size(61–70 residues) and high resolution(-2.1), including fasciculin(1FAS, 1A80, 1FSC,1IGD, 1NXB, 1PIX, 1QKE, 1SNB, 2SNB) w40x.On average the surface of these proteins is 51"3%apolar, which is typical for globular proteins of allsizes. This should be compared to 62% apolarsurface for Type III AFP. This is very high, andcomparable to one of the most hydrophobic soluble
globular proteins known, Crambin, which has a64% apolar surface. The binding face is even morehydrophobic, but does contain some polar regions(Fig. 1c).
3.2. Simulation results
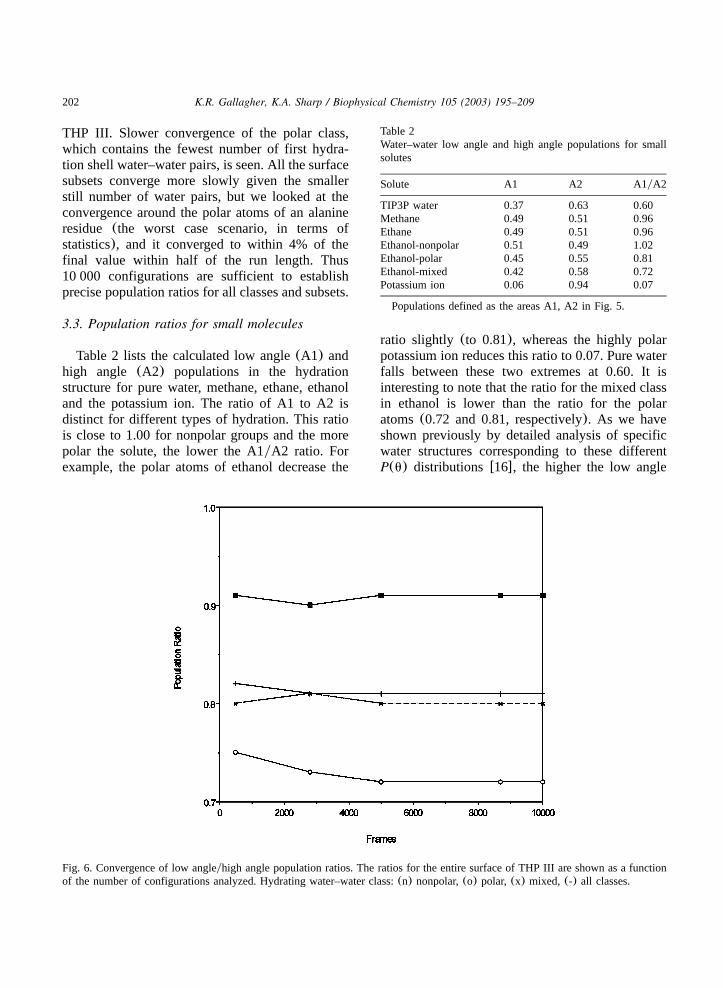
After the 50-ps equilibration period, the energyand temperature values for all simulations werestable and all solute structures remained intact. Inorder to determine if the simulation length wassufficient, we examined the convergence of theparameter of interest, the water–water angle distri-bution population ratio(A1yA2). The angle dis-tributions converged to their final profiles ratherquickly. After only half of the configurations wereanalyzed, the population ratios had reached theirfinal values(Fig. 6). This figure also shows thatthere is little variation and that after as few as 500configurations, all classes are within 4% of theirfinal values. Fig. 6 depicts the population ratioscalculated for the entire first hydration shell of
202 K.R. Gallagher, K.A. Sharp / Biophysical Chemistry 105 (2003) 195–209
Table 2Water–water low angle and high angle populations for smallsolutes
Solute A1 A2 A1yA2
TIP3P water 0.37 0.63 0.60Methane 0.49 0.51 0.96Ethane 0.49 0.51 0.96Ethanol-nonpolar 0.51 0.49 1.02Ethanol-polar 0.45 0.55 0.81Ethanol-mixed 0.42 0.58 0.72Potassium ion 0.06 0.94 0.07
Populations defined as the areas A1, A2 in Fig. 5.
Fig. 6. Convergence of low angleyhigh angle population ratios. The ratios for the entire surface of THP III are shown as a functionof the number of configurations analyzed. Hydrating water–water class:(n) nonpolar,(o) polar, (x) mixed, (-) all classes.
THP III. Slower convergence of the polar class,which contains the fewest number of first hydra-tion shell water–water pairs, is seen. All the surfacesubsets converge more slowly given the smallerstill number of water pairs, but we looked at theconvergence around the polar atoms of an alanineresidue (the worst case scenario, in terms ofstatistics), and it converged to within 4% of thefinal value within half of the run length. Thus10 000 configurations are sufficient to establishprecise population ratios for all classes and subsets.
3.3. Population ratios for small molecules
Table 2 lists the calculated low angle(A1) andhigh angle (A2) populations in the hydrationstructure for pure water, methane, ethane, ethanoland the potassium ion. The ratio of A1 to A2 isdistinct for different types of hydration. This ratiois close to 1.00 for nonpolar groups and the morepolar the solute, the lower the A1yA2 ratio. Forexample, the polar atoms of ethanol decrease the
ratio slightly (to 0.81), whereas the highly polarpotassium ion reduces this ratio to 0.07. Pure waterfalls between these two extremes at 0.60. It isinteresting to note that the ratio for the mixed classin ethanol is lower than the ratio for the polaratoms(0.72 and 0.81, respectively). As we haveshown previously by detailed analysis of specificwater structures corresponding to these differentP(u) distributionsw16x, the higher the low angle
203K.R. Gallagher, K.A. Sharp / Biophysical Chemistry 105 (2003) 195–209
population, the more tetrahedral-like, or ice-likethe hydrating water structure is.
3.4. Overall P(u) distributions for THP III andfasciculin
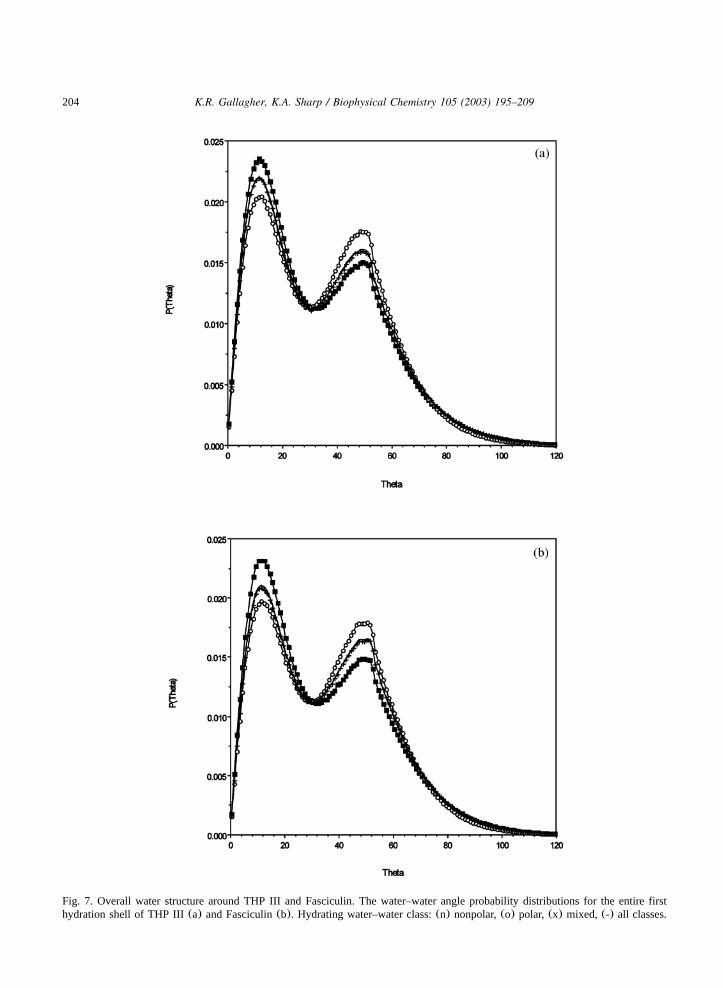
The water–water angle distributions for theentire first hydration shell of THP III and fasciculinare shown in Fig. 7a and b, and are typical of theprofiles seen for the different classes of solvatingwater pairs seen previously, and in Table 2. Theapolar–apolar pairs have a higher low angle pop-ulation, the polar–polar pairs a lower angle popu-lation, and the mixed pairs are intermediate.Population ratios for the nonpolar and polar classesare summarized in Fig. 9. The small moleculeratios are included as points of reference and areindicated by the horizontal lines on the histograms.In general, the nonpolar character of the THP IIIsurface is reflected in higher A1yA2 ratios thanfasciculin. The water structuring surrounding non-polar and polar atoms differs little between thetwo molecules. The most significant differencesare found in the mixed class(ratio data for themixed class not shown in Fig. 9). In this class, theTHP III is significantly (8%) more nonpolar thanfasciculin.
3.5. The THP III binding site—internal comparison
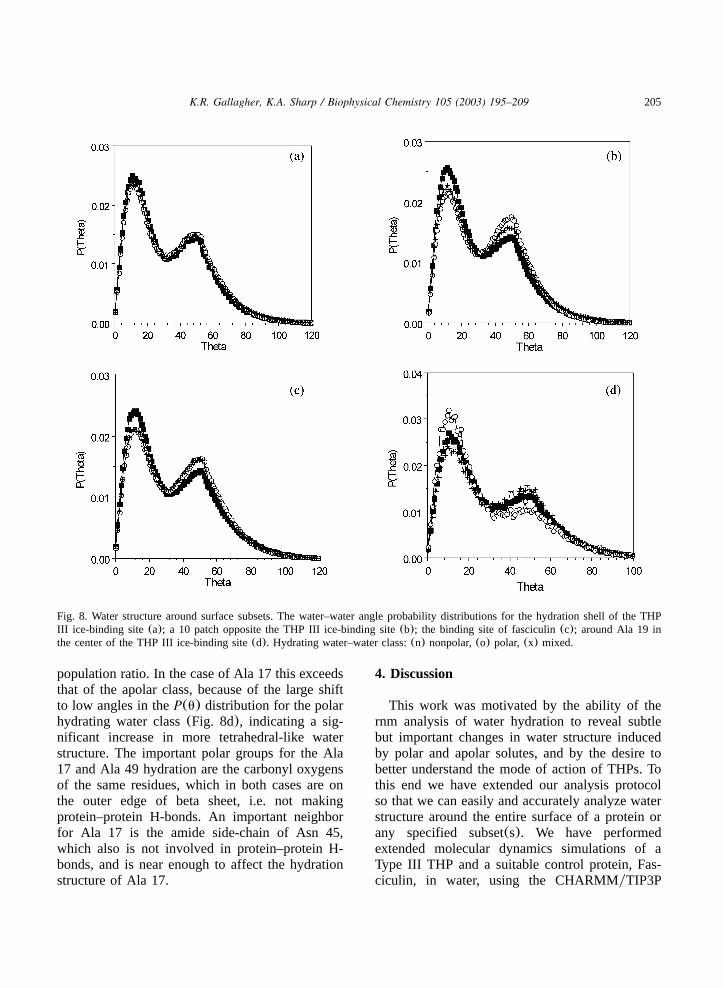
In order to examine the differences between ice-binding and non ice-binding surfaces, the waterstructure surrounding the proposed binding site ofTHP III was compared with two controls: a patchof surface on the opposite face, and the hydropho-bic binding loops of fasciculin. TheP(u) distri-butions are shown in Fig. 8a–c. Population ratiosfor all three surface subsets are summarized inFig. 9. Comparison of these profiles indicatessignificant differences between the ice bindingsurface and the two non-ice binding surfaces. Forthe ice-binding surface there is now almost nodistinction between the apolar, polar and mixedwater-pair angle distributions, in contrast to theother two surfaces. This difference comes primar-ily from a shift in the angular distributions of polarand mixed pairs towards the apolar-type distribu-tion around the ice binding site, indicating two
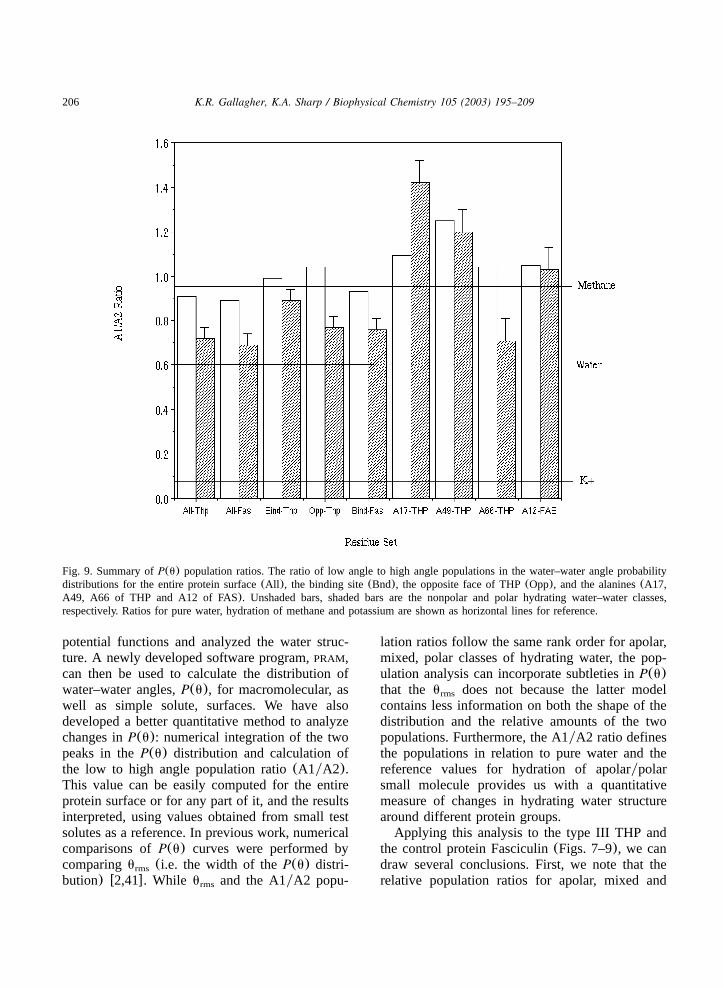
things: (i) a less distorted, more tetrahedral orhydrophobic-like water structuring around the icebinding site.(ii) A homogenous, or regular hydra-tion structure around the ice-binding site. Thesechanges are apparent in the population ratios inFig. 9, where the most significant change for theice-binding site is in the A1yA2 ratio for polargroups. At 0.89 it is approximately 16% greaterthan for polar groups on the opposite face(0.77).Comparing this to the ratio for polar groups onthe entire THP III surface(0.72), the increase inthe ice-binding site is even greater, at 24%. Thissame trend is also observed in the mixed hydratingwater class(ratio data not shown in Fig. 9),although the differences between binding site andthe opposite face or the entire surface are smaller(10 and 14%, respectively). Although the surfaceof fasciculin is on average significantly more polarthan that of THP III, it also contains two loopsthat form important nonpolar contacts upon bind-ing. While the hydration water structure surround-ing these loops is more tetrahedral than the averageof the entire fasciculin surface, it is still signifi-cantly more distorted than the network hydratingthe THP III binding site. The nonpolar, polar,mixed and combined(i.e. ‘All Types’) classes are6, 17, 20 and 17% less tetrahedral, respectively.
3.6. Water structure surrounding alanine residues
In order to isolate more specifically the struc-tural origin of the different hydration structureseen in the ice-binding site, the hydration aroundthe key Ala 17 residue in the center of the ice-binding site, Ala 49 on the edge of this site, andtwo alanines not in ice-binding regions(Ala 69 ofType III AFP and Ala 12 of Fasciculin) wasanalyzed. The population ratios for all classes ofwater pairs hydrating these four alanines are sum-marized in Fig. 9. The most striking feature is thatthe amount of the low angle population is signifi-cantly enhanced for all classes of water around thealanines in the ice-binding site, Ala 17 and Ala49. The largest effect is seen for polar groupsneighboring Ala 17 in the center of the site, butthe effect is noticeable for Ala 49 at the edge ofthe site. Even the water hydrating polar groupsaround these two alanines has a very apolar-like
204 K.R. Gallagher, K.A. Sharp / Biophysical Chemistry 105 (2003) 195–209
Fig. 7. Overall water structure around THP III and Fasciculin. The water–water angle probability distributions for the entire firsthydration shell of THP III(a) and Fasciculin(b). Hydrating water–water class:(n) nonpolar,(o) polar, (x) mixed, (-) all classes.
205K.R. Gallagher, K.A. Sharp / Biophysical Chemistry 105 (2003) 195–209
Fig. 8. Water structure around surface subsets. The water–water angle probability distributions for the hydration shell of the THPIII ice-binding site(a); a 10 patch opposite the THP III ice-binding site(b); the binding site of fasciculin(c); around Ala 19 inthe center of the THP III ice-binding site(d). Hydrating water–water class:(n) nonpolar,(o) polar, (x) mixed.
population ratio. In the case of Ala 17 this exceedsthat of the apolar class, because of the large shiftto low angles in theP(u) distribution for the polarhydrating water class(Fig. 8d), indicating a sig-nificant increase in more tetrahedral-like waterstructure. The important polar groups for the Ala17 and Ala 49 hydration are the carbonyl oxygensof the same residues, which in both cases are onthe outer edge of beta sheet, i.e. not makingprotein–protein H-bonds. An important neighborfor Ala 17 is the amide side-chain of Asn 45,which also is not involved in protein–protein H-bonds, and is near enough to affect the hydrationstructure of Ala 17.
4. Discussion
This work was motivated by the ability of thernm analysis of water hydration to reveal subtlebut important changes in water structure inducedby polar and apolar solutes, and by the desire tobetter understand the mode of action of THPs. Tothis end we have extended our analysis protocolso that we can easily and accurately analyze waterstructure around the entire surface of a protein orany specified subset(s). We have performedextended molecular dynamics simulations of aType III THP and a suitable control protein, Fas-ciculin, in water, using the CHARMMyTIP3P
206 K.R. Gallagher, K.A. Sharp / Biophysical Chemistry 105 (2003) 195–209
Fig. 9. Summary ofP(u) population ratios. The ratio of low angle to high angle populations in the water–water angle probabilitydistributions for the entire protein surface(All ), the binding site(Bnd), the opposite face of THP(Opp), and the alanines(A17,A49, A66 of THP and A12 of FAS). Unshaded bars, shaded bars are the nonpolar and polar hydrating water–water classes,respectively. Ratios for pure water, hydration of methane and potassium are shown as horizontal lines for reference.
potential functions and analyzed the water struc-ture. A newly developed software program,PRAM,can then be used to calculate the distribution ofwater–water angles,P(u), for macromolecular, aswell as simple solute, surfaces. We have alsodeveloped a better quantitative method to analyzechanges inP(u): numerical integration of the twopeaks in theP(u) distribution and calculation ofthe low to high angle population ratio(A1yA2).This value can be easily computed for the entireprotein surface or for any part of it, and the resultsinterpreted, using values obtained from small testsolutes as a reference. In previous work, numericalcomparisons ofP(u) curves were performed bycomparingu (i.e. the width of theP(u) distri-rms
bution) w2,41x. While u and the A1yA2 popu-rms
lation ratios follow the same rank order for apolar,mixed, polar classes of hydrating water, the pop-ulation analysis can incorporate subtleties inP(u)that the u does not because the latter modelrms
contains less information on both the shape of thedistribution and the relative amounts of the twopopulations. Furthermore, the A1yA2 ratio definesthe populations in relation to pure water and thereference values for hydration of apolarypolarsmall molecule provides us with a quantitativemeasure of changes in hydrating water structurearound different protein groups.Applying this analysis to the type III THP and
the control protein Fasciculin(Figs. 7–9), we candraw several conclusions. First, we note that therelative population ratios for apolar, mixed and
207K.R. Gallagher, K.A. Sharp / Biophysical Chemistry 105 (2003) 195–209
polar hydrating water pairs follow the expectedtrend based on polarity, and are similar for the twoproteins. However, the ratios for every class(andthus the average value for all types of hydratingwater) are higher for THP III compared to FAS.Thus, these ratios may be interpreted as a reflectionof the overall hydrophobicity of the protein sur-face. Second, the differences we see are muchsmaller than the range seen in small moleculehydration. For example, compared to our smallmolecule polar standard, K , the polar proteinq
atoms’ P(u) distributions are not as distorted,indicating that either water has a relatively weakinteraction with these groups or the effect ofneighboring polar and apolar groups on the proteinsurface tend to cancel. When we examine subsetsof the surface, however, two significant differencesbetween the ice binding and non-ice binding sur-faces emerges. First, the hydration of the polaratoms in the functional, or ice-binding site, ofTHP III contains a greater amount of tetrahedralstructure or ice-like water structure than either thenonfunctional portion of the molecule or the fas-ciculin control surface. Second, the hydrationstructure is more uniform over the ice-binding site,i.e. there is less variation between the polar andapolar hydration even in the absence of a regularstructure of protein surface hydrogen bondinggroups like those in Type I THPs. The flatness ofthe ice-bonding surface no doubt contributes to itsmore uniform hydration structure compared to theother surfaces.If we further narrow our focus to study the
structuring of water about individual residues, weobserve even greater differences between the ice-binding surface and other surfaces, primarily withregards to polar atom hydration. The water solvat-ing the polar groups near the ice-binding sitealanines A49, and especially A17, has structurevery uncharacteristic of polar hydration, and it isin fact as, or more, apolar-like as water hydratingthe apolar side-chains of Ala 17 and Ala 49. Thesepolar groups include the carbonyl oxygens of thetwo alanines. The unique hydration structure ofthese polar groups must be a direct consequenceof the protein structure in this region, and theneighboring polaryapolar environment, includingthe Asn 45 side chain. However, even detailed
comparative analysis of this part the protein sur-face structure and that of non ice-binding surfacesis not capable, a priori, of explaining the differ-ences in water hydration we see. These clearlydepend on aspects of the structure that are notobvious to the eye, but can be revealed by explicitsolvent simulations averaging over many waterconfigurations, and using sensitive structural meas-ures(e.g. angular distortions) in the analysis. Thisanalysis effectively tells us that the effect thesepolar groups have on water structure can be moreeasily modulated(compared to polar groups onprotein surfaces in general) by the opposing ten-dency of surrounding apolar groups to enhance thetetrahedral structure of water. This happens to suchan extent for these polar groups surrounding theice-binding alanines that the apolar neighbor groupeffect actually dominates.
5. Conclusions
Although many studies have attempted to elu-cidate the binding mechanism of THP III, theirmain successes have been in identifying and con-firming which residues in the protein play animportant role in binding. In addition, it has beendifficult to unambiguously establish which planeof ice comprises the protein-binding site. Manymodeling studies have presumed, as initial evi-dence suggested, that THP III binds to the primaryprism plane, yet recent data suggests that¯(1 0 1 0)the protein may, in fact, interact with the pyramidalplane and other faces, as wellw23,42x.¯(2 0 2 1)Some have proposed that the growing ice surfaceis semi-orderedw23x. Thus, there has also beendebate about whether THP III recognizes an exist-ing site on a nascent ice crystal, whether theprotein itself influences the formation of the bind-ing site, or can bind at several sites.Regardless of the precise mechanism of THP
action, general consideration of the problem of icebinding suggests that the main results of ouranalysis:(i) more uniform hydration structure inthe ice-binding region primarily due to(ii) polargroups with very apolar-like hydration, are signif-icant for the following reasons. The major problemfor a THP is how to recognize, and preferentially
208 K.R. Gallagher, K.A. Sharp / Biophysical Chemistry 105 (2003) 195–209
bind nascent ice crystals forming in liquid water,with the two types of surface groups it has avail-able: polar and apolar. If it uses polar groups, thenordinarily, such groups, being polar will have ahigh affinity for liquid water which is present atlarge excess(55 M), and net binding of ice, presentinitially at low concentrations, will be negligible.On the other hand, if it uses apolar groups, thesepresumably prefer more ice-like water, but becauseof their hydrophobicity, their affinity for any kindof water—liquid or ice—will be low. These unsat-isfactory situations may be summarized as either:high affinity but low specificity, or high specificitybut low affinity. We suggest that the solution forTHPs is to provide some polar surface(for affin-ity) that yet prefers more ice-like water(specific-ity). If there is such a polar, pycrophilic surface,one would expect to recognize it, when surroundedby bulk water, by its tendency push its hydratingwater towards a more ice-like structure rather thanaway like a typical polar surface. This is exactlywhat we observe in the ice-binding region of TypeIII THP. This also has the effect of making thehydration structure of the ice-binding site moreuniform across polar and apolar regions, whichalso would favor binding to the more structuredice form of water over the liquid form. The highlyconserved flatness of the ice-binding facew42xwould also seem to play a role in enhancing theuniformity of the hydration structure.Explicit water simulations of the binding of
small ice-nuclei in the presence of bulk waterwould in principle be able to test some of theseconclusions, but simultaneous proteinywateryicesimulations at thermodynamic equilibrium are cur-rently beyond the ability of potential functionysimulation technology. Other future directionswould include a study of the series of mutants atthe A17 position(located at the center of the ice-binding site) made by DeLuca et al.w43x. Thesemutations were specifically designed to disrupt thetopology of the binding surface. The crystal struc-tures of several of these mutants have been deter-mined (A17M, A17H, A17T, A17C and A17R).An analysis ofP(u) for these mutants, and alsomutations affecting the neighboring polar groupswould both increase our database of protein A1y
A2 values and could improve our understandingof THP action.
Acknowledgments
We thank Dr Frank Sonnichsen for helpful¨discussions. Financial support is gratefullyacknowledged from NIH(GM54105).
References
w1x R.J. Doyle, Contribution of the hydrophobic effect tomicrobial infection, Microbes Infect. 2(2000) 391–400.
w2x K.A. Sharp, B. Madan, The hydrophobic effect, waterstructure and heat capacity changes, J. Phys. Chem. 101(1997) 4343–4348.
w3x W.E. Stites, Protein–protein interactions: interface struc-ture, binding thermodynamics, and mutational analysis,Chem. Rev. 97(1997) 1233–1250.
w4x C.H. Tanford, The Hydrophobic Effect: Formation ofMicelles and Biological Membranes, Wiley, New York,1980.
w5x K.A. Dill, Dominant forces in protein folding, Biochem-istry 29 (1990) 7133.
w6x R.S. Spolar, M.T. Record, Coupling of local folding tosite-specific binding of proteins to DNA, Science 263(1994) 777–784.
w7x W. Kauzmann, Some factors in the interpretation ofprotein denaturation, Adv. Prot. Chem. 14(1959) 1–63.
w8x A. Ben-Naim, Y. Marcus, Solvation thermodynamics ofnonionic solutes, J. Chem. Phys. 81(1984) 2016–2027.
w9x K.P. Murphy, P.L. Privalov, S.J. Gill, Common featuresof protein unfolding and dissolution of hydrophobiccompounds, Science 247(1990) 559–561.
w10x R. Baldwin, Temperature dependence of the hydropho-bic effect in protein folding, Proc. Natl. Acad. Sci. 83(1986) 8069–8072.
w11x P. Privalov, G. Makhatadze, Contribution of hydrationto protein folding thermodynamics. II The entropy andGibbs free energy of hydration, J. Mol. Biol. 232(1993)660–679.
w12x P. Privalov, G. Makhatadze, Contribution of hydrationto protein folding thermodynamics. I The enthalpy ofhydration, J. Mol. Biol. 232(1993) 639–659.
w13x A.R. Henn, W. Kauzmann, Equation of state of a randomnetwork, continuum model of liquid water, J. Phys.Chem. 93(1989) 3770–3783.
w14x B. Madan, K. Sharp, Changes in water structure inducedby a hydrophobic solute probed by simulation of thewater hydrogen bond angle and radial distribution func-tions, Biophys. Chem. 78(1999) 33–41.
w15x F. Vanzi, B. Madan, K. Sharp, Effect of the proteindenaturants urea and guanidinium on water structure: astructural and thermodynamic study, JACS 120(1998)10748–10753.
209K.R. Gallagher, K.A. Sharp / Biophysical Chemistry 105 (2003) 195–209
w16x K. Sharp, B. Madan, E. Manas, J. Vanderkooi, Waterstructure changes induced by hydrophobic and polarsolutes revealed by simulations and IR spectroscopy, J.Chem. Phys. 114(2001) 1791–1796.
w17x J. Turner, A. Soper, The effect of apolar solutes onwater structure: alcohols and tetraalkylammonium ions,J. Chem. Phys. 101(1994) 6116–6125.
w18x J. Turner, A. Soper, J. Finney, Ionic versus apolarbehavior of the teramethylammonium ion in water, J.Chem. Phys. 102(1995) 5438–5443.
w19x Y. Yeh, R.E. Feeney, Antifreeze proteins: structures andmechanisms of function, Chem. Rev. 96(1996)601–617.
w20x P.L. Davies, B.D. Sykes, Antifreeze proteins, Curr. Opin.Struct. Biol. 7(1997) 828–834.
w21x D.S.C. Yang, W.C. Hen, S. Bubanko, et al., Identifica-tion of the ice-binding surface on a type III AFP witha ‘flatness function’ algorithm, Biophys. J. 74(1998)2142–2151.
w22x H. Chao, F.D. Sonnichsen, C.I. DeLuca, P.L. Davies,¨B.D Sykes, Structure-function relationship in the glob-ular type III antifreeze protein: identification of a clusterof surface residues required for binding to ice, ProteinSci. 3 (1994) 1760–1769.
w23x G. Chen, Z. Jia, Ice-binding surface of fish type IIIantifreeze, Biophys. J. 77(1999) 1602–1608.
w24x F.D. Sonnichsen, C.I. DeLuca, P.L. Davies, B.D. Sykes,¨Refined solution structure of type III antifreeze protein:hydrophobic groups may be involved in the energeticsof the protein-ice interaction, Structure 4(1996)1325–1337.
w25x H.M. Chao, M.E. Houston, R.S. Hodges, et al., Adiminished role for hydrogen bonds in antifreeze proteinbinding to ice, Biochemistry 36(1997) 14652–14660.
w26x Z. Jia, C.I. DeLuca, H. Chao, P.L. Davies, Structuralbasis for the binding of a globular antifreeze protein toice, Nature 384(1996) 285–288.
w27x M.H. le Du, P. Marchot, P.E. Bougis, J.C. Fontecilla-Camps, 1.9-Resolution structure of fasciculin 1, an anti-acetylcholinesterase toxin from green mamba snakevenom, J. Biol. Chem. 267(1992) 22122.
w28x C. Cervenansky, F. Dajas, A.L. Harvey, Snake Toxins,Pergamon Press, New York, 1991.
w29x Z. Radic, R. Duran, D.C. Vellom, Y. Li, C. Cervernasky,P. Taylor, Site of fasciculin interaction with acetylcho-linesterase, J. Biol. Chem. 269(1994) 11233–11239.
w30x B.R. Brooks, R.E. Bruccoleri, B.D. Olafson, D.J. States,S. Swaminathan, M. Karplus,CHARMM: a program for
macromolecular energy, minimization and dynamics cal-culations, J. Comp. Chem. 4(1983) 187.
w31x MacKerell Jr., et al., Self-consistent parameterizationof biomolecules for molecular modeling and condensedphase simulations, FASEB J. 6(1992) A143.
w32x A.D.J. MacKerell, B. Brooks, I.C.L. Brooks, et al., in:P.v.R. Schleyer(Ed.), The Encyclopedia of Computa-tional Chemistry, vol. 1, Wiley, Chichester, 1998, pp.271–277.
w33x B. Madan, K.A. Sharp, Heat capacity changes accom-panying hydrophobic and ionic solvation: a Monte-Carlo and random network model study, J. Phys. Chem.100 (1996) 7713–7721.
w34x W.L. Jorgensen, J. Chandrasekhar, J.D. Madura, R.W.Impey, M.L. Klein, Comparison of simple potentialfunctions for simulating liquid water, J. Chem. Phys.79 (1983) 926.
w35x W.L. Jorgensen, BOSS, Version 3.3, Copyright YaleUniversity, New Haven, CT, 1992.
w36x K.R. Gallagher, Electrostatic Contributions to HeatCapacity Changes and an Analysis of Thermal Hyster-esis Protein Hydration Using the Random NetworkModel, University of Pennsylvania, Philadelphia, 2002.
w37x B. Madan, K.A. Sharp, Heat capacity changes accom-panying hydrophobic and ionic solvation: a Monte-Carlo and random network model study, J. Phys. Chem.104 (2000) 12047–12047.
w38x Origin6.0, Microcal Software, Inc. Northampton, MA,1999.
w39x W. Press, B. Flannery, S. Teukolsky, W. Vetterling,Numerical Recipes in C: The Art of Scientific Comput-ing, Cambridge University Press, New York, 1985.
w40x H.M. Berman, J. Westbrook, Z. Feng, et al., The proteindata bank, Nucleic Acids Res. 28(2000) 235–242.
w41x B. Madan, K.A. Sharp, Molecular origin of hydrationheat capacity changes of hydrophobic solutes: pertur-bation of water structure around alkanes, J. Phys. Chem.101 (1997) 11237–11242.
w42x A.A. Antson, D.J. Smith, D.I. Roper, et al., Understand-ing the mechanism of ice binding by type III antifreezeproteins, J. Mol. Biol. 305(2001) 875–889.
w43x C.I. DeLuca, P.L. Davies, Q. Ye, Z. Jia, The effects ofsteric mutations on the structure of type III antifreezeprotein and its interaction with ice, J. Mol. Biol. 275(1998) 515.
w44x M.M. Harding, L.G. Ward, A.D.J. Haymet, Type Iantifreeze proteins: structure-activity studies and mech-anism of ice growth inhibition, Eur. J. Biochem. 264(1999) 653–665.