chapter 3 hydration dynamics at fluorinated protein...
TRANSCRIPT

CHAPTER 3
Hydration Dynamics at Fluorinated Protein Surfaces
This chapter first appeared as an article in Proceedings of the National Academy of
Sciences, USA: Oh-Hoon Kwon, Tae Hyeon Yoo, Christina M. Othon, James A. Van
Deventer, David A. Tirrell, and Ahmed H. Zewail. Proc. Natl. Acad. Sci. USA 2010, 107,
(40) 17101-17106.

156
Abstract
Water-protein interactions dictate many processes crucial to protein function
including folding, dynamics, interactions with other biomolecules, and enzymatic catalysis.
Here we examine the effect of surface fluorination on water-protein interactions.
Modification of designed coiled-coil proteins by incorporation of 5,5,5-trifluoroleucine or
(4S)-2-amino-4-methylhexanoic acid enables systematic examination of the effects of side-
chain volume and fluorination on solvation dynamics. Using ultrafast fluorescence
spectroscopy, we find that fluorinated side chains exert electrostatic drag on neighboring
water molecules, slowing water motion at the protein surface.
Introduction
The past decade has witnessed substantial expansion in the number and diversity of
noncanonical amino acids that can be incorporated into recombinant proteins expressed
in bacterial cells (1-3). Fluorinated amino acids have drawn special attention (4-16)
because of the unusual solubility properties of fluorinated hydrocarbons. Several
independent studies have shown that fluorination of coiled-coil and helix-bundle proteins
leads to enhanced stability with respect to thermal or chemical denaturation (6-12), an
effect attributed to the hyperhydrophobic and fluorophilic character of fluorinated amino
acid side chains.
Although both classes of compounds are hydrophobic, hydrocarbons and
fluorocarbons differ in important ways (17-22). The high electronegativity of fluorine
renders the C-F bond both strongly polar and weakly polarizable (17, 21, 22). The dipole
associated with the C-F bond exerts strong inductive effects on neighboring bonds (23)

157 and can form reasonably strong electrostatic interactions with ionic or polar groups when
the two moieties are appropriately positioned. The hydrophobic character of fluorinated
compounds has been described as “polar hydrophobicity (17),” and is believed to play
important roles in organic and medicinal chemistry. Furthermore, the C-F bond is
significantly longer than the C-H bond, and the calculated volume of the trifluoromethyl
group is about twice that of a methyl group (20). The studies described here constitute an
attempt to understand more fully the interaction of water with fluorinated molecular
surfaces, and to provide a sound basis for the use of fluorinated amino acids in the
engineering of proteins with unique and useful physical properties.
The hydration layer adjacent to protein surfaces exhibits properties different from
those of bulk water; the more rigid and denser structure of the hydration layer plays a
crucial role in protein structure, folding, dynamics, and function (24-26). Elucidation of
the dynamic features of this region, on the timescales of atomic and molecular motion, is
essential in understanding protein hydration. In the past decade, the knowledge of
hydration on protein surfaces has been extensively expanded by studying the dynamic
properties of biological water for various proteins containing tryptophan (Trp) or
synthetic fluorescent amino acids as local probes; the results have revealed
multicomponent relaxation dynamics spanning a wide range of timescales (25, 27-29).
The nature of the protein hydration layer can be affected not only by the topographic and
electrostatic properties of the protein surface (24), but also by the physical and chemical
properties of individual surface-exposed residues (27, 30). In view of the unique
properties of the C-F bond and of fluorocarbon–water interfaces (23, 31), we anticipated
that fluorinated amino acid side chains might exhibit unusual hydration behavior. Here

158 we report studies of local hydration dynamics at fluorinated protein surfaces by
monitoring the time-dependent fluorescence Stokes shifts of surface-exposed Trp
residues in coiled-coil proteins with 5,5,5-trifluoroleucine (Tfl, 1; scheme 3.1) residues
adjacent to the probe. The results are compared to the hydration dynamics at
hydrogenated protein surfaces with Leu (2) or (4S)-2-amino-4-methylhexanoic acid
(homoisoleucine, Hil, 3) adjacent to the Trp probe. Hil has approximately the same
volume as Tfl (20, 21), and although the shapes of the residues differ, the nearly identical
side-chain volumes of Tfl and Hil allow us to differentiate changes due to fluorination
from those that result from the increase in side-chain volume that accompanies
replacement of Leu (scheme 3.1).
Results
Coiled-coil protein system. The coiled-coil protein A1 (figure 3.1 A and B) was used as a
model system to examine the effects of fluorinated amino acids on local hydration
dynamics. The primary structure of A1 contains six copies of a heptad repeat (abcdefg)n,
where positions a and d are occupied by hydrophobic amino acids. Self-association of the
peptide juxtaposes the a and d positions and results in the formation of a hydrophobic core.
Fluorinated Leu analogues have previously been incorporated into the d positions of A1;
the resulting proteins exhibited improved resistance to thermal and chemical denaturation
with minimal differences in secondary structure (9, 11, 12). In this work, the surface-
exposed Asp residue at the f position of the third heptad (position 34) was replaced by Trp,
which serves as a fluorescence probe (figure 3.1C). The Trp variant of A1 was designated
A1m. In order to examine the effects of fluorinated analogues on the local hydration

159 dynamics, a Leu codon was introduced at one of two positions within A1m. Mutation of a
serine residue at the c position of the third heptad (position 31) yielded a variant of A1
designated S31L (figure 3.1D), while replacement of an alanine residue at position b of the
fourth heptad (position 37) gave the A1 variant A37L (figure 3.1E). Each protein was
expressed in Tfl, Leu, and Hil form, yielding a total of nine different proteins that were
examined in detail (see (32) for nomenclature).
Characterization of global structure. Analysis of each protein showed that the overall
structural properties of the molecules were generally insensitive to genetic mutations and
incorporation of noncanonical amino acids. Circular dichroism spectroscopy indicated
that all nine proteins were helical, as determined from the molar ellipticity at 222
nanometers (figure 3.2) (33); an analysis with K2D2 software showed that the helicities
of individual proteins range between approximately 40% and 48% (34). These results are
consistent with the design of the A1 protein (35), in which approximately half of the
amino acids are located within the heptad repeats expected to form α-helical secondary
structure. The oligomerization states of the protein samples were determined by
sedimentation velocity analysis (figure 3.3). Although A1 forms dimers and tetramers at
neutral pH (11), the variants examined in this study form trimers or hexamers under
mildly acidic conditions (pH 4). We suggest that protonation of Glu side chains at the e
and g positions (figure 3.1A) of the proteins decreases the density of negative charges
adjacent to the hydrophobic core and promotes formation of larger helical aggregates at
pH 4. A1m, in which the single Trp residue occupies a surface-exposed position, is
predominantly trimeric in Leu-, Tfl-, and Hil-forms, with a small fraction of hexamers

160 (see figure 3.3). The majority of the S31L samples are present as hexamers, while the
A37L samples appear to contain mixtures of trimers and hexamers.
Characterization of local structure. The steady-state fluorescence emission spectrum of
Trp depends on the extent of exposure of the Trp side chain to water (36). All nine
protein samples showed emission maxima between 349 and 352 nm, close to that of free
Trp at 353 nm (table 3.1 and figure 3.4). These observations indicate that the Trp residues
are exposed to the aqueous environment (consistent with the original design), and not
involved in oligomerization of the proteins. In addition, the steady-state UV-visible
absorption and steady-state fluorescence emission spectra of each mutant containing Leu
were nearly identical to the spectra of the corresponding mutant when it contained Tfl or
Hil (figure 3.4), further confirming that perturbation of the protein structure upon
replacement of Leu by Tfl or Hil was minimal.
The mobility of the probe residue was explored in each protein by measuring fs-
resolved depolarization dynamics (figure 3.5). The anisotropic dynamics were found to
consist of three components: ultrafast (≤ 500 fs), intermediate (20–80 ps), and slow (≥2
ns) decays. The ultrafast decays are attributed to fast internal conversion between the first
two excited singlet states (1La and 1Lb) of Trp, the intermediate decays to local wobbling
motions of Trp, and the slow decays to tumbling motions of the proteins (28, 37). Similar
values for the wobbling motions (φTrp) and their cone semiangles (θ) were observed for
each series of S31L and A37L proteins (table 3.1); see material and methods for details.
Both mutation of residues around Trp and fluorination of the protein hydrophobic
core can affect the environment of the probe and change the protein structure and/or the

161 dynamic properties of the hydration layer. In many cases these properties are related to
one another. The minimal change in the steady-state fluorescence spectrum caused by
replacement of Leu by Tfl or Hil suggests similar features of the hydration region probed
by Trp (e.g., the effective number of water molecules in the hydration shell). In addition,
the similarity of the Trp wobbling angle of the Leu-, Tfl-, and Hil-forms of the proteins
suggests similar organization and flexibility of neighboring residues around the probe
(28). All these features make it possible to compare the dynamic properties of protein
hydration for most of the proteins in the A1m, S31L, and A37L proteins containing Leu,
Tfl, and Hil. For A1m-H, we note that the wobbling angle of Trp was found to be 33°,
which is significantly higher than the 17°–21° wobbling angles determined for all of the
other proteins. This result indicates that the organization of local residues or the
flexibility of the local Trp environment in A1m-H differs from that in the other proteins,
despite the lack of global structural changes observed by circular dichroism or
sedimentation velocity measurements. The abnormal behavior of the A1m-H variant is
also observed in the fluorescence lifetime measurements. Every protein except A1m-H
displayed a short-lifetime component of a few hundred picoseconds, present at all
wavelengths. These types of quenching processes have been attributed to Trp interactions
with nearby charged residues (38-40), and the absence of such a feature in A1m-H again
indicates that this protein has a local structure different from those of the other eight
proteins. The perturbation of local structure and, thus, local solvent exposure can result in
different hydration dynamics, making it unreliable to compare the dynamics of A1m-H to
those of the other A1m proteins. Accordingly, the dynamics obtained for A1m-H were
not used in the analysis that follows. Small shifts in the fluorescence emission maximum

162 and Trp wobbling angle were observed for A37L-L as compared to A37L-T and A37L-H
(see table 3.1 and figure 3.4). These differences may be significant enough to alter the
local environment surrounding the Trp probe, potentially complicating assignment of
changes observed in the hydration dynamics to a particular effect (e.g., changes in an
amino acid close to Trp). Despite these concerns, the dynamics results for A37L-L
remain consistent with the conclusions of the paper (see below).
Our stringent standards for comparison of hydration dynamics between modified
proteins require that there be (i) no global change in protein structure as measured by
circular dichroism spectroscopy and sedimentation velocity measurements; (ii) no change
in solvent exposure as measured by steady-state fluorescence maximum (± 1 nm); and
(iii) no change in local protein structure or flexibility as measured by fluorescence
anisotropy (± 1°). Seven of the nine proteins prepared in this study met all of these
criteria, and an additional protein, A37L-L, displayed changes just outside the margin of
error. Only one protein, A1m-H, showed changes significant enough to require us to
disregard the hydration measurements observed. Given the subtle effects of the chemical
environment on hydration dynamics, we will compare hydration results only within
protein families. Thus, our strongest conclusions will be drawn from observations made
on the S31L protein variants, and the data for A1m and A37L will be used as
corroborating evidence.
Ultrafast hydration dynamics. To investigate hydration dynamics at the protein
surfaces, we utilized a methodology developed by Zhong and coworkers for the
reconstruction of femtosecond-resolved fluorescence spectra (28, 41). As an example,

163 figure 3.6A shows several representative femtosecond-resolved fluorescence transients
recorded for A1m-T. The overall decay dynamics is retarded compared to that of free Trp
in buffer solution. Details of the results for all the protein samples are presented in table
3.1. The hydration dynamics of the proteins were well represented by triple-exponential
decays with distinctive timescales of 0.2–0.8, 1.4–6.1, and 10–61 picoseconds.
Relaxation occurring on a time scale of a few hundred femtoseconds to several
picoseconds is attributed to fast librational/rotational motions of bulk-type and local
water molecules around Trp. Observation of the fs component suggests that the Trp probe
in the test proteins is neither crowded by neighboring residues nor protected from
exposure to water (27, 28, 42). The slowest phase of hydration dynamics (on the
timescale of tens of picoseconds) is collective water network rearrangement coupled to
protein fluctuation dynamics (27, 42-44).
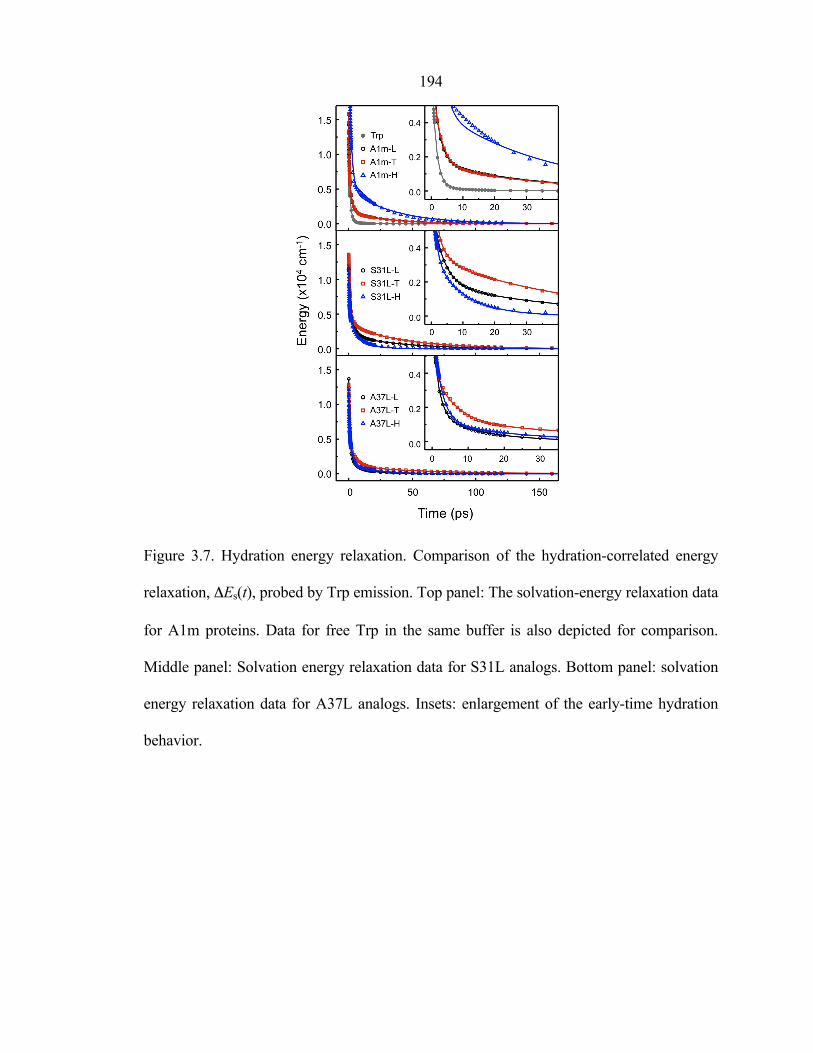
Several key features of the results (figure 3.7 and table 3.1) are summarized as
follows. First, S31L-T and A37L-T, in which Tfl lies close to Trp as well as in the
hydrophobic core, showed slower hydration dynamics than their Hil and Leu
counterparts, indicating that the fluorinated surface of the protein slows down the
hydration dynamics. For S31L-T, the timescales of local and collective water motions (τ2
and τ3, respectively) are increased by 2–5 times (3.0 and 48 ps) from those of S31L-H
(1.4 and 10 ps). The overall solvation of S31L-T is slower than that of S31L-L as well.
However, this difference is manifested as an increase in the contribution of the τ3
component to the overall solvation of Trp. The 70% increase of the relaxation energy
(333 cm−1) of the slowest component (E3) compared to that of the nonfluorinated S31L-L
(194 cm−1) is an indication of the dramatic slowing of hydration dynamics near the

164 fluorinated surface. For A37L-T, τ2 and τ3 are also retarded to a greater extent (3–5 times
slower) than those for A37L-H. These results suggest that replacement of Leu by Tfl
increases the residence time of water molecules near the Trp probe and/or the number of
water molecules influenced by the amino acid side chain.
Second, S31L-H and A37L-H showed similar or even faster hydration than their
Leu counterparts. This result indicates that in the comparison between hydrocarbon
residues, increasing the hydrophobic surface area results in faster motion of water
molecules around the residue. It should be noted that, for the S31L series, hydration is
greatly accelerated when Leu is replaced with Hil. This pronounced hydrophobic effect
(due to the increase in the size of the residue) on the hydration is counteracted by
fluorination of leucine, resulting in slowing dynamics for S31L-T. On the other hand, for
A37L, increasing the size of the hydrophobic surface does not appear to affect the
hydration dynamics as greatly. Therefore, the retardation of the dynamics upon
fluorination is much more pronounced for A37L-T than for the corresponding
fluorination of S31L. Finally, A1m-L and A1m-T, which differ from one another only in
the nature of their hydrophobic cores, exhibited almost identical hydration dynamics.
Fluorination of the hydrophobic core of a helix-bundle protein can affect protein
dynamics (45). However, the nearly identical hydration dynamics for A1m-L and A1m-T
spanning a few hundred picoseconds indicates that modification of the hydrophobic core
of A1m does not affect protein motions that are coupled to local hydration dynamics at
the surface of the protein on the timescales examined here (46).

165
Discussion
Protein surfaces are heterogeneous, consisting of polar, hydrophilic, and
hydrophobic residues, and it is intriguing to consider how the heterogeneous surface
chemistry affects the behavior of water molecules in the protein hydration layer. Head-
Gordon and coworkers have reported heterogeneous water dynamics in the first hydration
shell of model peptides (N-acetyl-leucinemethylamide and N-acetyl-glycinemethylamide),
with faster water motions near the hydrophobic side chains than near the hydrophilic
backbone (47, 48). Similar results have been reported for molecular dynamics simulation
studies of a folded β-hairpin peptide (30). In addition, Qiu et al. showed that mutation of
charged or polar residues of the enzyme staphylococcal nuclease into more hydrophobic
residues (Ala), resulted in faster hydration dynamics; this result was attributed to the lack of
strong interaction between the charges (or dipoles) of the mutated protein and the
surrounding water (27). This observation can be understood in that the elimination of
specific interactions between hydrophobic residues and water molecules causes a lower
number of hydrogen bonds between water and a hydrophobic surface compared to those
near a hydrophilic surface, thus allowing water molecules to reorient more freely.
Computational studies have suggested that water layers adjacent to extended hydrophobic
surfaces of low curvature are of lower density than those around hydrophilic and small
hydrophobic molecules, and are dynamic rather than static (49-56). X-ray reflectivity
experiments indicate submonolayer water depletion at hydrocarbon and fluorocarbon
surfaces (57). Our observation of accelerated hydration dynamics around larger Hil
residues as compared to the smaller Leu is consistent with these experimental and
computational results, supporting the idea that water molecules neighboring hydrophobic

166 side chains in the hydration layer of proteins are more dynamic than those around polar or
hydrophilic residues.
Even though a simple comparison suggests that Tfl should be more hydrophobic
than Leu by virtue of its larger surface area, introduction of a Tfl residue adjacent to the
Trp probe caused retardation of the local hydration dynamics, in contrast to the results
obtained when Leu was replaced with Hil (figure 3.7). These results suggest that hydration
dynamics around fluorinated amino acid side chains cannot be explained exclusively by the
increase in residue size. The C-F bond is assumed not to be involved in hydrogen bonding
with liquid water, largely because of its low polarizability (17). However, replacement of
Leu by Tfl introduces a strong dipole at the fluorinated protein surface. Lee and coworkers
have shown that introduction of CF3 groups reduces the contact angle of water on self-
assembled alkanethiol monolayers (23), an effect that they attribute to dipolar interactions.
Our results suggest that such dipolar interactions can also slow water motions at fluorinated
molecular surfaces.
Fluorinated compounds are more hydrophobic than hydrogenated compounds of
equal carbon number (4, 5, 17-21), and the increase in hydrophobic character of
fluorocarbons has been ascribed to their increased molecular size (18, 58). This
interpretation appears to be consistent with the observation that the melting temperature of
A1-Tfl is 13 °C higher than that of A1-Leu (11), while Tm for A1-Hil is increased by 17 °C
in comparison to A1-Leu. However, the results reported here clearly indicate that the
chemical nature of the protein surface dictates the dynamics of solvent-protein interactions,
and that size effects alone cannot explain the altered solvation dynamics observed at
fluorinated protein surfaces.

167
Conclusions
The results reported here show that fluorinated amino acids influence hydration
dynamics at protein surfaces in a manner quite different from their hydrogenated
counterparts. In general, water-protein interactions dictate many processes crucial to
protein function including folding, dynamic motions, interactions with other biomolecules,
and enzymatic catalysis (26). The slower timescales of hydration dynamics observed near
fluorinated residues in proteins suggest that some of the water-mediated processes
processes listed above may be changed upon fluorination. Tailoring the dynamics of
protein-water interactions by the introduction of fluorinated residues may yield proteins
with functional properties, such as binding, molecular recognition, or catalytic activities,
that cannot be achieved with the canonical amino acids. Understanding hydration dynamics
at fluorinated molecular surfaces is a critical step toward exploiting the properties of
fluorine in biological systems.
Materials and Methods
Summary of protein expression and characterization. A1 variants A1m, S31L, and
A37L were expressed in 2×YT medium (which contains Leu) to yield proteins A1m-L,
S31L-L, and A37L-L, respectively, in Leu-free M9 minimal medium (12.8 g/L
Na2HPO4·7H2O, 3 g/L KH2PO4, 0.5 g/L NaCl, 1 g/L NH4Cl) supplemented with 19
canonical amino acids plus Tfl to give A1m-T, S31L-T, and A37L-T, and in Leu-free M9
medium supplemented with 19 canonical amino acids plus Hil to give A1m-H, S31L-H,
and A37L-H. The proteins were purified under denaturing conditions and dialyzed against
10 mM acetate (pH 4)/100 mM NaCl. The extent of replacement of Leu by Tfl in A1m-T,

168 S31L-T, and A37L-T, was determined by amino acid analysis to be 90%–91%. Leu
replacement by Hil in A1m-H, S31L-H, and A37L-H was analyzed by liquid
chromatography tandem mass spectrometry and determined to be at least 90% (figure 3.8).
See below for further details of expression, purification, and incorporation analysis.
Summary of steady-state measurements. Circular dichroism spectra were recorded on an
Aviv 62DS spectropolarimeter (Lakewood, NJ). Absorption spectra were collected using a
Cary 500 UV-Vis spectrophotometer and a 0.05 mm path length cuvette. Steady-state
fluorescence emission spectra were measured using a FluoroMax-2 fluorimeter (ISA-
Spex).
Summary of time-resolved fluorescence measurements. The experimental apparatus for
time-resolved measurements are detailed below. All fluorescence spectra and transients
were obtained by the excitation of samples (~550 µM) at 295 nanometers. The lifetime
components were obtained by global analysis of fluorescence transients collected using a
time-correlated single photon counting spectrometer. All transients show additional
multiple-exponential decay (at the blue side) and rise (at the red side) with time constants
spanning from a few hundred femtoseconds to several tens of picoseconds. In order to
extract hydration dynamics precisely, we reconstructed apparent and lifetime-associated
time-resolved fluorescence spectra with eight or nine transients at different wavelengths
covering the blue and the red sides (figure 3.6B). By fitting these spectra to lognormal
functions, we traced the time-dependent apparent emission maxima (νs) and lifetime-
associated emission maxima (νl) as plotted in figure 3.6C. Using Δν(t) = νs(t) − νl(t), we

169 correlated the extracted time-dependent spectral shift, Δν(t), to the hydration energy
relaxation, ΔEs (figure 3.7).
Materials. All restriction enzymes were purchased from New England Biolabs (Beverly,
MA). D,L-5,5,5-trifluoroleucine (Tfl) was purchased from Oakwood Products (West
Columbia, SC). DNA oligomers were synthesized at Qiagen (Valencia, CA) or Integrated
DNA Technologies (Coralville, IA). (4S)-2-amino-4-methylhexanoic acid
(homoisoleucine, Hil) was prepared according to the methods of O’Donnell and Eckrich
(59) and Dorizon and coworkers (60).
Plasmid construction. An EcoRI/HindIII fragment of pQEA1 (11) containing the A1
coding sequence was ligated into EcoRI/HindIII-digested pQE-80L (Qiagen) to yield pQE-
80L/A1. The Asp residue at position 34 of A1 was mutated to Trp by site-directed
mutagenesis. The resulting plasmid was designated pQE-80L/A1m. A Leu codon was
introduced into either position 31 or position 37, yielding pQE-80L/S31L and pQE-
80L/A37L, respectively. Plasmid pA1EL (12), which encodes both the protein A1 and a
constitutively expressed leucyl-tRNA synthetase (LeuRS), was mutated using similar site-
directed mutagenesis techniques. A Trp codon was introduced first at position 34 of A1,
yielding pA1mEL. Introduction of leucine codons into either position 31 or position 37
resulted in the plasmids pS31LEL and pA37LEL, respectively.
Expression of fluorinated proteins. M9 medium supplemented with 0.4% glucose,
3.5 mg⁄L thiamine, 1 mM MgSO4, 0.1 mM CaCl2, 20 amino acids (40 mg⁄L), and 200 mg⁄L

170 ampicillin was inoculated 1:50 with an overnight culture (M9) of Escherichia coli strain
DH10B transformed with pQE-80L/A1m, pQE-80L/ S31L, or pQE-80L/A37L and grown
at 37 °C with shaking. After each culture reached OD600 = 0.9–1.0, the cells were harvested
by centrifugation (6000 × g, 4 °C, 6 min) and washed twice with cold 0.9% NaCl. The cell
pellets were resuspended in M9 medium containing 19 amino acids (no Leu) and 1 mM
Tfl. Protein expression was induced 10 min after the medium shift by addition of IPTG to a
final concentration of 1 mM. After 3 h, the cells were harvested by centrifugation (6000 ×
g, 4 °C, 10 min), and the cells were stored at −20 °C at least 12 h before purification. In the
case of the protein S31L-T, one sample was made using the procedure for the production of
proteins containing Hil described below.
Expression of proteins containing homoisoleucine. M9 medium supplemented with
0.4% glucose, 35 mg⁄L thiamine, 1 mM MgSO4, 0.1 mM CaCl2, 20 amino acids (40 mg⁄L),
200 mg⁄L ampicillin, and 35 mg⁄L kanamycin was inoculated 1:50 with an overnight
culture (M9) of E. coli strain LAM1000 transformed with pREP4 and pA1mEL, pS31LEL,
or pA37LEL at 37 °C with shaking. After each culture reached OD600 = 0.9–1.1, the cells
were harvested by centrifugation (5000 × g, 4 °C, 15 min) and washed three times with
cold 0.9% NaCl. The cell pellets were resuspended in M9 medium containing 19 amino
acids (no Leu) and 0.5 mM Hil. Protein expression was induced 15 min after the medium
shift by the addition of IPTG to a final concentration of 1 mM. Cells were harvested by
centrifugation (5000 × g, 4 °C, 15 min), resuspended in Qiagen buffer B (8M urea,
100 mM NaH2PO4, 10 mM TrisCl, pH 8.0) and sonicated for 10 min total process time

171 with a pulse duration of 5 s and a wait duration of 5 s. The sonicated lysates were frozen at
−80 °C for at least 12 h before proceeding with purification.
Expression of hydrogenated proteins. Rich (2×YT) medium was used instead of
supplemented M9 medium. When the culture reached OD600 = 0.9–1.0, IPTG was added to
a final concentration of 1 mM. After 3 h, the cells were harvested by centrifugation (6000 ×
g, 4 °C, 10 min), and the cells were stored at −20 °C at least 12 h before purification. In the
case of S31L-L, one sample was expressed using the cell strain LAM1000 containing
pREP4 and pS31LEL and harvested using the procedure used for the production of proteins
containing Hil.
Protein purification. N-terminally histidine-tagged A1 variants were purified under
denaturing conditions by affinity chromatography using Ni-NTA resin (Qiagen,
Chatsworth, CA) according to the manufacturer’s instructions. For proteins containing Hil
and for one batch each of S31L-L and S31L-T, the lysates in Qiagen buffer B were thawed,
sonicated, and then clarified using centrifugation (~75,000 × g, 25 °C, 10 min). Imidazole
was added to Qiagen buffer C (50 mM) and Qiagen buffer E (250 mM) in order to improve
purification efficiency. The purified protein solutions were dialyzed against 10 mM sodium
acetate (pH 4)⁄100 mM NaCl, and were concentrated by ultrafiltration (Amicon Ultra-15
devices, mwco: 10,000 or 3000, Millipore, Billerica, MA). The protein concentration was
determined as measured by the absorbance at 280 nanometers of solutions, assuming
extinction coefficients of 5500 M−1 cm−1 (61).

172 Amino acid analysis and sedimentation velocity analysis. Amino acid analysis of
fluorinated proteins was performed at the W. M. Keck Facility at Yale University (New
Haven, CT) on a Hitachi L-8900 amino acid analyzer (San Jose, CA) after hydrolysis at
115 °C in 70% formic acid. Sedimentation velocity analysis was performed at the National
Analytical Ultracentrifugation Facility at the University of Connecticut (Storrs, CT) by
using a Beckman XL-I Analytical Ultracentrifuge at 20 °C. The rotor was accelerated to
55,000 rpm, and interference scans were acquired at 1 min intervals for 7 h. The data were
analyzed by using the program Sedfit (62) to obtain normalized c(s) versus sedimentation
coefficient plots (figure 3.3).
Mass spectrometry. Liquid chromatography tandem mass spectrometry (LC/MS/MS) of
proteins containing Hil or Tfl was performed at the Caltech Protein and Peptide Mass
Analytical Laboratory. Trypsinized samples were subjected to liquid chromatography on an
Eksigent (Dublin, CA) NanoLC-2D using a 6 cm long, 100 µm diameter C18 column,
followed by MS/MS on an Applied Biosystems (Foster City, CA) QStar XL instrument.
Data were analyzed using Analyst QS software provided by Applied Biosystems. Hil or Tfl
incorporation levels were estimated using information contained within extracting ion
currents (XIC) of trypsin-digested protein samples. For a given sample, a peak
corresponding to a peptide globally substituted with the noncanonical amino acid and
coding for multiple leucines was identified, and the related peak corresponding to
replacement at a fraction of the leucine positions was also identified. Determination of the
ratio of the partially substituted to globally substituted peak areas allowed for the
estimation of amino acid incorporation levels assuming that leucines in the fragment were

173 replaced statistically. An example calculation is shown in the subsection “LC/MS/MS
amino acid incorporation estimates,” which can be found below.
Time-correlated single-photon counting (TCSPC). The protein samples were prepared at
55 µM concentration in 10 mM acetate (pH 4)⁄100 mM NaCl solution. The TCSPC
measurements were performed by using femtosecond pulses (<100 fs) from a Ti-sapphire
oscillator (Spectra-Physics, Mai Tai HP). Laser output, of which the repetition rate was
attenuated from 80 to 8 MHz utilizing a pulse picker (Spectra-Physics, Model 3980-5), was
tuned to 885 nanometers and frequency-tripled to 295 nanometers using a time-plate tripler
(Minioptic Technology, TP-2000B) for selective excitation of Trp. The UV beam,
vertically polarized using a half waveplate, was introduced to a sample chamber and
focused onto the sample cell. The residual frequency-doubled beam from the tripler was
directed to a photodiode to trigger a TCSPC system (PicoQuant GmbH, FluoTime 200).
Typically, the energy of the excitation pulse (attenuated) at the sample was ~10 picojoules.
In a right-angle geometry, the emitted fluorescence was collected at a magic angle (54.7°)
with respect to the vertically polarized excitation beam and focused into a MCP-PMT
(Hamamatsu, R3809U), which is attached to a double monochromator. The photomultiplier
tube signal was routed to a time-to-amplitude converter as a start signal followed by a
constant fractional discriminator (PicoQuant GmbH, SPC 630). To avoid possible
photobleaching and photodegradation, samples were kept stirring using a micro magnetic
stirrer. In this configuration, the instrument response has a full width at half maximum of
~30 ps. Multiexponential decays convoluted with instrumental response functions were
analyzed using the FluoFit software package (PicoQuant).

174 Femtosecond fluorescence upconversion. The protein samples were prepared at 550 µM
concentration in 10 mM acetate (pH 4)⁄100 mM NaCl solution. An amplified Ti-sapphire
laser system (Spectra-Physics, Hurricane X) was used, which produces ~110 fs pulses
centered at 805 nanometers (fundamental), with a 1 kHz repetition rate and a 0.8 millijoule
energy. The output beam was split into equal parts to generate the pump and the gate pulse
trains. For the pump, the fundamental light was used to pump an optical parametric
amplifier (Spectra-Physics, OPA-800C), the infrared idler output of which was sum-
frequency mixed with the residual fundamental in a 0.5 mm thick β-barium borate (BBO)
crystal (type I), recompressed with a prism pair, and frequency-doubled to provide the 295-
nanometers pulses in a 1.0 mm thick BBO crystal. The pump pulses were focused, with a
24 cm focal length lens, on the rotating circular cell (1 mm thickness) containing the
sample. Typically, the energy of the pump pulse (attenuated) at the sample was ~200 nJ. At
these energies, the fluorescence signals from samples were linearly dependent on the pump
energy. To check for sample degradation during experiments, fluorescence spectra were
periodically measured right after the rotating cell by using a fiber-optic-coupled
spectrometer (Acton Research, SpectraPro-300i) coupled to a charge-coupled device
(Princeton Instruments, SpectruMM-256HB) before and after the collection of averaged
transients for each sample. No difference between the spectra was observed.
The forward-scattered fluorescence from excited samples was collected and
focused by two off-axis parabolic mirrors into a 0.5 mm thick BBO crystal. Cutoff filters
were placed between the mirrors to reject scattered laser light and pass the desired
fluorescence wavelengths. The gate pulses, attenuated to 23 µJ⁄pulse, passed through a
computer-controlled optical delay line and were noncollinearly overlapped with the

175 fluorescence in the BBO crystal. After the crystal, the upconverted signal was separated
from the gate beam and the fluorescence by using an iris, and was focused on the entrance
slit of a 0.25 m double-grating monochromator (Jobin Yvon, DH10) equipped with a
photomultiplier tube at the exit slit. Upconversion efficiency was maximized by angle-
tuning of the BBO crystal. The upconverted fluorescence transients were taken at the magic
angle (54.7°) of the pump polarization relative to the gate polarization, parallel to the
acceptance axis of the upconversion crystal, in order to eliminate the influence of induced
sample anisotropy on the signal. The photomultiplier output was amplified (Stanford
Research Systems (SRS), SR445) and processed by a gated integrator (SRS, SR250). The
temporal response of the instrument was typically 350–450 fs. The observed fluorescence
transients were fit to theoretical functions, using a Scientist nonlinear least-squares fitting
program (Micromath), for the convolution of the Gaussian instrument response function
with a sum of exponentials. All experiments were carried out at an ambient temperature of
~24 °C, and all fluorescence transients were obtained by the excitation of samples at
295 nanometers.
For fluorescence anisotropy measurements, the pump-beam polarization was
rotated either parallel or perpendicular to the acceptance axis of the upconversion crystal to
collect the parallel (I||) and perpendicular (I⊥) signals, respectively. These transients were
used to construct time-resolved anisotropy: r(t) = (I|| – I⊥)/(I|| + 2I⊥). The results of the time-
resolved anisotropy are shown in figure 3.5. The ultrafast depolarization time constant, φI,
attributed to fast internal conversion between the first two excited singlet states (1La and
1Lb) of Trp, varies dramatically with the time resolution. This process has a timescale of
~100 fs (63, 64). The limited resolution of our current apparatus (350–450 fs) does not

176 allow us to fully resolve these dynamics and gives rise to a large uncertainty in the value of
φI. The variability of φI will impact the fit of φTrp. The uncertainty in the amplitude of the
anisotropy, rTrp and r∞, is not however affected by the limited time resolution of our data.
Therefore we use the wobbling cone angle to reveal details about the local crowding near
Trp. The wobbling cone angle is given by 1 – rTrp /(rTrp + r∞) = [(3cos2q – 1)/2]2 (37), and
only depends upon the amplitude of the tryptophan wobbling motion and the anisotropy
due to the rotation of the molecule.
LC/MS/MS amino acid incorporation estimates. LC/MS/MS was used to estimate the
replacement levels of leucine in some protein samples. Figure 3.8 depicts the total ion
currents (TIC, figure 3.8A) and three extracted ion currents (XICs, figure 3.8B–D) from a
digested A1m-H sample. The large peak in figure 3.8B corresponds to a peptide in which
all of the Leu residues are replaced by Hil, the smaller peak in figure 3.8C corresponds to a
mixture of two peptides containing one Leu and one Hil residue, and the very small peak in
figure 3.8D corresponds to a peptide containing only Leu residues. The areas in the three
XICs allow determination of the extent of incorporation of noncanonical amino acids in
place of leucine. Assuming that there is a probability p of homoisoleucine substitution in
place of leucine, the distribution of peak areas should correspond to the binomial
distribution,
€
A (1− p)2 + 2(1− p)p + p2[ ], (3.1)

177 where A is a multiplication factor equal to the total area of the three peaks and the three
terms of the polynomial correspond to nonsubstituted, singly substituted, and doubly
substituted peptides, respectively (the term for singly substituted peaks takes into account
both positional isomers of singly substituted peptides). Because these three terms represent
the only combinations of substitutions possible in the peptide, the relationship
(3.2)
also holds. The ratio between two peaks in a peptide series depends only on the probability
of incorporation and not on the value of A. Therefore, the ratio of two peaks from
experimental data can be used in order to get an estimate of p. The ratio of the peak areas of
singly substituted to doubly substituted peptides is
. (3.3)
Rearranging the above expression,
, (3.4)
where X is the experimentally observable ratio of singly substituted to doubly substituted
peptides. Solving for p gives

178 , (3.5)
or
, (3.6)
with the root of interest being the nonzero root. Substituting for the ratio of peak areas
gives an estimate of the incorporation level p.
In some cases, peaks corresponding to peptides containing three leucine or leucine
analogs were observed and used to quantify incorporation levels. In these cases, the peak
area distribution is represented by
, (3.7)
with
. (3.8).
Defining the ratio of doubly substituted to triply substituted peak area as X, substituting X
into equation (3.8), and solving for p yields the nonzero root
, (3.9)

179 again enabling an estimation of the incorporation level of noncanonical amino acids in
place of leucine. In some cases, the tandem mass spectrometry did not enable positive
identification of all possible positional isomers of a peptide. For example, in some cases,
only two out of three of the possible doubly substituted positional isomers containing three
possible substitution locations were identified in the tandem mass spectrometry data. In
these cases, X was multiplied by an appropriate factor to account for peptides that were not
observed (again invoking the assumption of completely random incorporation). Using the
above example, when only two out of three doubly substituted peptides could be identified,
X was multiplied by a factor of 1.5 in order to estimate what the peak area ratio would have
been with all three peaks present in equal weights. Using this methodology, the
homoisoleucine-containing proteins used were found to have 90% or greater Hil in place of
Leu, and the sample of S31L-T that was analyzed in this fashion contained approximately
99% Tfl in place of Leu. These results were obtained by examining three separate series of
peptides from each protein sample. These peptides had the following sequences:
AEIGDLNNTSGIR, GSHHHHHHGSMASGDLENEVAQLER, and SLEWEAAELEQK
(A1m), LLEWEAAELEQK (S31L), or SLEWEALELEQK (A37L).
Acknowledgements
We thank Professor Thomas Miller for helpful discussion, J. D. Fisk for synthesis
of homoisoleucine, and the referees for their thoughtful comments on the original
manuscript. This work is supported by National Institutes of Health (NIH) Grant
GM62523, National Science Foundation (NSF) Grant DMR-0964886, Office of Naval

180 Research (ONR) Grant N00014-03-1-0793, a Samsung Scholarship (to T. H. Y.), and a
National Defense Science and Engineering Graduate Fellowship (to J. A. V.).
References
1. Budisa N (2006) Engineering the Genetic Code: Expanding the Amino Acid
Repertoire for the Design of Novel Proteins (Wiley-VCH, Weinheim, Germany).
2. Link AJ, Mock ML, & Tirrell DA (2003) Non-canonical amino acids in protein
engineering. Curr. Opin. Biotechnol. 14, 603-609.
3. Xie JM & Schultz PG (2006) Innovation: a chemical toolkit for proteins - an
expanded genetic code. Nature Reviews: Molecular Cell Biology 7, 775-782.
4. Marsh ENG (2000) Towards the nonstick egg: designing fluorous proteins. Chem.
Biol. 7, R153-R157.
5. Yoder NC, Yuksel D, Dafik L, & Kumar K (2006) Bioorthogonal noncovalent
chemistry: fluorous phases in chemical biology. Curr. Opin. Chem. Biol. 10, 576-
583.
6. Bilgicer B, Fichera A, & Kumar K (2001) A coiled coil with a fluorous core. J. Am.
Chem. Soc. 123, 4393-4399.
7. Jackel C, Salwiczek M, & Koksch B (2006) Fluorine in a native protein
environment - How the spatial demand and polarity of fluoroalkyl groups affect
protein folding. Angew. Chem. Int. Ed. 45, 4198-4203.
8. Lee KH, Lee HY, Slutsky MM, Anderson JT, & Marsh ENG (2004) Fluorous
effect in proteins: De novo design and characterization of a four-alpha-helix bundle
protein containing hexafluoroleucine. Biochemistry 43, 16277-16284.

181 9. Montclare JK, Son S, Clark GA, Kumar K, & Tirrell DA (2009) Biosynthesis and
stability of coiled-coil peptides containing (2S,4R)-5,5,5-trifluoroleucine and
(2S,4S)-5,5,5-trifluoroleucine. ChemBioChem 10, 84-86.
10. Son S, Tanrikulu IC, & Tirrell DA (2006) Stabilization of bzip peptides through
incorporation of fluorinated aliphatic residues. ChemBioChem 7, 1251-1257.
11. Tang Y, et al. (2001) Fluorinated coiled-coil proteins prepared in vivo display
enhanced thermal and chemical stability. Angew. Chem. Int. Ed. 40, 1494-1496.
12. Tang Y & Tirrell DA (2001) Biosynthesis of a highly stable coiled-coil protein
containing hexafluoroleucine in an engineered bacterial host. J. Am. Chem. Soc.
123, 11089-11090.
13. Montclare JK & Tirrell DA (2006) Evolving proteins of novel composition. Angew.
Chem. Int. Ed. 45, 4518-4521.
14. Wang P, Tang Y, & Tirrell DA (2003) Incorporation of trifluoroisoleucine into
proteins in vivo. J. Am. Chem. Soc. 125, 6900-6906.
15. Yoo TH, Link AJ, & Tirrell DA (2007) Evolution of a fluorinated green fluorescent
protein. Proc. Natl. Acad. Sci. U. S. A. 104, 13887-13890.
16. Yoo TH & Tirrell DA (2007) High-throughput screening for Methionyl-tRNA
synthetases that enable residue-specific incorporation of noncanonical amino acids
into recombinant proteins in bacterial cells. Angew. Chem. Int. Ed. 46, 5340-5343.
17. Biffinger JC, Kim HW, & DiMagno SG (2004) The polar hydrophobicity of
fluorinated compounds. ChemBioChem 5, 622-627.
18. Gao JM, Qiao S, & Whitesides GM (1995) Increasing binding constants of ligands
to carbonic-anhydrase by using greasy tails. J. Med. Chem. 38, 2292-2301.

182 19. Jackel C & Koksch B (2005) Fluorine in peptide design and protein engineering.
Eur. J. Org. Chem. 4483-4503.
20. Leroux F (2004) Atropisomerism, biphenyls, and fluorine: A comparison of
rotational barriers and twist angles. ChemBioChem 5, 644-649.
21. Muller K, Faeh C, & Diederich F (2007) Fluorine in pharmaceuticals: Looking
beyond intuition. Science 317, 1881-1886.
22. Dunitz JD (2004) Organic fluorine: Odd man out. ChemBioChem 5, 614-621.
23. Graupe M, Takenaga M, Koini T, Colorado R, & Lee TR (1999) Oriented surface
dipoles strongly influence interfacial wettabilities. J. Am. Chem. Soc. 121, 3222-
3223.
24. Merzel F & Smith JC (2002) Is the first hydration shell of lysozyme of higher
density than bulk water? Proc. Natl. Acad. Sci. U. S. A. 99, 5378-5383.
25. Pal SK & Zewail AH (2004) Dynamics of water in biological recognition. Chem.
Rev. 104, 2099-2123.
26. Levy Y & Onuchic JN (2006) Water mediation in protein folding and molecular
recognition. Annu. Rev. Biophys. Biomol. Struct. 35, 389-415.
27. Qiu WH, et al. (2006) Protein surface hydration mapped by site-specific mutations.
Proc. Natl. Acad. Sci. U. S. A. 103, 13979-13984.
28. Qiu WH, et al. (2006) Ultrafast solvation dynamics of human serum albumin:
Correlations with conformational transitions and site-selected recognition. J. Phys.
Chem. B 110, 10540-10549.
29. Cohen BE, et al. (2002) Probing protein electrostatics with a synthetic fluorescent
amino acid. Science 296, 1700-1703.

183 30. Daidone I, Ulmschneider MB, Di Nola A, Amadei A, & Smith JC (2007)
Dehydration-driven solvent exposure of hydrophobic surfaces as a driving force in
peptide folding. Proc. Natl. Acad. Sci. U. S. A. 104, 15230-15235.
31. Moore FG & Richmond GL (2008) Integration or segregation: How do molecules
behave at oil/water interfaces? Acc. Chem. Res. 41, 739-748.
32. Protein variants containing Tfl, Leu, and Hil, are identified by the addition of "-T,"
"-L," and "-H," respectively. For example, S31L containing Leu is designated
"S31L-L."
33. Chen YH, Yang JT, & Martinez HM (1972) Determination of secondary structures
of proteins by circular-dichroism and optical rotary dispersion. Biochemistry 11,
4120-4131.
34. Perez-Iratxeta C & Andrade-Navarro MA (2008) K2D2: estimation of protein
secondary structure from circular dichroism spectra. BMC Struct. Biol. 8.
35. Petka WA, Harden JL, McGrath KP, Wirtz D, & Tirrell DA (1998) Reversible
hydrogels from self-assembling artificial proteins. Science 281, 389-392.
36. Vivian JT & Callis PR (2001) Mechanisms of tryptophan fluorescence shifts in
proteins. Biophys. J. 80, 2093-2109.
37. Steiner RF (1991) Top. Fluoresc. Spectrosc., ed Lakowicz JR (Plenum Press, New
York), Vol 2, pp 1-52.
38. Qiu WH, et al. (2008) Ultrafast quenching of tryptophan fluorescence in proteins:
Interresidue and intrahelical electron transfer. Chem. Phys. 350, 154-164.

184 39. Siemiarczuk A, Petersen CE, Ha CE, Yang JS, & Bhagavan NV (2004) Analysis of
tryptophan fluorescence lifetimes in a series of human serum albumin mutants with
substitutions in subdomain 2A. Cell Biochem. Biophys. 40, 115-122.
40. Xu JH & Knutson JR (2009) Quasi-static self-quenching of Trp-X and X-Trp
dipeptides in water: ultrafast fluorescence decay. J. Phys. Chem. B 113, 12084-
12089.
41. Lu WY, Kim J, Qiu WH, & Zhong DP (2004) Femtosecond studies of tryptophan
solvation: correlation function and water dynamics at lipid surfaces. Chem. Phys.
Lett. 388, 120-126.
42. Li TP, Hassanali AAP, Kao YT, Zhong DP, & Singer SJ (2007) Hydration
dynamics and time scales of coupled water-protein fluctuations. J. Am. Chem. Soc.
129, 3376-3382.
43. Zhang LY, Yang Y, Kao YT, Wang LJ, & Zhong DP (2009) Protein hydration
dynamics and molecular mechanism of coupled water-protein fluctuations. J. Am.
Chem. Soc. 131, 10677-10691.
44. Golosov AA & Karplus M (2007) Probing polar solvation dynamics in proteins: A
molecular dynamics simulation analysis. J. Phys. Chem. B 111, 1482-1490.
45. Lee HY, Lee KH, Al-Hashimi HM, & Marsh ENG (2006) Modulating protein
structure with fluorous amino acids: Increased stability and native-like structure
conferred on a 4-helix bundle protein by hexafluoroleucine. J. Am. Chem. Soc. 128,
337-343.
46. We anticipated that A1m-H would also show hydration dynamics identical to those
of A1m-L and A1m-T. However as discussed before, the local protein packing and

185 flexibility near the Trp probe appear to have been altered by substitution of Hil for
Leu, reflected in the large Trp wobbling angle and total Stokes shift, ΔEs. Because
the local structure has been changed, we would expect to observe altered hydration
dynamics.
47. Russo D, Hura G, & Head-Gordon T (2004) Hydration dynamics near a model
protein surface. Biophys. J. 86, 1852-1862.
48. Russo D, Murarka RK, Copley JRD, & Head-Gordon T (2005) Molecular view of
water dynamics near model peptides. J. Phys. Chem. B 109, 12966-12975.
49. Chandler D (2005) Interfaces and the driving force of hydrophobic assembly.
Nature 437, 640-647.
50. Richmond GL (2002) Molecular bonding and interactions at aqueous surfaces as
probed by vibrational sum frequency spectroscopy. Chem. Rev. 102, 2693-2724.
51. Shen YR & Ostroverkhov V (2006) Sum-frequency vibrational spectroscopy on
water interfaces: Polar orientation of water molecules at interfaces. Chem. Rev. 106,
1140-1154.
52. Miller TF, Vanden-Eijnden E, & Chandler D (2007) Solvent coarse-graining and
the string method applied to the hydrophobic collapse of a hydrated chain. Proc.
Natl. Acad. Sci. U. S. A. 104, 14559-14564.
53. ten Wolde PR & Chandler D (2002) Drying-induced hydrophobic polymer
collapse. Proc. Natl. Acad. Sci. U. S. A. 99, 6539-6543.
54. Ashbaugh HS & Paulaitis ME (2001) Effect of solute size and solute-water
attractive interactions on hydration water structure around hydrophobic solutes. J.
Am. Chem. Soc. 123, 10721-10728.

186 55. Huang DM & Chandler D (2002) The hydrophobic effect and the influence of
solute-solvent attractions. J. Phys. Chem. B 106, 2047-2053.
56. Jensen TR, et al. (2003) Water in contact with extended hydrophobic surfaces:
Direct evidence of weak dewetting. Phys. Rev. Lett. 90.
57. Mezger M, et al. (2010) On the Origin of the Hydrophobic Water Gap: An X-ray
Reflectivity and MD Simulation Study. J. Am. Chem. Soc. 132, 6735-6741.
58. Rossky PJ & Dalvi VH (2010) Molecular origins of fluorocarbon hydrophobicity.
Proc. Natl. Acad. Sci. U. S. A. 107, 13603-13607.
59. Odonnell MJ & Eckrich TM (1978) Synthesis of amino acid derivatives by catalytic
phase transfer alkylations. Tetrahedron Lett. 4625-4628.
60. Dorizon P, et al. (1999) Stereoselective synthesis of highly functionalized
cyclopropanes. Application to the asymmetric synthesis of (1S,2S)-2,3-
methanoamino acids. J. Org. Chem. 64, 4712-4724.
61. Swiss Institute of Bioinformatics. Protparam tool. 2003,
http://ca.expasy.org/tools/protparam.html.
62. Schuck P (2000) Size-distribution analysis of macromolecules by sedimentation
velocity ultracentrifugation and Lamm equation modeling. Biophys. J. 78, 1606-
1619.
63. Shen XH & Knutson JR (2001) Subpicosecond fluorescence spectra of tryptophan
in water. J. Phys. Chem. B 105, 6260-6265.
64. Zhong DP, Pal SK, & Zewail AH (2001) Femtosecond studies of protein - DNA
binding and dynamics: Histone I. Chemphyschem 2, 219-227.

187
H2N COOH H2N COOHH2N COOH
CF3
1 2 3
Scheme 3.1. Amino acids used in study. 1, 5,5,5-trifluoroleucine (Tfl). 2, leucine (Leu). 3,
(4S)-2-amino-4-methylhexanoic acid (homoisoleucine, Hil).

188
Figure 3.1. Protein sequence and structure. A) Helical wheel diagram and B) amino acid
sequence of the A1 protein. The Asp residue at the f position of the third heptad (position
34) was replaced by Trp to yield a variant of A1 designated Alm. A Leu codon was
introduced at the c position of the third heptad (position 31, dark blue) or at the b position
of the fourth heptad (position 37, dark blue) to yield S31L and A37L, respectively. Side
views of C) A1m, D) S31L, and E) A37L.

189
Figure 3.2. Circular dichroism. Wavelength scans of A1m and variant proteins at 25 ºC.
The protein samples were prepared at 20 µM concentration in 10 mM acetate (pH 4)/100
mM NaCl solutions.

190
Figure 3.3. Normalized plots from the Sedfit c(s) analysis for A) A1m-L, B) S31L-L,
C) A37L-L, D) A1m-T, E) S31L-T, F) A37L-T, G) A1m-H, H) S31L-H, and I) A37L-H.
The protein samples were prepared at 550 µM concentration in 10 mM acetate
(pH 4)⁄100 mM NaCl solution. The broad, single peak of the A37L-L trace may be the
result of an equilibrium mixture between trimeric and higher-order species. It seems likely
that the breadth of the traces derived from sedimentation velocity analysis of A1m-T,
S31L-T, and A37L-T is a consequence of incomplete replacement of Leu with Tfl.

191
Figure 3.4. Steady-state UV-visible absorption (red) and fluorescence emission spectra
(black) of proteins excited at 295 nanometers. The protein samples were prepared at
550 µM concentration in 10 mM acetate (pH 4)⁄100 mM NaCl solution.

192
Figure 3.5. Time-resolved anisotropy, r(t), of the proteins. All anisotropy decays were
fitted to r(t) = rI exp(–t/fI) + rTrp exp(–t/fTrp) + r∞, where rI is the initial ultrafast anisotropy,
rTrp is the Trp motion-related anisotropy (value given in parentheses in each panel), r∞ is
the offset anisotropy, fI is the initial ultrafast internal-conversion time constant of Trp (≤1
ps), and fTrp is the Trp-rotational correlation time constant.

193
Figure 3.6. Hydration dynamics. Experimental determination of local hydration dynamics
at the surface of A1m-T, excited at 295 nm. A) Representative femtosecond-resolved
fluorescence up-conversion transients. B) Normalized time-resolved fluorescence spectra at
different time delays. The steady-state emission spectrum is also depicted (dotted line). C)
Time-dependent spectral shift of the apparent emission maxima (νs) and the lifetime-
associated (population) emission maxima (νl). Inset: entire evolution of νs and νl.
194
Figure 3.7. Hydration energy relaxation. Comparison of the hydration-correlated energy
relaxation, ΔEs(t), probed by Trp emission. Top panel: The solvation-energy relaxation data
for A1m proteins. Data for free Trp in the same buffer is also depicted for comparison.
Middle panel: Solvation energy relaxation data for S31L analogs. Bottom panel: solvation
energy relaxation data for A37L analogs. Insets: enlargement of the early-time hydration
behavior.

195
Figure 3.8. LC/MS/MS of trypsinized A1m-H. A) TIC of digested protein sample. B)–D)
XICs of peptides containing B) two, C) one, or D) no leucine to homoisoleucine
substitutions in the peptide SLEWEAAELEQK. The ratios of the peak areas obtained in
the XICs can be used to estimate the extent of leucine replacement in the protein sample.
Peptide masses: SXEWEAAEXEQK: 2+ ion: 730.86 Da observed, 730.87 Da expected.
SLEWEAAEXEQK, SXEWEAAEXEQK: 2+ ion: 723.88 Da observed, 723.86 Da
expected. SLEWEAAELEQK 2+ ion: 716.87 Da observed, 716.85 expected.

196 Table 3.1. Fluorescence emission maxima (λmax), hydration-correlated energy relaxation [ΔEs(t)], and depolarization dynamics [r(t)]
ΔEs(t)* r(t) † Sample λmax, nm
τ1, ps τ2, ps τ3, ps E1, cm−1 E2, cm−1 E3, cm−1 rTrp θ, °
Trp 353 0.30 1.5 13 883 682 18 0.196
A1m-L 352 0.30 2.1 31 610 646 171 0.056 21
A1m-T 352 0.28 2.5 31 877 568 161 0.049 20
A1m-H 352 1.9 34 0 2138 500 0.058 33
S31L-L 349 0.53 3.6 40 580 450 194 0.030 18
S31L-T 349 0.79 3.0 48 607 375 333 0.044 19
S31L-H 349 0.21 1.4 10 308 492 344 0.023 18
A37L-L 352 0.31 1.7 13 685 522 157 0.055 20
A37L-T 350 0.56 6.1 61 685 324 108 0.030 17
A37L-H 349 0.34 2.2 21 443 625 128 0.034 17
* All hydration-correlated energy relaxation dynamics were fitted to ΔEs(t) = E1exp(−t/τ1) + E2exp(−t/τ2) + E3exp(−t/τ3). † Refer to materials and methods for anisotropy analysis detail.