analysis of naptf trafficking response data for pavement · · 2015-09-04analysis of naptf...
TRANSCRIPT

Analysis of NAPTF Trafficking Response Data for Pavement Foundation Deformation Behavior
By:
Phillip Donovan and Erol Tutumluer Department of Civil and Environmental Engineering
University of Illinois 205 N. Mathews, Urbana, IL 61801
USA Phone: (217) 333-8637; Fax: (217) 333-1924
[email protected] [email protected]
SUBMITTED FOR THE 2007 FAA WORLDWIDE AIRPORT TECHNOLOGY TRANSFER CONFERENCE AND
EXPOSITION – New Directions in Airport Technology
Atlantic City, New Jersey, USA
April 15-18, 2007
Donovan and Tutumluer 1
ABSTRACT
Full scale pavement data from testing at the Federal Aviation Administration’s (FAA’s) National Airport Pavement Testing Facility (NAPTF) using next generation aircraft loads on asphalt pavements indicated that a sequential wander pattern caused inelastic deformations to be recovered. That is, the downward unrecovered deformation caused by a pass of heavily loaded landing gear was negated by the upward unrecovered deformation caused by the pass of the same gear offset by wander. This interaction indicated a shuffling of the layer deformations of the pavement system. Analysis of the multi-depth deflectometer data showed that the 9-track wander pattern used in the first cycle of NAPTF flexible pavement tests was causing a reduction in the accumulated deformations at the surface when compared to pavement loading with no wander. The pavement surface deformations varied considerably depending on the proximity of the wander position of the applied gear loading to the measured response location. The trafficking direction of the gear/wheel also had a major impact on the pavement deformation behavior. INTRODUCTION The National Airport Pavement Test Facility (NAPTF) located at the William J. Hughes Technical Center on the Atlantic City International Airport was built to analyze the effects of New Generation Aircraft (NGA) on pavements. NGA will affect airfield pavements differently than older aircraft due to increased loads and changes to landing gear configurations. These differences require advanced airport pavement design procedures. The NAPTF was constructed to generate full-scale tests in support of the investigation of airport pavements subjected to such complex NGA gear loading configurations. Construction was funded by the Federal Aviation Administration (FAA) and the Boeing Company under a cooperative research and development agreement. There were three main goals for the NAPTF: provide additional traffic data for incorporation in new thickness design procedures for airfield pavements, provide full scale testing capabilities to examine response and failure information for use in airplane landing gear design and configuration studies, and provide technical data for reexamining the CBR method of design for flexible airfield pavements. All three of these objectives were established to compare the damage done by the 6-wheel Boeing 777 (B777) type dual-tridem landing gear to dual and dual-tandem gear of older aircraft (Hayhoe [1]). Individual pavement dynamic response data were collected due to passing of each gear for various combinations of applied load magnitudes, traffic directions, and wander positions. To minimize the interaction of gear loads at the subgrade level, the 6-wheel B777 type and the 4-whell B747 type gears moved in phase, with both gears moving left and right together rather than towards and away from each other. Hayhoe et al. [2] highlighted some of the complicated trends observed in the NAPTF pavement deformation behavior as follows: “The net accumulated unrecovered (permanent) deformation in the pavement structure over a complete wander cycle is shown to be a small fraction of the range of the unrecovered deformations occurring during the wander cycle over individual back and forth load applications. That is, the sum of the upward and downward unrecovered displacements almost cancels, leaving the structure in approximately the same configuration at the end of a wander cycle as at the start. The unrecovered displacements are about the same magnitude as the recovered (elastic) displacements, with the relative magnitudes

Donovan and Tutumluer 2
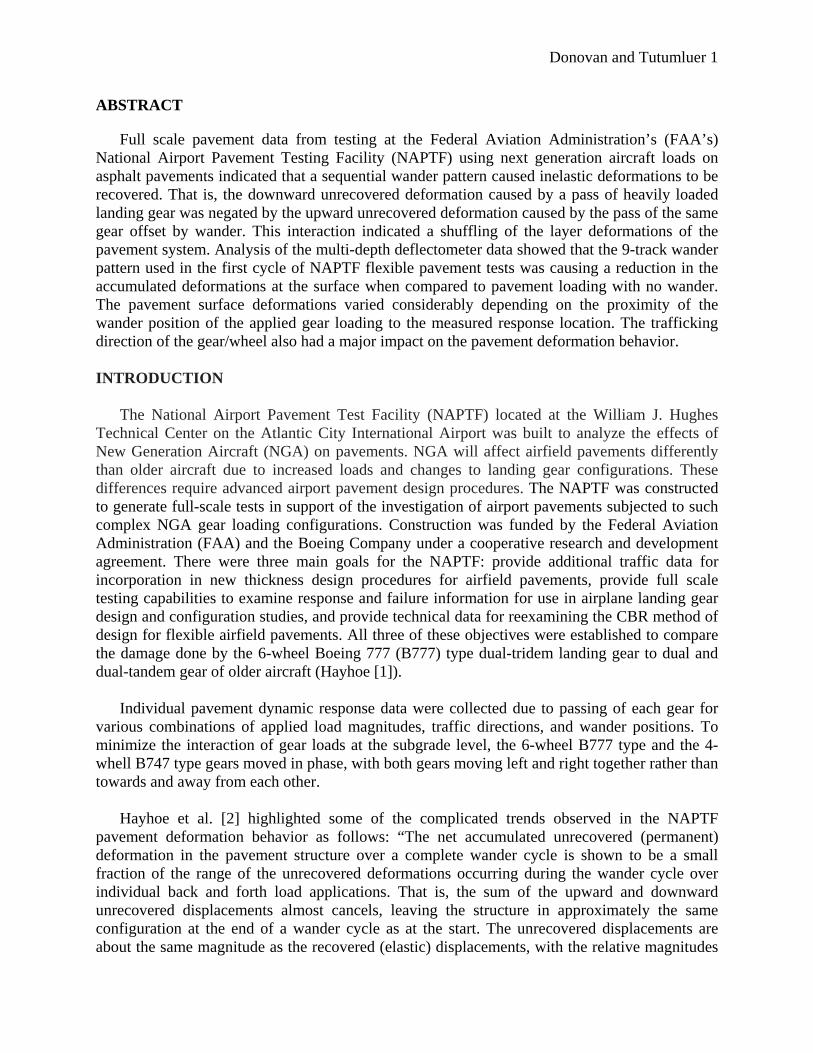
depending on the transverse position of the load relative to the transverse position of the measurement… One consequence of this conclusion is that typical laboratory measurements of permanent deformation in unbound pavement materials with repeated loading may not be representative of behavior under traffic...” This paper presents findings from an ongoing research study dealing with analysis of trafficking response data and deformation behavior of the FAA’s NAPTF full-scale pavement test section foundations, i.e., subgrade soils and base/subbase course materials. As part of the research activities at the FAA’s Center of Excellence for Airport Technology (CEAT) established at the University of Illinois, individual pavement dynamic response data were collected due to passing of each of the 6-wheel B777 type and the 4-wheel B747 type gears for various combinations of applied load magnitudes and loading sequences (application order and stress history effects), traffic directions, gear spacings, and wander positions and sequences. The objective was to develop analytical models to evaluate and predict potential rutting in variable thickness unbound base/subbase courses and the subgrade due to realistic full scale aircraft gear loading. The NAPTF pavement deformation findings due to the B777 type gear loading are mainly presented in this paper. NAPTF PAVEMENT TEST SECTIONS The NAPTF is an indoor facility (see Figure 1) designed to limit environmental effects, but it is not climate controlled. Tests are conducted using a specially designed 1.2-million-pound test vehicle which can apply loads of up to 75,000 lbs (34,020 kg) per wheel on two landing gears with up to six wheels per gear (total of 12 wheels for a load capacity of 900,000 lbs) (see Figure 2). The test vehicle is supported by rails on either side which allow the load to be varied according to the testing protocols. The vehicle can be configured to handle single, dual, dual-tandem, and dual-tridem loading configurations. The wheel and gear spacing can be varied. The maximum tire diameter is 56 inches (142 cm) and maximum tire width is 24 inches (61 cm). Vehicle control can be automatic or manual. Traffic tests were run in a fully automatic control mode at a travel speed of 5 mph (8 km/h). This speed represents aircraft taxiing from the gate to the takeoff position. It is during this maneuvering that maximum damage occurs to the pavement because the aircraft is fully loaded with fuel and payload and speed is low. Wheel loads are programmable along the travel lanes and the lateral positions of the landing gears are variable up to plus or minus 5 ft. (1524 mm) from the nominal travel lanes to simulate aircraft wander. The first full-scale tests were designed and conducted on a pavement test strip 900 ft. (274 m) long, 60 ft. (18.3 m) wide, and 9 ft. (2.7 m) to 12 ft. (3.7 m) deep. The width of 60 ft. (18.3 m) was necessary to investigate load wander interaction effects, and the depth of up to 12 ft. (3.7 m) was necessary to minimize the influence of the finite depth of imported subgrade materials. The pavement sections were built on three subgrade materials with California Bearing Ratio (CBR) values in the range of 3 to 20 percent. This range included the subgrade strengths specified in the ICAO ACN-PCN requirements. Six asphalt and three concrete surfaced test sections were built on top of the subgrades according to standard FAA airport pavement construction and thickness design specifications.
Donovan and Tutumluer 3
Figure 1. NAPTF Test Facility (photos courtesy of FAA NAPTF)
54 in1372 mm
57 in1448 mm
57 in1448 mm
58 in1473 mm
44 in1118 mm
54 in1372 mm
57 in1448 mm
57 in1448 mm
58 in1473 mm
44 in1118 mm
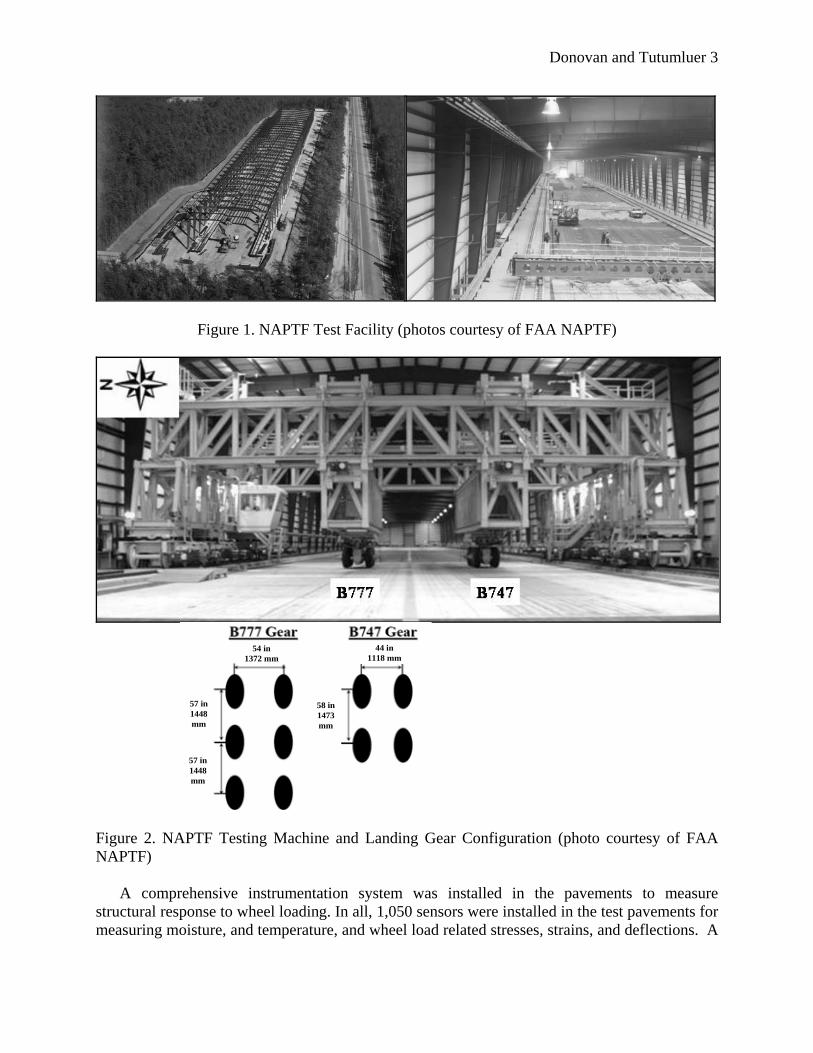
Figure 2. NAPTF Testing Machine and Landing Gear Configuration (photo courtesy of FAA NAPTF) A comprehensive instrumentation system was installed in the pavements to measure structural response to wheel loading. In all, 1,050 sensors were installed in the test pavements for measuring moisture, and temperature, and wheel load related stresses, strains, and deflections. A
Donovan and Tutumluer 4
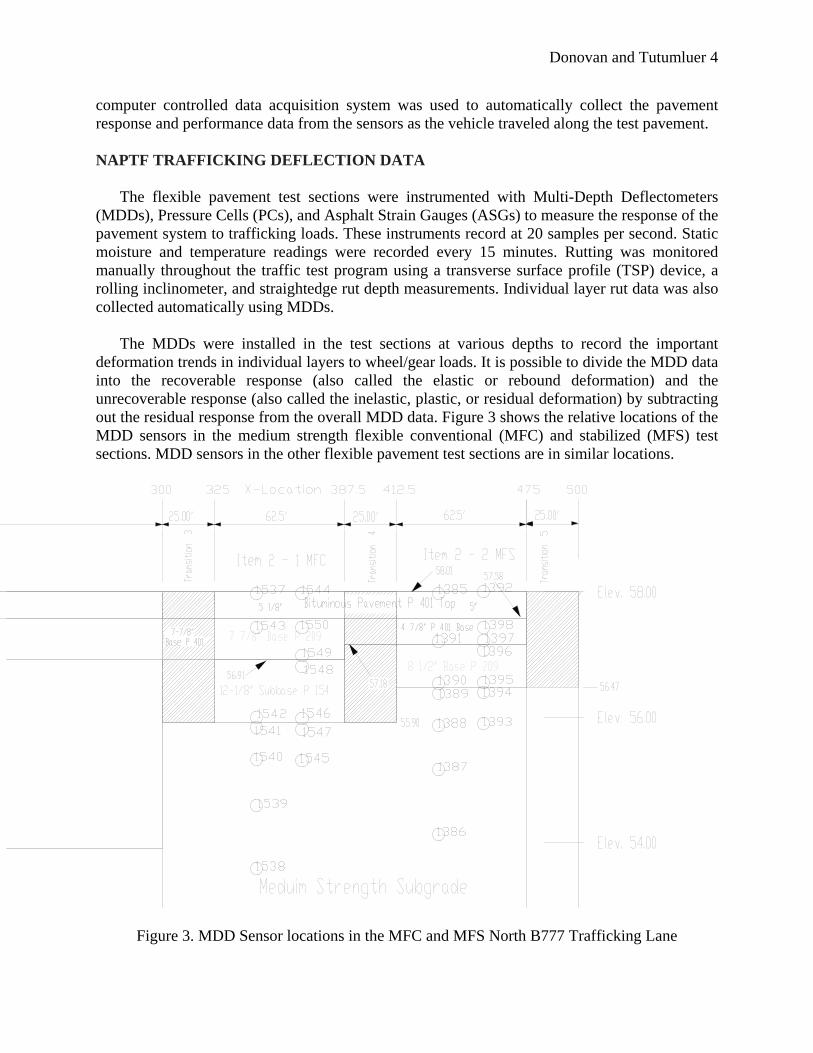
computer controlled data acquisition system was used to automatically collect the pavement response and performance data from the sensors as the vehicle traveled along the test pavement. NAPTF TRAFFICKING DEFLECTION DATA The flexible pavement test sections were instrumented with Multi-Depth Deflectometers (MDDs), Pressure Cells (PCs), and Asphalt Strain Gauges (ASGs) to measure the response of the pavement system to trafficking loads. These instruments record at 20 samples per second. Static moisture and temperature readings were recorded every 15 minutes. Rutting was monitored manually throughout the traffic test program using a transverse surface profile (TSP) device, a rolling inclinometer, and straightedge rut depth measurements. Individual layer rut data was also collected automatically using MDDs. The MDDs were installed in the test sections at various depths to record the important deformation trends in individual layers to wheel/gear loads. It is possible to divide the MDD data into the recoverable response (also called the elastic or rebound deformation) and the unrecoverable response (also called the inelastic, plastic, or residual deformation) by subtracting out the residual response from the overall MDD data. Figure 3 shows the relative locations of the MDD sensors in the medium strength flexible conventional (MFC) and stabilized (MFS) test sections. MDD sensors in the other flexible pavement test sections are in similar locations.
Figure 3. MDD Sensor locations in the MFC and MFS North B777 Trafficking Lane
Donovan and Tutumluer 5
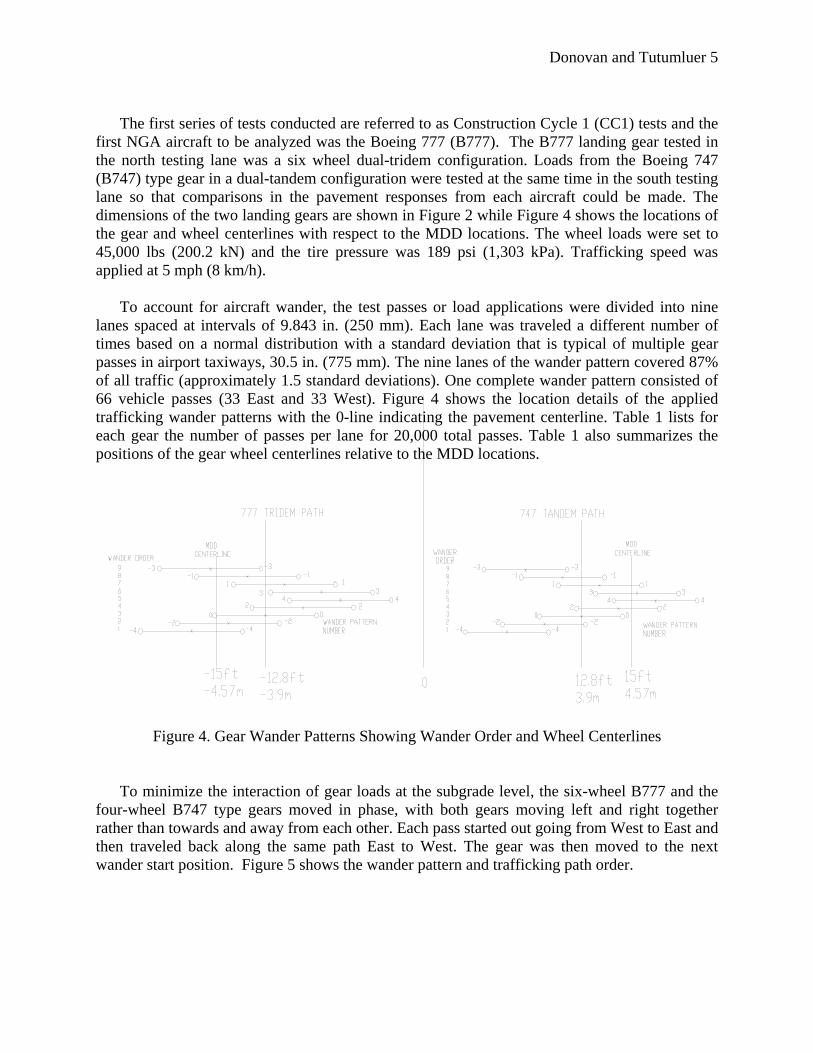
The first series of tests conducted are referred to as Construction Cycle 1 (CC1) tests and the first NGA aircraft to be analyzed was the Boeing 777 (B777). The B777 landing gear tested in the north testing lane was a six wheel dual-tridem configuration. Loads from the Boeing 747 (B747) type gear in a dual-tandem configuration were tested at the same time in the south testing lane so that comparisons in the pavement responses from each aircraft could be made. The dimensions of the two landing gears are shown in Figure 2 while Figure 4 shows the locations of the gear and wheel centerlines with respect to the MDD locations. The wheel loads were set to 45,000 lbs (200.2 kN) and the tire pressure was 189 psi (1,303 kPa). Trafficking speed was applied at 5 mph (8 km/h). To account for aircraft wander, the test passes or load applications were divided into nine lanes spaced at intervals of 9.843 in. (250 mm). Each lane was traveled a different number of times based on a normal distribution with a standard deviation that is typical of multiple gear passes in airport taxiways, 30.5 in. (775 mm). The nine lanes of the wander pattern covered 87% of all traffic (approximately 1.5 standard deviations). One complete wander pattern consisted of 66 vehicle passes (33 East and 33 West). Figure 4 shows the location details of the applied trafficking wander patterns with the 0-line indicating the pavement centerline. Table 1 lists for each gear the number of passes per lane for 20,000 total passes. Table 1 also summarizes the positions of the gear wheel centerlines relative to the MDD locations.
Figure 4. Gear Wander Patterns Showing Wander Order and Wheel Centerlines
To minimize the interaction of gear loads at the subgrade level, the six-wheel B777 and the four-wheel B747 type gears moved in phase, with both gears moving left and right together rather than towards and away from each other. Each pass started out going from West to East and then traveled back along the same path East to West. The gear was then moved to the next wander start position. Figure 5 shows the wander pattern and trafficking path order.

Donovan and Tutumluer 6
Table 1. Passes per Lane and Wheel Centerline Locations in relation to the MDD
Wander Pattern # -4 -3 -2 -1 0 1 2 3 4% of passes 6.1% 9.1% 12.1% 15.2% 15.2% 15.2% 12.1% 9.1% 6.1%
777 North Wheel location -39.97 -30.13 -20.29 -10.44 -0.60 9.24 19.09 28.93 38.77777 South Wheel Location 14.03 23.87 33.71 43.56 53.40 63.24 73.09 82.93 92.77747 North Wheel Location -87.77 -77.93 -68.09 -58.24 -48.40 -38.56 -28.71 -18.87 -9.03747 South Wheel Location -43.77 -33.93 -24.09 -14.24 -4.40 5.44 15.29 25.13 34.97
* Wander Patterns are offset by 9.843"
* North MDD offset -26.4in from 777 "0" Pattern* South MDD offset 26.4in from 747 "0" Pattern
Wheel Centerline Location in Relation to MDD* (inches)
Figure 5. Wander Patterns and Trafficking Order (courtesy of FAA NAPTF)
This paper primarily focuses on the flexible medium strength conventional pavement section
(MFC) under the B777 type gear loading path. The wander patterns used in these tests have resulted in somewhat complicated response graphs. Normally pavement response recorded with MDD sensors under channelized traffic is somewhat predictable with increasing number of loading cycles causing steadily increasing deflection magnitudes. Although predicting the deflection magnitudes with increasing load cycles is quite difficult due to applied stress history, load wander, and load duration or trafficking speed effects, in general, a higher number of cycles brings greater deflections. However, in the NAPTF testing, the response looks to be almost random. Figure 6 shows the peak MDD responses recorded in the MFC section at the surface. There appears to be a high variability in the surface deflections with number of passes and the 66-gear pass wander patterns. As the number of passes increases, the recorded surface deformations and the variability even increases.

Donovan and Tutumluer 7
Figure 7 shows a scatter graph of the same data presented in Figure 6 with just the data points plotted. The patterns of different deflections for different load locations clearly begin to appear (see Figure 7). Further, if the data points are divided by their respective wander track and a 25-point moving average is applied when capturing data to plot, the deflections due to each wander track emerges (see Figure 8). What is interesting about Figure 8 is how well tied the deflections are to each wander track. This is an excellent indication of the variable forces applied to a point in the pavement system underneath wandering traffic. Quantifying the effects of the continuously varying dynamic stresses on a pavement element is the next, rather complicated step in wander pattern investigation.
MFC, 777 Path, Sensor 1544, Peak Surface Response
-500
-450
-400
-350
-300
-250
-200
-150
-100
-50
0
50
100
2500 3500 4500 5500 6500 7500 8500 9500 10500 11500 12500
Pass #
Peak
Res
pons
e (m
ils)
Figure 6. Sensor 1544 Peak Surface Response Data from MFC B777 Gear Loading
MFC, 777 Path, Sensor 1544, Peak Surface Response
-500
-450
-400
-350
-300
-250
-200
-150
-100
-50
0
50
100
2500 3500 4500 5500 6500 7500 8500 9500 10500 11500 12500
Pass #
Peak
Res
pons
e (m
ils)
Figure 7. Sensor 1544 Peak Surface Response Scatter Graph from MFC B777 Gear Loading

Donovan and Tutumluer 8
Further investigation carried out with the surface peak deflections indicates that not only does the location of the wander pattern affect the pavement response, but the direction of travel also has an influence. Figure 9 shows the data from sensor 1544 divided into West-East (W-E) and East-West (E-W) patterns based on the direction of travel. Only wander tracks -3, 0, 2, and 4 are shown in Figure 9 for clarity. Each wander track was traveled West-East and then back over the same point East-West. Figure 9 shows the 25-point moving average of the peak responses.
MFC, 777 Path, Sensor 1544, Peak Surface Response With Wander
-300
-250
-200
-150
-100
-50
0
50
3000 4000 5000 6000 7000 8000 9000 10000 11000 12000
Pass #
Peak
Res
pons
e (m
ils)
0
1
-2
2
3
0
1
-4-1
-2
-3
3
4
2
-1
-4
-3
4
Figure 8. Sensor 1544 Peak Surface Response Data Plotted According to Wander Track from MFC B777 Gear Loading (25pt moving average)
MFC, 777 Path, Sensor 1544, Peak Surface Directional Response
-400
-350
-300
-250
-200
-150
-100
-50
0
50
3000 4000 5000 6000 7000 8000 9000 10000 11000 12000
Pass #
Peak
Res
pons
e (m
ils)
0 W-E
2 W-E2 E-W
-3 E-W-3 W-E
0 E-W
4 W-E4 E-W
Figure 9. Sensor 1544 Peak Surface Response Data Plotted According to Wander Track and E-W and W-E Load Direction from MFC B777 Gear Loading (25pt moving average)
Donovan and Tutumluer 9
Figure 9 indicates that the wander pattern determines the magnitude of the directional response. Trafficking wander track 0 causes more deflection in the West-East direction and then, the peak response becomes lower when the gear travels back over the same MDD location. This is caused by the stabilization of the pavement element by the West-East pass and then because the granular material gets shaken down and strengthened, there appears to be a lower response when gear is passing back over the same point. Surprisingly, wander track -3 records more deflection on the second pass from East-West than from the first pass West-East. This indicates that when the pavement element is between the wheel loads, it becomes less stabilized during the first pass (West-East) and the second pass (East-West) apparently causes a higher response. This effect is also evident when trafficking wander track 2. The first pass from West-East causes a loosening due to horizontal push or shuffling on the pavement element, which can be referred to as an “anti-shakedown” effect. Accordingly, the second pass causes a higher peak deflection response. These findings indicate that there is a continuous “shuffling” of the pavement layers, most probably in the granular base and subbase layers, with each complete wander cycle.
Previous studies have reported that “stable conditions” would result in a pavement element after a small number of load repetitions where residual displacement will be minimal and rebound displacement will be a consistent value (Ledbetter [3]). However, this is not true for the NAPTF tests due to the wander of the aircraft load. The anti-shakedown effect of wandering aircraft is a potential cause of more deformation than if the aircraft wheel loads traveled in the same path consistently. The best explanation of the anti-shakedown effect is that the wander of the aircraft causes a “shuffling” of the particles within the pavement system and reduces the stability of the system. A significant amount of work has already been completed on evaluating the NAPTF trafficking data (Hayhoe [1], Gomez-Ramirez and Thompson [4], etc.). Prior analysis has predicted that as the wheels of a gear assembly moved across the pavement there is an increase in the response after each wheel pass. This phenomenon is in contrast with finite element (FE) based layered structural models analyzing static loads which predict that the middle wheel of a dual-tridem gear configuration will cause the most deflection. The discrepancy has been attributed to the moving wheels load because a moving wheel does not allow the pavement system to fully rebound before it is loaded again (Gopalakrishnan and Thompson [5], Gopalakrishnan et al. [6]).
Figures 10, 11, and 12 clearly illustrate this phenomenon for the recorded time histories of the MDD surface sensors, No. 1544 and No. 1537, in the MFC test section. Figures 10, 11, and 12 are normalized averages of all MDD time histories for the MFC testing. This means that all of the individual time histories for each wander pattern are averaged and the average of the first 1.5 seconds of sensor readings are subtracted from each sensor reading taken at 0.05 second intervals so that each event is now normalized to 0. The time scale was determined by looking at the plotted data and determining where the readings were consistent. The MDD time histories also demonstrate the effect of the wander pattern on the response of the pavement.

Donovan and Tutumluer 10
Both Figures 10 and 11 show average sensor readings from sensor 1544 with the difference being in the number of trafficking events. Figure 11 covers nearly 16,000 passes, while Figure 10 presents responses only for 4,000 passes. The interesting difference is that Figure 10 clearly shows less deflection and a distinct dilation of the pavement surface as the tridem B777 type gear travels past, whereas by the time 16,000 events have traversed the pavement, the dilation becomes more uniform and the average maximum deflection increases by nearly 50%. This trend is verified in Figure 12, which shows the other surface sensor, No. 1537, and the average of the sensor records available for up to 3981 passes. Clearly, as the number of passes increases the pavement system becomes less stable resulting in more deflections.
MFC 777 PathSensor 1544 Normalized
Surface Deflection3997 Events
-150
-140
-130
-120
-110
-100
-90
-80
-70
-60
-50
-40
-30
-20
-10
0
10
20
2 2.5 3 3.5 4 4.5 5 5.5 6 6.5 7 7.5 8
Time (sec)
Def
lect
ion
(mils
)
0
1
-3,-2,2
-4
-1
-2 -3
3
44
3-1, -4
2
1
0
Figure 10. Sensor 1544 Wander Track Surface Deflections Normalized to Initial Zero Start from MFC B777 Gear Loading (average of available sensor records up to Pass No. 3997)
On further analysis of deflection trends presented in Figures 10, 11 and 12, one can see the most deflection is caused by wander track 0 as expected because this wander track has one wheel rolling directly over the MDD location. Wander tracks 3 and 4 are the farthest load locations to the MDD sensors and therefore cause dilation of the pavement in a consistent trend during and at the end of each load pass. According to Table 1 and Figure 4, wander tracks 3 and 4 have the entire wheel carriage off to the south of the MDD location. The amount of dilation decreases from wander track 4 to 3, with track 3 causing the least dilation with almost no contraction during the entire pass.

Donovan and Tutumluer 11
MFC 777 PathSensor 1544 Normalized
Surface Deflection-225
-200
-175
-150
-125
-100
-75
-50
-25
0
25
50
75
2 2.5 3 3.5 4 4.5 5 5.5 6 6.5 7 7.5 8
Time (sec)
Def
lect
ion
(mils
)
0
1
-4,4
-2
-3
2
0
1
-4-1
-2
-3
3
4
2
-1 3
Figure 11. Sensor 1544 Wander Track Surface Deflections Normalized to Initial Zero Start from MFC B777 Gear Loading (average of available sensor records up to Pass No. 15749)
MFC 777 PathSensor 1537
Normalized SurfaceDeflection 3981 Passes
-140
-130
-120
-110
-100
-90
-80
-70
-60
-50
-40
-30
-20
-10
0
10
20
2 2.5 3 3.5 4 4.5 5 5.5 6 6.5 7 7.5 8
Time (sec)
Def
lect
ion
(mils
)
0
1
-3,-2,2
-4 -1
-2
-3
3
4
2
43
-1-4
0
1
Figure 12. Sensor 1537 Wander Track Surface Deflections Normalized to Initial Zero Start from MFC B777 Gear Loading (average of available sensor records up to Pass No. 3981)
A distinct pattern can be seen in the contraction and dilation behavior when comparing the
application order of the wander tracks. As the wander track moves from 0 to 3 and eventually
Donovan and Tutumluer 12
back to 0, the amount of dilation increases first when going to wander track 2 then 4, then 3 and then drastically decreases with a change from dilation to contraction when going from row 3 to 1. As the wander track is moved from 1 to -3 and then from -4 to 0, the amount of contraction increases dependent on the wheel location and interaction of the loads between the dual wheels. That is, the wheel loads interact to cause both dilation and contraction in the pavement thus canceling out some of the contraction. It is only when wander row 0 is reached that there is no wheel load interaction at the MDD location and the entire load causes contraction of the pavement system. What this means is that under a rolling gear load of 45,000 lbs (200.2 kN) on a dual-tridem carriage configuration, the pavement 29-39 in. (737-991 mm) away from the load and not between the dual wheels experiences the most dilation. The other wander tracks have varying magnitudes of contractive and dilative influences with the most contraction happening directly under the wheel load. The interaction of the applied wheel load stresses between the dual wheels causes both dilation and contraction resulting in a complex response of the pavement, but with less contraction than directly under one wheel and less dilation than if offset outside the dual wheels.
It seems that wander track 4 causes the most dilation in the pavement, and that closer wander rows to the MDD location decreases the amount of dilation of the pavement system. However, without more specific deflection response data from within each pavement layer, one cannot be sure that wander pattern 4 causes the most dilative behavior in the pavement foundation. Preliminary analysis of MDD sensors in the P209 base and P154 subbase layers indicated that wander track 2 could be causing the most dilation and that the overall pavement dilation could be tapering off in wander track 4. The rather large wander cycle width of the 9 wander tracks also makes it difficult to observe some of the contractive and dilative deflection behavior trends. All of these aspects will continue to be investigated as part of the ongoing research efforts at the University of Illinois CEAT research activities. SUMMARY AND CONCLUSIONS This paper presented analysis results of trafficking response data and deformation behavior of the Federal Aviation Administration’s (FAA’s) National Airport Pavement Test Facility (NAPTF) full-scale pavement test sections tested as part of the construction cycle 1 testing efforts. The findings presented mainly focused on the preliminary analysis of the medium subgrade strength flexible conventional (MFC) test sections applied B777 type gear traffic loading. As part of the research activities at the FAA’s Center of Excellence for Airport Technology (CEAT) established at the University of Illinois, individual pavement surface deflection data were collected due to passing of each of the 6-wheel B777 type gear for various combinations of applied load magnitudes and loading sequences (application order and stress history effects), traffic directions, and wander positions and sequences. Pavement surface deflections measured by the multi-depth deflectometers (MDDs) showed a considerable variability in magnitudes with number of gear passes clearly indicating the significant effects of the applied 9 wander track load locations. Wander row 0, with wheels directly rolling on top of the MDD sensors, gave the greatest deformations and always contractive behavior whereas wander rows 3 and 4 consistently induced dilation of the pavement surface indicating that there were higher horizontal forces than vertical forces in the soil 29-39
Donovan and Tutumluer 13
in. (737-991 mm) away from load centerline causing dilation of the soil and thus dilation of the pavement above. This study was completed on only one of the eight low and medium strength subgrade test sections. Further analysis of the other sections is required to validate the findings. The next step is to detail the contraction/dilation effect in the other sections, sensors, and load paths and then to quantify the contraction/dilation affect based on wander pattern for the B777 and B747 type gear loads. After the data is analyzed and the wander effects of the moving B747 and B777 loads are calculated, it should be possible to calculate the effect of each pass on a pavement element and eventually calculate the contraction or dilation of that element for each load pass. With accurate representations of the pavement system properties, wheel configuration, wander location, speed, and load the destructive effect of an aircraft pass can then be determined. This will allow a more accurate prediction of pavement performance, but will only be possible if detailed trafficking data are available. ACKNOWLEDGEMENTS
This paper was prepared from a study conducted in the Center of Excellence for Airport Technology. Funding for the Center of Excellence is provided in part by the Federal Aviation Administration. The Center of Excellence is maintained at the University of Illinois at Urbana-Champaign in partnership with Northwestern University and the Federal Aviation Administration. Ms. Patricia Watts is the FAA Program Manager for Air Transportation Centers of Excellence and Dr. Satish Agrawal is the FAA Airport Technology Branch Manager.
The contents of this paper reflect the views of the authors who are responsible for the facts and accuracy of the data presented within. The contents do not necessarily reflect the official views and policies of the Federal Aviation Administration. This paper does not constitute a standard, specification, or regulation. REFERENCES
1. Hayhoe, G.H., “Traffic Testing Results from the FAA’s National Airport Pavement Test Facility,” Proceedings of the 2nd International Conference on Accelerated Pavement Testing, University of Minnesota, Minneapolis, MN, October 2004.
2. Hayhoe, G.F., Garg, N., and M. Dong, “Permanent Deformations During Traffic Tests on
Flexible Pavements at the National Airport Pavement Test Facility,” Proceedings of the 2003 Airfield Pavement Specialty Conference (APSC), Las Vegas, Nevada, September 21-24, 2003, Airfield Pavements: Challenges and New Technologies, ASCE Publication Edited by Moses Karakouzian, 2004, pp. 147-169.
3. Ledbetter, R.H., “General Deformation Elastic and Inelastic and Stress Distribution Theory
in Soils,” Technical Report S-77-10, U.S. Army Engineer Waterways Experiment Station, Vicksburg, Mississippi, September 1977.

Donovan and Tutumluer 14
4. Gomez-Ramirez, F.M., and M.R. Thompson, “Aircraft Multiple Wheel Gear Load Interaction Effects on Airport Flexible Pavement Responses,” Proceedings of the ASCE 2001 Airfield Pavement Specialty Conference, Chicago, IL, 2001.
5. Gopalakrishnan, K., and M.R. Thompson, “Performance Analysis of Airport Flexible
Pavement Subjected to New Generation Aircraft,” FAA Center of Excellence (COE) Report No. 27, Department of Civil Engineering, University of Illinois at Urbana-Champaign, Urbana, Illinois, 2004.
6. Gopalakrishnan, K, Thompson, M.R., and A. Manik, “Multi-Depth Deflectometer Dynamic
Response Measurements under Simulated New Generation Aircraft Gear Loading,” Journal of Testing and Evaluation, Volume 34, Issue 6, November, 2006.