analysis of lebanon’s real estate sector · cement deliveries 15 real estate property prices 16...
TRANSCRIPT

ANALYSIS OF LEBANON’S REAL ESTATE SECTOR
BankMed - Market & Economic Research Division

Real Estate Market Demand Side 3
Real Estate Transactions 3
Real Estate Demand by Region 4
Foreign Real Estate Demand 8
Real Estate Rental Demand 9
Real Estate Market Supply Side 12
New Residential Units 12
Construction Permits 13
Cement Deliveries 15
Real Estate Property Prices 16
Real Estate Market Financing 17
Lending to Construction 17
Lending for Housing 17
Real Estate Market Global Position 19
Global Real Estate Transparency Index 19
Physical Property Rights Index 20
SPECIAL REPORT
BankMed - Market & Economic Research Division 2
Analysis of Lebanon’s Real Estate Sector - August 2014
TABLE OF CONTENTS

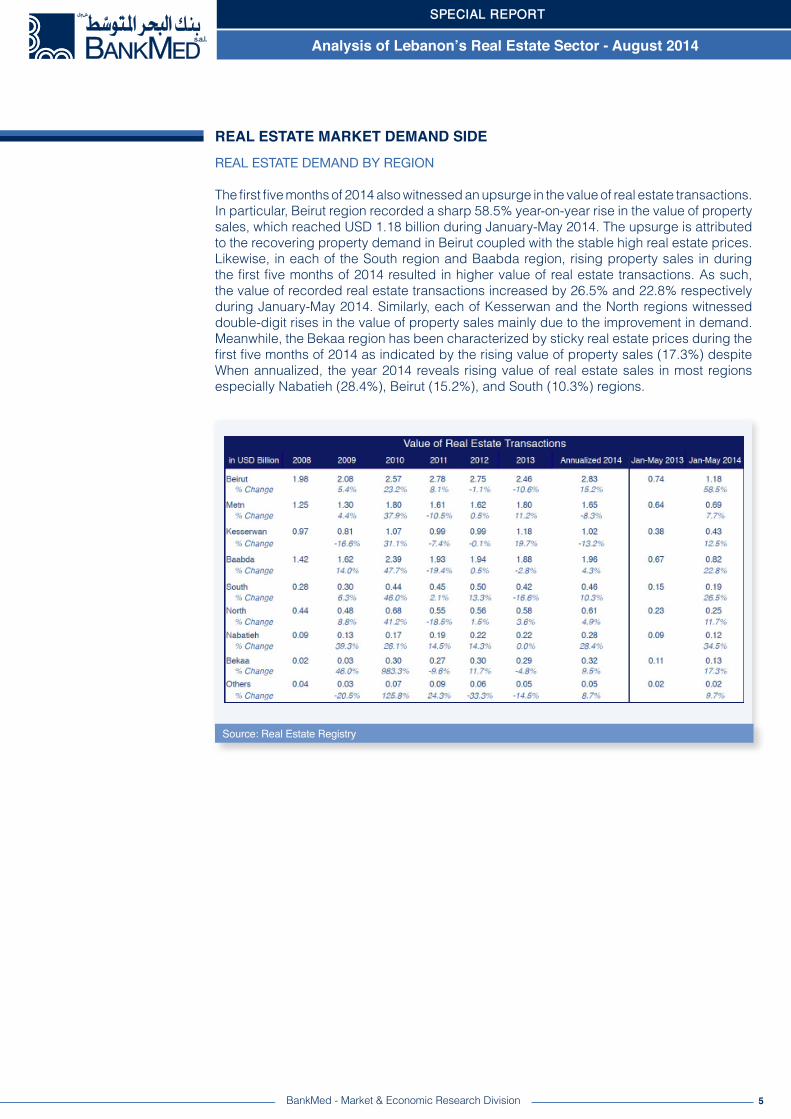
Source: Real Estate Registry
3
REAL ESTATE MARKET DEMAND SIDE
BankMed - Market & Economic Research Division
REAL ESTATE TRANSACTIONS
During the period 2007-2010, Lebanon’s real estate sector has developed to become one of the success stories of the country’s economy benefiting from the buoyant domestic economic performance during that period, while continuously experiencing robust inflows of capital into the market. In fact, the country’s favorable investment climate coupled with financial market crashes in around the world at that time resulted in an upsurge in Foreign Direct Investment (FDI) inflows which translated to a booming real estate sector. However, since the beginning of 2011, the property market witnessed a slowdown affected by the domestic political instability and the regional disturbances. The real estate sector continued to face weakening demand in 2012 as the domestic political stalemate and the regional turmoil failed to unravel. This was reflected by the 10.2% drop in the volume of real estate sales during that year.
As the investment climate further deteriorated, the security situation worsened, and the spillover effect of neighboring disturbances continued, the real estate sector continued to bear the cost of this unfavorable situation. In fact, in 2013, real estate sales declined by 7.2% with their value falling by 3.4%. However, the real estate sector witnessed a slight improvement in the first five months of 2014, with real estate transactions rising by 8.9% and their value increasing by 26.8%.
3.14 !4.20 !
6.48 ! 6.79 !
9.48 !8.84 ! 9.18 ! 8.87 ! 9.19 !
3.02 !3.83 !
50,140 !
67,041 !
81,665 !83,622 !
94,320 !
82,984 !74,569 !
69,198 !68,105 !
26,042 !
28,377 !
0 !
10,000 !
20,000 !
30,000 !
40,000 !
50,000 !
60,000 !
70,000 !
80,000 !
90,000 !
100,000 !
0 !
1 !
2 !
3 !
4 !
5 !
6 !
7 !
8 !
9 !
10 !
2006! 2007! 2008! 2009! 2010! 2011! 2012! 2013! Annualized 2014!
Jan-May 2013!
Jan-May 2014!
USD
Billi
on!
Value and Volume of Reat Estate Transactions!
Total Value of Real Estate Transactions (USD Billion)! Total Volume of Real Estate Transactions!
SPECIAL REPORT
Analysis of Lebanon’s Real Estate Sector - August 2014

4BankMed - Market & Economic Research Division
Source: Real Estate Registry
SPECIAL REPORT
Analysis of Lebanon’s Real Estate Sector - August 2014
REAL ESTATE DEMAND BY REGION
The volume of property sales, which has been on the decline in most regions since 2011, continued to fall in 2013, but recovered during the first five months of 2014. Specifically, property sales in Beirut region, which have witnessed consecutive drops in the past three years, recorded an 18.4% rise in January-May 2014. The volume of property sales also improved in the Metn region rising by 12.5% year-on-year in January-May 2014. Concurrently, property sales in Baabda and the South regions reversed the falling trend and increased by 13.4% and 8.2% respectively. Similarly, each of Nabatieh and Kesserwan regions witnessed an increase in the volume of real estate transactions after having fallen in the past year. On the other hand, the Bekaa region, which had been suffered from subsiding demand for property in the past, witnessed an increase in demand in 2013, only to record a 4.8% drop in property sales during the first five months of 2014. When annualized, the volume of real estate transactions for the year 2014 shows declines in most regions except Nabatieh, North, and Baabda regions.
REAL ESTATE MARKET DEMAND SIDE
5BankMed - Market & Economic Research Division
REAL ESTATE DEMAND BY REGION
The first five months of 2014 also witnessed an upsurge in the value of real estate transactions. In particular, Beirut region recorded a sharp 58.5% year-on-year rise in the value of property sales, which reached USD 1.18 billion during January-May 2014. The upsurge is attributed to the recovering property demand in Beirut coupled with the stable high real estate prices. Likewise, in each of the South region and Baabda region, rising property sales in during the first five months of 2014 resulted in higher value of real estate transactions. As such, the value of recorded real estate transactions increased by 26.5% and 22.8% respectively during January-May 2014. Similarly, each of Kesserwan and the North regions witnessed double-digit rises in the value of property sales mainly due to the improvement in demand. Meanwhile, the Bekaa region has been characterized by sticky real estate prices during the first five months of 2014 as indicated by the rising value of property sales (17.3%) despite When annualized, the year 2014 reveals rising value of real estate sales in most regions especially Nabatieh (28.4%), Beirut (15.2%), and South (10.3%) regions.
REAL ESTATE MARKET DEMAND SIDE
Source: Real Estate Registry
SPECIAL REPORT
Analysis of Lebanon’s Real Estate Sector - August 2014

6BankMed - Market & Economic Research Division
REAL ESTATE DEMAND BY REGION
During the first five months of 2014, real estate demand witnessed a shift in property location preference when compared to the same period of 2013. In fact, the breakdown of property sales by value reveals that while Beirut accounted for 25% of total transactions in January-May 2013, its share improved to about 31% in in the same period of 2014. Meanwhile, other regions like Metn and Kesserwan witnessed falling shares of property sales value. As a matter of fact, these regions lost about two percentage points in market share reflecting re-interest in properties in the capital. Other regions maintained stable shares including North region (7% share), South region (5% share), and Nabatieh region (3% share).
REAL ESTATE MARKET DEMAND SIDE
Source: Real Estate Registry
SPECIAL REPORT
Analysis of Lebanon’s Real Estate Sector - August 2014
Beirut!25%!
Metn!21%!
Kesserwan!12%!
Baabda!22%!
South!5%!
North!7%!
Nabatieh!3%!
Bekaa!4%!
Others!1%!
Value of Real Estate Transactions by Region (Jan-May 2013)!
Beirut!31%!
Metn!18%!
Kesserwan!11%!
Baabda!21%!
South!5%!
North!7%!
Nabatieh!3%!
Bekaa!3%!
Others!1%!
Value of Real Estate Transactions by Region (Jan-May 2014)!

7BankMed - Market & Economic Research Division
REAL ESTATE DEMAND BY REGION
A closer look at real estate activity in Beirut region, which plays a significant role in the property market, shows that the popularity of the capital as the preferred residential area has fallen over the years. In fact, the disproportionate change in real estate price trends in Lebanon resulted in a shift in demand behavior with buyers seeking more affordable property in various regions across Lebanon however away from Beirut. The high real estate prices in Beirut have forced middle-income consumers to shift their demand to residential areas in the suburbs. Furthermore, given that a large portion of the property available in Beirut region today developed during a period of rising foreign demand, it makes it difficult for this property to match the domestic needs of middle-income consumers, who usually seek reasonably priced and small-sized property. As it is indicated in the graph below, Beirut region’s share of the total volume of real estate transactions have gradually dropped over the period 2008-2013 from 8.21% (6,702 transactions) in 2008 to 7.1% (4,912 transactions) in 2013. However, the first five months of 2014 reveal that the capital is gradually recovering its position as a vibrant contributor to real estate activity, with Beirut region’s share rising to 6.92% (1,964 transactions) in January-May 2014 from 6.31% (1,643 transactions) in the same period of 2013. Yet, comparing the year 2013 with projected annualized 2014 figures shows a slight decline in Beirut’s share of real estate sales. This reveals that the second half of 2013 witnessed higher sales than the first five months of 2014.
Source: Real Estate Registry
REAL ESTATE MARKET DEMAND SIDE
SPECIAL REPORT
Analysis of Lebanon’s Real Estate Sector - August 2014

8BankMed - Market & Economic Research Division
FOREIGN REAL ESTATE DEMAND
When it comes to the split of real estate demand between local residents and foreign investors, it can be noted that foreign demand has declined gradually over the years but witnessed a reversal in 2012. The proportion of real estate sales to foreigners as a percentage of total real estate transactions declined from 2.38% in 2008 to 1.81% in 2011. Nevertheless, as the number of displaced Syrian nationals relocating in Lebanon increased, the share of foreigners out of total real estate sales rose to 1.86% in 2012. However, with the unresolved political stalemate and the continued regional turmoil, foreigner’s share of property sales dropped to 1.78% in 2013 and further declined to 1.45% in January-May 2014.
REAL ESTATE MARKET DEMAND SIDE
SPECIAL REPORT
Analysis of Lebanon’s Real Estate Sector - August 2014
2.45%!2.38%!
2.53%!
2.04%!
1.81%!1.86%!
1.78%!
1.45%!
1.0%!
1.2%!
1.4%!
1.6%!
1.8%!
2.0%!
2.2%!
2.4%!
2.6%!
2.8%!
2007! 2008! 2009! 2010! 2011! 2012! 2013! Jan-May 2014!
Share of Foreigners out of Total Volume of Real Estate Transactions!
Source: Real Estate Registry

9BankMed - Market & Economic Research Division
SPECIAL REPORT
Analysis of Lebanon’s Maritime Transport - July 2014
REAL ESTATE RENTAL DEMAND
Lebanon’s real estate rental market is a vibrant one, and it has become increasingly active as demand for rent apartments gained momentum with the influx of Syrian nationals. In fact, displaced Syrian nationals to Lebanon have opted for renting property for a temporary stay in Lebanon awaiting the situation to improve in their country. This has compensated for the falling demand for furnished apartments by tourists. Furthermore, while demand by foreigners working in Lebanon declined as the country faced political and security challenges, demand by Syrians succeeded at uplifting property rental demand.
As the momentum of demand has been maintained, it has kept the upward pressure on rental prices in Lebanon. In fact, Lebanon’s average monthly rent reached USD 2,082 in 2013. This monthly rent is considered high when compared to other countries in the region. With the exception of UAE which has been characterized by a higher monthly rent (USD 2,932) than Lebanon, each of Jordan (USD 1,367), Morocco (USD 1,217) and Egypt (USD 977) has lower average monthly rental prices.
REAL ESTATE MARKET DEMAND SIDE
SPECIAL REPORT
Analysis of Lebanon’s Real Estate Sector - August 2014
Source: Global Property Guide
2,932!
2,082!
1,367!
1,217!
977!
0! 500! 1,000! 1,500! 2,000! 2,500! 3,000! 3,500!
UAE!
Lebanon!
Jordan!
Morocco!
Egypt!
USD!
Monthly Rent in Selected Countries!

10BankMed - Market & Economic Research Division
REAL ESTATE RENTAL DEMAND
In order to better assess the real estate rental market in Lebanon, the gross rental yield is considered. Gross rental yield is defined as the gross annual rental income, expressed as a percentage of property purchase price. This is what landlords can expect as return on their investment before taxes, maintenance fees, and other costs. While Lebanon is characterized by high rent value, it has the lowest rental yield of 4.5% among the considered countries. This compares to 5.8% in UAE, 8.5% in Jordan, and 9.4% in Egypt. The low rental yield is mainly due to the high valuation of property in the country, with real estate prices among the highest in the region.
Source: Global Property Guide
9.4%!
8.5%!
6.0%!
5.8%!
4.5%!
0%! 1%! 2%! 3%! 4%! 5%! 6%! 7%! 8%! 9%! 10%!
Egypt!
Jordan!
Morocco!
UAE!
Lebanon!
Gross Rental Yields in Selected Countries!
Likewise, the price/rent ratio, which is used for measuring undervaluation or overvaluation of real estate prices, also reveals the high prices of real estate in Lebanon. Price/rent ratio calculated by dividing 100 by the gross rental yield, such that the higher the yield, the lower the price/rent ratio. Lebanon is characterized by a price/rent ratio of 22 years, indicating that it takes 22 years of renting the property in order to generate its value. This compares to 17 years in each of UAE and Morocco and 12 years in Jordan. As such, it can be inferred that Lebanon’s property prices are overvalued in comparison with other countries in the region.
22!
17!
17!
12!
11!
0! 5! 10! 15! 20! 25!
Lebanon!
UAE!
Morocco!
Jordan!
Egypt!
Years!
Price/Rent Ratio in Selected Countries!
Source: Global Property Guide
SPECIAL REPORT
Analysis of Lebanon’s Real Estate Sector - August 2014
REAL ESTATE MARKET DEMAND SIDE

11BankMed - Market & Economic Research Division
However, it is expected that the rental rates will rise in Lebanon if the new rental law gets implemented. This new law legalizes the gradual increase on annual rents signed in contracts before 1992 in order to match current market values within six years. It also give tenants incentives to vacate their property. At the end of the new deal, the leased property becomes unencumbered, freeing up thousands of old building for development or sale.
According to the new rules, the tenants can stay in the same apartment or make an early exit with compensation. If the tenants stay in the leased apartment, the law allows property owners to gradually raise their annual rent so as to reach 5% of the property’s value, considered as the fair lease price. During the first year of the law’s enforcement, the tenant pays only 15% of the difference between the old rent and the fair lease price. An additional 15% will be paid in each of the following three years. During the fifth and sixth years, the tenant pays an additional 20% every year such that the fair lease price is reached in the seventh year. Starting from the seventh year, tenants will still have undisputable right to stay in their house for three more years, as long as they pay the fair lease price. If the tenants wish to leave after the seventh years, they will not be entitled to any compensation. After year nine, tenants will have to leave the property or reach a new freely negotiated rent contract with the landlords.
REAL ESTATE MARKET DEMAND SIDE
SPECIAL REPORT
Analysis of Lebanon’s Maritime Transport - July 2014
SPECIAL REPORT
Analysis of Lebanon’s Real Estate Sector - August 2014

12BankMed - Market & Economic Research Division
SPECIAL REPORT
Analysis of Lebanon’s Maritime Transport - July 2014
SPECIAL REPORT
Analysis of Lebanon’s Real Estate Sector - August 2014
REAL ESTATE MARKET SUPPLY SIDE
NEW RESIDENTIAL UNITS
Real estate suppliers have responded to the shifts in consumer preference in the past few years. As such, given that demand for smaller-sized apartments has been on the rise, real estate developers responded to this new trend, hence, supplying smaller-sized property even though profit margin from such property is low. In fact, the share of residential units which are 101-150 square meters in size increased from 26% in 2009 to 49% in 2013. On the other hand, the share of residential units which are 201-300 square meters in size dropped from 16% in 2009 to 7% in 2013. Likewise, the share of property above 400 square meters in size fell from 3% in 2009 to less than 1% in 2013. This shift has provided suppliers with somehow guaranteed sales, as no free-fall is expected in the demand of apartments in the 101-150 square meters range given domestic residential demand for affordable property. Thus, real estate developers responded dynamically to new market trends shifting their target market from high-end demanders to middle-income households demanding property to actually live in.
Source: Order of Engineers
Units 2009 2010 2011 2012 2013
Below 100 sqm 2,712 1,695 1,853 1,504 2,503% Change -37.5% 9.3% -18.8% 66.4%
101 - 150 sqm 5,729 10,053 11,573 9,938 10,111% Change 75.5% 15.1% -14.1% 1.7%
151 - 200 sqm 6,178 7,201 5,735 5,401 4,117% Change 16.6% -20.4% -5.8% -23.8%
201 - 300 sqm 3,581 4,046 2,771 2,386 1,431% Change 13.0% -31.5% -13.9% -40.0%
301 - 400 sqm 850 503 505 345 218% Change -40.8% 0.4% -31.7% -36.8%
Above 400 sqm 609 543 279 151 79% Change -10.8% -48.6% -45.9% -47.7%
Houses 999 1,426 1,583 1,464 1,585% Change 42.7% 11.0% -7.5% 8.3%
Villas 1,108 1,036 863 914 672% Change -6.5% -16.7% 5.9% -26.5%
Palaces 8 1 6 5 1% Change -87.5% 500.0% -16.7% -80.0%
Total 21,774 26,504 25,168 22,108 20,717
New Residential Units by Size
13BankMed - Market & Economic Research Division
SPECIAL REPORT
Analysis of Lebanon’s Maritime Transport - July 2014
SPECIAL REPORT
Analysis of Lebanon’s Real Estate Sector - August 2014
REAL ESTATE MARKET SUPPLY SIDE
CONSTRUCTION PERMITS
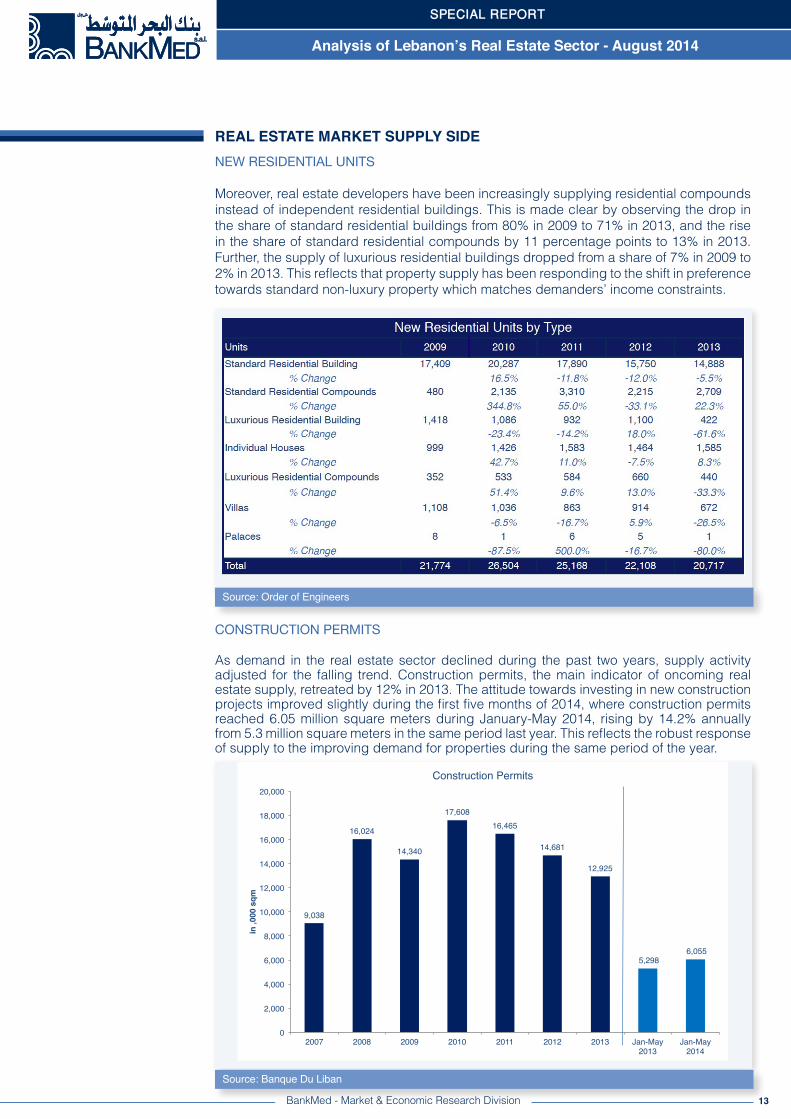
As demand in the real estate sector declined during the past two years, supply activity adjusted for the falling trend. Construction permits, the main indicator of oncoming real estate supply, retreated by 12% in 2013. The attitude towards investing in new construction projects improved slightly during the first five months of 2014, where construction permits reached 6.05 million square meters during January-May 2014, rising by 14.2% annually from 5.3 million square meters in the same period last year. This reflects the robust response of supply to the improving demand for properties during the same period of the year.
Source: Banque Du Liban
9,038!
16,024!
14,340!
17,608!16,465!
14,681!
12,925!
5,298 ! 6,055 !
0!
2,000!
4,000!
6,000!
8,000!
10,000!
12,000!
14,000!
16,000!
18,000!
20,000!
2007! 2008! 2009! 2010! 2011! 2012! 2013! Jan-May 2013!
Jan-May 2014!
in ,0
00 s
qm!
Construction Permits!
NEW RESIDENTIAL UNITS
Moreover, real estate developers have been increasingly supplying residential compounds instead of independent residential buildings. This is made clear by observing the drop in the share of standard residential buildings from 80% in 2009 to 71% in 2013, and the rise in the share of standard residential compounds by 11 percentage points to 13% in 2013. Further, the supply of luxurious residential buildings dropped from a share of 7% in 2009 to 2% in 2013. This reflects that property supply has been responding to the shift in preference towards standard non-luxury property which matches demanders’ income constraints.
Source: Order of Engineers

14BankMed - Market & Economic Research Division
SPECIAL REPORT
Analysis of Lebanon’s Maritime Transport - July 2014
SPECIAL REPORT
Analysis of Lebanon’s Real Estate Sector - August 2014
REAL ESTATE MARKET SUPPLY SIDE
CONSTRUCTION PERMITS
When it comes to the geographical distribution of construction permits, there has been a shift in the distribution of construction permits away from Beirut region and Mount Lebanon. In fact, Beirut region’s share of total construction permits dropped by 8 percentage points since 2008 to 5% in 2013 while Mount Lebanon’s share fell from 53% to 47%. North Lebanon and Bekaa regions constituted substitute areas, where the share of construction permits increased respectively to 19% and 10% in 2013. The first five months of 2014 witnessed a y-o-y increase in construction permits in Beirut (148%), South Lebanon (35%), and Mount Lebanon (12%). However, construction permits dropped in Bekaa (-15%) and North Lebanon (-2%). Mount Lebanon captured the largest share of construction activity taking 44% of the total number of permits issued in January-May 2014. North Lebanon accounted for around 17% of permits, followed by South Lebanon (12%), Beirut (11%), Bekaa (8%), and Nabatieh (8%).
Source: Order of Engineers
(in ,000 sqm) 2008 2009 2010 2011 2012 2013 Jan-May 2013 Jan-May 2014Beirut 2,148 1,404 1,565 1,332 1,096 615 258 641% Change -35% 11% -15% -18% -44% 148%Mount Lebanon 8,434 6,760 9,614 8,483 7,296 6,064 2,389 2,682% Change -20% 42% -12% -14% -17% 12%
North Lebanon 1,937 3,113 2,590 2,738 2,474 2,525 1,071 1,054% Change 61% -17% 6% -10% 2% -2%Bekaa 953 908 1,156 1,209 1,330 1,331 591 503% Change -5% 27% 5% 10% 0% -15%South Lebanon 1,743 1,425 1,708 1,638 1,559 1,381 533 719% Change -18% 20% -4% -5% -11% 35%Nabatieh 808 731 976 1,065 926 1,009 457 455% Change -10% 34% 9% -13% 9% 0%
Construction Permits by Region
As for the breakdown of construction permits by use, the years 2012 and 2013 witnessed consecutive declines in construction permits dedicated to residential buildings. Furthermore, construction permits for economic sector buildings (agriculture and industry) dropped by an average annual rate of 15% in 2012 and 2013. Likewise, construction permits for hotel and tourism services building dropped by 46% in 2013 as a repercussion of the deterioration in the tourism sector. However, residential buildings still constitute the lion’s share of 83% of total construction permits followed by commercial buildings (8%), public buildings (5%), and economic sector buildings (4%).
Source: Order of Engineers

15BankMed - Market & Economic Research Division
SPECIAL REPORT
Analysis of Lebanon’s Maritime Transport - July 2014
SPECIAL REPORT
Analysis of Lebanon’s Real Estate Sector - August 2014
REAL ESTATE MARKET SUPPLY SIDE
CEMENT DELIVERIES
Cement deliveries, the coincident indicator of building activity, fell by 4% in 2012 to 5,309,000 tons after an 11.5% average annual growth rate over the past five years. This drop reflects the slowdown that characterized the real estate market during that year. However, the year 2013 saw a 9.8% increase in cement deliveries which totaled 5,831,000 tons. Yet, it is important to note that this increase in cement deliveries comes after last year’s 3.2% decline in 2012 as compared to the cement deliveries in 2011, thus reflecting a necessary correction. The correction continued in the first four months of 2014, with cement deliveries rising by 7.2% to reach 1,210,000 tons in January-April 2014.
Source: Banque Du Liban
3,945!4,219!
4,897!5,227!
5,550!5,309!
5,831!
1,128! 1,210!
0!
1,000!
2,000!
3,000!
4,000!
5,000!
6,000!
7,000!
2007! 2008! 2009! 2010! 2011! 2012! 2013! Jan-Apr 2013!
Jan-Apr 2014!
in ,0
00 to
ns!
Cement Deliveries!

16BankMed - Market & Economic Research Division
SPECIAL REPORT
Analysis of Lebanon’s Maritime Transport - July 2014
SPECIAL REPORT
Analysis of Lebanon’s Real Estate Sector - August 2014
REAL ESTATE PROPERTY PRICES
Despite slowing local demand, high real estate prices are sustained for several reasons. First, Lebanon’s real estate sector faces real demand and not much speculative demand. In fact, Lebanese residents account for the largest portion of demand for property. Hence, Lebanon’s real estate sector does not encompass high-risk associated with speculative pressure that has been witnessed in other countries during the global financial crisis. This explains the stickiness in property prices, which did not adjust downward, given the continued momentum in demand by end-users despite the slowing overall real estate demand. Second, the scarcity of land and mounting construction of luxurious residences exert upward pressure on property prices. Third, the increase in real estate demand by displaced Syrian nationals is playing an important role in compensating for reduced local demand, hence contributing to further stickiness in real estate prices.
In order to understand the discrepancy in trend evolution of real estate demand, it is important to study the evolution of average value per real estate transaction. This value has gradually increased over the period 2008-2013. The highest increment was recorded in Metn region, where the average value increased by 107.3% to reach USD 213,584 in 2013. Concurrently, the average value per transaction in Beirut region rose by 69.5% over the six-year period reaching USD 499,948 in 2013. Baabda and Kesserwan also witnessed rises in average value per real estate transactions, which reached USD 121,913 and USD 144,711 respectively. However, during the first five months 2014, while the average selling price per real estate transaction continued to rise in Beirut, Baabda, and Nabatieh regions, Metn region witnessed a 4.3% year-on-year decline in average value per transaction reaching USD 206,647 in January-May 2014. This is attributed to a combination of factors including price adjustment to falling demand and the shift towards smaller-sized property, which lowers the value per transactions.
Source: Real Estate Registry
294,987 !
103,007 !
96,274 !
71,303 !
40,467 !
34,215 !
20,755 !
2,756 !
499,948 !
213,584 !
144,711 !
121,913 !
65,479 !
53,665 !
39,091 !
37,568 !
605,611 !
206,647 !
126,629 !
126,567 !
73,359 !
55,877 !
46,630 !
45,466 !
$0! $100,000! $200,000! $300,000! $400,000! $500,000! $600,000! $700,000!
Beirut!
Metn!
Kesserwan!
Baabda!
South!
North!
Nabatieh!
Bekaa!
Average Value Per Real Estate Transaction by Region!
Jan-May 2014! 2013! 2008!

17BankMed - Market & Economic Research Division
SPECIAL REPORT
Analysis of Lebanon’s Maritime Transport - July 2014
SPECIAL REPORT
Analysis of Lebanon’s Real Estate Sector - August 2014
REAL ESTATE MARKET FINANCING
With demand for real estate on the rise in the past few years, Lebanese banks have developed tailor-made housing loans to meet the needs of both, the developers of new properties and homebuyers.
LENDING TO CONSTRUCTION
Loans granted to the construction sector have increased throughout the years reflecting sustained levels of the sector’s activity during periods of economic growth and slowdown. During the year 2009, outstanding construction loans increased by 12% by the end of the year. An even higher growth in lending to construction sector was witnessed in 2010, where construction loans increased by 30%. However, as the demand for real estate property moderated in the past two years, loans granted for construction purposes grew yearly by a modest 13%. During 2013, lending to construction further adjusted to the falling activity in the real estate sector. In fact, construction loans grew by only 13%, recording USD 9,181 million by end- 2013.
Source: Banque Du Liban
LENDING FOR HOUSING
Over the period 2008-2010, housing loans witnessed remarkable growth reflecting improved consumer confidence, which was translated into higher demand for housing. This growth is also attributed to the support of the Central Bank of Lebanon through the various subsidized housing loans schemes. Also, banks have facilitated the process of owning a residence by applying historical low rates following the Central Bank of Lebanon incentive measures for loans in LBP since mid-2009. During the year 2009, outstanding housing loans increased by 59%. An even higher growth in lending for housing purposes was witnessed in 2010, where housing loans increased by 61%.

18BankMed - Market & Economic Research Division
SPECIAL REPORT
Analysis of Lebanon’s Maritime Transport - July 2014
SPECIAL REPORT
Analysis of Lebanon’s Real Estate Sector - August 2014
REAL ESTATE MARKET FINANCING
LENDING FOR HOUSING
However, as the economy slowed down during 2011 and 2012, so did the demand for real estate property. Hence, outstanding loans granted for housing grew by a modest average annual rate of 27% in 2011 and 2012. Growth in housing loans further declined in 2013 reflecting the slower activity in the real estate sector. In fact, housing loans increased by a remarkably low rate of 17% since end-2012 recording USD 8,535 million by end-2013.
Source: Banque Du Liban
An analysis of the correlation between lending for housing and real estate sales reveals a correlation coefficient of 0.78. This signals a significant positive relation between access to credit facilities and demand for property. In fact, the banking sector has long played a vital role in boosting demand for real estate and maintaining its sticky prices.
Source: BankMed Research
6.0 !
6.5 !
7.0 !
7.5 !
8.0 !
8.5 !
9.0 !
9.5 !
10.0 !
0! 1,000! 2,000! 3,000! 4,000! 5,000! 6,000! 7,000! 8,000! 9,000!
Valu
e of
Rea
l Est
ate
Sale
s (U
SD B
illio
n)!
Outstanding Housing Loans (USD Million)!
Correlation Between Lending for Housing and Real Estate Sales!

19BankMed - Market & Economic Research Division
SPECIAL REPORT
Analysis of Lebanon’s Maritime Transport - July 2014
SPECIAL REPORT
Analysis of Lebanon’s Real Estate Sector - August 2014
REAL ESTATE MARKET GLOBAL POSITION
GLOBAL REAL ESTATE TRANSPARENCY INDEX
Global Real Estate Transparency Index, published by Jones Lang LaSalle, is a unique biennial survey covering 102 markets worldwide. It aims to help real estate players understand important differences when transacting, owning, and operating in foreign markets. The composite Global Real Estate Transparency Index scores range on a scale from 1 to 5. A country or market with a perfect 1 score has total real estate transparency while a country with a 5 score has total real estate opacity. Markets are then assigned to one of five transparency tiers: Highly Transparent (1.00 – 1.70), Transparent (1.71 – 2.45), Semi-Transparent (2.46 – 3.46), Low Transparency (3.47 – 3.97), and Opaque (3.98 – 5.00).
The index is based on a combination of quantitative market data and information gathered through a survey of the global business network of the company’s Investment Management across 102 markets. For each market, 115 separate factors, both quantitative data points and survey questions, are used to calculate the composite score. Out of the 115 scoring factors, 56 factors are quantitative. These quantitative factors include the number of years fundamentals’ data series like vacancy, the market coverage of property return indices, and the free float of public listed real estate securities markets. These quantitative factors are scored on a continuous scale from 1 to 5, with 1 indicating very high transparency. The balance of the scoring factors, totaling 59 factors, are qualitative survey questions scored by the company’s local Investment Management teams. For each, local research teams are provided with a detailed rubric of five answer choices, ranging from 1 (most transparent) to 5 (opaque). Based on where their market fits within that rubric of options, local experts assign a score.
Lebanon has recorded a Global Real Estate Transparency Index value of 3.9 and has ranked 81st among 102 countries worldwide in the 2014 survey, deteriorating from 66th in 2012 where it scored 3.75. Despite the deterioration in position, Lebanon remained in the Low Transparency tier. Regionally, Lebanon ranked 11th following Oman (80th worldwide), Morocco (76th worldwide), Kuwait (75th worldwide), and Egypt (72nd worldwide).
Source: Jones Lang LaSalle
Country Rank 2014 GRETI 2014 Rank 2012 GRETI 2012
UAE-Dubai 49 3.1 47 3.1UAE-Abu Dhabi 53 3.2 52 3.2Qatar 58 3.4 72 3.8Bahrain 60 3.4 63 3.6Saudi Arabia 67 3.6 64 3.6Jordan 69 3.6 80 4.0Egypt 72 3.7 77 3.9Kuwait 75 3.7 67 3.8Morocco 76 3.8 76 3.9Oman 80 3.9 74 3.9Lebanon 81 3.9 66 3.8Algeria 90 4.2 93 4.5Tunisia 92 4.2 89 4.4Iraq 97 4.4 91 4.4
Global Real Estate Transperancy Index

20BankMed - Market & Economic Research Division
SPECIAL REPORT
Analysis of Lebanon’s Maritime Transport - July 2014
SPECIAL REPORT
Analysis of Lebanon’s Real Estate Sector - August 2014
REAL ESTATE MARKET GLOBAL POSITION
GLOBAL REAL ESTATE TRANSPARENCY INDEX
A detailed assessment of Lebanon’s score reveals that the country scores favorably on Listed Vehicles category (1.8 score) but unfavorably on market fundamentals category (5.0 score), investment performance category (4.0 score), and regulatory and legal category (3.9 score). In fact, the report argues that Lebanon has struggled to maintain momentum over the past two years. It has faced serious economic, security, and political hurdles and the security situation remains unstable, exacerbated by the continued civil war in neighboring Syria. These challenges have hindered any progress towards improved real estate transparency.
Source: Jones Lang LaSalle
Investment Performance 4.0Market Fundamentals 5.0Listed Vehicles 1.8Regulatory and Legal 3.9Transaction Process 3.7Composite Score 3.9
Lebanon's Score on Global Real Estate Transparency Categories 2014
PHYSICAL PROPERTY RIGHTS INDEX
As a component of the International Property Rights Index, the Physical Property Rights Index measures and compares the protection of physical property rights across countries. It investigates the effects of a country’s legal and political environment as well as the recognition and enforcement of physical property rights on the economic development of a country. A strong property rights regime commands the confidence of people in its effectiveness to protect private property rights. It also provides for seamless transactions related to registering property. Finally, it allows for the access to credit, which is necessary to convert property into capital. For these reasons, the following variables are used to measure private physical property rights:
(1) Protection of Physical Property Rights: this variable directly relates to the strength of a country’s property rights system as it reflects experts’ views on the quality of judicial protection of private property, including financial assets. Additionally, it encompasses professionals’ opinions on the clarity of the legal definition of property rights;
(2) Registering Property: this variable reflects businesses’ point of view on how difficult it is to register property in terms of both length of time and procedures necessary. According to The World Bank Group’s Doing Business Report, the variable records the full sequence of procedures necessary to transfer the property title from seller to buyer when a business purchases land and buildings. This information is critical because the more difficult property registration is, the more likely it is that assets stay in the informal sector, thus restricting the development of the broader public’s understanding and support for a strong legal and sound property rights system;

PHYSICAL PROPERTY RIGHTS INDEX
(3) Access to Loans: this variable is included because access to a bank loan without collateral serves as a proxy for the level of development of financial institutions in a country. Financial institutions play a complementary role, along with a strong property rights system, to bring economic assets into the formal economy.
Lebanon has recorded a Physical Property Rights Index value of 6.3 and has ranked 54th among 131 countries worldwide in the 2013 survey, deteriorating from a score of 6.5 in 2012. This decline is due to losses in both Access to Loans and Protection of Physical Property Rights. Globally, Lebanon came ahead of Zambia (53rd worldwide) but behind Lithuania (52nd worldwide). Regionally, Lebanon ranked 10th following Kuwait (43rd worldwide) and Jordan (36th worldwide) but ahead of Morocco (64th worldwide) and Egypt (89th worldwide).
SPECIAL REPORT
Analysis of Lebanon’s Maritime Transport - July 2014
SPECIAL REPORT
Analysis of Lebanon’s Real Estate Sector - August 2014
REAL ESTATE MARKET GLOBAL POSITION
Source: Property Rights Alliance
21
Disclaimer:This material has been prepared by BankMed, sal based on publicly available information and personal analysis. It is provided for information purposes only. It is not intended to be used as a research tool nor as a basis or reference for any decision. The information contained herein including any opinion, news and analysis, is based on various publicly available sources believed to be reliable but its accuracy cannot be guaranteed and may be subject to change without notice. BankMed, sal does not guarantee the accuracy, timeliness, continued availability or completeness of such information. All data contained herein are indicative. Neither the information provided nor any opinion expressed therein, constitutes a solicitation, offer, personal recommendation or advice. BankMed, sal does not assume any liability for direct, indirect, incidental or consequential damages resulting from any use of the information contained herein.
Mazen Soueid, Stephanie Ghanem, Ziad Hariri, Nadine Yamout, Rita Nehme