analysis of fuel cell conference paper a fuel cell vehicle can benefit from being hybridized with an...
TRANSCRIPT

A national laboratory of the U.S. Department of EnergyOffice of Energy Efficiency & Renewable Energy
National Renewable Energy Laboratory Innovation for Our Energy Future
Analysis of Fuel Cell Hybridization and Implications for Energy Storage Devices June 2004 M. Zolot, T. Markel, and A. Pesaran
Presented at the 4th International Advanced Automotive Battery Conference San Francisco, California June 2–4, 2004
Conference Paper NREL/CP-540-36169 January 2007
NREL is operated by Midwest Research Institute ● Battelle Contract No. DE-AC36-99-GO10337

NOTICE
The submitted manuscript has been offered by an employee of the Midwest Research Institute (MRI), a contractor of the US Government under Contract No. DE-AC36-99GO10337. Accordingly, the US Government and MRI retain a nonexclusive royalty-free license to publish or reproduce the published form of this contribution, or allow others to do so, for US Government purposes.
This report was prepared as an account of work sponsored by an agency of the United States government. Neither the United States government nor any agency thereof, nor any of their employees, makes any warranty, express or implied, or assumes any legal liability or responsibility for the accuracy, completeness, or usefulness of any information, apparatus, product, or process disclosed, or represents that its use would not infringe privately owned rights. Reference herein to any specific commercial product, process, or service by trade name, trademark, manufacturer, or otherwise does not necessarily constitute or imply its endorsement, recommendation, or favoring by the United States government or any agency thereof. The views and opinions of authors expressed herein do not necessarily state or reflect those of the United States government or any agency thereof.
Available electronically at http://www.osti.gov/bridge
Available for a processing fee to U.S. Department of Energy and its contractors, in paper, from:
U.S. Department of Energy Office of Scientific and Technical Information P.O. Box 62 Oak Ridge, TN 37831-0062 phone: 865.576.8401 fax: 865.576.5728 email: mailto:[email protected]
Available for sale to the public, in paper, from: U.S. Department of Commerce National Technical Information Service 5285 Port Royal Road Springfield, VA 22161 phone: 800.553.6847 fax: 703.605.6900 email: [email protected] online ordering: http://www.ntis.gov/ordering.htm
Printed on paper containing at least 50% wastepaper, including 20% postconsumer waste
Analysis of Fuel Cell Vehicle Hybridization and Implications for Energy Storage Devices
Matthew Zolot, Tony Markel,
Ahmad A. Pesaran ([email protected]) National Renewable Energy Laboratory
1617 Cole Blvd. Golden, CO 80401
Abstract A fuel cell vehicle can benefit from being hybridized with an energy storage (ES) device (battery or ultracapacitor). The benefits could include improved vehicle performance and fuel economy and lower system cost. Previously, the degree of hybridization benefits from (a) fuel cell efficiency characteristics (b) fuel cell downsizing, (c) displacing fuel cell tasks with the ES functionality, or (d) energy recovery through regenerative braking were not well understood. To take advantage of these potential benefits, we must define the attributes of the ES system relative to the fuel cell. We have recently studied the role of batteries and ultracapacitors in hybrid fuel cell vehicles to understand their potential impact on fuel economy and performance. We also studied the impact of fuel cell performance and control strategy on the benefits of hybridization. This paper addresses (1) the impact of fuel cell efficiency characteristics on vehicle system efficiency; (2) the fuel economy trend that results from downsizing different fuel cells; and (3) the ES required to meet the performance requirements of midsize hybrid fuel cell cars. Introduction In recent years, hydrogen fuel cell vehicle technology has received considerable attention as a way to address the U.S. environmental and oil consumption/dependency issues. However, the cost, transient response, mass, and volume of fuel cell systems may present significant challenges that can be addressed via vehicle hybridization with electrochemical ES technologies. A fuel cell vehicle can benefit from being hybridized with an energy storage (ES) device, which assumes some of the roles the fuel cell would normally handle. It may increase fuel efficiency and improve vehicle performance. Each energy storage type has advantages and disadvantages—a battery has lower power and high energy storage capability; an ultracapacitor has higher power but relatively low energy storage. The ES systems in fuel cell hybrid vehicles offer the ability to: • Capture regenerative braking energy. • Enhance fuel economy. • Provide a more flexible operating strategy. • Overcome fuel cell cold-start and transient shortfalls. • Potentially lower the cost per unit power. Among the current pre-production hybrid fuel cell vehicles, the Toyota FCHV has a nickel-metal hydride ES system similar to that of the Toyota Prius [1], and the Honda FCX-V4 uses an ultracapacitor ES system that provides regenerative braking and power assist capability [2]. The Honda system apparently has a full-size fuel cell to meet all the vehicle’s load requirements. The ultracapacitor provides the fuel cell with power assist for short transients; its main function is to recover regenerative braking energy for improved fuel economy [2].
1

Studies [3-5] focused on maximizing fuel economy, and indicated that a large ES system with a small fuel cell system that operates in a primarily thermostatic mode (with some power following) provides the best design for maximum fuel economy. The fuel cell was assumed to be able to shut down and start up as needed; however, the associated energy penalty, cost, and packaging constraints were not considered. Markel et al. [5] indicate that hybridizing a fuel cell vehicle could compensate for the limited transient response capability of the fuel cell system and provide 50% fuel economy improvement over the fuel cell vehicle without an ES system. Currently, starting and stopping the fuel cell during the drive cycle is likely to require too much energy to be beneficial. The present control focus is a setup that does not shut down during the drive cycle, but stays on in a load following manner. However, the per-unit power cost of ES technology is currently less than that of fuel cells, and is expected to maintain a cost advantage during the next several years. Therefore, adding an ES system may lower the total cost of the fuel cell vehicle, especially if the ES supplants a downsized fuel cell’s functionality, instead of augmenting full-size fuel cell performance. Consequently, ES systems are expected to aid the transition of fuel cell vehicles from short-term limited use to long-term widespread commercial success. Markel et.al [6] studied the preliminary requirements of ES for a midsize car and midsize SUV, but several questions remained to be addressed. This paper is a continuation of our previous studies for a midsize car. Approach for the Current Study It is difficult to separate the impacts/benefits associated with using ES from those associated with downsizing the fuel cell. Downsizing by itself may improve fuel economy; ES by itself should increase fuel economy by enabling additional functionality such as capturing regenerative braking energy. In our current investigation, we consider the effect on fuel economy due to the shape of the fuel cell efficiency curve (first without, then with the required ES). Then we evaluate the effect on fuel economy of a full-size fuel cell versus a downsized one (first without, then with the required ES). The expectation is that as the fuel cell is downsized, if peak efficiency shifts closer to or further away from typical operating powers, the fuel economy will either increase or decrease. For this paper, the three main analyses cases are: 1. Create three fuel cell efficiency curves with peak efficiencies that occur at 10%, 25%, and
40% of peak power. No energy storage is used and the fuel cell system provides the entire load. The fuel economy performance is compared over various drive cycles. The results show that matching fuel cell characteristics and cycle power requirements is important for optimal fuel economy without downsizing.
2. To see the impact of downsizing on fuel economy, we analyzed a hybridized vehicle by
downsizing the three fuel cells in case 1, which shifts peak efficiency either toward or away from the typical operating point during various drive cycles. Now it is clear that the optimal amount of downsizing of the fuel cell system is related to the location of the peak efficiency point relative to peak power.
3. In the first two cases, operational limitations, such as power ramp rates and warm-up time,
were neglected. In this case, present day fuel cell performance and projected 2010 DOE performance targets [7] were simulated with an ideal ES device making up for any fuel cell performance limitations. Regenerative braking energy recovery is also included. This scenario enables evaluation of ES power and energy requirements for minimally controlled, load-following, fuel cell operation.
2

This paper extends previous studies to determine, from a requirements standpoint, how the fuel cell curve and operational details can impact fuel efficiency and energy storage options. The fuel cell and energy storage system demands under drive cycle and performance tests are analyzed for a midsize vehicle platform using ADVISORTM[8]. Several sizing scenarios are considered in detail. The purpose of this study is to support the FreedomCAR technical teams in defining energy storage requirements for fuel cell vehicles. Modeling Assumptions Based on the recommendations of the FreedomCAR energy storage technical team, we selected a midsize car for this study. The characteristics in Table 1 represent those of a typical conventional vehicle in this vehicle class. These characteristics will be applied to the fuel cell hybrid vehicle scenarios. This study will hold all vehicle masses to base mass (1480) plus cargo mass (136) totaling 1616 kg, to enable isolating specific fuel economy effects to those under consideration.
Table 1: Vehicle Assumptions. Assumption Description Units mid-size Car
Vehicle Description -- Front wheel drive mid-
size carBase Conventional Vehicle Mass kg 1480Base Vehicle Glider Mass kg 1060Base Conventional Powertrain Mass kg 420Cargo Mass kg 136Aero. Drag Coef. -- 0.3Frontal Area m^2 1.98Tire Size -- NREL: P205/65R15Rolling Resistance Type -- NREL: mediumVehicle Range km 664Weight Fraction (F/R) % 61/39 The vehicle performance constraints listed in Table 2 will be enforced to provide performance parity with the conventional vehicle. The only exception to holding the mass constant is during the grade test, which adds 272 kg for cargo carrying capability.
Table 2: Vehicle Performance Constraints.
Assumption Description Unitsmid-size
Car0-60 mph s 10.5Top Speed mph 100Grade @ 65mph for 20min. at Curb Mass + 408kg % >=6.5Drive Cycle Tolerance mph <=2 DOE’s Hydrogen, Fuel Cells & Infrastructure Technologies Program targets for fuel cell systems are provided in Tables 3. The fuel cell targets, data and models used in this analysis represent a pressurized hydrogen fuel cell system [7]. The basis for models with present-day performance and 2010 target performance are from Table 3.
3
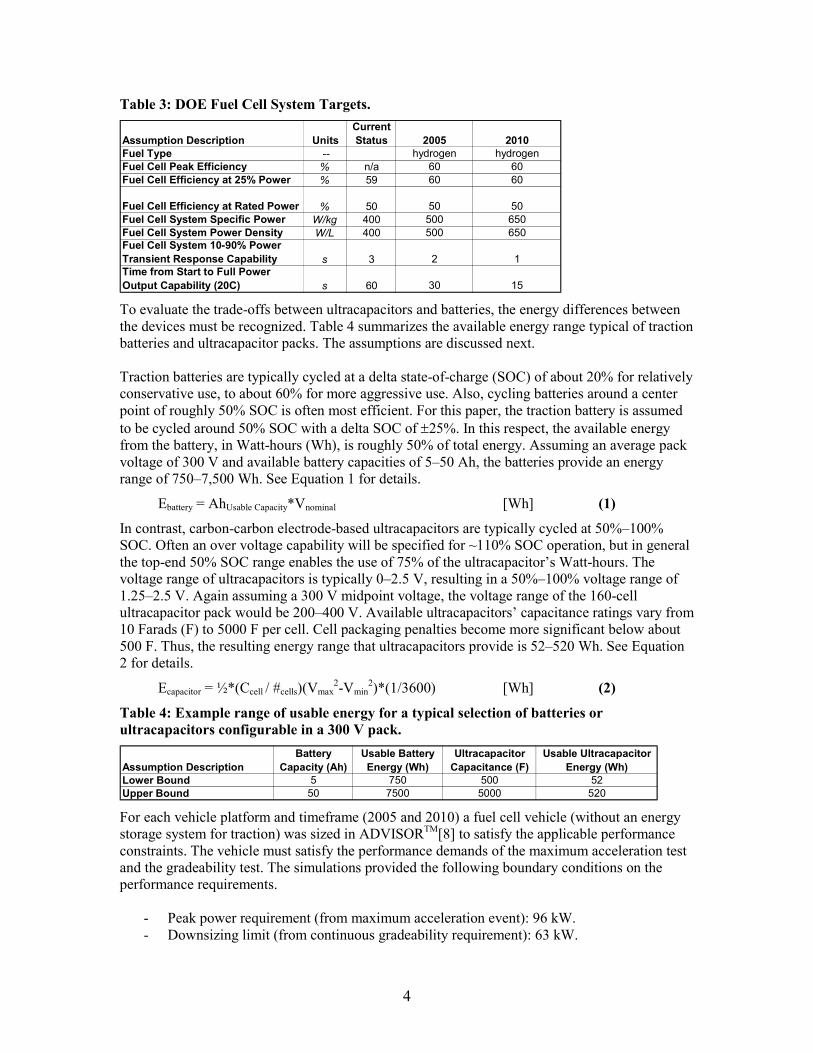
Table 3: DOE Fuel Cell System Targets.
Fuel Type -- hydrogen hydrogenFuel Cell Peak Efficiency % n/a 60 60Fuel Cell Efficiency at 25% Power % 59 60 60
Fuel Cell Efficiency at Rated Power % 50 50 50Fuel Cell System Specific Power W/kg 400 500 650Fuel Cell System Power Density W/L 400 500 650Fuel Cell System 10-90% Power Transient Response Capability s 3 2 1Time from Start to Full Power Output Capability (20C) s 60 30 15
Current Status 2005 2010Assumption Description Units
To evaluate the trade-offs between ultracapacitors and batteries, the energy differences between the devices must be recognized. Table 4 summarizes the available energy range typical of traction batteries and ultracapacitor packs. The assumptions are discussed next. Traction batteries are typically cycled at a delta state-of-charge (SOC) of about 20% for relatively conservative use, to about 60% for more aggressive use. Also, cycling batteries around a center point of roughly 50% SOC is often most efficient. For this paper, the traction battery is assumed to be cycled around 50% SOC with a delta SOC of ±25%. In this respect, the available energy from the battery, in Watt-hours (Wh), is roughly 50% of total energy. Assuming an average pack voltage of 300 V and available battery capacities of 5–50 Ah, the batteries provide an energy range of 750–7,500 Wh. See Equation 1 for details.
Ebattery = AhUsable Capacity*Vnominal [Wh] (1)
In contrast, carbon-carbon electrode-based ultracapacitors are typically cycled at 50%–100% SOC. Often an over voltage capability will be specified for ~110% SOC operation, but in general the top-end 50% SOC range enables the use of 75% of the ultracapacitor’s Watt-hours. The voltage range of ultracapacitors is typically 0–2.5 V, resulting in a 50%–100% voltage range of 1.25–2.5 V. Again assuming a 300 V midpoint voltage, the voltage range of the 160-cell ultracapacitor pack would be 200–400 V. Available ultracapacitors’ capacitance ratings vary from 10 Farads (F) to 5000 F per cell. Cell packaging penalties become more significant below about 500 F. Thus, the resulting energy range that ultracapacitors provide is 52–520 Wh. See Equation 2 for details.
Ecapacitor = ½*(Ccell / #cells)(Vmax2-Vmin
2)*(1/3600) [Wh] (2)
Table 4: Example range of usable energy for a typical selection of batteries or ultracapacitors configurable in a 300 V pack.
Assumption DescriptionBattery
Capacity (Ah)Usable Battery Energy (Wh)
Ultracapacitor Capacitance (F)
Usable Ultracapacitor Energy (Wh)
Lower Bound 5 750 500 52Upper Bound 50 7500 5000 520 For each vehicle platform and timeframe (2005 and 2010) a fuel cell vehicle (without an energy storage system for traction) was sized in ADVISORTM[8] to satisfy the applicable performance constraints. The vehicle must satisfy the performance demands of the maximum acceleration test and the gradeability test. The simulations provided the following boundary conditions on the performance requirements.
- Peak power requirement (from maximum acceleration event): 96 kW. - Downsizing limit (from continuous gradeability requirement): 63 kW.
4

Then the vehicles were simulated over the Urban Dynamometer Drive Schedule (UDDS), Highway (HWFET), and US06 drive cycles. Downsizing the fuel cell rated power was done in 11 kW increments from 96 kW to 85 kW, 74 kW, and 63 kW configurations. The power plant reductions lead to power and energy requirements for the energy storage system. However, compensating for the downsized fuel cell is only one of the many roles the energy storage system may play. Derived Fuel Cell System Efficiency Curves: The three fuel cell system characteristic efficiency curves used for this study are shown in Figure 1. Although we did not have access to experimental data from developers, these represent approximate variations in system efficiency predictions from models available in open literature [9-11]. The system efficiency represents the trade-offs between fuel cell stack efficiency and power/energy needs for the ancillary systems. Each is characterized by the fraction (%) of full power at which the peak efficiency occurs. The fuel cell efficiencies set points are based on the DOE technical targets: 60% maximum fuel cell system efficiency and 50% efficiency at rated fuel cell power. The rise to peak efficiency is modeled by an exponential equation [ηpeak*(1-e-P/τ)] similar to that of charging a capacitor. The fall in efficiency from the peak efficiency point to the maximum power point is modeled by a linear interpolation between two points (ηpeak = 60%, ηmax.power = 50%). The fundamental difference between these curves, which is based on the rise in efficiency from zero power to peak efficiency, is determined by the fuel cell system parasitic loads such as compressors and pumps [12]. Each curve represents a different trade-off between the fuel cell stack efficiency curve and the loss-power curve for balance of plant. The difference between these curves is at what load fraction the efficiency reaches the maximum point. Curve 2 corresponds to a system that satisfies the current DOE targets of 60% at 25% of rated power and 50% efficiency at rated power. Curve 1 represents a system in which the peak efficiency of 60% occurs at 10% of rated power and curve 3 represents one in which the peak occurs at 40% of peak power.
0
10
20
30
40
50
60
70
0 20 40 60 80Percentage of Peak Power (%)
Syst
em E
ffici
ency
(%)
100
Curve 1 - Peak Efficiency@ 10% Full Power
Curve 2 - Peak Efficiency@ 25% Full Power
Curve 3 - Peak Efficiency@ 40% Full Power
Fig. 1: Theoretical fuel cell system efficiency curves with varying peak efficiency points.
5

Case 1: Vehicle with a Full Size Fuel Cell System Figure 2 illustrates the simulated gasoline equivalent fuel economy over various drive cycles for the three fuel cell scenarios in a vehicle with a full size, 96 kW fuel cell. The fuel economy of the city and highway cycles is clearly influenced by the position of the fuel cell’s peak efficiency. The fuel economy influence on the US06, aggressive drive cycle, is not nearly as significant. Figures 3 and 4 help explain this trend.
Fig. 2: Vehicle fuel economy as a function of position of peak fuel cell efficiency (highway and city results on left, City/Highway combined and US06 results on right). Figure 3 shows the distribution of power required to drive the highway and city cycles. The data are presented as percent of operation in 5-kW power increments. Overlaid on these distributions are the three fuel cell efficiency curves (right axis). Clearly, as the average operating point (vertical, orange, dashed line) is tracked, the typical efficiency increases significantly from the 40% and 25% peak efficiency curves to the 10% peak curve. At any given operating power, higher fuel cell operating efficiency will result in higher vehicle fuel economy. Therefore, the fuel cell vehicle with the 10% peak efficiency obtains better fuel economy compared to the other fuel cell scenarios.
0
5
10
15
20
25
30
35
40
0 5 10 15 20 25 30 35 40 45 50 55 60 65 70 75 80 85 90 +
Discharge Power (kW)
0
10
20
30
40
50
60
70
Fuel
Cel
l Sys
tem
Effi
cien
cy (%
)
Highway Cycle
FC 10% P_Peak
FC 25% P_Peak
FC 40% P_Peak
Average Power 12.25 kW
% o
f Ope
ratio
n, H
ighw
ay C
ycle
05
101520253035404550
0 5 10 15 20 25 30 35 40 45 50 55 60 65 70 75 80 85 90 +
Discharge Power (kW)
% o
f Ope
ratio
n, C
ity C
ycle
0
10
20
30
40
50
60
70
City CycleFC 10% P_PeakFC 25% P_PeakFC 40% P_Peak
Average Power 6.96 kW
Fuel
Cel
l Sys
tem
Effi
cien
cy (%
)
Fig. 3: Distribution of traction power over the highway (left) and city (right) cycles; average cycle power is orange, dotted line. Fuel cell efficiency curves overlaid. A similar plot is shown for the US06 cycle in Figure 4. However, the US06 power profile is more widely spread from 0 to 96 kW. Thus, simplifying the typical fuel cell operating efficiencies by looking at the average power is less relevant during the US06 cycle. Additionally, the average
6

power point indicates the average fuel cell efficiencies between the three fuel cell curves are more evenly matched. During the US06, the fuel cells are operating at a relatively high average efficiency of around 55%, but the average operating power is significantly higher than the highway or city cycle. Consequently, the fuel use rate is higher for this cycle and the equivalent fuel economy is lower. The lower US06 fuel economy can be seen in Figure 2 - right versus Figure 2 - left.
02468
101214161820
0 5 10 15 20 25 30 35 40 45 50 55 60 65 70 75 80 85 90 +
Discharge Power (kW)
% o
f Ope
ratio
n, U
S06
Cyc
le
0
10
20
30
40
50
60
70
US06 CycleFC 10% P_PeakFC 25% P_PeakFC 40% P_Peak
Average Power 22.46 kW
Fuel
Cel
l Sys
tem
Effi
cien
cy (%
)
Fig. 4: Distribution of traction power over the US06 cycle; average cycle power is orange, dotted line. Fuel cell efficiency curves overlaid. Case 2: Vehicle with a Downsized Fuel Cell System In Case 2, the role of the battery is neglected (the fuel cell attempts to satisfy the entire traction demand without any defined roles for the battery), and the fuel economy across the highway, city, and US06 drive cycles are compared. Since the power command by these cycles can be met with a downsized fuel cell and virtually no battery assist, the battery roles need not be defined before evaluating the benefits just based on downsizing the fuel cell. As the fuel cells are downsized in 11-kW increments, the fuel economy trends for the various drive cycles are in Figures 5 and 6. Some of the results from these runs are straight-forward, such as a fuel economy increase was always observed during the UDDS cycle from downsizing the fuel cell. In all these circumstances, downsizing shifted the peak efficiency toward the typical UDDS operating powers (Figure 3 - right). Less obvious trends will be further examined next.
4045505560657075808590
96857463Fuel Cell Net Power Output (kW)
Fuel
Eco
nom
y (m
pgge
)
10%Peak,HWY 25%Peak, HWY 40% Peak, HWY
40
45
50
55
60
65
96857463Fuel Cell Net Power Output (kW)
Fuel
Eco
nom
y (m
pgge
)
10%Peak, UDDS 25%Peak, UDDS 40% Peak, UDDS Fig. 5: Highway (left) and city (right) vehicle fuel economy as related to downsizing fuel cell. Displayed for all three positions of peak fuel cell efficiency.
7

40
45
50
55
60
65
70
75
96857463Fuel Cell Net Power Output (kW)
Fuel
Eco
nom
y (m
pgge
)
10% Peak, Cty/Hwy Combo 25%Peak, Cty/Hwy Combo40% Peak, Cty/Hwy Combo
40
42
44
46
48
50
52
96857463Fuel Cell Net Power Output (kW)
Fuel
Eco
nom
y (m
pgge
)
10%Peak, US06 25%Peak, US06 40% Peak, US06 Fig. 6: Combined City/Highway (left) and US06 (right) vehicle fuel economy as related to downsizing fuel cell. Displayed for all three positions of peak fuel cell efficiency. Figure 7 shows the power profile details for two of the runs in Figure 5. The 10% peak fuel cell’s fuel economy is declining during the highway cycle because the efficiency curve is shifting away from the average operating point. However, during the city cycle, the fuel economy is increasing because the efficiency curve is shifting toward the average operating point. Overall, as seen in Figure 6, the fuel economy increases only slightly for the 10% peak fuel cell as it is downsized.
0
5
10
15
20
25
30
35
40
0 5 10 15 20 25 30 35 40 45 50 55 60 65 70 75 80 85 90 +
Discharge Power (kW)
% o
f Ope
ratio
n, H
ighw
ay C
ycle
0
10
20
30
40
50
60
70
Highway CycleFC 10% 96kWFC 10% 85kWFC 10% 74kWFC 10% 63kW
Average Power 12.25 kW
Fuel
Cel
l Sys
tem
Effi
cien
cy
05
101520253035404550
0 5 10 15 20 25 30 35 40 45 50 55 60 65 70 75 80 85 90 +Discharge Power (kW)
% o
f Ope
ratio
n, C
ity C
ycle
0
10
20
30
40
50
60
70
City CycleFC 10% 96kWFC 10% 85kWFC 10% 74kWFC 10% 63kW
Average Power 6.96 kW
Fuel
Cel
l Sys
tem
Effi
cien
cy (%
)
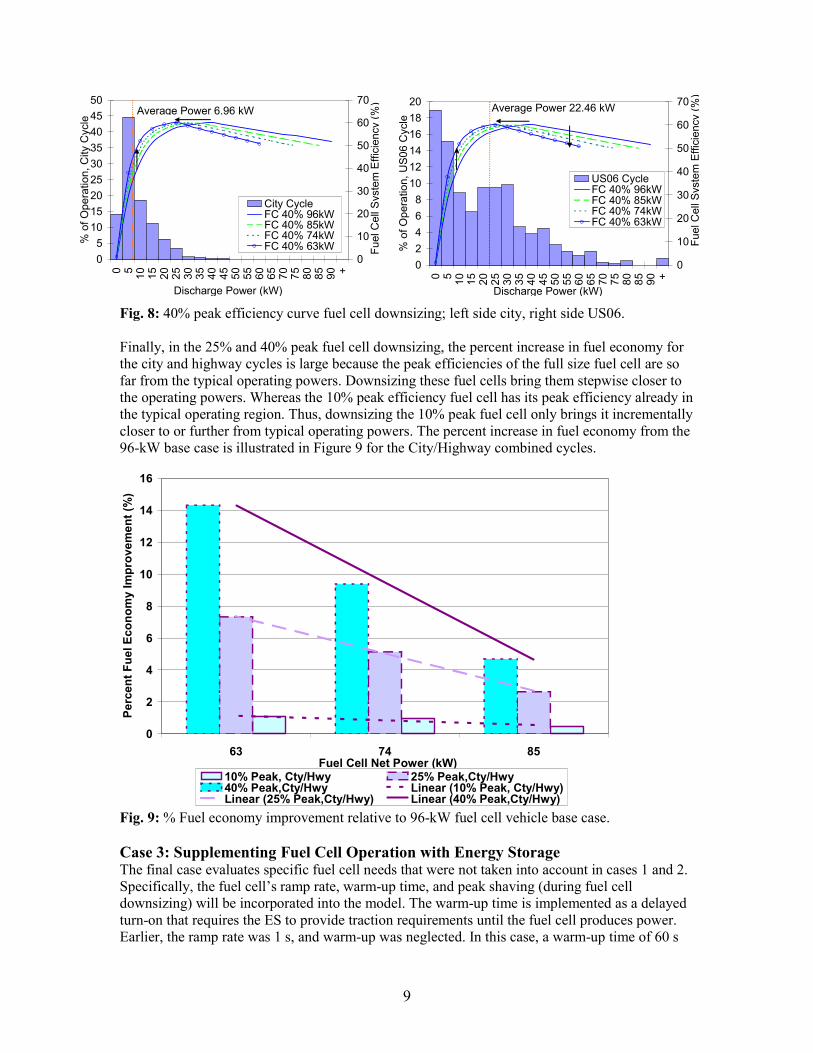
Fig. 7: 10% peak efficiency curve fuel cell downsizing; left side highway, right side city. The benefit of downsizing the 40% peak fuel cell is very strong according to both highway and city cycles (Figure 6, left). However, the US06 fuel economy curve (Figure 6, right) has mixed results with a downward parabolic shape for the 40% peak fuel cell. Figure 8 helps explain this result. During city driving (Figure 8, left) the peak efficiency point is shifting toward most of the operating points, so downsizing makes a positive contribution to fuel economy. Likewise, during the US06 cycle (Figure 8, right), the peak efficiency is shifting toward lower operating powers, which make up a big percentage of fuel cell operation. However, the peak efficiency point is also moving away from the higher operating powers. Although there is less high power operation, the fuel use rate is higher at high power output. Thus, the downsizing benefit for the US06 is a trade-off between the high power efficiency losses and the low power efficiency gains. This is also true for the 10% and 25% peak fuel cell configurations, but the benefit consistently outweighed the drawback for these scenarios.
8
05
101520253035404550
0 5 10 15 20 25 30 35 40 45 50 55 60 65 70 75 80 85 90 +
Discharge Power (kW)
% o
f Ope
ratio
n, C
ity C
ycle
0
10
20
30
40
50
60
70
City CycleFC 40% 96kWFC 40% 85kWFC 40% 74kWFC 40% 63kW
Average Power 6.96 kW
Fuel
Cel
l Sys
tem
Effi
cien
cy (%
)
02468
101214161820
0 5 10 15 20 25 30 35 40 45 50 55 60 65 70 75 80 85 90 +
Discharge Power (kW)
% o
f Ope
ratio
n, U
S06
Cyc
le
0
10
20
30
40
50
60
70
US06 CycleFC 40% 96kWFC 40% 85kWFC 40% 74kWFC 40% 63kW
Average Power 22.46 kW
Fuel
Cel
l Sys
tem
Effi
cien
cy (%
)
Fig. 8: 40% peak efficiency curve fuel cell downsizing; left side city, right side US06. Finally, in the 25% and 40% peak fuel cell downsizing, the percent increase in fuel economy for the city and highway cycles is large because the peak efficiencies of the full size fuel cell are so far from the typical operating powers. Downsizing these fuel cells bring them stepwise closer to the operating powers. Whereas the 10% peak efficiency fuel cell has its peak efficiency already in the typical operating region. Thus, downsizing the 10% peak fuel cell only brings it incrementally closer to or further from typical operating powers. The percent increase in fuel economy from the 96-kW base case is illustrated in Figure 9 for the City/Highway combined cycles.
0
2
4
6
8
10
12
14
16
857463Fuel Cell Net Power (kW)
Perc
ent F
uel E
cono
my
Impr
ovem
ent (
%)
10% Peak, Cty/Hwy 25% Peak,Cty/Hwy40% Peak,Cty/Hwy Linear (10% Peak, Cty/Hwy)Linear (25% Peak,Cty/Hwy) Linear (40% Peak,Cty/Hwy)
Fig. 9: % Fuel economy improvement relative to 96-kW fuel cell vehicle base case. Case 3: Supplementing Fuel Cell Operation with Energy Storage The final case evaluates specific fuel cell needs that were not taken into account in cases 1 and 2. Specifically, the fuel cell’s ramp rate, warm-up time, and peak shaving (during fuel cell downsizing) will be incorporated into the model. The warm-up time is implemented as a delayed turn-on that requires the ES to provide traction requirements until the fuel cell produces power. Earlier, the ramp rate was 1 s, and warm-up was neglected. In this case, a warm-up time of 60 s
9
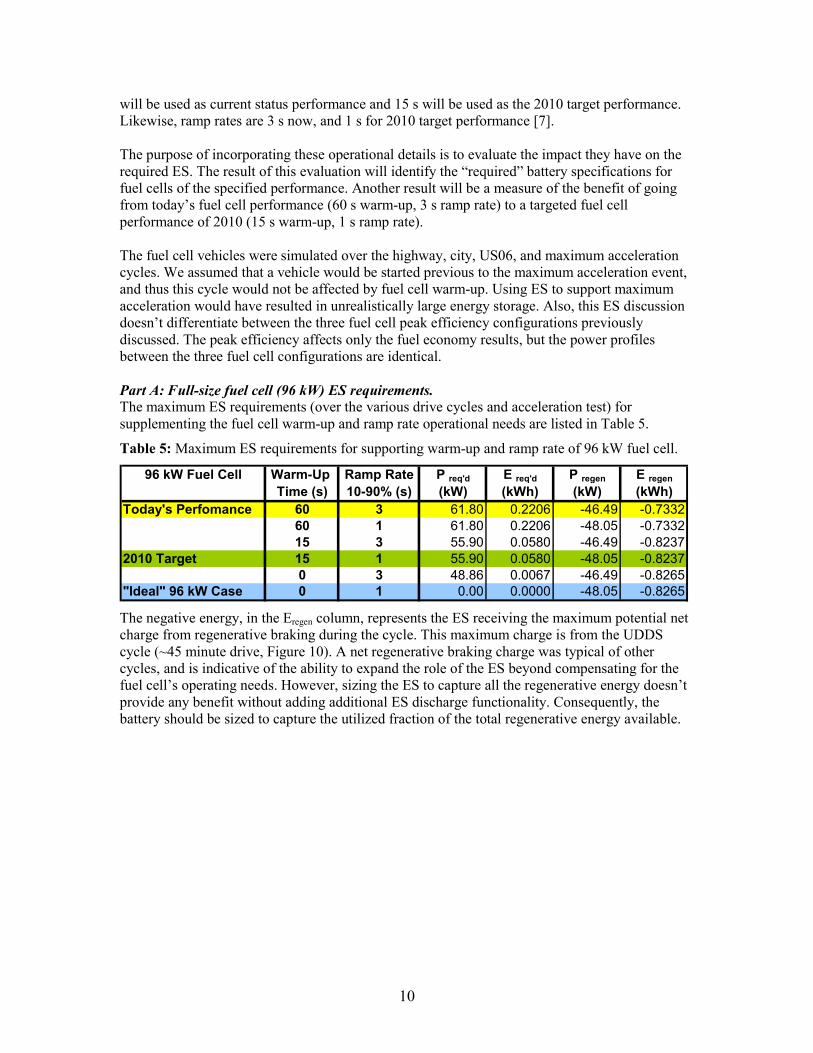
will be used as current status performance and 15 s will be used as the 2010 target performance. Likewise, ramp rates are 3 s now, and 1 s for 2010 target performance [7]. The purpose of incorporating these operational details is to evaluate the impact they have on the required ES. The result of this evaluation will identify the “required” battery specifications for fuel cells of the specified performance. Another result will be a measure of the benefit of going from today’s fuel cell performance (60 s warm-up, 3 s ramp rate) to a targeted fuel cell performance of 2010 (15 s warm-up, 1 s ramp rate). The fuel cell vehicles were simulated over the highway, city, US06, and maximum acceleration cycles. We assumed that a vehicle would be started previous to the maximum acceleration event, and thus this cycle would not be affected by fuel cell warm-up. Using ES to support maximum acceleration would have resulted in unrealistically large energy storage. Also, this ES discussion doesn’t differentiate between the three fuel cell peak efficiency configurations previously discussed. The peak efficiency affects only the fuel economy results, but the power profiles between the three fuel cell configurations are identical. Part A: Full-size fuel cell (96 kW) ES requirements. The maximum ES requirements (over the various drive cycles and acceleration test) for supplementing the fuel cell warm-up and ramp rate operational needs are listed in Table 5.
Table 5: Maximum ES requirements for supporting warm-up and ramp rate of 96 kW fuel cell.
96 kW Fuel Cell Warm-Up Ramp Rate P req'd E req'd P regen E regenTime (s) 10-90% (s) (kW) (kWh) (kW) (kWh)
Today's Perfomance 60 3 61.80 0.2206 -46.49 -0.733260 1 61.80 0.2206 -48.05 -0.733215 3 55.90 0.0580 -46.49 -0.8237
2010 Target 15 1 55.90 0.0580 -48.05 -0.82370 3 48.86 0.0067 -46.49 -0.8265
"Ideal" 96 kW Case 0 1 0.00 0.0000 -48.05 -0.8265 The negative energy, in the Eregen column, represents the ES receiving the maximum potential net charge from regenerative braking during the cycle. This maximum charge is from the UDDS cycle (~45 minute drive, Figure 10). A net regenerative braking charge was typical of other cycles, and is indicative of the ability to expand the role of the ES beyond compensating for the fuel cell’s operating needs. However, sizing the ES to capture all the regenerative energy doesn’t provide any benefit without adding additional ES discharge functionality. Consequently, the battery should be sized to capture the utilized fraction of the total regenerative energy available.
10
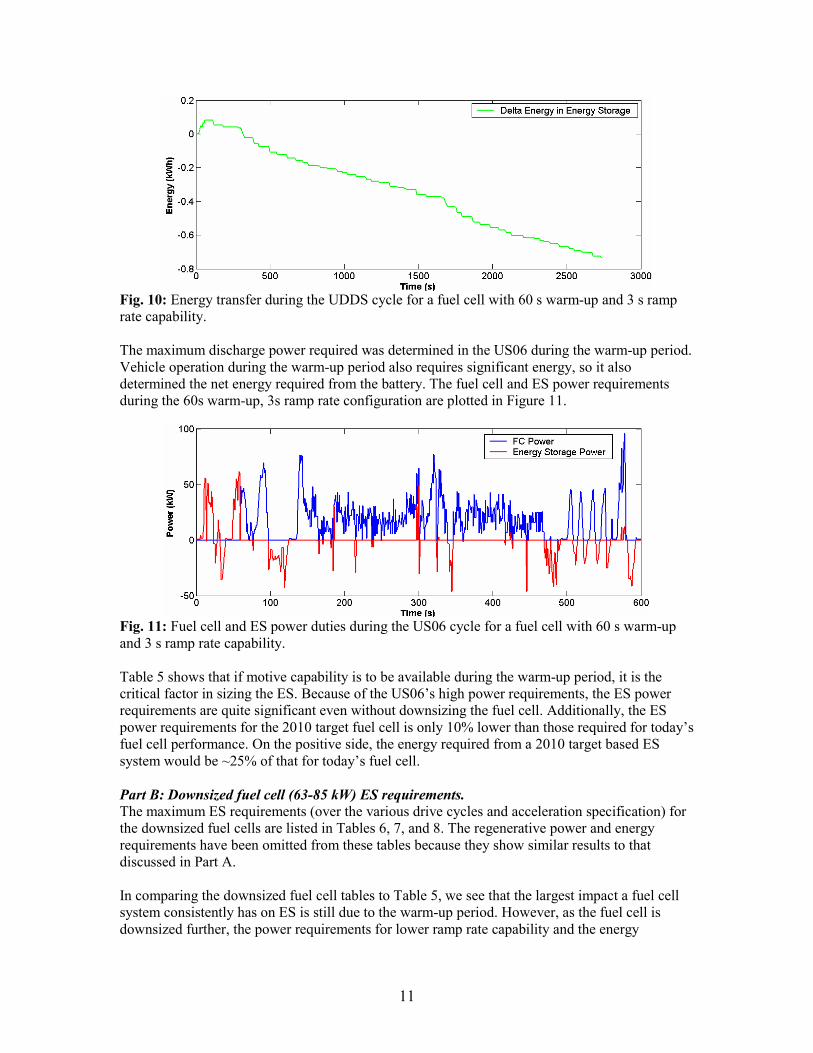
Fig. 10: Energy transfer during the UDDS cycle for a fuel cell with 60 s warm-up and 3 s ramp rate capability. The maximum discharge power required was determined in the US06 during the warm-up period. Vehicle operation during the warm-up period also requires significant energy, so it also determined the net energy required from the battery. The fuel cell and ES power requirements during the 60s warm-up, 3s ramp rate configuration are plotted in Figure 11.
Fig. 11: Fuel cell and ES power duties during the US06 cycle for a fuel cell with 60 s warm-up and 3 s ramp rate capability. Table 5 shows that if motive capability is to be available during the warm-up period, it is the critical factor in sizing the ES. Because of the US06’s high power requirements, the ES power requirements are quite significant even without downsizing the fuel cell. Additionally, the ES power requirements for the 2010 target fuel cell is only 10% lower than those required for today’s fuel cell performance. On the positive side, the energy required from a 2010 target based ES system would be ~25% of that for today’s fuel cell. Part B: Downsized fuel cell (63-85 kW) ES requirements. The maximum ES requirements (over the various drive cycles and acceleration specification) for the downsized fuel cells are listed in Tables 6, 7, and 8. The regenerative power and energy requirements have been omitted from these tables because they show similar results to that discussed in Part A. In comparing the downsized fuel cell tables to Table 5, we see that the largest impact a fuel cell system consistently has on ES is still due to the warm-up period. However, as the fuel cell is downsized further, the power requirements for lower ramp rate capability and the energy
11

requirements for maintaining acceleration performance also become limiting. These constraints will be further explored next.
Table 6: Maximum ES requirements for supporting warm-up and ramp rate of 85 kW fuel cell.
85 kW Fuel Cell Peak Shaving Warm-Up Ramp Rate P req'd E req'dFC Power (kW) Time (s) 10-90% (s) (kW) (kWh)
Today's Perfomance 85 60 3 61.80 0.220685 60 1 61.80 0.220685 15 3 55.90 0.0580
2010 Target 85 15 1 55.90 0.058085 0 3 52.53 0.0333
"Ideal" 85 kW Case 85 0 1 28.67 0.0243 Table 7: Maximum ES requirements for supporting warm-up and ramp rate of 74 kW fuel cell.
74 kW Fuel Cell Peak Shaving Warm-Up Ramp Rate P req'd E req'dFC Power (kW) Time (s) 10-90% (s) (kW) (kWh)
Today's Perfomance 74 60 3 61.80 0.220674 60 1 61.80 0.220674 15 3 56.20 0.0611
2010 Target 74 15 1 55.90 0.058074 0 3 56.20 0.0611
"Ideal" 74 kW Case 74 0 1 39.67 0.0499 Table 8: Maximum ES requirements for supporting warm-up and ramp rate of 63 kW fuel cell.
63 kW Fuel Cell Peak Shaving Warm-Up Ramp Rate P req'd E req'dFC Power (kW) Time (s) 10-90% (s) (kW) (kWh)
Today's Perfomance 63 60 3 61.80 0.220663 60 1 61.80 0.220663 15 3 59.90 0.0889
2010 Target 63 15 1 55.90 0.076663 0 3 59.90 0.0889
"Ideal" 63 kW Case 63 0 1 50.70 0.0766 The ramp rate capability has an immediate impact on the ES power requirements if you consider the “ideal” 0 s warm-up configurations. However, when being consistent with DOE performance targets, ramp rate capability starts to have an impact on ES requirements when the fuel cell is downsized to 74 kW with 15 s warm-up and 3 s ramp rate capability. The ES power requirement is increased due to peak transient requirements during the US06 cycle (Figure 12).
12

Fig. 12: ES peak ramp rate supplementation (circled) during the US06 cycle for the 74 kW, 15 s warm-up, 3 s ramp rate configuration. The net energy required from the ES starts to become significant during maximum acceleration. Figure 13 shows the power profile for the full-size 96 kW “ideal” fuel cell configuration (which alone achieves 0-60 mph in 10.5 s) compared to the power capability for the 74 kW, 15 s warm-up, 3 s ramp rate configuration. The energy required to maintain acceleration performance is obtained by integrating the difference between these two powers.
Fig. 13: ES peak ramp rate supplementation during the US06 cycle for the 74 kW, 15 s warm-up, 3 s ramp rate configuration. Just as in the full-size fuel cell configuration, the ES power requirements for the 2010 target fuel cell are only 10% lower than those required for today’s fuel cell performance. When the fuel cell is downsized, the energy required from a 2010 target based ES system could be as much as 40% of that required for today’s fuel cell. Another important conclusion to be drawn from Tables 5-8 is that we can evaluate which fuel cell configurations may require the use of a battery and which may require the use of an ultracapacitor as the ES solution. If the ES system is sized for the above requirements for discharge power and energy (not sized for maximum possible regenerative energy possibilities), the ultracapacitor energy capacities listed in Table 4 (0.052-0.520 kWh) will adequately address the net energy needs for supplementing FC operation (0.058-0.221 kWh). However, if all the regenerative energy is to be captured and more active ES roles implemented, the energy requirements may require large ultracapacitors or small Ah-capacity batteries. This will be further discussed in the next section.
13

Part C: Fuel cell operational details impact on fuel economy. Part A and Part B addressed the ES power and energy requirements imposed by the fuel cell’s operating performance (warm-up, ramp rate, net output power) over drive cycles and maximum acceleration duties. Part C addresses the change in fuel economy that results from the fuel cell’s operating performance. One drawback from this analysis is that only traction loads are supplemented during fuel cell warm-up. The fuel cell’s start-up parasitic loads are not characterized well enough for simulation. Overall, the fuel economy results from the simulations (Figure 14) show that the more the ES assisted the fuel cell, the better the vehicle’s fuel economy. The reason the 60-3 (60 s warm-up, 3 s ramp rate) configuration obtained the highest fuel economy is an artifact of our control method. Specifically, the ES assists only to fill in for fuel cells’ limitations. Since the 60-3 fuel cell has the most limitations, the ES is used more frequently for this configuration. In general, the higher fuel economy is a benefit from the “displaced-energy” the fuel cell no longer provides because the ES now provides it. This energy is ultimately supplied from regenerative braking. For example, the 60-3 fuel cell configuration was essentially off for 60 s of the cycles. In comparison, the instant-on fuel cell provided all traction needs, and thus consumed considerable hydrogen, during the first 60 s. The city cycle (Figure 14) shows less improvement (~1 mpg) because there is little traction activity during the initial 60 s. The trend between the 40%, 25%, and 10% peak efficiency fuel cells is consistent with the analysis in Case 1.
Fig. 14: Midsize car fuel economy for a 96 kW fuel cell as a function of position of peak fuel cell efficiency and for three fuel cell performances Similar results were observed when the fuel cells were downsized. The problem with the comparisons in Figure 14 is that the ES operation for the 60-3 fuel cell configuration makes it a “stronger” hybrid than the 0-1 configuration. Thus, the improved fuel efficiency is not a result of differences between the fuel cells, but from better use of the ES. A similar benefit could be realized for the 15-1 or 0-1 configurations with more active ES control.
14

The key differences between the ES benefit for the 60-3 configuration (today’s fuel cell) and the benefit for the 15-1 configuration (2010 target fuel cell) are:
(1) Fuel cells with less operational limitations may enable greater trade-offs between fuel economy and cost. Higher cost ES would be able to capture more regenerative energy and displace more fuel cell operation, resulting in higher fuel economy (increased fuel economy focus). Lower cost ES would have less energy storage, less capability to capture regenerative braking, and less capability to displace fuel cell operation, resulting in lower fuel economy (reduced cost focus).
(2) The implemented ES roles (control strategy) can be more flexibly defined if the fuel cell has less operational limitations. Choosing to supplement with ES assist during the highest fuel use rates may enable better fuel economy benefits versus tying ES assist to supplement fuel cell performance limitations.
The 15-1 fuel cell may enable greater trade-offs between fuel economy and cost because the ES requirements are less stringent (see tables in Parts A and B). The 15-1 fuel cell will enable more flexible ES control because the regenerative energy captured can be applied to assist the fuel cell at the most opportune times. Specifically, the fuel cell operating regions that should be avoided are (a) the low power, very low efficiency region, and (b) the high power, relatively low efficiency region (see Figure 15). The low power, very low efficiency region should be avoided to increase fuel cell operating efficiency. However, increasing fuel cell efficiency by raising the fuel cell’s minimum power operating point is challenging because it is easy to incidentally increasing the average power over a cycle. Increasing the average power over a cycle increases the average fuel use rate and lowers vehicle fuel economy. The relationship can be expressed in equation form:
Average Fuel Use Rate = avgFC
avgoutFCP,
,_η
Also, raising the minimum power operating point may require a larger ES system to store the excess energy and may have efficiency penalties for retrieving the energy at a later point in the drive cycle. Alternatively, avoiding fuel cell operation in the high power, relatively low efficiency region (Figure 15, right side) can improve fuel efficiency by lowering the average fuel consumption rate and improving the average fuel cell operating efficiency. However, the energy must come from a storage device with its associated efficiencies. This may be a more effective strategy if the stored energy is derived from regenerative braking. Overall, fuel economy can be optimized with a control strategy that adaptively avoids both of these regions, yet (1) maximizes average fuel cell operating efficiency while (2) minimizing average power (or average fuel use rate).
15

Curve 2 - Peak Efficiency @ 25% Full Power
0
10
20
30
40
50
60
70
0 20 40 60 80Percentage of Peak Power (%)
Syst
em E
ffici
ency
(%)
100
Fig. 15: Fuel cell operating regions that could be avoided with ES assist. Conclusions We investigated the effects of fuel cell system design to determine the impact on fuel efficiency for a fuel cell hybrid vehicle. A midsize car platform was used with present-day and 2010 target fuel cell performances, and constant vehicle mass was maintained to isolate single effects on fuel economy. Many influences can differentiate the benefits of one system design over another. The first set of analyses (Case 1) showed that the fuel cell system losses can significantly influence the vehicle’s fuel economy depending on drive cycle power distribution. The parasitics or auxiliaries and cell operating characteristics have an influence similar to a time constant, but actually create a system “power constant” for the balance-of-plant as the stack powers up. The design influences that can be concluded from Case 1 (vehicle with a full size fuel cell system) are:
- The fuel cell with peak efficiency at 10% rated power (Figure 1, curve 1) achieved the best combined city/highway fuel economy with +12% improvement over the 25% peak efficiency configuration (curve 2) and +32% improvement over the 40% peak efficiency configuration (curve 3).
- The fuel economies were within 5% of each other during the more aggressive US06 cycle for the three fuel cell configurations.
- The fuel cell with peak efficiency at 10% rated power (curve 1) achieved the highest fuel economy because its peak efficiency is better aligned with the power requirements from the city and highway cycle.
The second set of analyses (Case 2) showed that the shape of the efficiency curve should be considered in how a fuel cell is downsized. The benefit can range from minimal to significant, depending on this characteristic. The design influences that can be concluded from Case 2 (vehicle with a downsized fuel cell system) are:
- Downsizing the fuel cell configuration represented by curve 1 results in the least potential fuel economy improvement (combined city/highway) with as much as 1.0% improvement
16

from shifting the efficiency curve. US06 fuel economy declined as much as 3.6% from downsizing.
- Downsizing the fuel cell configuration represented by curve 2 results in a moderate potential fuel economy improvement (combined city/highway) with as much as 7.3% improvement from shifting the efficiency curve. US06 fuel economy declined as much as 3.2% from downsizing.
- Downsizing the fuel cell configuration represented by curve 3 results in a moderate to significant potential fuel economy improvement (combined city/highway) with as much as 14.3% improvement from shifting the efficiency curve. US06 fuel economy changed by less than 1.0% from downsizing.
- Ultimately, downsizing leads to improvements of as much as 15% higher fuel economy when the peak efficiency characteristic is shifted to better align with the power requirements from a given cycle.
Case 3 looked at limited ES roles (regenerative energy recapture, and ES assist based on fuel cell warmup, ramp rate, and peak shaving above rated fuel cell power) to supplement specific fuel cell performance limitations. With these limited roles, the design influences that can be concluded from Case 3 (supplementing fuel cell operation with energy storage) are:
- The midsize car ES system requirements in this study ranged from 30 to 62 kW and 0.0 to 0.22 kWh.
- Ultracapacitor ES solutions are well suited to these power and energy requirements. - Fuel economy improved as much as 5% more (in addition to fuel cell downsizing
improvement) with these limited ES roles. - Capturing a higher percentage of regenerative braking and performing more active ES
control should lead to additional fuel economy gains. We feel that the roles in this study are similar to Honda’s efforts to supplement fuel cell performance in its prototype fuel cell vehicle (FCX-V4) [13]. Toyota’s fuel cell hybridization approach seems to be to capture and use more regenerative brake energy to gain more active ES control [14]. More research is needed to evaluate the costs and benefits of capturing and using more regenerative brake energy to gain more active ES control. Specifically, two questions need to be addressed: (1) Will net ES power and energy requirements increase substantially with more active control, or will ES requirements be maintained, but used more efficiently? and (2) How much more can fuel economy be improved with active ES control? References 1. Yamaguchi, J. “Leading the Way: Fuel Cell Vehicles from Toyota and Honda Are Hitting the
Streets for Customer Use in Both Japan and U.S.” Automotive Engineering International. March 2003. pp. 54-58.
2. Tamernori, K, Oki, N, Kato, S., and Yamamoto, K. “Application Studies of Electric Double Layer Capacitor System, for Fuel Cell Vehicles.” Third International Advanced Automotive Battery Conference, Nice, France, June 10-13-, 2003.
3. Wipke, K.; Markel, T.; Nelson, D. “Optimizing Energy Management Strategy and Degree of Hybridization for a Hydrogen Fuel Cell SUV.” Proceedings of 18th Electric Vehicle Symposium. Berlin, Germany. October 2001.
4. Markel, T.; Wipke, K. “Optimization Techniques for Hybrid Electric Vehicle Analysis Using ADVISOR.” Proceedings of the ASME International Mechanical Engineering Congress and Exposition. New York, New York. November 11-16, 2001.
17

5. Markel, T.; Wipke, K.; Nelson, D. “Vehicle System Impacts of Fuel Cell System Power Response Capability.” SAE Publication 2002-01-1959. Presented at 2002 SAE FutureCar Congress. June 2002.
6. Markel, T, Zolot, M, Wipke, K, Pesaran, A. “Energy Storage Requirements for Hybrid Fuel Cell Vehicles.” Third International Advanced Automotive Battery Conference, Nice, France, June 10-13, 2003.
7. DOE-EERE Hydrogen, Fuel Cells & Infrastructure Technologies Program. “Multi-Year Research, Development and Demonstration Plan” http://www.eere.energy.gov/hydrogenandfuelcells/mypp/.
8. Markel, T., Brooker, A., Hendricks, T., Johnson, V., Kelly, K., Kramer, B., O’Keefe, M., Sprik, S., Wipke, K. “ADVISOR: a systems analysis tool for advanced vehicle modeling.” Journal of Power Sources, Volume 110, Issue 2:22, August 2002, pp. 255-266.
9. Edwards, R., Griesemann, J-C., Larivé, J-F., Mahieu, V. “Well-toWheels Analysis of Future Automotive Fuels and Powertrains in the European Context—Tank-to-Wheels Report” http://ies.jrc.cec.eu.int/Download/eh, December, 2003.
10. Eggert, A. Friedman, D., Ramaswamy, S., Hauer, K., Cunningham, J., Moore, R. “Simulated Performance of an Indirect Methonal Fuel Cell System.” Paper number 2001-01-0544, SAE 2001 Word Congress, Detroit, MI, March 5-8, 2001.
11. Pischinger, S., Schonfelder, C., Bornscheuer, W., Kindl, H., Wiartalla, A. “Integrated Air Supply and Humidification Concepts for Fuel Cell Systems.” Paper number 2001-01-0233, SAE 2001 Word Congress, Detroit, MI, March 5-8, 2001.
12. Susai, T., Kawakami, A., Hamada, A., Miyake, Y., Azegami, Y. “Development of a 1 kW polymer electrolyte fuel cell power source” Journal of Power Sources, 2001.
13. Ohkawa, A. “Electric Power Control System for a Fuel Cell Vehicle Employing Electric Double-Layer Capacitor.” Paper number 2004-01-1006, SAE 2004 Word Congress, Detroit, MI, March 8-11, 2004.
14. Ishikawa, T., Hamaguchi, S., Shimizu, T., Yano, T., Sasaki, S. “Development of Next Generation Fuel-Cell Hybrid System - Consideration of High Voltage System.” Paper number 2004-01-1304, SAE 2004 Word Congress, Detroit, MI, March 8-11, 2004.
Acknowledgments This work was sponsored by U.S. Department of Energy’s Office of FreedomCAR and Vehicle Technologies. We wish to thank Tien Duong (DOE Energy Storage technology manager), Lee Slezak (DOE Vehicle Systems technology manager), and Terry Penney (NREL technology manager) for their support. Members of FreedomCAR Energy Storage Technical Team Ted Miller (from Ford), Harshad Tataria (from General Motors), and Cyrus Ashtiani (from DaimlerChrysler) provided guidance.
18

REPORT DOCUMENTATION PAGE Form Approved OMB No. 0704-0188
The public reporting burden for this collection of information is estimated to average 1 hour per response, including the time for reviewing instructions, searching existing data sources, gathering and maintaining the data needed, and completing and reviewing the collection of information. Send comments regarding this burden estimate or any other aspect of this collection of information, including suggestions for reducing the burden, to Department of Defense, Executive Services and Communications Directorate (0704-0188). Respondents should be aware that notwithstanding any other provision of law, no person shall be subject to any penalty for failing to comply with a collection of information if it does not display a currently valid OMB control number. PLEASE DO NOT RETURN YOUR FORM TO THE ABOVE ORGANIZATION. 1. REPORT DATE (DD-MM-YYYY)
January 2007 2. REPORT TYPE
Conference paper 3. DATES COVERED (From - To)
June 2004 5a. CONTRACT NUMBER
DE-AC36-99-GO10337
5b. GRANT NUMBER
4. TITLE AND SUBTITLE Analysis of Fuel Cell Hybridization and Implications for Energy Storage Devices
5c. PROGRAM ELEMENT NUMBER
5d. PROJECT NUMBER NREL/CP-540-36169
5e. TASK NUMBER FC07.6000
6. AUTHOR(S) M. Zolot, T. Markel, and A. Pesaran
5f. WORK UNIT NUMBER
7. PERFORMING ORGANIZATION NAME(S) AND ADDRESS(ES) National Renewable Energy Laboratory 1617 Cole Blvd. Golden, CO 80401-3393
8. PERFORMING ORGANIZATION REPORT NUMBER NREL/CP-540-36169
10. SPONSOR/MONITOR'S ACRONYM(S) NREL
9. SPONSORING/MONITORING AGENCY NAME(S) AND ADDRESS(ES)
11. SPONSORING/MONITORING AGENCY REPORT NUMBER
12. DISTRIBUTION AVAILABILITY STATEMENT National Technical Information Service U.S. Department of Commerce 5285 Port Royal Road Springfield, VA 22161
13. SUPPLEMENTARY NOTES
14. ABSTRACT (Maximum 200 Words) This paper addresses the impact of fuel efficiency characteristics on vehicle system efficiency, fuel economy from downsizing different fuel cells, as well as the energy storage system.
15. SUBJECT TERMS fuel cell vehicles; fuel efficiency; fuel economy; vehicle energy storage systems
16. SECURITY CLASSIFICATION OF: 19a. NAME OF RESPONSIBLE PERSON a. REPORT
Unclassified b. ABSTRACT Unclassified
c. THIS PAGE Unclassified
17. LIMITATION OF ABSTRACT
UL
18. NUMBER OF PAGES
19b. TELEPONE NUMBER (Include area code)
Standard Form 298 (Rev. 8/98) Prescribed by ANSI Std. Z39.18