analysing trends in indian households’ potential to save
TRANSCRIPT
Dvara Research | Research Brief | January 2021
Analysing Trends in Indian Households’ Potential to Save
Summary:
Saving is an essential component of financial planning for households. It can help them cope with risks and emergencies, plan for life-cycle goals, and capture opportunities through investments in business and human capital. In this research brief, we use the income and expenditure data from the Centre for Monitoring Indian Economy (CMIE) to study the formal savings potential of the households over a period of six years, from January 2014 to December 2019. We define the formal savings potential as the surplus that is left with households after meeting all their monthly expenditure.2 We find that 75-80% of the households manage a surplus rate3 of almost 38.2% in India, which has been, on an average, increasing over time, unlike the household savings rate4 of the country. We argue that to increase the savings rate of the country, it is important to channelise this formal savings potential into formal savings instruments. We also map the differences in the formal savings potential of households across regions (urban/rural), income quintiles, and states.
About Household Finance Research Initiative:
Dvara Research’s Household Finance Research initiative aims to rigorously understand the financial choices and decisions of low-income or excluded individuals and households, and their relation to achieving households’ objectives. It has been our consistent endeavour to study financial inclusion as a gateway to a suite of appropriate financial services eventually enabling well-rounded household balance sheets and consumer financial well-being.
We believe that careful research and a comprehensive body of evidence can powerfully inform market practices and the design of financial sector policy to deliver comprehensive financial services for all individuals, households, and enterprises, and eventually serve to create a safe environment in which formerly excluded populations may fully experience the benefits of financial inclusion. This research initiative seeks to significantly expand the scope of India-specific and policy-focused household finance research that is timely and relevant to current financial sector development.
Introduc�on
The Code on Social Security Bill, 2019 [“the Bill”], introduced in Parliament in December 2019, is the most recent a�empt to ra�onalise patchwork of social security legisla�on into a comprehensive Code. One of the key differences between the 2019 Bill and the versions in 2018 and 2017 is the chapter on unorganised sector workers. Earlier versions of the Bill provided for equal social security benefits for all categories of workers. However, the 2019 Bill treats informal sector workers as a separate category and provides that the government will frame schemes for their welfare.
As we have noted in our comments to the Ministry of Labour in 2019,2 there is a lack of clarity on who informal sector workers are, meaning that there is a further lack of clarity on whom the interven�ons target. Further, it is unclear why informal sector workers are treated as a separate class from organised sector workers, or why informal sector workers receive far less protec�on under the Statute. Under the Bill, welfare for unorganised sector workers is to be provided by schemes designed by the Central or State governments, while formal sector workers have clear en�tlements to provident fund, gratuity, employees’ state insurance and maternity benefits. This is deeply problema�c, as informal sector workers comprise more than 75% of the workforce.3There is an urgent need to evaluate the structure of social security available to unorganised workers.
In this policy brief, we discuss:
i. The many defini�ons of informal sector workers, and whether social security should be universal ii. Unorganised workers in the Code on Social Security Bill, 2019 iii. Design principles for social security interven�ons by the state and the private sector.
1. Who is an Informal Sector Worker?
The following defini�ons in the Bill are of interest.
• S. 2(35): "gig worker" means a person who performs work or participates in a work arrangement and earns from such activities outside of traditional employer-employee relationship;
• S. 2(77): "unorganised sector" means an enterprise owned by individuals or self-employed workers and engaged in the production or sale of goods or providing service of any kind whatsoever, and where the enterprise employs workers, the number of such workers is less than ten;
• S. 2 (82) "wage worker" means a person employed for remuneration in the unorganised sector, directly by an employer or through any contractor, irrespective of place of work, whether exclusively for one employer or for one or more employers, whether in cash or in kind, whether as a home-based worker, or as a temporary or casual worker, or as a migrant worker, or workers employed by households including domestic workers, with a monthly wage of an amount as may be notified by the Central Government and State Government, as the case may be.
S. 113 allows persons to self-iden�fy as unorganised sector workers.
• The Na�onal Commission for Enterprises in the Unorganised Sector (2007)4proposed two defini�ons for unorganised sector workers. These are as follows:
o "The unorganised sector consists of all unincorporated private enterprises owned by individuals or households engaged in the sale and production of goods and services operated on a proprietary or partnership basis and with less than ten total workers".
o “Unorganised workers consist of those working in the unorganised enterprises or households, excluding regular workers with social security benefits, and the workers in the formal sector without any employment/ social security benefits provided by the employers".
Based on these defini�ons, the NCEUS found that about 86% of India’s workforce in 2004-05 would fall within the unorganised sector.
• The Periodic Labour Force Survey 2017-18 (PLFS) relies on the defini�ons by the 17th Interna�onal Conference of Labour Sta�s�cians for workers in the informal sector. The report lists some categories of informal workers, including:
o own-account workers and employers who have their own informal sector enterprises; o contributing family workers, irrespective of whether they work in formal or informal sector
enterprises;o employees who have informal jobs … whether employed by formal sector enterprises, informal
sector enterprises, or as paid domestic workers by households;o members of informal producers‟ cooperatives; ando persons engaged in the own-account production of goods exclusively for own final use by their
household, such as subsistence farming or do-it-yourself construction of own dwellings.5
The PLFS also considered only proprietorships and partnerships as informal sector enterprises.
• The ILO Recommenda�on No. 202 defines the informal economy as covering “all economic activities by workers and economic units that are – in law or in practice – not covered or insufficiently covered by formal arrangement.” The Recommendation also clarifies that “informal work may be found across all sectors of the economy, in both public and private spaces.”
We note that the Bill classifies informal sector enterprises by size of the establishment, rather than in terms of access to social security. This defini�on may leave out many workers from statutory social protec�on measures. According to the PLFS 2017-18, only 22.8% of Indian workers are in regular wage or salaried employment. 52.2% are self-employed, while 24.9% are in casual labour. The PLFS notes that 68.4% of workers employed outside of agriculture are employed in these informal sector enterprises. Further, 71% of regular wage employees have no wri�en job contract, while 49.6% of regular wage employees were not eligible for any form of social security. Restric�ng social protec�on measures only to those in informal sector enterprises, as defined in the Bill, would leave many workers out of coverage. Moreover, it is unclear why the Bill carves out gig workers and pla�orm workers as a separate category from informal sector workers.
We further note that terms “informal sector worker” does not encompass all those in need of social protec�on. The PLFS found that about 9% of workers were unemployed. Further, India has an old age dependency ra�o of around 9.3%, which is likely to increase to 12.4% by 2026.6 Many others may not be in the workforce for reasons of age, disability, or the need to provide unpaid care work at home. There is a need to include all these classes of individuals within the protec�on of a formal social security net. We therefore propose that any social security floor be made universally applicable to all persons.7
2. Informal Sector Workers Under the Code For Social Security Bill, 2019
S. 109 of the Bill reads:(1) The Central Government shall formulate and notify, from time to time, suitable welfare schemes
for unorganised workers (including audio visual workers, beedi workers, non-coal workers) on matters relating to— (i) life and disability cover; (ii) health and maternity benefits; (iii) old age protection; (iv) education; (v) housing; and (vi) any other benefit as may be determined by the Central Government.
(2) The State Government shall formulate and notify, from time to time, suitable welfare schemes for unorganised workers, including schemes relating to— (i) provident fund; (ii) employment injury benefit; (iii) housing; (iv) educational schemes for children; (v) skill upgradation of workers; (vi) funeral assistance; and (vii) old age homes.
Unlike the 2018 Dra�, the present Bill does not treat unorganised and organised sector workers in exactly the same way. Instead, while organised sector workers are covered under the chapters on provident fund, employees’ state insurance, gratuity, old age and maternity benefits, unorganised workers are only provided for under Chapter VII.
Chapter VII is based on the Unorganised Workers Social Security Act, 2008 (“UWSSA”). As with the UWSSA, the Bill does not provide for content of the rights referred to in S. 109. Rather, these are le� to the discre�on of the execu�ve, which is to frame schemes.
This is problema�c – schemes do not provide for jus�ciable rights which ci�zens can enforce in court. Further, they may be modified at any �me, at the discre�on of the government, and even to the detriment of the end
beneficiary.8 Moreover, since schemes cannot be enforced in Court, their implementa�on depends on the availability of funds from the government. As reports have shown, the budget alloca�ons for schemes vary wildly from year to year,9meaning that the implementa�on of many important schemes is haphazard at best. Further, while the Bill provides for self-iden�fica�on as an unorganised sector worker in s. 113, it does not clarify what the implica�ons of such registra�on – or the failure to do so – might be.
Finally, the Bill does not envisage any role for the employer (except in the case of pla�orm workers in s. 114). This is problema�c, as it may mean that employers do not take responsibility for social security of their workers by keeping them in casual work arrangements. We note that the Contract Labour (Regula�on and Aboli�on) Act, 1970 only applies to establishments with more than 20 workers and does not apply where work is of an “intermi�ent” or “casual nature.” Where work is contracted out to contractors and sub-contractors, it could become impossible to ascertain where the liability for workers’ welfare may lie.
In sum, we iden�fy three key concerns with the Bill in its present form:
1. The Bill does not elaborate on the content of social security rights for the informal sector. Instead, it leaves this to the discre�on of the government. This in turn means that there is li�le certainty on what ci�zens may be en�tled to. Moreover, the government schemes referred to do not confer any jus�ciable rights on ci�zens.
2. This means that there is a stark difference in the types of rights formal sector workers receive and those available to informal sector workers. In this respect, the Bill is not an improvement over the Unorganised Workers Social Security Act, 2008.
3. There is a need to envisage a framework that assigns responsibility to different en��es – such as employers and contractors – in providing and delivering social security to workers. This is par�cularly relevant for those in the formal sector.
3. Designing Social Security Floors For IndiaA. Social Security Provided by the Government
As noted above, there is a need for social protec�ons to be made available universally, and not only to informal sector workers. A number of rights, including the right to health,10 shelter,11 and old-age pensions12 have been read into the right to life under Ar�cle 21 of the Cons�tu�on. Further, the Direc�ve Principles require the State to provide for the right to work,13 just and humane condi�ons of work14 and a living wage15.
Many interna�onal instruments also relate to the need to provide for social security and basic economic rights to ci�zens. The Interna�onal Labour Organisa�on’s Recommenda�on No. 202 on Basic Social Security Floors and Recommenda�on No. 204 on the Transi�on from the Informal to the Formal Economy both refer to the need to put systems in place to protect the needs of informal sector workers. Further, the UN Sustainable Goal No. 8
refers expressly to “full and produc�ve employment and decent work for all.”16
To give effect to these obliga�ons, it is necessary for the state to put social security mechanisms in place. We refrain from making any specific recommenda�ons with respect to the content of the social security floor to be provided by the government. Further research is required to evaluate the needs of those outside formal social security nets and how this should be delivered. However, we suggest the following design principles for a state-provided social security floor:
1. Floor level social protec�ons should be made available to all persons and not only those in the workforce.
2. The social security tools available to those in the formal sector may not be appropriate for all persons. Instruments such as PF or Employees’ State Insurance require regular payment of contribu�ons from wages and a lack of liquidity. These may not be appropriate for those workers with seasonal occupa�ons or those who earn much less than minimum wage.
3. Par�cular a�en�on must be paid to providing basic income security. The Code on Wages, 2019 provides that minimum wages are to be determined by skill and geographical region,17 not by consump�on requirements of individuals. As the PLFS highlights, many workers earn far less than the na�onal floor level minimum wage of Rs. 176.18There is, therefore, an urgent need to ensure that the social security floor provides enough income security for persons to meet their consump�on requirements.
4. There is a need for both clarity and certainty in en�tlements due to persons. As set out above, this can be provided by ensuring that social security floors are enshrined in statutes that set out basic en�tlements. Some ma�ers, such as the rupee amount of a transfer or the delivery architecture for a payment, may be determined by subordinate legisla�on. However, the content of social security rights must be set out in statute.
5. Any social security policy must account for migra�on within India and the need for workers to be able to access benefits in different states. We note that the Bill does not make any express reference to migrant workers, nor any reference to the Inter-State Migrant Workers Act, 1979. This must be remedied and clear guidelines framed for migrant workers’ access to benefits.
6. There must be a simple and accessible grievance redressal mechanism available to persons.
7. There may be a need to s�pulate mandatory contribu�ons by the employer and employee for social security. These contribu�ons must take the vola�le and seasonal nature of informal sector work into account and allow for flexibility in payments.
1Authors work with Dvara Research. Corresponding author’s email: [email protected] expenditure includes loan repayment and premium paid on any insurance3Surplus rate is the share of surplus—after all expenses are incurred—in the household income, i.e. the share of income that can be potentially parked in one or more formal savings instruments. We use surplus rate interchangeably with formal savings potential in this paper4Household savings is a component of a country’s gross savings; it is a sum of investment by households in both financial and physical assets
Niyati Agrawal & Rakshith S Ponnathpur1, Household Finance Research Initiative, Dvara Research

01
Introduc�on
The Code on Social Security Bill, 2019 [“the Bill”], introduced in Parliament in December 2019, is the most recent a�empt to ra�onalise patchwork of social security legisla�on into a comprehensive Code. One of the key differences between the 2019 Bill and the versions in 2018 and 2017 is the chapter on unorganised sector workers. Earlier versions of the Bill provided for equal social security benefits for all categories of workers. However, the 2019 Bill treats informal sector workers as a separate category and provides that the government will frame schemes for their welfare.
As we have noted in our comments to the Ministry of Labour in 2019,2 there is a lack of clarity on who informal sector workers are, meaning that there is a further lack of clarity on whom the interven�ons target. Further, it is unclear why informal sector workers are treated as a separate class from organised sector workers, or why informal sector workers receive far less protec�on under the Statute. Under the Bill, welfare for unorganised sector workers is to be provided by schemes designed by the Central or State governments, while formal sector workers have clear en�tlements to provident fund, gratuity, employees’ state insurance and maternity benefits. This is deeply problema�c, as informal sector workers comprise more than 75% of the workforce.3There is an urgent need to evaluate the structure of social security available to unorganised workers.
In this policy brief, we discuss:
i. The many defini�ons of informal sector workers, and whether social security should be universal ii. Unorganised workers in the Code on Social Security Bill, 2019 iii. Design principles for social security interven�ons by the state and the private sector.
1. Who is an Informal Sector Worker?
The following defini�ons in the Bill are of interest.
• S. 2(35): "gig worker" means a person who performs work or participates in a work arrangement and earns from such activities outside of traditional employer-employee relationship;
• S. 2(77): "unorganised sector" means an enterprise owned by individuals or self-employed workers and engaged in the production or sale of goods or providing service of any kind whatsoever, and where the enterprise employs workers, the number of such workers is less than ten;
• S. 2 (82) "wage worker" means a person employed for remuneration in the unorganised sector, directly by an employer or through any contractor, irrespective of place of work, whether exclusively for one employer or for one or more employers, whether in cash or in kind, whether as a home-based worker, or as a temporary or casual worker, or as a migrant worker, or workers employed by households including domestic workers, with a monthly wage of an amount as may be notified by the Central Government and State Government, as the case may be.
S. 113 allows persons to self-iden�fy as unorganised sector workers.
• The Na�onal Commission for Enterprises in the Unorganised Sector (2007)4proposed two defini�ons for unorganised sector workers. These are as follows:
o "The unorganised sector consists of all unincorporated private enterprises owned by individuals or households engaged in the sale and production of goods and services operated on a proprietary or partnership basis and with less than ten total workers".
o “Unorganised workers consist of those working in the unorganised enterprises or households, excluding regular workers with social security benefits, and the workers in the formal sector without any employment/ social security benefits provided by the employers".
Based on these defini�ons, the NCEUS found that about 86% of India’s workforce in 2004-05 would fall within the unorganised sector.
• The Periodic Labour Force Survey 2017-18 (PLFS) relies on the defini�ons by the 17th Interna�onal Conference of Labour Sta�s�cians for workers in the informal sector. The report lists some categories of informal workers, including:
o own-account workers and employers who have their own informal sector enterprises; o contributing family workers, irrespective of whether they work in formal or informal sector
enterprises;o employees who have informal jobs … whether employed by formal sector enterprises, informal
sector enterprises, or as paid domestic workers by households;o members of informal producers‟ cooperatives; ando persons engaged in the own-account production of goods exclusively for own final use by their
household, such as subsistence farming or do-it-yourself construction of own dwellings.5
The PLFS also considered only proprietorships and partnerships as informal sector enterprises.
• The ILO Recommenda�on No. 202 defines the informal economy as covering “all economic activities by workers and economic units that are – in law or in practice – not covered or insufficiently covered by formal arrangement.” The Recommendation also clarifies that “informal work may be found across all sectors of the economy, in both public and private spaces.”
We note that the Bill classifies informal sector enterprises by size of the establishment, rather than in terms of access to social security. This defini�on may leave out many workers from statutory social protec�on measures. According to the PLFS 2017-18, only 22.8% of Indian workers are in regular wage or salaried employment. 52.2% are self-employed, while 24.9% are in casual labour. The PLFS notes that 68.4% of workers employed outside of agriculture are employed in these informal sector enterprises. Further, 71% of regular wage employees have no wri�en job contract, while 49.6% of regular wage employees were not eligible for any form of social security. Restric�ng social protec�on measures only to those in informal sector enterprises, as defined in the Bill, would leave many workers out of coverage. Moreover, it is unclear why the Bill carves out gig workers and pla�orm workers as a separate category from informal sector workers.
beneficiary.8 Moreover, since schemes cannot be enforced in Court, their implementa�on depends on the availability of funds from the government. As reports have shown, the budget alloca�ons for schemes vary wildly from year to year,9meaning that the implementa�on of many important schemes is haphazard at best. Further, while the Bill provides for self-iden�fica�on as an unorganised sector worker in s. 113, it does not clarify what the implica�ons of such registra�on – or the failure to do so – might be.
Finally, the Bill does not envisage any role for the employer (except in the case of pla�orm workers in s. 114). This is problema�c, as it may mean that employers do not take responsibility for social security of their workers by keeping them in casual work arrangements. We note that the Contract Labour (Regula�on and Aboli�on) Act, 1970 only applies to establishments with more than 20 workers and does not apply where work is of an “intermi�ent” or “casual nature.” Where work is contracted out to contractors and sub-contractors, it could become impossible to ascertain where the liability for workers’ welfare may lie.
In sum, we iden�fy three key concerns with the Bill in its present form:
1. The Bill does not elaborate on the content of social security rights for the informal sector. Instead, it leaves this to the discre�on of the government. This in turn means that there is li�le certainty on what ci�zens may be en�tled to. Moreover, the government schemes referred to do not confer any jus�ciable rights on ci�zens.
2. This means that there is a stark difference in the types of rights formal sector workers receive and those available to informal sector workers. In this respect, the Bill is not an improvement over the Unorganised Workers Social Security Act, 2008.
3. There is a need to envisage a framework that assigns responsibility to different en��es – such as employers and contractors – in providing and delivering social security to workers. This is par�cularly relevant for those in the formal sector.
3. Designing Social Security Floors For IndiaA. Social Security Provided by the Government
As noted above, there is a need for social protec�ons to be made available universally, and not only to informal sector workers. A number of rights, including the right to health,10 shelter,11 and old-age pensions12 have been read into the right to life under Ar�cle 21 of the Cons�tu�on. Further, the Direc�ve Principles require the State to provide for the right to work,13 just and humane condi�ons of work14 and a living wage15.
Many interna�onal instruments also relate to the need to provide for social security and basic economic rights to ci�zens. The Interna�onal Labour Organisa�on’s Recommenda�on No. 202 on Basic Social Security Floors and Recommenda�on No. 204 on the Transi�on from the Informal to the Formal Economy both refer to the need to put systems in place to protect the needs of informal sector workers. Further, the UN Sustainable Goal No. 8
refers expressly to “full and produc�ve employment and decent work for all.”16
To give effect to these obliga�ons, it is necessary for the state to put social security mechanisms in place. We refrain from making any specific recommenda�ons with respect to the content of the social security floor to be provided by the government. Further research is required to evaluate the needs of those outside formal social security nets and how this should be delivered. However, we suggest the following design principles for a state-provided social security floor:
1. Floor level social protec�ons should be made available to all persons and not only those in the workforce.
2. The social security tools available to those in the formal sector may not be appropriate for all persons. Instruments such as PF or Employees’ State Insurance require regular payment of contribu�ons from wages and a lack of liquidity. These may not be appropriate for those workers with seasonal occupa�ons or those who earn much less than minimum wage.
3. Par�cular a�en�on must be paid to providing basic income security. The Code on Wages, 2019 provides that minimum wages are to be determined by skill and geographical region,17 not by consump�on requirements of individuals. As the PLFS highlights, many workers earn far less than the na�onal floor level minimum wage of Rs. 176.18There is, therefore, an urgent need to ensure that the social security floor provides enough income security for persons to meet their consump�on requirements.
4. There is a need for both clarity and certainty in en�tlements due to persons. As set out above, this can be provided by ensuring that social security floors are enshrined in statutes that set out basic en�tlements. Some ma�ers, such as the rupee amount of a transfer or the delivery architecture for a payment, may be determined by subordinate legisla�on. However, the content of social security rights must be set out in statute.
5. Any social security policy must account for migra�on within India and the need for workers to be able to access benefits in different states. We note that the Bill does not make any express reference to migrant workers, nor any reference to the Inter-State Migrant Workers Act, 1979. This must be remedied and clear guidelines framed for migrant workers’ access to benefits.
6. There must be a simple and accessible grievance redressal mechanism available to persons.
7. There may be a need to s�pulate mandatory contribu�ons by the employer and employee for social security. These contribu�ons must take the vola�le and seasonal nature of informal sector work into account and allow for flexibility in payments.
Introduction
The overall savings rate (as a percentage of GDP) of India has been falling over time. It fell to a 15-year low of 30.1% of the GDP in 2019 from 34.6% in 20125. To study the reasons behind this decline, it is important to understand both the components of domestic savings and its determinants.
Domestic savings comprise both Public and Private savings. Private savings can be further classified into household savings and corporate savings.6,7 Households contribute to more than 60% of the national savings,8 and the decline in the savings rate can be largely attributed to this sector. This is because household savings have been declining over time, whereas corporate savings have increased, and public savings have remained more or less the same (Patnaik and Pandey 2019). According to Patnaik & Pandey (2019), household savings had declined from 25.18% in 2010 to 17.2% in 2017. The falling savings rate can pose a risk to the economic growth of the country. Therefore, it becomes important to examine the trends in the savings rate and the formal savings potential of the household sector, given the policy implications it holds for the country.
Household savings are affected by macroeconomic factors such as interest rates, inflation, level of Gross Domestic Product (GDP), microeconomic factors such as the demand, willingness, and potential to save by households, and institutional factors such as households’ access to financial services. Samantaraya and Patra (2014) find that household savings are impacted negatively by high inflation as high inflation depresses the real value of wealth held by households through wealth effects, and also by real interest rates as real interest rates tend to increase the permanent income of net lenders, thereby increasing consumption and declining savings through an income effect. This contrasts with Athukorala and Sen (2004), who find that the substitution effect is stronger than the income effect in the case of real interest rate on bank deposits and that it has a significant positive impact as present consumption becomes more costly than future consumption, thereby increasing savings. Similarly, they also find that even the inflation rate has a positive impact on private savings and that the savings are directly proportional to the level of GDP and the rate of growth of GDP.
Willingness and potential to save, on the other hand, are influential factors that determine the level of savings by households at the micro-level. Most households manage to maintain a surplus after all their consumption and debt commitments (Banerjee and Duflo, 2007), which should ideally translate into the demand for and the usage of formal savings products. However, most studies find that this is not always the case due to several barriers to save such as high transaction cost, trust deficit, regulatory barriers, information and knowledge gaps, social norms, and behavioural biases (Collins et al., 2009; Karlan, Ratan and Zinman, 2014). Therefore, we call this surplus, the formal savings potential of the households, as it is the amount of money that the households can potentially save in formal savings instruments – both physical and financial, after meeting their monthly expenses.
This brief is divided into five sections. Section 1 describes the data and methodology that is used for this analysis. Section 2 lays out the overall surplus rate of the country along with urban and rural surplus rates. Section 3 maps the surplus rate of households over time based on income quintiles. Section 4 gives an overview of how the surplus rate of households have fared over time in different Indian states, and we conclude in Section 5
5https://www.ceicdata.com/en/indicator/india/gross-savings-rate ; https://economictimes.indiatimes.com/markets/stocks/news/indias-savings-rate-plunges-to-15-year-low/articleshow/74200784.cms6http://mospi.nic.in/sites/default/files/reports_and_publication/cso_national_accounts/chptwenty_nad003.pdf 7https://www.rbi.org.in/scripts/bs_viewcontent.aspx?Id=2486#:~:text=Domestic%20saving%20(Investment)%20of%20India,and%20Corporate%20Saving%20 (Investment).8https://economictimes.indiatimes.com/markets/stocks/news/indias-savings-rate-plunges-to-15-year-low/articleshow/74200784.cms

02
Introduc�on
The Code on Social Security Bill, 2019 [“the Bill”], introduced in Parliament in December 2019, is the most recent a�empt to ra�onalise patchwork of social security legisla�on into a comprehensive Code. One of the key differences between the 2019 Bill and the versions in 2018 and 2017 is the chapter on unorganised sector workers. Earlier versions of the Bill provided for equal social security benefits for all categories of workers. However, the 2019 Bill treats informal sector workers as a separate category and provides that the government will frame schemes for their welfare.
As we have noted in our comments to the Ministry of Labour in 2019,2 there is a lack of clarity on who informal sector workers are, meaning that there is a further lack of clarity on whom the interven�ons target. Further, it is unclear why informal sector workers are treated as a separate class from organised sector workers, or why informal sector workers receive far less protec�on under the Statute. Under the Bill, welfare for unorganised sector workers is to be provided by schemes designed by the Central or State governments, while formal sector workers have clear en�tlements to provident fund, gratuity, employees’ state insurance and maternity benefits. This is deeply problema�c, as informal sector workers comprise more than 75% of the workforce.3There is an urgent need to evaluate the structure of social security available to unorganised workers.
In this policy brief, we discuss:
i. The many defini�ons of informal sector workers, and whether social security should be universal ii. Unorganised workers in the Code on Social Security Bill, 2019 iii. Design principles for social security interven�ons by the state and the private sector.
1. Who is an Informal Sector Worker?
The following defini�ons in the Bill are of interest.
• S. 2(35): "gig worker" means a person who performs work or participates in a work arrangement and earns from such activities outside of traditional employer-employee relationship;
• S. 2(77): "unorganised sector" means an enterprise owned by individuals or self-employed workers and engaged in the production or sale of goods or providing service of any kind whatsoever, and where the enterprise employs workers, the number of such workers is less than ten;
• S. 2 (82) "wage worker" means a person employed for remuneration in the unorganised sector, directly by an employer or through any contractor, irrespective of place of work, whether exclusively for one employer or for one or more employers, whether in cash or in kind, whether as a home-based worker, or as a temporary or casual worker, or as a migrant worker, or workers employed by households including domestic workers, with a monthly wage of an amount as may be notified by the Central Government and State Government, as the case may be.
S. 113 allows persons to self-iden�fy as unorganised sector workers.
• The Na�onal Commission for Enterprises in the Unorganised Sector (2007)4proposed two defini�ons for unorganised sector workers. These are as follows:
o "The unorganised sector consists of all unincorporated private enterprises owned by individuals or households engaged in the sale and production of goods and services operated on a proprietary or partnership basis and with less than ten total workers".
o “Unorganised workers consist of those working in the unorganised enterprises or households, excluding regular workers with social security benefits, and the workers in the formal sector without any employment/ social security benefits provided by the employers".
Based on these defini�ons, the NCEUS found that about 86% of India’s workforce in 2004-05 would fall within the unorganised sector.
• The Periodic Labour Force Survey 2017-18 (PLFS) relies on the defini�ons by the 17th Interna�onal Conference of Labour Sta�s�cians for workers in the informal sector. The report lists some categories of informal workers, including:
o own-account workers and employers who have their own informal sector enterprises; o contributing family workers, irrespective of whether they work in formal or informal sector
enterprises;o employees who have informal jobs … whether employed by formal sector enterprises, informal
sector enterprises, or as paid domestic workers by households;o members of informal producers‟ cooperatives; ando persons engaged in the own-account production of goods exclusively for own final use by their
household, such as subsistence farming or do-it-yourself construction of own dwellings.5
The PLFS also considered only proprietorships and partnerships as informal sector enterprises.
• The ILO Recommenda�on No. 202 defines the informal economy as covering “all economic activities by workers and economic units that are – in law or in practice – not covered or insufficiently covered by formal arrangement.” The Recommendation also clarifies that “informal work may be found across all sectors of the economy, in both public and private spaces.”
We note that the Bill classifies informal sector enterprises by size of the establishment, rather than in terms of access to social security. This defini�on may leave out many workers from statutory social protec�on measures. According to the PLFS 2017-18, only 22.8% of Indian workers are in regular wage or salaried employment. 52.2% are self-employed, while 24.9% are in casual labour. The PLFS notes that 68.4% of workers employed outside of agriculture are employed in these informal sector enterprises. Further, 71% of regular wage employees have no wri�en job contract, while 49.6% of regular wage employees were not eligible for any form of social security. Restric�ng social protec�on measures only to those in informal sector enterprises, as defined in the Bill, would leave many workers out of coverage. Moreover, it is unclear why the Bill carves out gig workers and pla�orm workers as a separate category from informal sector workers.
We further note that terms “informal sector worker” does not encompass all those in need of social protec�on. The PLFS found that about 9% of workers were unemployed. Further, India has an old age dependency ra�o of around 9.3%, which is likely to increase to 12.4% by 2026.6 Many others may not be in the workforce for reasons of age, disability, or the need to provide unpaid care work at home. There is a need to include all these classes of individuals within the protec�on of a formal social security net. We therefore propose that any social security floor be made universally applicable to all persons.7
2. Informal Sector Workers Under the Code For Social Security Bill, 2019
S. 109 of the Bill reads:(1) The Central Government shall formulate and notify, from time to time, suitable welfare schemes
for unorganised workers (including audio visual workers, beedi workers, non-coal workers) on matters relating to— (i) life and disability cover; (ii) health and maternity benefits; (iii) old age protection; (iv) education; (v) housing; and (vi) any other benefit as may be determined by the Central Government.
(2) The State Government shall formulate and notify, from time to time, suitable welfare schemes for unorganised workers, including schemes relating to— (i) provident fund; (ii) employment injury benefit; (iii) housing; (iv) educational schemes for children; (v) skill upgradation of workers; (vi) funeral assistance; and (vii) old age homes.
Unlike the 2018 Dra�, the present Bill does not treat unorganised and organised sector workers in exactly the same way. Instead, while organised sector workers are covered under the chapters on provident fund, employees’ state insurance, gratuity, old age and maternity benefits, unorganised workers are only provided for under Chapter VII.
Chapter VII is based on the Unorganised Workers Social Security Act, 2008 (“UWSSA”). As with the UWSSA, the Bill does not provide for content of the rights referred to in S. 109. Rather, these are le� to the discre�on of the execu�ve, which is to frame schemes.
This is problema�c – schemes do not provide for jus�ciable rights which ci�zens can enforce in court. Further, they may be modified at any �me, at the discre�on of the government, and even to the detriment of the end
refers expressly to “full and produc�ve employment and decent work for all.”16
To give effect to these obliga�ons, it is necessary for the state to put social security mechanisms in place. We refrain from making any specific recommenda�ons with respect to the content of the social security floor to be provided by the government. Further research is required to evaluate the needs of those outside formal social security nets and how this should be delivered. However, we suggest the following design principles for a state-provided social security floor:
1. Floor level social protec�ons should be made available to all persons and not only those in the workforce.
2. The social security tools available to those in the formal sector may not be appropriate for all persons. Instruments such as PF or Employees’ State Insurance require regular payment of contribu�ons from wages and a lack of liquidity. These may not be appropriate for those workers with seasonal occupa�ons or those who earn much less than minimum wage.
3. Par�cular a�en�on must be paid to providing basic income security. The Code on Wages, 2019 provides that minimum wages are to be determined by skill and geographical region,17 not by consump�on requirements of individuals. As the PLFS highlights, many workers earn far less than the na�onal floor level minimum wage of Rs. 176.18There is, therefore, an urgent need to ensure that the social security floor provides enough income security for persons to meet their consump�on requirements.
4. There is a need for both clarity and certainty in en�tlements due to persons. As set out above, this can be provided by ensuring that social security floors are enshrined in statutes that set out basic en�tlements. Some ma�ers, such as the rupee amount of a transfer or the delivery architecture for a payment, may be determined by subordinate legisla�on. However, the content of social security rights must be set out in statute.
5. Any social security policy must account for migra�on within India and the need for workers to be able to access benefits in different states. We note that the Bill does not make any express reference to migrant workers, nor any reference to the Inter-State Migrant Workers Act, 1979. This must be remedied and clear guidelines framed for migrant workers’ access to benefits.
6. There must be a simple and accessible grievance redressal mechanism available to persons.
7. There may be a need to s�pulate mandatory contribu�ons by the employer and employee for social security. These contribu�ons must take the vola�le and seasonal nature of informal sector work into account and allow for flexibility in payments.
1. Data & Methodology
For this analysis, we use the Centre for Monitoring Indian Economy’s (CMIE-CPHS) data, one of the largest nation-wide panel databases at the household level. It collects information of over two lakh households spread across 29 states and union territories of the country. It consists of the Income Pyramids, Aspirational India, People of India, and Consumption Pyramids modules, which contain details of both the demographic characteristics and financial behaviour of households and individuals. The survey is conducted thrice in a year, and each four months of the survey is called a wave. We extract information from the income pyramids and consumption pyramids modules from January 2014 to December 2019 (amounting to a total of 72 months), as they provide the details on the monthly income and expenditure of households.
We begin by creating a refined version of the dataset for the analysis by dropping households for which the survey could not be administered as well as households that reported zero income in different months to avoid missing values in our calculation of the surplus rate. We then apply weights that have been provided by CMIE to account for such households to make the sample representative of the Indian population.9 To calculate the monthly household surplus, we subtracted the total expenditure of the household from the total income of the household.
Once we have computed the household surplus, we measure surplus as a share of income. This enables us to compare it across different periods, notwithstanding the changes in income level.
Since the motivation for this exercise was to assess trends in formal savings potential among Indian households, we consider only those households that manage a positive surplus10 and average the household surplus rates at the national and state levels. To put these numbers in perspective, we also calculate and report the percentage of households that manage a positive surplus. On average, we find that 20-25% of the households have shown a negative surplus over the years.
An important limitation of this dataset is that it allows us to comment only on the expenditure incurred by households under the different category heads as recorded by the CMIE-CPHS, and not on the amount of money saved by households through various savings instruments. While the CMIE-CPHS has details of households’ participation (uptake of products) in various financial assets such as Bank Accounts, Fixed Deposits, Life Insurance, Health Insurance, etc., there is no information on households’ allocation (amount of savings or investments in each product as a fraction of total savings/wealth) in these instruments. Therefore, we call our metric, the surplus rate, instead of the savings rate, as this surplus might include savings in both formal and informal11 institutions as opposed to the savings rate of the country, which only accounts for the formal savings of households.
9After adding weights to the CMIE data, we found the data represents 25.92 crore households on average in 2014, 26.11 crore in 2015, 27.14 crore in 2016, 28.24 crore in 2017, 29.14 crore in 2018, and 30.22 crore in 2019.10Positive surplus households are those households for which monthly income was greater than monthly expenditure. Similarly, negative surplus households are those whose monthly income was less than monthly expenditure. 11Examples of informal savings are savings in the form of cash, money lent out informally, informal savings schemes with moneylenders, jewellery store owners, etc.
Household Surplus = Household Income-Household Expenditure
Surplus Rate = X 100Household SurplusHousehold Income

03
Introduc�on
The Code on Social Security Bill, 2019 [“the Bill”], introduced in Parliament in December 2019, is the most recent a�empt to ra�onalise patchwork of social security legisla�on into a comprehensive Code. One of the key differences between the 2019 Bill and the versions in 2018 and 2017 is the chapter on unorganised sector workers. Earlier versions of the Bill provided for equal social security benefits for all categories of workers. However, the 2019 Bill treats informal sector workers as a separate category and provides that the government will frame schemes for their welfare.
As we have noted in our comments to the Ministry of Labour in 2019,2 there is a lack of clarity on who informal sector workers are, meaning that there is a further lack of clarity on whom the interven�ons target. Further, it is unclear why informal sector workers are treated as a separate class from organised sector workers, or why informal sector workers receive far less protec�on under the Statute. Under the Bill, welfare for unorganised sector workers is to be provided by schemes designed by the Central or State governments, while formal sector workers have clear en�tlements to provident fund, gratuity, employees’ state insurance and maternity benefits. This is deeply problema�c, as informal sector workers comprise more than 75% of the workforce.3There is an urgent need to evaluate the structure of social security available to unorganised workers.
In this policy brief, we discuss:
i. The many defini�ons of informal sector workers, and whether social security should be universal ii. Unorganised workers in the Code on Social Security Bill, 2019 iii. Design principles for social security interven�ons by the state and the private sector.
1. Who is an Informal Sector Worker?
The following defini�ons in the Bill are of interest.
• S. 2(35): "gig worker" means a person who performs work or participates in a work arrangement and earns from such activities outside of traditional employer-employee relationship;
• S. 2(77): "unorganised sector" means an enterprise owned by individuals or self-employed workers and engaged in the production or sale of goods or providing service of any kind whatsoever, and where the enterprise employs workers, the number of such workers is less than ten;
• S. 2 (82) "wage worker" means a person employed for remuneration in the unorganised sector, directly by an employer or through any contractor, irrespective of place of work, whether exclusively for one employer or for one or more employers, whether in cash or in kind, whether as a home-based worker, or as a temporary or casual worker, or as a migrant worker, or workers employed by households including domestic workers, with a monthly wage of an amount as may be notified by the Central Government and State Government, as the case may be.
S. 113 allows persons to self-iden�fy as unorganised sector workers.
• The Na�onal Commission for Enterprises in the Unorganised Sector (2007)4proposed two defini�ons for unorganised sector workers. These are as follows:
o "The unorganised sector consists of all unincorporated private enterprises owned by individuals or households engaged in the sale and production of goods and services operated on a proprietary or partnership basis and with less than ten total workers".
o “Unorganised workers consist of those working in the unorganised enterprises or households, excluding regular workers with social security benefits, and the workers in the formal sector without any employment/ social security benefits provided by the employers".
Based on these defini�ons, the NCEUS found that about 86% of India’s workforce in 2004-05 would fall within the unorganised sector.
• The Periodic Labour Force Survey 2017-18 (PLFS) relies on the defini�ons by the 17th Interna�onal Conference of Labour Sta�s�cians for workers in the informal sector. The report lists some categories of informal workers, including:
o own-account workers and employers who have their own informal sector enterprises; o contributing family workers, irrespective of whether they work in formal or informal sector
enterprises;o employees who have informal jobs … whether employed by formal sector enterprises, informal
sector enterprises, or as paid domestic workers by households;o members of informal producers‟ cooperatives; ando persons engaged in the own-account production of goods exclusively for own final use by their
household, such as subsistence farming or do-it-yourself construction of own dwellings.5
The PLFS also considered only proprietorships and partnerships as informal sector enterprises.
• The ILO Recommenda�on No. 202 defines the informal economy as covering “all economic activities by workers and economic units that are – in law or in practice – not covered or insufficiently covered by formal arrangement.” The Recommendation also clarifies that “informal work may be found across all sectors of the economy, in both public and private spaces.”
We note that the Bill classifies informal sector enterprises by size of the establishment, rather than in terms of access to social security. This defini�on may leave out many workers from statutory social protec�on measures. According to the PLFS 2017-18, only 22.8% of Indian workers are in regular wage or salaried employment. 52.2% are self-employed, while 24.9% are in casual labour. The PLFS notes that 68.4% of workers employed outside of agriculture are employed in these informal sector enterprises. Further, 71% of regular wage employees have no wri�en job contract, while 49.6% of regular wage employees were not eligible for any form of social security. Restric�ng social protec�on measures only to those in informal sector enterprises, as defined in the Bill, would leave many workers out of coverage. Moreover, it is unclear why the Bill carves out gig workers and pla�orm workers as a separate category from informal sector workers.
We further note that terms “informal sector worker” does not encompass all those in need of social protec�on. The PLFS found that about 9% of workers were unemployed. Further, India has an old age dependency ra�o of around 9.3%, which is likely to increase to 12.4% by 2026.6 Many others may not be in the workforce for reasons of age, disability, or the need to provide unpaid care work at home. There is a need to include all these classes of individuals within the protec�on of a formal social security net. We therefore propose that any social security floor be made universally applicable to all persons.7
2. Informal Sector Workers Under the Code For Social Security Bill, 2019
S. 109 of the Bill reads:(1) The Central Government shall formulate and notify, from time to time, suitable welfare schemes
for unorganised workers (including audio visual workers, beedi workers, non-coal workers) on matters relating to— (i) life and disability cover; (ii) health and maternity benefits; (iii) old age protection; (iv) education; (v) housing; and (vi) any other benefit as may be determined by the Central Government.
(2) The State Government shall formulate and notify, from time to time, suitable welfare schemes for unorganised workers, including schemes relating to— (i) provident fund; (ii) employment injury benefit; (iii) housing; (iv) educational schemes for children; (v) skill upgradation of workers; (vi) funeral assistance; and (vii) old age homes.
Unlike the 2018 Dra�, the present Bill does not treat unorganised and organised sector workers in exactly the same way. Instead, while organised sector workers are covered under the chapters on provident fund, employees’ state insurance, gratuity, old age and maternity benefits, unorganised workers are only provided for under Chapter VII.
Chapter VII is based on the Unorganised Workers Social Security Act, 2008 (“UWSSA”). As with the UWSSA, the Bill does not provide for content of the rights referred to in S. 109. Rather, these are le� to the discre�on of the execu�ve, which is to frame schemes.
This is problema�c – schemes do not provide for jus�ciable rights which ci�zens can enforce in court. Further, they may be modified at any �me, at the discre�on of the government, and even to the detriment of the end
beneficiary.8 Moreover, since schemes cannot be enforced in Court, their implementa�on depends on the availability of funds from the government. As reports have shown, the budget alloca�ons for schemes vary wildly from year to year,9meaning that the implementa�on of many important schemes is haphazard at best. Further, while the Bill provides for self-iden�fica�on as an unorganised sector worker in s. 113, it does not clarify what the implica�ons of such registra�on – or the failure to do so – might be.
Finally, the Bill does not envisage any role for the employer (except in the case of pla�orm workers in s. 114). This is problema�c, as it may mean that employers do not take responsibility for social security of their workers by keeping them in casual work arrangements. We note that the Contract Labour (Regula�on and Aboli�on) Act, 1970 only applies to establishments with more than 20 workers and does not apply where work is of an “intermi�ent” or “casual nature.” Where work is contracted out to contractors and sub-contractors, it could become impossible to ascertain where the liability for workers’ welfare may lie.
In sum, we iden�fy three key concerns with the Bill in its present form:
1. The Bill does not elaborate on the content of social security rights for the informal sector. Instead, it leaves this to the discre�on of the government. This in turn means that there is li�le certainty on what ci�zens may be en�tled to. Moreover, the government schemes referred to do not confer any jus�ciable rights on ci�zens.
2. This means that there is a stark difference in the types of rights formal sector workers receive and those available to informal sector workers. In this respect, the Bill is not an improvement over the Unorganised Workers Social Security Act, 2008.
3. There is a need to envisage a framework that assigns responsibility to different en��es – such as employers and contractors – in providing and delivering social security to workers. This is par�cularly relevant for those in the formal sector.
3. Designing Social Security Floors For IndiaA. Social Security Provided by the Government
As noted above, there is a need for social protec�ons to be made available universally, and not only to informal sector workers. A number of rights, including the right to health,10 shelter,11 and old-age pensions12 have been read into the right to life under Ar�cle 21 of the Cons�tu�on. Further, the Direc�ve Principles require the State to provide for the right to work,13 just and humane condi�ons of work14 and a living wage15.
Many interna�onal instruments also relate to the need to provide for social security and basic economic rights to ci�zens. The Interna�onal Labour Organisa�on’s Recommenda�on No. 202 on Basic Social Security Floors and Recommenda�on No. 204 on the Transi�on from the Informal to the Formal Economy both refer to the need to put systems in place to protect the needs of informal sector workers. Further, the UN Sustainable Goal No. 8
1238.2% is the simple average of surplus rates from January 2014 to December 2019. 13The linear trend fitted to the overall savings has a slope of 0.0296. 14Except for the sudden drop from 80% in April 2015 to 68% in November 2015. We haven’t explored the reasons behind this drop in this analysis.15Household savings is a component of gross savings of the country and is estimated by the Central Statistics Office (CSO) regularly: http://mospi.nic.in/sites/default/files/reports_and_publication/cso_national_accounts/chptwenty_nad003.pdf16Formal sources of savings include both savings in physical assets such as real estate and gold, and financial assets. 17https://www.financialexpress.com/economy/indias-rural-urban-divide-village-worker-earns-less-than-half-of-city-peer/1792245/18Both the payment access points such as bank branches, active business correspondent locations, and ATMs, and credit access points are higher for urban areas than rural areas: https://m.rbi.org.in/scripts/PublicationReportDetails.aspx?UrlPage=&ID=733
2. Overall Savings
We start this analysis by mapping the surplus rate of households for each month from 2014 to 2019 (Figure 1). We find that the formal savings potential of the households with respect to their income has, on average, increased over time and has stayed close to 38.2% (Figure 1).12 The formal savings potential of the country has grown slightly by 3% over the years.13 This is in contrast with the household savings of the country, as a percentage of GDP, which is not only less than the surplus rate but has also been declining over time. There could be three reasons for this. One, we have only looked at the formal savings potential of the households that report a surplus each month. Figure 1 shows that the percentage of households that reported a positive surplus remained between 75-80% from 2014-2019,14 forming a simple average of 76% over the years. If we were to consider the surplus rate of households that reported a negative surplus, the country's overall surplus rate would drop below the average of 38.2%.
Two, household savings, as a per cent of GDP,15 comprises of actual savings by households in both financial and physical assets. It excludes informal savings by households such as cash in hand or informal saving schemes with local moneylenders or family members. Whereas the surplus rate that we calculate accounts for only surplus as a part of the income that is left with households after incurring the overall monthly expenditure. This means that our surplus rate captures the amount of money that the households can save in any form and not the actual amount that they save in formal sources16. Moreover, the savings in formal financial sources might actually be much lower. The Report on Household Finance Committee (2017) found that Indian households hold a mere 5% of their wealth in the form of financial assets (which includes deposit and saving accounts, publicly traded shares, mutual funds, life insurance, and retirement accounts). Additionally, Kumar and Sharma (2020) find that almost 22% of the households in India remain unbanked, excluding them further from accessing formal financial services. Therefore, it is possible for households to have a higher potential to save formally, as compared to the actual household savings of the country.
Thirdly, CMIE doesn’t collect data on the amount of money saved in different assets by households. It only captures whether households save in a particular asset. Hence, the amount that the households save in the form of physical assets such as gold and real estate might also be a part of the surplus that is left with the households after monthly consumption, making it higher than the actual savings rate of the country.
Further, we separate the overall surplus rate into urban surplus rate and rural surplus rate. On average, we find that both the urban surplus rate and rural surplus rate are increasing with a similar growth rate as that of the overall surplus rate. Moreover, the overall surplus rate of urban areas has remained higher than both the overall surplus rate of the country and the rural surplus rate. One possible explanation for this is that, on average, urban regions have higher monthly incomes than rural regions, and hence, the potential to save is higher for urban households.17 Further, the opportunities to save formally are also higher in urban areas than in rural areas.18

Introduc�on
The Code on Social Security Bill, 2019 [“the Bill”], introduced in Parliament in December 2019, is the most recent a�empt to ra�onalise patchwork of social security legisla�on into a comprehensive Code. One of the key differences between the 2019 Bill and the versions in 2018 and 2017 is the chapter on unorganised sector workers. Earlier versions of the Bill provided for equal social security benefits for all categories of workers. However, the 2019 Bill treats informal sector workers as a separate category and provides that the government will frame schemes for their welfare.
As we have noted in our comments to the Ministry of Labour in 2019,2 there is a lack of clarity on who informal sector workers are, meaning that there is a further lack of clarity on whom the interven�ons target. Further, it is unclear why informal sector workers are treated as a separate class from organised sector workers, or why informal sector workers receive far less protec�on under the Statute. Under the Bill, welfare for unorganised sector workers is to be provided by schemes designed by the Central or State governments, while formal sector workers have clear en�tlements to provident fund, gratuity, employees’ state insurance and maternity benefits. This is deeply problema�c, as informal sector workers comprise more than 75% of the workforce.3There is an urgent need to evaluate the structure of social security available to unorganised workers.
In this policy brief, we discuss:
i. The many defini�ons of informal sector workers, and whether social security should be universal ii. Unorganised workers in the Code on Social Security Bill, 2019 iii. Design principles for social security interven�ons by the state and the private sector.
1. Who is an Informal Sector Worker?
The following defini�ons in the Bill are of interest.
• S. 2(35): "gig worker" means a person who performs work or participates in a work arrangement and earns from such activities outside of traditional employer-employee relationship;
• S. 2(77): "unorganised sector" means an enterprise owned by individuals or self-employed workers and engaged in the production or sale of goods or providing service of any kind whatsoever, and where the enterprise employs workers, the number of such workers is less than ten;
• S. 2 (82) "wage worker" means a person employed for remuneration in the unorganised sector, directly by an employer or through any contractor, irrespective of place of work, whether exclusively for one employer or for one or more employers, whether in cash or in kind, whether as a home-based worker, or as a temporary or casual worker, or as a migrant worker, or workers employed by households including domestic workers, with a monthly wage of an amount as may be notified by the Central Government and State Government, as the case may be.
S. 113 allows persons to self-iden�fy as unorganised sector workers.
• The Na�onal Commission for Enterprises in the Unorganised Sector (2007)4proposed two defini�ons for unorganised sector workers. These are as follows:
o "The unorganised sector consists of all unincorporated private enterprises owned by individuals or households engaged in the sale and production of goods and services operated on a proprietary or partnership basis and with less than ten total workers".
o “Unorganised workers consist of those working in the unorganised enterprises or households, excluding regular workers with social security benefits, and the workers in the formal sector without any employment/ social security benefits provided by the employers".
Based on these defini�ons, the NCEUS found that about 86% of India’s workforce in 2004-05 would fall within the unorganised sector.
• The Periodic Labour Force Survey 2017-18 (PLFS) relies on the defini�ons by the 17th Interna�onal Conference of Labour Sta�s�cians for workers in the informal sector. The report lists some categories of informal workers, including:
o own-account workers and employers who have their own informal sector enterprises; o contributing family workers, irrespective of whether they work in formal or informal sector
enterprises;o employees who have informal jobs … whether employed by formal sector enterprises, informal
sector enterprises, or as paid domestic workers by households;o members of informal producers‟ cooperatives; ando persons engaged in the own-account production of goods exclusively for own final use by their
household, such as subsistence farming or do-it-yourself construction of own dwellings.5
The PLFS also considered only proprietorships and partnerships as informal sector enterprises.
• The ILO Recommenda�on No. 202 defines the informal economy as covering “all economic activities by workers and economic units that are – in law or in practice – not covered or insufficiently covered by formal arrangement.” The Recommendation also clarifies that “informal work may be found across all sectors of the economy, in both public and private spaces.”
We note that the Bill classifies informal sector enterprises by size of the establishment, rather than in terms of access to social security. This defini�on may leave out many workers from statutory social protec�on measures. According to the PLFS 2017-18, only 22.8% of Indian workers are in regular wage or salaried employment. 52.2% are self-employed, while 24.9% are in casual labour. The PLFS notes that 68.4% of workers employed outside of agriculture are employed in these informal sector enterprises. Further, 71% of regular wage employees have no wri�en job contract, while 49.6% of regular wage employees were not eligible for any form of social security. Restric�ng social protec�on measures only to those in informal sector enterprises, as defined in the Bill, would leave many workers out of coverage. Moreover, it is unclear why the Bill carves out gig workers and pla�orm workers as a separate category from informal sector workers.
We further note that terms “informal sector worker” does not encompass all those in need of social protec�on. The PLFS found that about 9% of workers were unemployed. Further, India has an old age dependency ra�o of around 9.3%, which is likely to increase to 12.4% by 2026.6 Many others may not be in the workforce for reasons of age, disability, or the need to provide unpaid care work at home. There is a need to include all these classes of individuals within the protec�on of a formal social security net. We therefore propose that any social security floor be made universally applicable to all persons.7
2. Informal Sector Workers Under the Code For Social Security Bill, 2019
S. 109 of the Bill reads:(1) The Central Government shall formulate and notify, from time to time, suitable welfare schemes
for unorganised workers (including audio visual workers, beedi workers, non-coal workers) on matters relating to— (i) life and disability cover; (ii) health and maternity benefits; (iii) old age protection; (iv) education; (v) housing; and (vi) any other benefit as may be determined by the Central Government.
(2) The State Government shall formulate and notify, from time to time, suitable welfare schemes for unorganised workers, including schemes relating to— (i) provident fund; (ii) employment injury benefit; (iii) housing; (iv) educational schemes for children; (v) skill upgradation of workers; (vi) funeral assistance; and (vii) old age homes.
Unlike the 2018 Dra�, the present Bill does not treat unorganised and organised sector workers in exactly the same way. Instead, while organised sector workers are covered under the chapters on provident fund, employees’ state insurance, gratuity, old age and maternity benefits, unorganised workers are only provided for under Chapter VII.
Chapter VII is based on the Unorganised Workers Social Security Act, 2008 (“UWSSA”). As with the UWSSA, the Bill does not provide for content of the rights referred to in S. 109. Rather, these are le� to the discre�on of the execu�ve, which is to frame schemes.
This is problema�c – schemes do not provide for jus�ciable rights which ci�zens can enforce in court. Further, they may be modified at any �me, at the discre�on of the government, and even to the detriment of the end
beneficiary.8 Moreover, since schemes cannot be enforced in Court, their implementa�on depends on the availability of funds from the government. As reports have shown, the budget alloca�ons for schemes vary wildly from year to year,9meaning that the implementa�on of many important schemes is haphazard at best. Further, while the Bill provides for self-iden�fica�on as an unorganised sector worker in s. 113, it does not clarify what the implica�ons of such registra�on – or the failure to do so – might be.
Finally, the Bill does not envisage any role for the employer (except in the case of pla�orm workers in s. 114). This is problema�c, as it may mean that employers do not take responsibility for social security of their workers by keeping them in casual work arrangements. We note that the Contract Labour (Regula�on and Aboli�on) Act, 1970 only applies to establishments with more than 20 workers and does not apply where work is of an “intermi�ent” or “casual nature.” Where work is contracted out to contractors and sub-contractors, it could become impossible to ascertain where the liability for workers’ welfare may lie.
In sum, we iden�fy three key concerns with the Bill in its present form:
1. The Bill does not elaborate on the content of social security rights for the informal sector. Instead, it leaves this to the discre�on of the government. This in turn means that there is li�le certainty on what ci�zens may be en�tled to. Moreover, the government schemes referred to do not confer any jus�ciable rights on ci�zens.
2. This means that there is a stark difference in the types of rights formal sector workers receive and those available to informal sector workers. In this respect, the Bill is not an improvement over the Unorganised Workers Social Security Act, 2008.
3. There is a need to envisage a framework that assigns responsibility to different en��es – such as employers and contractors – in providing and delivering social security to workers. This is par�cularly relevant for those in the formal sector.
3. Designing Social Security Floors For IndiaA. Social Security Provided by the Government
As noted above, there is a need for social protec�ons to be made available universally, and not only to informal sector workers. A number of rights, including the right to health,10 shelter,11 and old-age pensions12 have been read into the right to life under Ar�cle 21 of the Cons�tu�on. Further, the Direc�ve Principles require the State to provide for the right to work,13 just and humane condi�ons of work14 and a living wage15.
Many interna�onal instruments also relate to the need to provide for social security and basic economic rights to ci�zens. The Interna�onal Labour Organisa�on’s Recommenda�on No. 202 on Basic Social Security Floors and Recommenda�on No. 204 on the Transi�on from the Informal to the Formal Economy both refer to the need to put systems in place to protect the needs of informal sector workers. Further, the UN Sustainable Goal No. 8
refers expressly to “full and produc�ve employment and decent work for all.”16
To give effect to these obliga�ons, it is necessary for the state to put social security mechanisms in place. We refrain from making any specific recommenda�ons with respect to the content of the social security floor to be provided by the government. Further research is required to evaluate the needs of those outside formal social security nets and how this should be delivered. However, we suggest the following design principles for a state-provided social security floor:
1. Floor level social protec�ons should be made available to all persons and not only those in the workforce.
2. The social security tools available to those in the formal sector may not be appropriate for all persons. Instruments such as PF or Employees’ State Insurance require regular payment of contribu�ons from wages and a lack of liquidity. These may not be appropriate for those workers with seasonal occupa�ons or those who earn much less than minimum wage.
3. Par�cular a�en�on must be paid to providing basic income security. The Code on Wages, 2019 provides that minimum wages are to be determined by skill and geographical region,17 not by consump�on requirements of individuals. As the PLFS highlights, many workers earn far less than the na�onal floor level minimum wage of Rs. 176.18There is, therefore, an urgent need to ensure that the social security floor provides enough income security for persons to meet their consump�on requirements.
4. There is a need for both clarity and certainty in en�tlements due to persons. As set out above, this can be provided by ensuring that social security floors are enshrined in statutes that set out basic en�tlements. Some ma�ers, such as the rupee amount of a transfer or the delivery architecture for a payment, may be determined by subordinate legisla�on. However, the content of social security rights must be set out in statute.
5. Any social security policy must account for migra�on within India and the need for workers to be able to access benefits in different states. We note that the Bill does not make any express reference to migrant workers, nor any reference to the Inter-State Migrant Workers Act, 1979. This must be remedied and clear guidelines framed for migrant workers’ access to benefits.
6. There must be a simple and accessible grievance redressal mechanism available to persons.
7. There may be a need to s�pulate mandatory contribu�ons by the employer and employee for social security. These contribu�ons must take the vola�le and seasonal nature of informal sector work into account and allow for flexibility in payments.
04
Households where the head of household is involved in blue collar employment, which includes wage laborers and industrial workers, have the lowest mean household income across all occupations. The pattern obtained, when we analyze participation in assets for blue collar employees, reveals that they have the lowest level of participation in almost all financial assets. This pattern appears again, when we analyze participation across income quintiles and find that households in the lowest income quintile exhibit very low levels of participation in nearly all financial assets. An exactly converse relation emerges when we consider white collar employees (which include managers, technical employees, and other white-collar employees directly mentioned in the data set) whose households have high mean income, exhibit a high level of participation across all assets (Figure 4).
Figure 1: Graph showing overall surplus rate, urban surplus rate, rural surplus rate, and the percentage of households with a positive surplus from 2014 to 2019.
3. Savings Potential by Income Quintile
We further break down the surplus rate by income quintiles, to see how the surplus rate or the formal savings potential of households differ by income. To do this, we create monthly income quintiles19 of households where the lowest income quintile household earns less than 6000 rupees on average, and the highest income quintile household earns more than 50,000 rupees on average. Then, we compute the average monthly surplus rate of households reporting a positive surplus for each income quintile.20 We find that the surplus as a fraction of income is the lowest for the lowest income quintile households and the highest for the highest income quintile households. This is fairly intuitive as the lowest income quintile households barely make a subsistence living. However, an interesting point to note is that this surplus rate is not 0 for even the lowest income quintile. The lowest income quintile households exhibited an approximately 20% surplus rate on average, indicating that even they have the potential to save. Moreover, the growth of this surplus rate is the highest for the lowest income quintile over the years, as on average, it exhibited a growth rate of 5%.21 How-
19These income quintiles are generated by dividing the weighted number of households in five income groups such that approximately 20% of the households are in each income group. They are based on the total monthly income earned by the households. 20Average monthly savings in absolute terms for each income quintile based on 2019 (from January 2019 to December 2019) income and expenditure data are: Q1 = Rs. 1589.38, Q2 = Rs. 2731.04, Q3 = Rs. 4877.22, Q4 = Rs. 9321.29, Q5 = Rs. 33657.88.21The linear trend fitted to the Q1 surplus rate has a slope of 0.05515, for Q2 is 0.029918, for Q3 is 0.031305, for Q4 is 0.020196, and for Q5 is 0.029078.

05
-ever, low-income households tend to use informal channels to save, such as cash-at-home, savings withfamily members, or with moneylenders, due to lack of access to formal saving channels. (Kumar and Sharma2020) find that more than 20% of the households in India remain without at least one bank account, and lessthan 30% of the lowest income quintile households have an outstanding investment in at least one formalfinancial instrument as opposed to 80% for the highest income quintile households.
Increased savings in formal saving channels not only benefit low-income households by providing them with safer and better ways to save, but also contribute to a higher savings rate at the macro-level. One way to do this is through financial inclusion. Various studies show that financial inclusion positively impacts economic growth (Sethi and Sethy 2019) and aids in reducing income inequality and poverty (Omar and Inaba 2020). In fact, financial inclusion is one of the main drivers of economic growth (Sethi and Acharya 2018) and hence the universal policy push for inclusive finance.
22The CMIE dataset provides weights for each household to extrapolate from the sample to the state-level. Also, this analysis could be performed only in states and union territories where CMIE conducts its surveys. A few north-eastern states and union territories have been left out due to the unavailability of data.
Figure 2: Graph showing the surplus rate of households based on different income quintiles, where Q1 is the lowest income quintile, and Q5 is the highest income quintile.
4. A state-level analysis of household savings
In this section, we look at trends in household surplus rates across states and union territories (UTs). To do this, we use weights in our state-level analysis and follow the same methodology as in the previous sections.
The metrics of importance for each state/UT level analysis are the percentage of households that report a positive surplus, the average surplus rate of households that manage a positive surplus and the average annual growth in surplus rate. We fit a simple linear trendline to the first two metrics to average out monthly variations and see the direction of movement of surplus rates in the last six years, and to approximate their growth rates.
We calculate the percentage of households maintaining a positive surplus by averaging the percentage of households maintaining a positive surplus over all the 72 months from January 2014 to December 2019. The formula is as follows:
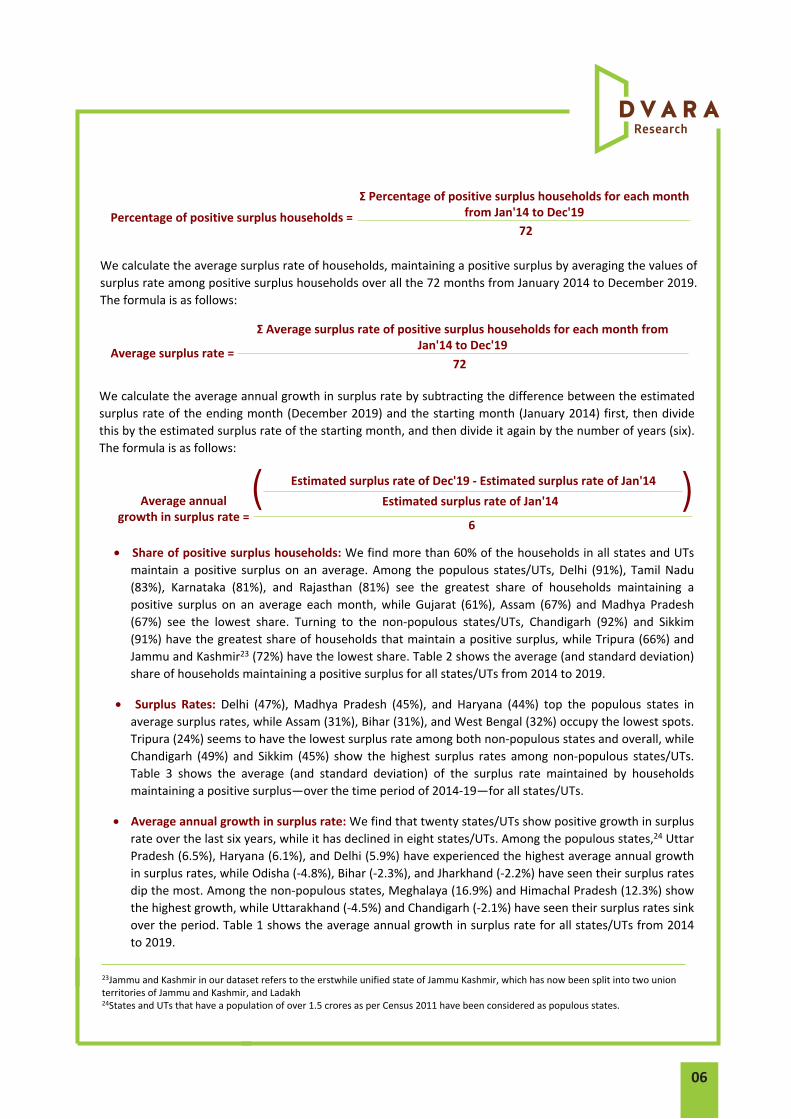
06
We calculate the average surplus rate of households, maintaining a positive surplus by averaging the values of surplus rate among positive surplus households over all the 72 months from January 2014 to December 2019. The formula is as follows:
23Jammu and Kashmir in our dataset refers to the erstwhile unified state of Jammu Kashmir, which has now been split into two union territories of Jammu and Kashmir, and Ladakh24States and UTs that have a population of over 1.5 crores as per Census 2011 have been considered as populous states.
Percentage of positive surplus households =
Σ Percentage of positive surplus households for each month from Jan'14 to Dec'19
72
Average surplus rate =
Σ Average surplus rate of positive surplus households for each month from Jan'14 to Dec'19
72
We calculate the average annual growth in surplus rate by subtracting the difference between the estimated surplus rate of the ending month (December 2019) and the starting month (January 2014) first, then divide this by the estimated surplus rate of the starting month, and then divide it again by the number of years (six). The formula is as follows:
Average annual growth in surplus rate =
Estimated surplus rate of Dec'19 - Estimated surplus rate of Jan'14 Estimated surplus rate of Jan'14
6
( )• Share of positive surplus households: We find more than 60% of the households in all states and UTs
maintain a positive surplus on an average. Among the populous states/UTs, Delhi (91%), Tamil Nadu(83%), Karnataka (81%), and Rajasthan (81%) see the greatest share of households maintaining apositive surplus on an average each month, while Gujarat (61%), Assam (67%) and Madhya Pradesh(67%) see the lowest share. Turning to the non-populous states/UTs, Chandigarh (92%) and Sikkim(91%) have the greatest share of households that maintain a positive surplus, while Tripura (66%) andJammu and Kashmir23 (72%) have the lowest share. Table 2 shows the average (and standard deviation)share of households maintaining a positive surplus for all states/UTs from 2014 to 2019.
• Surplus Rates: Delhi (47%), Madhya Pradesh (45%), and Haryana (44%) top the populous states inaverage surplus rates, while Assam (31%), Bihar (31%), and West Bengal (32%) occupy the lowest spots.Tripura (24%) seems to have the lowest surplus rate among both non-populous states and overall, whileChandigarh (49%) and Sikkim (45%) show the highest surplus rates among non-populous states/UTs.Table 3 shows the average (and standard deviation) of the surplus rate maintained by householdsmaintaining a positive surplus—over the time period of 2014-19—for all states/UTs.
• Average annual growth in surplus rate: We find that twenty states/UTs show positive growth in surplusrate over the last six years, while it has declined in eight states/UTs. Among the populous states,24 UttarPradesh (6.5%), Haryana (6.1%), and Delhi (5.9%) have experienced the highest average annual growthin surplus rates, while Odisha (-4.8%), Bihar (-2.3%), and Jharkhand (-2.2%) have seen their surplus ratesdip the most. Among the non-populous states, Meghalaya (16.9%) and Himachal Pradesh (12.3%) showthe highest growth, while Uttarakhand (-4.5%) and Chandigarh (-2.1%) have seen their surplus rates sinkover the period. Table 1 shows the average annual growth in surplus rate for all states/UTs from 2014to 2019.
07
The state-level analysis shows that there’s a sizable portion of households in each state that are left with a surplus after fulfilling their monthly expense obligations. However, contrasting it with findings from our earlier research brief on the participation across different financial assets (Agrawal 2020), we find that there are significant gaps between households’ formal savings potential and their actual savings in formal financial instruments. While this analysis shows that households have the potential to save (which has been increasing for households in almost 20 states and UTs over time), the participation across formal financial assets remains low.
For example, in most states, except a few northern frontier states and Kerala, the participation in a simple formal savings instrument like Fixed Deposit is significantly lower than the percentage of households that maintain a positive surplus. The gap only widens in the case of other savings instruments such as Post-office Savings, National Savings Certificate, Provident Fund, and Health Insurance, suggesting the lack of customised savings instruments that suit the financial requirement, capacity, and circumstances of households.
Bridging the gap between the potential to save and actual savings in formal financial instruments could boost the overall financial savings of the country, which, in turn, is beneficial for economic growth. Moreover, we have not explored the reasons behind households with a negative surplus in this brief. But it is important to study these reasons, and coping mechanisms of such households as this percentage becomes even higher for states such as Gujarat (39%), Assam (33%), Madhya Pradesh (33%), Tripura (33%), and Punjab (30%). The appendix contains detailed time-series plots of how the share of households maintaining a positive surplus and the surplus rate itself has changed month on month in each State/UT from January 2014 to December 2019.
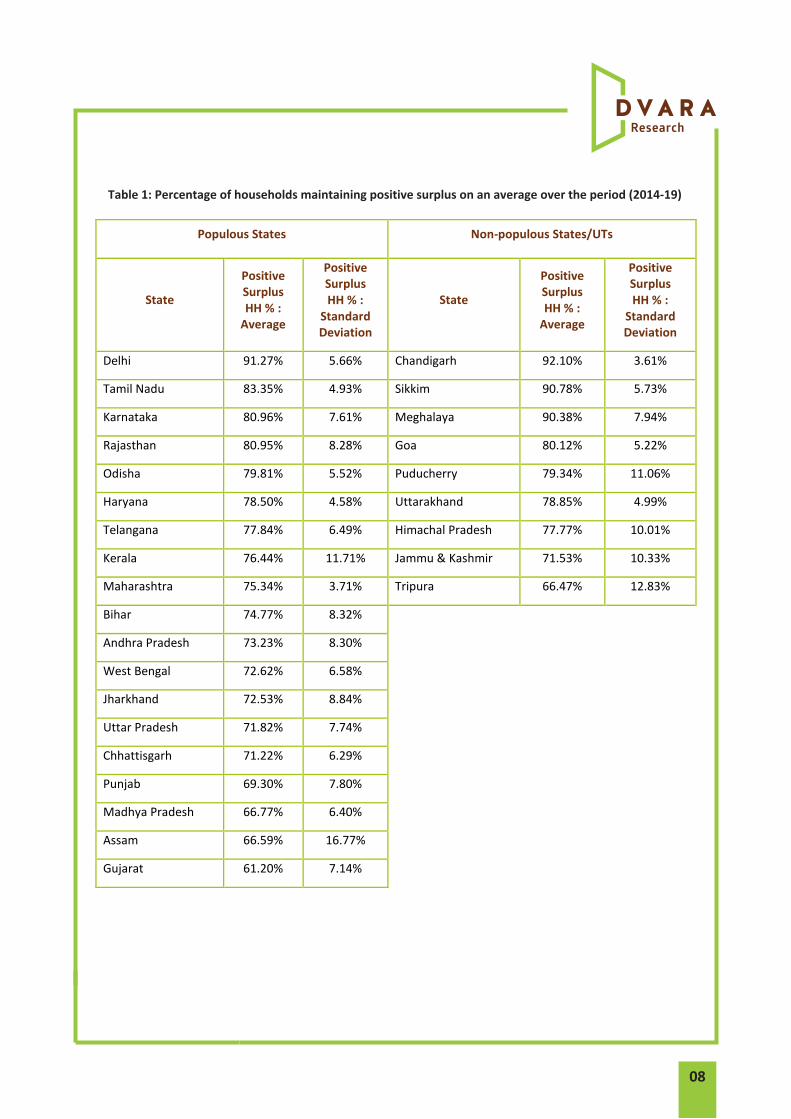
08
Table 1: Percentage of households maintaining positive surplus on an average over the period (2014-19)
Populous States Non-populous States/UTs
State
Positive Surplus HH % :
Average
Positive Surplus HH % :
Standard Deviation
State
Positive Surplus HH % :
Average
Positive Surplus HH % :
Standard Deviation
Delhi 91.27% 5.66% Chandigarh 92.10% 3.61%
Tamil Nadu 83.35% 4.93% Sikkim 90.78% 5.73%
Karnataka 80.96% 7.61% Meghalaya 90.38% 7.94%
Rajasthan 80.95% 8.28% Goa 80.12% 5.22%
Odisha 79.81% 5.52% Puducherry 79.34% 11.06%
Haryana 78.50% 4.58% Uttarakhand 78.85% 4.99%
Telangana 77.84% 6.49% Himachal Pradesh 77.77% 10.01%
Kerala 76.44% 11.71% Jammu & Kashmir 71.53% 10.33%
Maharashtra 75.34% 3.71% Tripura 66.47% 12.83%
Bihar 74.77% 8.32%
Andhra Pradesh 73.23% 8.30%
West Bengal 72.62% 6.58%
Jharkhand 72.53% 8.84%
Uttar Pradesh 71.82% 7.74%
Chhattisgarh 71.22% 6.29%
Punjab 69.30% 7.80%
Madhya Pradesh 66.77% 6.40%
Assam 66.59% 16.77%
Gujarat 61.20% 7.14%
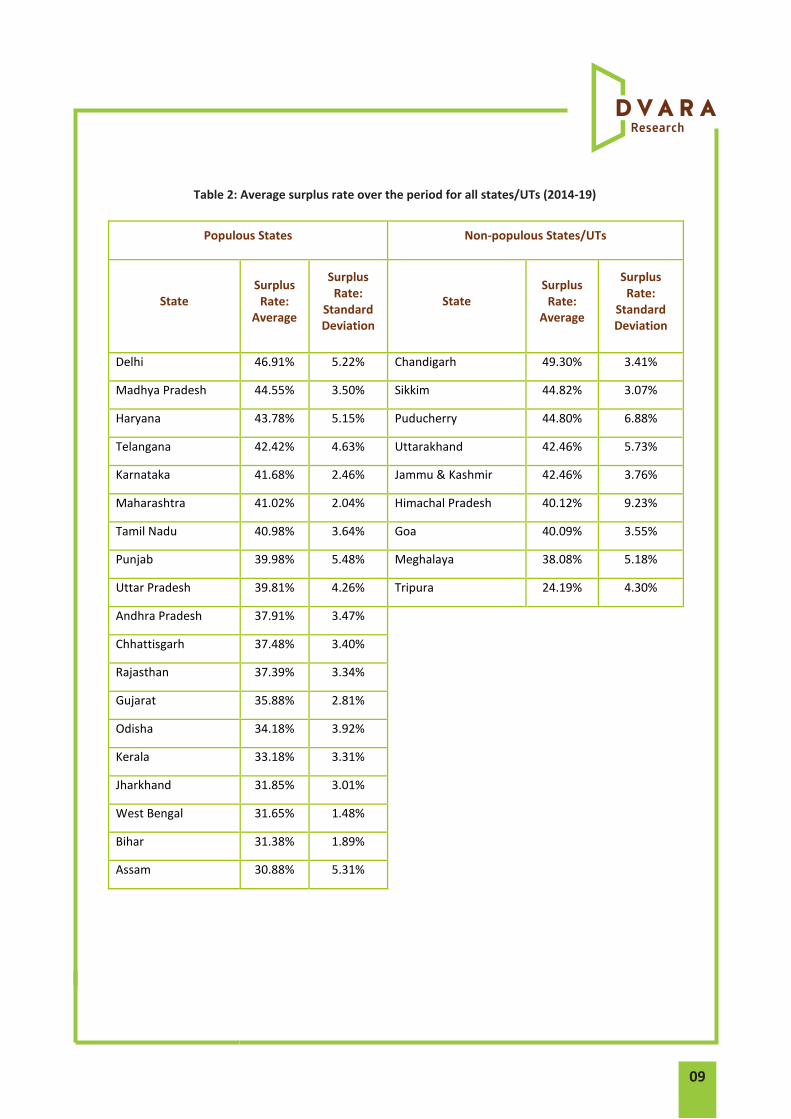
09
Table 2: Average surplus rate over the period for all states/UTs (2014-19)
Populous States Non-populous States/UTs
State Surplus Rate:
Average
Surplus Rate:
Standard Deviation
State Surplus
Rate: Average
Surplus Rate:
Standard Deviation
Delhi 46.91% 5.22% Chandigarh 49.30% 3.41%
Madhya Pradesh 44.55% 3.50% Sikkim 44.82% 3.07%
Haryana 43.78% 5.15% Puducherry 44.80% 6.88%
Telangana 42.42% 4.63% Uttarakhand 42.46% 5.73%
Karnataka 41.68% 2.46% Jammu & Kashmir 42.46% 3.76%
Maharashtra 41.02% 2.04% Himachal Pradesh 40.12% 9.23%
Tamil Nadu 40.98% 3.64% Goa 40.09% 3.55%
Punjab 39.98% 5.48% Meghalaya 38.08% 5.18%
Uttar Pradesh 39.81% 4.26% Tripura 24.19% 4.30%
Andhra Pradesh 37.91% 3.47%
Chhattisgarh 37.48% 3.40%
Rajasthan 37.39% 3.34%
Gujarat 35.88% 2.81%
Odisha 34.18% 3.92%
Kerala 33.18% 3.31%
Jharkhand 31.85% 3.01%
West Bengal 31.65% 1.48%
Bihar 31.38% 1.89%
Assam 30.88% 5.31%

Populous States Non-populous States/UTs
State
Average Annual
Growth in Surplus
Rate
State
Average Annual
Growth in Surplus
Rate
Uttar Pradesh 6.5% Meghalaya 16.9%
Haryana 6.1% Himachal Pradesh 12.3%
Delhi 5.9% Tripura 7.6%
Telangana 4.9% Sikkim 7.2%
Kerala 4.4% Goa 3.4%
Assam 3.9% Jammu & Kashmir 2.8%
Chhattisgarh 2.9% Puducherry 0.9%
Maharashtra 1.4% Chandigarh -2.1%
Madhya Pradesh 1.4% Uttarakhand -4.5%
Karnataka 1.3%
Gujarat 0.5%
Punjab 0.3%
West Bengal 0.3%
Tamil Nadu -1.0%
Rajasthan -1.8%
Andhra Pradesh -2.1%
Jharkhand -2.2%
Bihar -2.3%
Odisha -4.8%
10
Table 3: Average annual growth in surplus rate for all states/ UTs (2014-19)

11
5. Conclusion
In this analysis, we study the formal savings potential of the households over six years from 2014-19 using the CMIE-CPHS data on household income and expenditure. We find that though the household savings rate of the country has been declining over time, households’ potential to save formally, or the household surplus rate has been increasing over time. We argue that the potential reasons for this could be three. One, we only capture the surplus rate of households that posit a positive surplus, which corresponds to 75-80% of the households from the data. Two, the household savings rate of the country, as reported annually by Central Statistics Office (CSO), is different from the surplus rate that we have calculated as the household savings rate measures the actual savings of the country in formal sources – both in physical and financial assets, whereas the surplus rate is the households’ potential to save. This potential may be higher than their actual formal savings as the households might have informal ways to save, which are not captured in the overall household savings rate. Three, CMIE collects information only on whether the household has saved in a particular asset as opposed to the share of wealth in that asset. Therefore, the savings in physical assets such as gold and real estate by households could also be included in our surplus rate calculations, making it higher than the actual household savings rate.
To assess the second reason, we map the surplus rate of households by different income quintiles and find that even the lowest income quintile households exhibit a surplus rate of about 20%. But the lowest income quintile households have lower access to formal savings and often rely on informal modes of savings.
Further, we also look at how the surplus rate has changed over time for different states of the country. By comparing the percentage of households having a positive surplus in different states with the participation of households in different financial assets, using one of our earlier pieces of research on this topic, we see that there are significant gaps between households’ potential to save and their actual participation in formal savings instruments.
Our analysis shows that a vast majority of households across all states maintain a positive surplus, corroborating previous literature (Banerjee and Duflo 2007). But many structural and behavioural constraints may have continued to prevent them from utilising different financial instruments to maximise their surplus for future plans and welfare (Karlan, Ratan and Zinman 2014). While we do not explore these constraints in this brief, we believe that these findings reinforce the case for financial service providers to innovate across products and processes, to enable household savings in formal instruments. This will not only increase household welfare but also increase the economic growth of the country by directly increasing the savings rate.

12
References
Agrawal, Niyati. 2020. https://www.dvara.com/research/household-finance/how-do-the-portfolios-of-indian-households-differ-across-states/. September. https://www.dvara.com/research/wp-content/uploads/2020/09/How-Do-the-Portfolios-of-Indian-Households-Differ-Across-States.pdf.
Athukorala, Prema-Chandra, and Kunal Sen. 2004. "The Determinants of Private Saving in India." World Development 491-503.
Banerjee, Abhijit, and Esther Duflo. 2007. "The Economic Lives of the Poor." Journal of Economic Perspectives 141-167.
Cole, Shawan, Thomas Sampson, and Bilal Zia. 2011. "Prices or Knowledge? What Drives Demand for Financial Services in Emerging Markets?" The Journal of Finance 1933-1967.
Collins, Daryl, Jonathan Morduch, Stuart Rutherford, and Orlanda Ruthven. 2009. Portfolios of the Poor: How the World's Poor Live on $2 a day. Princeton University Press.
Household Finance Committee. 2017. Indian Household Finance. Reserve Bank of India.
Karlan, Dean, Aishwarya Lakshmi Ratan, and Jonathan Zinman. 2014. "Savings by and for the Poor: A Research Review and Agenda." Review of Income and Wealth 36-78.
Kumar, Sanjaya Kumar, and Ruchi Sharma. 2017. "Does Financial Inclusion Spur Economic Growth in India?" The Journal of Developing Areas 215-228.
Kumar, Shailesh, and Misha Sharma. 2020. Picturising the Portfolios of Indian Households. July. https://www.dvara.com/research/wp-content/uploads/2020/07/Picturising-the-Portfolios-of-Indian-Households.pdf.
Patnaik, Ila, and Radhika Pandey. 2019. Savings and capital formation in India. June 10. https://macrofinance.nipfp.org.in/PDF/PatnaikPandey-savings_and_capital_formation_in_India.pdf.
Samantaraya, Amaresh, and Suresh Kumar Patra. 2014. "Determinants of Household Savings in India: An Empirical Analysis Using ARDL Approach." Economic Research International (Hindawi Publishing Corporation).
Sethi, Dinabandhu, and Debashis Acharya. 2018. "Financial Inclusion and Economic Growth linkage: Some Cross Country Evidence." Journal of Financial Economic Policy 369-385.

13
Appendix
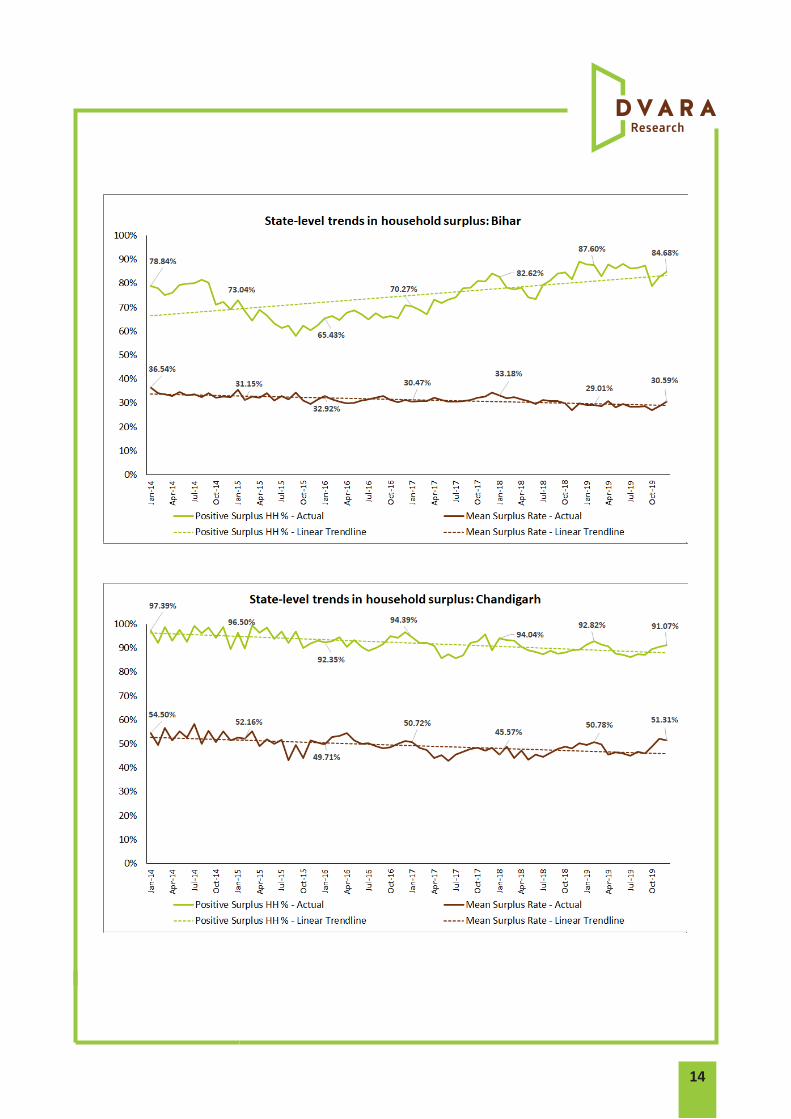
14

15

16

17

18
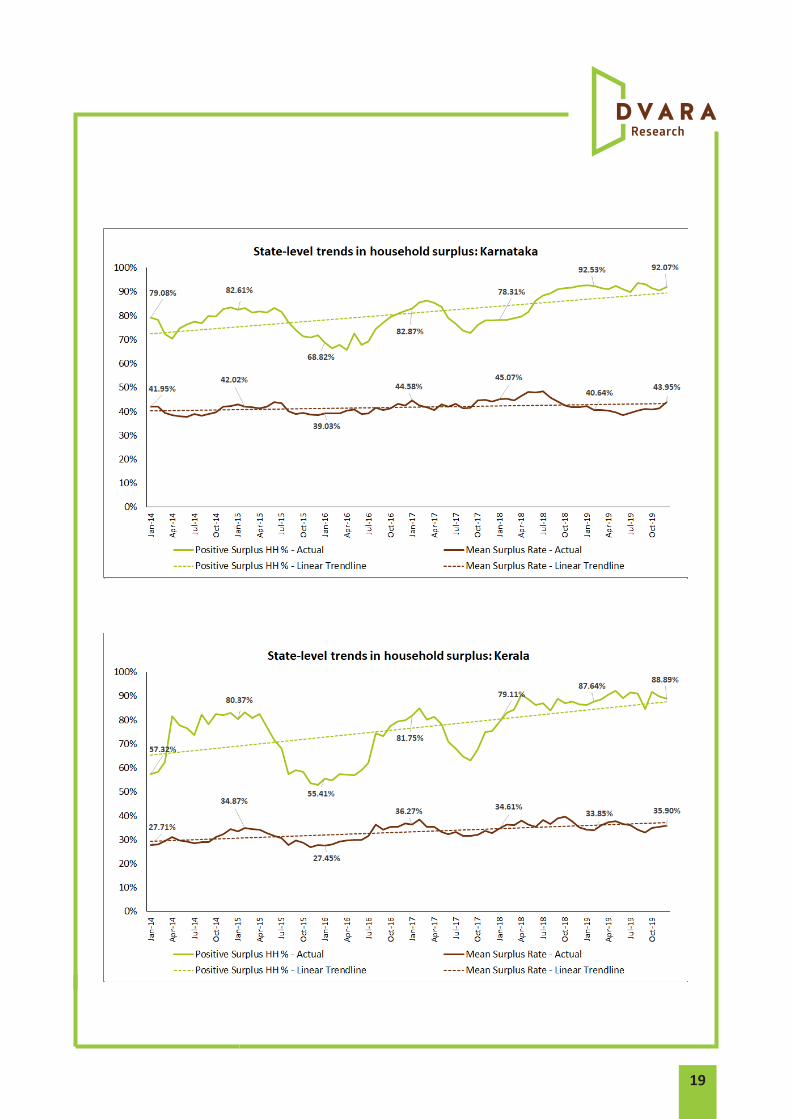
19

20

21

22
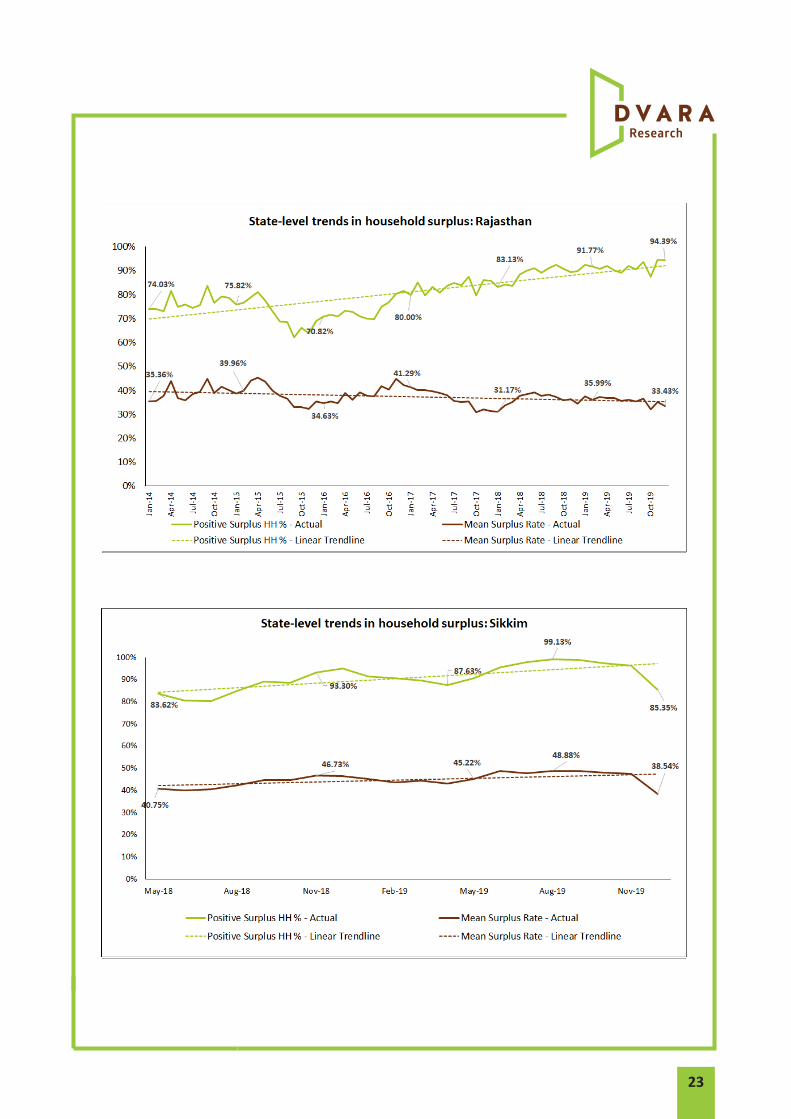
23

24

25
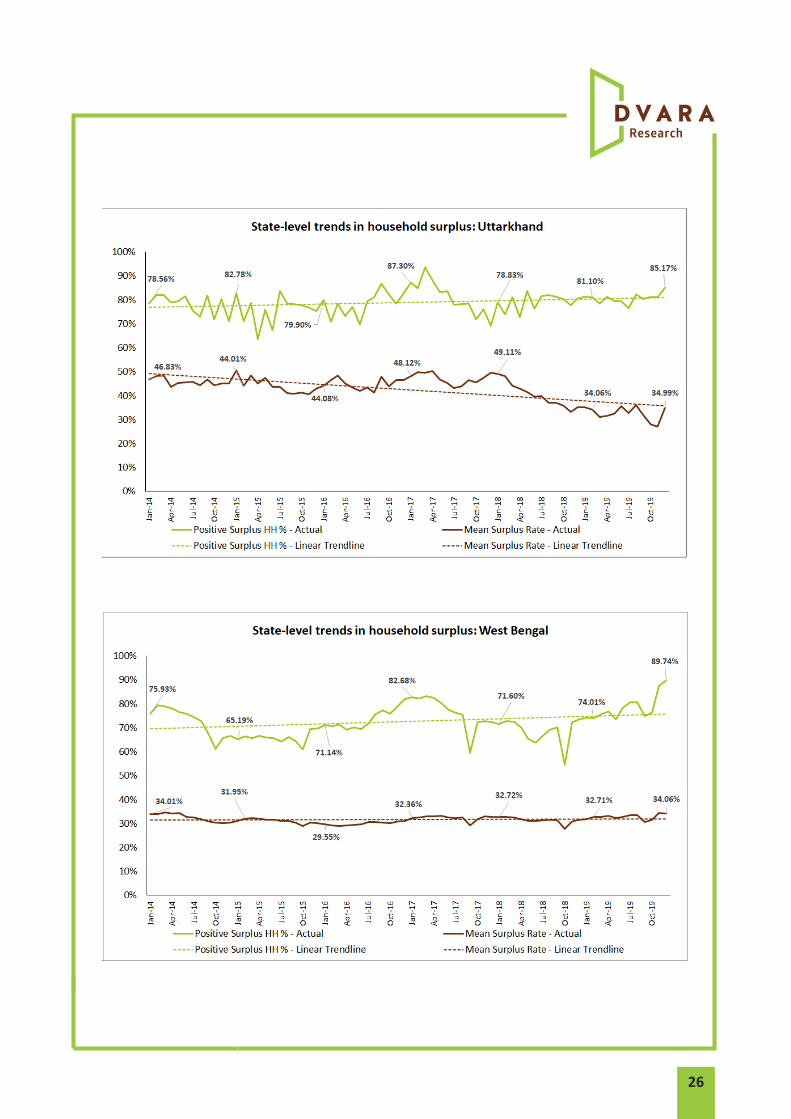
26