analysing 21st century meteorological and hydrological
TRANSCRIPT

J. Hydrol. Hydromech., 66, 2018, 4, 393–403 DOI: 10.2478/johh-2018-0026
393
Analysing 21st century meteorological and hydrological drought events in Slovakia
Miriam Fendeková1*, Tobias Gauster2, Lívia Labudová3, Dana Vrablíková1, Zuzana Danáčová3, Marián Fendek1, Pavla Pekárová4
1 Department of Hydrogeology, Faculty of Natural Sciences of Comenius University in Bratislava, Mlynska dolina, Ilkovičova 6, 842 15
Bratislava 4, Slovakia. 2 Institute of Applied Statistics and Computing, University of Natural Resources and Life Sciences, Gregor Mendel Str. 33, 1180 Vienna,
Austria. 3 Slovak Hydrometeorological Institute, Jeséniova 17, 833 15 Slovakia. 4 Institute of Hydrology, Slovak Academy of Sciences, Dúbravská cesta 9, 841 04 Bratislava, Slovakia. * Corresponding author. E-mail: [email protected]
Abstract: Several quite severe droughts occurred in Europe in the 21st century; three of them (2003, 2012 and 2015) hit also Slovakia. The Standardized Precipitation Index (SPI) and Standardized Precipitation and Evapotranspiration Index (SPEI) were used for assessment of meteorological drought occurrence. The research was established on discharge time series representing twelve river basins in Slovakia within the period 1981–2015. Sequent Peak Algorithm method based on fixed threshold, three parametric Weibull and generalized extreme values distribution GEV, factor and multiple re-gression analyses were employed to evaluate occurrence and parameters of hydrological drought in 2003, 2011–2012 and 2015, and the relationship among the water balance components. Results showed that drought parameters in evaluat-ed river basins of Slovakia differed in respective years, most of the basins suffered more by 2003 and 2012 drought than by the 2015 one. Water balance components analysis for the entire period 1931–2016 showed that because of continu-ously increasing air temperature and balance evapotranspiration there is a decrease of runoff in the Slovak territory. Keywords: Hydrological drought; Climatic conditions; River discharges; Probability distribution; Slovakia.
INTRODUCTION
The attention paid to drought periods occurrence is going to be more and more pronounced in both – scientific research community and governmental economy sector. Moreover, drought is much more perceived also by a general public. Ac-cording to Andreu et al. (2015), over the last 25 years droughts covered more than 800,000 km2 of EU territory (37%) and affected more than 100 million people (20%). The total cost of drought over the past 30 years amounts to more than 100 billion Euros.
Factors of drought development, quantification measures, and temporal and spatial propagation patterns are the most often studied aspects of drought in the research community. The atten-tion paid to drought research is reflected also in the number of publications which could be found in scientific databases.
The economical consequences are also quite intense through rising prices of goods because of decreased agricultural produc-tion, increase of energy prices or decrease in employment. The perception of drought in the general public is more practically oriented on drought impacts, e.g. drinking water supply short-age, threat of wild fires, heat waves threatening human´s organ-ism with over-heating and potential collapsing, degradation of aquatic ecosystems.
Several quite severe droughts occurred in Europe since the beginning of the 21st century, three of them: 2003, 2012 and 2015 hit also the territory of Slovakia.
The 2003 drought was widely studied by several authors be-cause of its pan-European character. The climate synthesis of the 2003-year drought was done by Rebetez et al. (2006). They confirmed that the 2003 meteorological data showed over wide regions monthly mean temperatures more than 4°C above the long-term mean values. The affected areas were mainly in the
South-West, from Eastern Spain to Southern Germany, includ-ing most of continental Italy, Sardinia, Corsica, Switzerland, and most of France. The heat lasted from May to September in large parts of the western and central Europe ranging from Spain to Hungary and from Iceland to Greece being pro-nounced also on the Slovak territory. The lack of precipitation was severest during the summer, but generally, precipitation was below normal from February 2003 until June 2004 (with exception of two months). Air humidity was below the normal, sunshine duration and potential evapotranspiration were clearly above normal in summer 2003.
A hydrological review of the 2003 drought describing the similar effect of the extremely high summer temperatures and low precipitation on streamflow discharges was done in many countries, e.g., in UK by Marsh (2004), for the Danube basin by Mikhailova et al. (2012), for Slovakia by Sekáčová et al. (2004) and by Melová and Lupták (2006). The review on Europe-wide reduction in primary productivity caused by the heat and drought in 2003 was done by Ciais et al. (2005).
Kendon et al. (2013) reported for the UK that for 2010–2012, the worst effects of an intense summer drought were avoided, because summer 2011 was cool and rather wetter than average overall. Most of the dry months occurred in the au-tumn, winter and spring seasons. Even though the 2010–2012 drought was not as severe as that of 1975–1976, it is compara-ble with several other major droughts in the past. According to Cindrić et al. (2016), the Croatian 2011–2012 drought was characterised by extremely long duration in the continental region and in the highlands, where it has had the highest magni-tudes since the beginning of the twentieth century. In compari-son with the extreme 2003 drought, which had the highest intensity mostly on short-time scales but was associated with a strong heat wave during the summer, the 2011–2012 drought

Miriam Fendeková, Tobias Gauster, Lívia Labudová, Dana Vrablíková, Zuzana Danáčová, Marián Fendek, Pavla Pekárová
394
was a long-lasting one. The whole of 2003 was one of the 10 driest years since the beginning of the twentieth century due to extremely low spring precipitation amounts; whilst 2011 was one of the 2 driest years in the continental region and in the highlands. Corduneanu et al. (2016) analysed 2011–2012 drought, which was extremely severe in Prut River basin (Ro-mania), beginning in late autumn in 2011 and lasted until au-tumn 2012. Zahradníček et al. (2015) noted that the weather conditions from August 2011 to May 2012 produced an extreme drought in the eastern Czech Republic (Moravia), whereas the patterns were nearly normal in its western region (Bohemia). According to the Palmer Drought Severity Index, the 2012 drought was classified as the worst in the past 130 years. The drought patterns were related to the prevailing high-pressure systems over Central Europe and the occurrence of weather types with different precipitation amounts in Bohemia and Moravia. The most substantial drought effects occurred in the agricultural sector. A decrease in cereal yields was observed in the analysed production areas in Moravia, which was un-precedented in the past 52 years. According to Zahradníček et al. (2015), Austria and Slovakia experienced a similar drought. Vido et al. (2016) documented the physiological response of tree species in the Central Slovakia on the driest months of the 2012; Šustek et al. (2017) documented the influence of the 2012 drought on decrease of beetle species number in the Tatra Mts. area.
The 2015 drought was studied from the point of view of pre-cipitation and derived soil moisture by Orth et al. (2016). The performed analyses reveal that the 2015 event was drier than both the recent 2003 or 2012 extreme summers in Central Eu-rope. In terms of precipitation and temperature anomalies, the 2015 summer in Central Europe is found to lie between histori-cal climate in the region and that characteristic of the Mediter-ranean area. According to the authors, the 2015 drought event illustrates that potential future drying trends have severe impli-cations and could be stronger than commonly assumed from the entire IPCC AR5 model ensemble. Ionita et al. (2017) con-firmed that the summer 2015 was the hottest and climatologi-cally driest one over the 1950–2015 study period for an area stretching from the eastern Czech Republic to Ukraine. Other detailed studies were done on the pan-European scale by van Lanen et al. (2016), and Laaha et al. (2017). According to Laaha et al. (2017), the 2015 drought, comparing to 2003 drought, had a different spatial extent and in terms of low flow magnitudes the drought was rather moderate in most parts of the Europe, but more severe with return period of 100 years in Czech Republic, South-Eastern Germany and Northern Austria. The occurrence of the 2015 drought for six stations in the mid-dle Danube River basin was predicted using the stochastic modelling by Stojkovic et al. (2017).
Whereas the 2003 and 2012 droughts affected almost the whole territory of Slovakia, the 2015 drought in Slovakia can be characterized by spatial and temporal variability, affecting various regions with different strengths. The hydrological eval-uation of the year 2015 was done by Škoda et al. (2016), drought development in groundwater was analysed by Slivová and Kullman (2016).
The paper is aiming to study five main items: 1. to characterize the meteorological situation in evaluated
years 2003, 2012 and 2015 on the Slovak territory in context with the pan-European situation,
2. to assess meteorological drought in evaluated years based on Standardized Precipitation Index (SPI) and Standardized Precipitation and Evapotranspiration Index (SPEI),
3. to assess hydrological drought in evaluated years from the point of view of discharge absolute values, drought duration, deficit volumes, intensity and timing,
4. to analyse and discuss the hydrological drought with respect to long-term hydrological balance components changes
5. to accomplish the comparative analysis of the estimated drought parameters among the river basins and evaluated years.
MATERIAL AND METHODS Study region
Slovakia is a landlocked central European country (16°–
23° E, 47°–50° N), bordered by Poland, Ukraine, Hungary, Czech Republic and Austria (Fig. 1). The Slovak territory co-vers 49,035 km2 with almost 80% over 720 m a.s.l. altitude. The Slovak middle and northern areas are mountainous with the Western Carpathian Arch, and lowlands are typical in the South and East. The highest point is the 2,655 m Gerlachovsky Peak in the northern High Tatra Mts. and the lowest is at 94 m near Streda nad Bodrogom village in the Eastern Slovak lowland. The climate varies between temperate and continental climate zones with relatively warm summers and cold, cloudy and humid winters. The average winter temperature is –2°C; with January the coldest month and the High Tatras the coldest area. The average summer temperature is 21°C, with July and Au-gust the warmest months and the Danubian Lowland the warm-est area. Temperature and precipitation are altitude dependent, with annual precipitation ranging from 450 mm in the southern lowlands to over 2,000 mm in the northern High Tatras (Land-scape Atlas of the Slovak Republic, 2002).
Slovakia has the Morava, Váh, Hron, Slaná, Ipeľ, Hornád, and Bodrog as main tributaries to the Danube River. Most Slovak territory (96%) is in the Danube River basin with the above rivers draining to the Black Sea. The remaining 4% drains to the Baltic Sea through the Poprad and Dunajec tribu-taries of the Vistula River. The main European divide between the Black Sea and Baltic Sea drainage areas follows the lower ridges and the flat landscape of the foothills of the High Tatras near Štrba and Šuňava villages. The long-term average water balance (period 1961–1990) can be described by the equation (Majerčáková in Landscape Atlas of the Slovak Republic, 2002): P (734 mm) = ETP (494 mm including other minor losses) +
+ R (240 mm) where: P = precipitation, ETP = evapotranspiration and R = runoff, considerably varying between years.
The mountainous character of the landscape and the position of mountain ranges, mostly stretching in the SW-NE direction, create conditions for orographic precipitation. The orographic division produces heavy rains in Slovak mountainous areas. The combination of the above factors ensures variable condi-tions with extreme hydrological phenomena occurrence in Slovakia.
Hydrological and meteorological data
Two types of the measured data were used for the analysis:
(1) meteorological data on precipitation and air temperatures in a monthly step and (2) streamflow discharges from 12 gauging stations in a daily step.
The meteorological data used for Standardized Precipitation Index (SPI) calculation consisted in average monthly precipitation data over each of the evaluated river basins. The Standardized

Analysing 21st century meteorological and hydrological drought events in Slovakia
395
Table 1. Basic data on river basins at discharge gauging stations.
Profile number and name River Area (km2)
Gauge zero (m a.s.l.)
Coordinates WGS 84 - E
Coordinates WGS 84 - N
5020 Šaštín-Stráže Myjava 32.02 324.34 17.15619 48.64055 5550 Liptovský Mikuláš Váh 1107.21 567.68 19.60351 49.08637 5840 Trstená Oravica 129.95 585.49 19.59491 49.35301 6200 Kysucké Nové Mesto Kysuca 955.09 346.09 18.78494 49.29682 6730 Nitrianska Streda Nitra 2093.71 158.27 18.17255 48.52395 6820 Vieska nad Žitavou Žitava 295.46 154.27 18.35458 48.31590 7290 Brehy Hron 3821.38 194.27 18.64623 48.40672 7440 Holiša Ipeľ 685.67 172.40 19.74105 48.29752 7900 Vlkyňa Rimava 1377.41 150.77 20.30173 48.28540 8320 Chmeľnica Poprad 1262.41 507.41 20.73023 49.28918 8870 Košické Oľšany Torysa 1298.30 185.70 21.33654 48.73260 9500 Hanušovce nad Topľou Topľa 1050.05 160.40 21.51777 49.03310
Fig. 1. Location of evaluated river basins. Precipitation and Evapotranspiration Index (SPEI) values were calculated for meteorological stations located within or in the vicinity of the evaluated river basin, the value of potential evapotranspiration was estimated using the Penman-Monteith equation. The meteorological stations used for SPEI calcula-tions were Senica, Oravská Lesná, Čadca, Prievidza, Mo-chovce, Žiar nad Hronom, Boľkovce, Rimavská Sobota, Podol-ínec, Prešov and Čaklov. Data representing the period 1.1.1981 to 30.6.2016 were used in both cases.
Moreover, air temperatures and areal precipitation data from the SHMI covering the Slovak territory were analyzed and compared with the meteorological conditions across the Europe (WMO, 2004; WMO, 2013; WMO, 2016).
Daily discharges at 12 gauging stations of Myjava, Váh, Oravica, Kysuca, Nitra, Žitava, Hron, Ipeľ, Rimava, Poprad, Topľa and Torysa River basins (Fig. 1) were processed, cover-ing the period 1.1.1981 to 30.6.2016. The river basins were selected to cover the area of Slovakia; the majority of gauging profiles represent the near-natural runoff conditions. The basic data on river basins up to evaluated gauging stations are in Table 1. The evaluated time period included also the first half of the year 2016 in order to detect the multi-year hydrological drought occurrence if present in evaluated time series.
The homogeneity of the time series was assessed using the software package AnClim (Stepanek, 2003). The Alexandersson test (Alexandersson and Moberg, 1997; Alexandersson, 1986) was used to test the mean value change, as represented by the change in the mean value and the variance. Some statistical tests and procedures used within this study are based upon the normality requirement of the tested series. Therefore the Χ2 and the Kolmogorov-Smirnov tests were used to test the distribution normality of the annual discharge series.
The spatial value of precipitation in each river basin was ob-tained using weighted average, in which the weights were esti-mated considering the area covered by the Thiessen polygons of rain-gauge stations, but also with consideration of annual precipitation regime at each station, which influence the contri-bution of particular station in total precipitation fallen in the river-basin.
The Standardized Precipitation Index (SPI) (McKee et al., 1993) was used to calculate values of indexes for 3-, 9- and 12-months. The SPI calculation for any location is based on the long-term precipitation record for a desired period (20–30 years of monthly values, optimally 60–70 years). This long-term record is fitted to a probability distribution (Gamma distribution

Miriam Fendeková, Tobias Gauster, Lívia Labudová, Dana Vrablíková, Zuzana Danáčová, Marián Fendek, Pavla Pekárová
396
is recommended), which is then transformed into a normal distribution so that the mean SPI for the location and desired period is zero. Positive SPI values indicate greater than median precipitation and negative values indicate less than median precipitation. Because the SPI is normalized, wetter and drier climates can be represented in the same way; thus, wet periods can also be monitored using the SPI (Table 2). The n-month SPI (n could be equal to 3, 6, 9, 12 or 24 months) compares the precipitation for that period with the same n-month period over the historical record. The 6-month SPI (SPI6) indicates season-al to medium-term trends in precipitation. SPIs of 9-, 12- and 24-months can be regarded as indicative for stream flows, reservoir levels, and even groundwater levels at longer time-scales (WMO, 2013). The SPI12 values were used for detailed evaluation of the meteorological drought in the studied area; they were calculated based on monthly weighted average areal basin precipitation. Table 2. Limit values of the standardized precipitation index SPI (according to McKee et al., 1993).
SPI value Classification 2.00 and more extremely wet 1.50 to 1.99 very wet 1.00 to 1.49 moderately wet
–0.99 to 0.99 near normal –1.00 to –1.49 moderately dry –1.50 to –1.99 very dry –2.00 and less extremely dry
The Standardized Precipitation and Evapotranspiration Index
(SPEI) was also used to evaluate the meteorological drought occurrence and intensity. The SPEI index was designed to take into account both precipitation and potential evapotranspiration (PET) in determining drought (Vincente-Serrano et al., 2010). Thus, unlike the SPI, the SPEI captures the main impact of increased air temperature on water demand. The same classifi-cation scheme as for SPI (Table 2) was also used for the SPEI results analysis.
The runoff from the Slovak territory is calculated as the sum of the runoff depths from respective river basins, mostly based on the closing profiles data, recalculated into the total river basin area. In the case the river is the boundary river with an-other country, the runoff depths of the river tributaries are used for calculation.
Four basic drought parameters – the annual minimum 7 day-discharge (m3 s–1), maximum drought duration (days), maximum deficit volume (m3) and drought intensity (m3 day–1) were calcu-lated. The annual minimum 7-day index (AM7), representing the magnitude of the low flow event of a year, was obtained by using a central 7-day moving average (Laaha et al., 2017).
A constant threshold, given by the Q80 low flow quantile [P(Q ≥ Q80) = 0.8] computed for the entire reference period 1981–2010 was used to identify the largest absolute dry states of the system. The concept of Sequent Peak Algorithm (SPA), based on depletion and recovery of the storage required to sustain the threshold discharge (Tallaksen and Van Lanen, 2004), was used in the study. This concept often leads to detec-tion of the multiyear drought in conditions with snowy winters when the discharges are naturally low because of very low recharge. After the drought event series have been identified, the event with the maximum volume per year was selected, described by drought duration and deficit volume. The last parameter - the drought intensity was calculated as the ratio between deficit volume and drought duration. All four drought parameters were compared with the values calculated for the reference period 1981–2010.
A three-parameter Weibull distribution was used to calculate the return period of the annual minimum value, and a general-ized extreme values distribution (GEV) was used to calculate the return period of maximum drought duration, maximum deficit volume and drought intensity. The example of the drought parameters return periods estimation for Hron River basin is in Fig. 2. Timing of drought, based on the dates of drought beginning and termination, and its seasonality were also studied.
Fig. 2. Return periods estimation for drought parameters in Hron River basin at Brehy.
Analysing 21st century meteorological and hydrological drought events in Slovakia
397
Classical factor analysis (method of principal factor, Varimax rotation) (Überla, 1971) was applied on all estimated drought parameters aiming to find relationships among the evaluated river basins. Multiple regression methods were applied to esti-mate relations among the water balance components. The area`s average precipitation and runoff were calculated from the measured data, the balance evapotranspiration was calculated as the difference between the precipitation and runoff values. RESULTS AND DISCUSSION Meteorological conditions
The study of meteorological data showed that the initial cli-
matic conditions over the Europe were quite similar in all three dry years (2003, 2012, 2015). There was a positive 500-hPa geopotential height anomaly in the upper level atmospheric circulation over the continental Europe, especially over the central and Eastern Europe (Ionita et al., 2017; WMO, 2004; WMO, 2013; WMO, 2016).
The average summer temperatures for 2003 were higher than the long-term average of 1951–2015 across Slovakia. The anomaly reached up to 2.1°C in some places (South-Western part, the Hurbanovo station). Precipitation totals reached the area`s average value of 573 mm (74.5% of the long-term aver-age, calendar year); the average precipitation deficit reached 189 mm (www.shmu.sk). According to area`s average precipi-tation, the year 2003 was very dry. However, two preceding years 2001 and 2002 were wet when comparing with the long-term average 1901–2000 (Melová and Lupták, 2006).
The temperature for 2012 was also higher than long-term average; the anomaly in Hurbanovo (SW Slovakia) reached 1.9°C. Summer months were the warmest. According to precip-itation the year was classified as normal with the deficit of 49 mm, the highest deficit was reached in March and August with 23 and 26% of the long-term average (www.shmu.sk).
The temperature for 2015 was 2.0 (the Hurbanovo station, SW Slovakia) to 2.3°C (the Košice station, SE Slovakia) higher than the long-term average of 1961–1990. Annual pre-cipitation reached 710 mm which makes 94.5% of the long-term average (www.shmu.sk). According to area`s average precipitation, the year was classified as normal with a deficit of 41 mm.
The temperature in summer and beginning of fall in Slo-vakia in all three years was higher (Table 3), but the precipita-
tion totals were lower than the long-term average of 1961–1990 for water year. Hydrological conditions
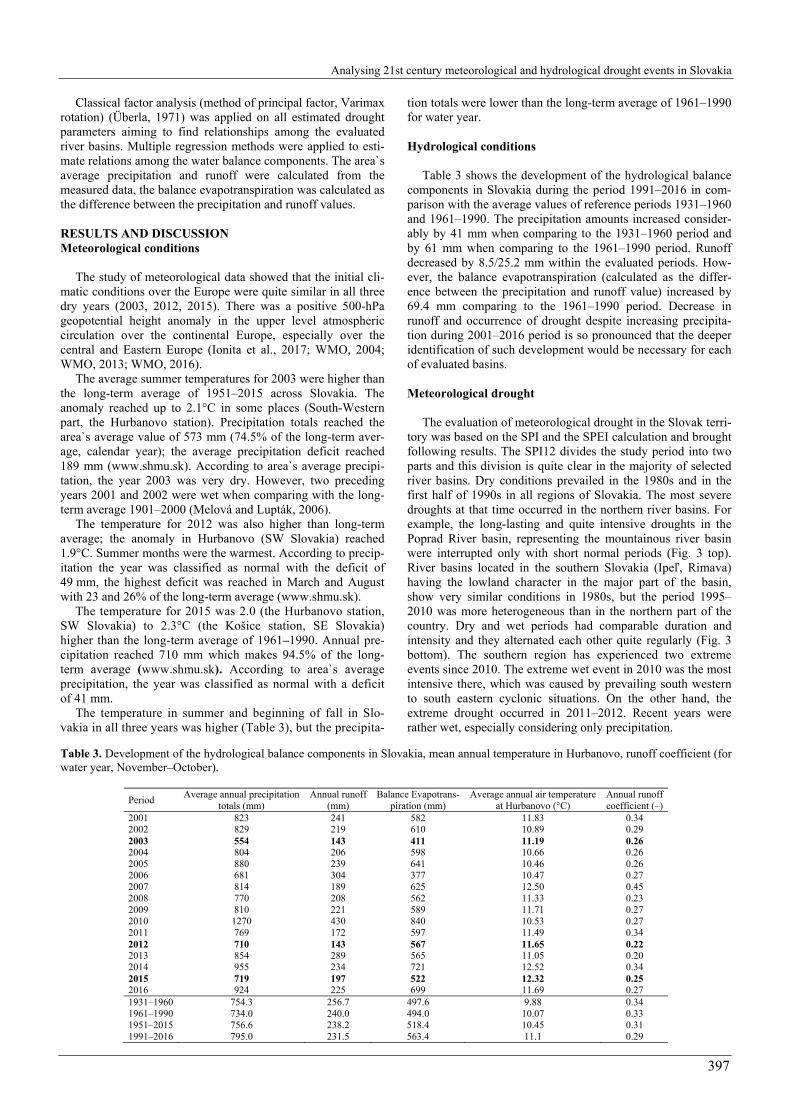
Table 3 shows the development of the hydrological balance components in Slovakia during the period 1991–2016 in com-parison with the average values of reference periods 1931–1960 and 1961–1990. The precipitation amounts increased consider-ably by 41 mm when comparing to the 1931–1960 period and by 61 mm when comparing to the 1961–1990 period. Runoff decreased by 8.5/25.2 mm within the evaluated periods. How-ever, the balance evapotranspiration (calculated as the differ-ence between the precipitation and runoff value) increased by 69.4 mm comparing to the 1961–1990 period. Decrease in runoff and occurrence of drought despite increasing precipita-tion during 2001–2016 period is so pronounced that the deeper identification of such development would be necessary for each of evaluated basins.
Meteorological drought
The evaluation of meteorological drought in the Slovak terri-
tory was based on the SPI and the SPEI calculation and brought following results. The SPI12 divides the study period into two parts and this division is quite clear in the majority of selected river basins. Dry conditions prevailed in the 1980s and in the first half of 1990s in all regions of Slovakia. The most severe droughts at that time occurred in the northern river basins. For example, the long-lasting and quite intensive droughts in the Poprad River basin, representing the mountainous river basin were interrupted only with short normal periods (Fig. 3 top). River basins located in the southern Slovakia (Ipeľ, Rimava) having the lowland character in the major part of the basin, show very similar conditions in 1980s, but the period 1995–2010 was more heterogeneous than in the northern part of the country. Dry and wet periods had comparable duration and intensity and they alternated each other quite regularly (Fig. 3 bottom). The southern region has experienced two extreme events since 2010. The extreme wet event in 2010 was the most intensive there, which was caused by prevailing south western to south eastern cyclonic situations. On the other hand, the extreme drought occurred in 2011–2012. Recent years were rather wet, especially considering only precipitation.
Table 3. Development of the hydrological balance components in Slovakia, mean annual temperature in Hurbanovo, runoff coefficient (for water year, November–October).
Period Average annual precipitation
totals (mm) Annual runoff
(mm) Balance Evapotrans-
piration (mm) Average annual air temperature
at Hurbanovo (°C) Annual runoff coefficient (–)
2001 823 241 582 11.83 0.34 2002 829 219 610 10.89 0.29 2003 554 143 411 11.19 0.26 2004 804 206 598 10.66 0.26 2005 880 239 641 10.46 0.26 2006 681 304 377 10.47 0.27 2007 814 189 625 12.50 0.45 2008 770 208 562 11.33 0.23 2009 810 221 589 11.71 0.27 2010 1270 430 840 10.53 0.27 2011 769 172 597 11.49 0.34 2012 710 143 567 11.65 0.22 2013 854 289 565 11.05 0.20 2014 955 234 721 12.52 0.34 2015 719 197 522 12.32 0.25 2016 924 225 699 11.69 0.27 1931–1960 754.3 256.7 497.6 9.88 0.34 1961–1990 734.0 240.0 494.0 10.07 0.33 1951–2015 756.6 238.2 518.4 10.45 0.31 1991–2016 795.0 231.5 563.4 11.1 0.29

Miriam Fendeková, Tobias Gauster, Lívia Labudová, Dana Vrablíková, Zuzana Danáčová, Marián Fendek, Pavla Pekárová
398
Fig. 3. The SPI12 in the Poprad River basin (top) and in the Ipeľ River Basin (bottom).
Involving the potential evapotranspiration into considera-tion, the wet events after 2010 were milder according to the SPEI12. If we compare the SPI12 and SPEI12, both indices reached more or less similar values until 2000. Since then the SPEI12 has got the tendency to lower values than the SPI12. The situation in the Poprad and Ipeľ River basins is in Fig. 4.
Fig. 4. The SPEI12 in the Poprad River basin (top) and in the Ipeľ River basin (bottom).
When comparing to the rest of the Slovakian territory, the
Topľa River basin (eastern Slovakia) has shown considerably different conditions since the mid-1990s. Dry conditions from the early 1990s persisted in the region until the early 2000s on contrary to the rest of basins. Another difference is in the dura-tion and intensity of following wet periods according to the SPI12. The difference between the SPI and the SPEI after 2000 is also higher than in other study areas.
Despite the fact that after 2000 three highly remarkable droughts occurred in the Eastern Slovakian area, the Torysa River basin shows similar water balance features during the whole period 1981–2015 with prevailing dry conditions accord-ing to both, SPI12 and SPEI12 values.
Completely opposite tendency in water balance was ob-served in the western river basin (Myjava), where the wet con-ditions have evidently prevailed since the mid-1990s.
Hydrological drought
The variability in physical-geographical conditions in Slo-
vakia is reflected also in very different hydrological drought periods occurrence around the country in 2003, 2012 and 2015. The results of drought parameters for all three evaluated years and for the reference period 1981–2010 are given in Table 4. Table 4. Comparison of drought event parameters in evaluated years 2003, 2012 and 2015.
River basin
Year AM7 discharge (m3 s–1)
Drought event duration (days)
Deficit volume (m3)
Intensity (m3 day–1)
Myjava
2003 0.319 222 77.2 0.348 2012 0.482 98 23.4 0.239 2015 0.519 79 6.12 0.125 Ref. period
0.672 89.2 25.7 0.230
Váh
2003 5.71 176 335 1.9 2012 4.97 125 302 2.41 2015 7.96 10 6.36 0.636 Ref. period
6.34 87.6 139 1.4
Oravica
2003 0.509 141 38.2 0.271 2012 0.636 125 48.3 0.387 2015 0.729 49 12.9 0.263 Ref. period
0.728 62.4 17.6 0.273
Kysuca
2003 2.41 60.0 63.7 1.06 2012 2.19 93.0 103.0 1.102015 1.87 142.0 189.0 1.33 Ref. period
2.51 39.7 46.0 1.11
Nitra
2003 2.6 188 281 1.49 2012 2.73 122 177 1.45 2015 3.34 107 54.7 0.512 Ref. period
4.35 69.4 71.4 0.789
Žitava
2003 0.165 149 23 0.154 2012 0.104 147 26.8 0.182 2015 0.114 36 6.17 0.172 Ref. period
0.341 72.3 9.55 0.104
Hron
2003 8.63 181 627 3.47 2012 9.83 69 240 3.48 2015 11.1 52 142 2.72 Ref. period
11.9 70.3 190 2.35
Ipeľ
2003 0.220 82 23 0.28 2012 0.153 170 50 0.294 2015 0.613 4 0.227 0.0567 Ref. period
0.403 76 15.1 0.175
Rimava
2003 0.83 232 71.2 0.307 2012 0.721 143 48.1 0.336 2015 1.01 50 20.3 0.406 Ref. period
1.35 96.2 38.9 0.335
Poprad
2003 3.35 183 179 0.97 2012 3.16 133 203 1.52 2015 3.76 43 56.3 1.31 Ref. period
4.07 76.3 107 1.18
Torysa
2003 1.10 266 210 0.79 2012 0.99 77 61.5 0.799 2015 1.12 88 66.7 0.758 Ref. period
1.83 88.9 53.3 0.458
Topľa
2003 0.913 181 153 0.844 2012 1.08 178 82.4 0.463 2015 1.13 128 85 0.664 Ref. period
1.6 60.9 42.6 0.591

Analysing 21st century meteorological and hydrological drought events in Slovakia
399
The most extreme values of all four drought parameters (AM7, duration, deficit volume and intensity) were reached within the same year only in five out of twelve evaluated river basins. This situation occurred in Kysuca River basin in 2015, in Ipeľ in 2012, and in Myjava, Nitra and Topľa in 2003, as documented in Table 4. However, this was not the case in the rest of the basins, where either the lowest AM7 value, or the longest drought duration, or the highest deficit volume did not occur in the same year as the highest drought intensity. This is the case, e.g., of the Poprad River in 2012 (drought duration was in 50 days shorter than in 2003) or of Rimava River in 2015 (the value of AM7 was the highest among all three evalu-ated years).
The deficit volumes were the highest in most of evaluated basins in 2003 and 2012, being mostly also higher than the average highest deficit volumes in the reference period 1981–2010 (Table 4). This was the case of Váh, Oravica, Nitra, Žita-va, Hron, Ipeľ, Rimava and Poprad River basins. Strongly different was the situation in Kysuca River basin, where the highest deficit volume was reached in 2015.
According to the highest value of the drought intensity, the year 2003 was the most extreme in Myjava and Topľa, the year 2012 in Váh, Oravica, Žitava and Poprad basins and 2015 in Kysuca and Rimava basins (Table 4). The drought intensity was almost the same in Nitra, Hron and Ipeľ River basins in 2003 and 2012, respectively. The specific drought conditions became evident in Torysa River basin where the drought intensity reached almost the same value in all three evaluated years 2003, 2012 and 2015.
The highest return periods of evaluated drought parameters were calculated as follows: (1) over 100 years for AM7 dis-charge minima in the Torysa River basin during the 2012 drought; (2) over 60 years for drought duration in the Hron in 2003; (3) over 50 years for maximum deficit volume in the Kysuca River in 2015 and almost 20 years for drought intensity in the Torysa River in 2012. Generally, the estimated return periods of evaluated drought parameters were higher for 2003 and 2012, reaching higher values than those, estimated for the reference period (Myjava, Žitava, Váh, Torysa) and for 2015. One exception was the situation in the Kysuca River basin, where the highest return periods were calculated for all drought parameters for the year 2015.
Hydrological drought timing
Timing of the drought periods with the highest deficit vol-
ume was different within evaluated years. The onset and ending timing of the assessed drought periods in 2003, 2011–2012, and 2015 are shown in Figs. 5, 6, and 7.
The drought in 2003 (Fig. 5) started in all basins during the summer period between 3 June and 12 August and ended be-tween the 15 January and 28 March 2004. The only exception was the drought in the Kysuca River basin which lasted only for 60 days.
The starting day for 2012 drought was more variable com-paring with the year 2003, dividing the evaluated river basins into two groups (Fig. 6). Drought in the first group which in-cludes basins located in the western, northern and eastern Slo-vakia (Myjava, Váh, Oravica, Kysuca, Poprad and Topľa River basins) started already in the period between 31 August and 29 October 2011 and lasted until January to March 2012. The second group of basins, located in the central and southern Slovakia (Nitra, Žitava, Hron, Ipeľ, Rimava and Torysa River), had the starting day of the drought between 11 May and 12 August 2012 with the deficit volume ending in the same year.
Fig. 5. Timing of 2003 droughts.
Fig. 6. Timing of 2011–2012 droughts.
Fig. 7. Timing of 2015 droughts.
Moreover, drought in Žitava, Ipeľ and Torysa River basins lasted until January 2013.
In 2015 (Fig. 7), the starting day of the drought with the highest deficit volume was between the 26 June and 24 August except of the Myjava River basin, where the onset of drought was shifted to 28 September. The 2015 drought finished in the same year in all basins out of two - in Torysa and Topľa River basins the deficit volumes estimated by the SPA method lasted until 13 January 2016 in the Torysa and 3 February 2016 in the Topľa River basin.
The prolonged drought duration from the summer-autumn months over the winter is mostly connected to the low recharge of rivers during the winter period when the precipitation fall in the form of snow and the ground surface is frozen. Despite of the reasons, such drought is labelled as a multiyear drought (Tallaksen and Van Lanen, 2004).
Inter-relations among river basins according to drought parameters
The aim of the factor analysis utilization was to look after
interrelationships among evaluated river basins according to estimated drought parameters in respective years. As it comes from the principles of the factor analysis method, the method is used either for reduction of variables in the model, or identifi-cation of groups of inter-related variables, or for finding the influence of some unobserved (underlying) variables.

Miriam Fendeková, Tobias Gauster, Lívia Labudová, Dana Vrablíková, Zuzana Danáčová, Marián Fendek, Pavla Pekárová
400
The performed analysis enabled to identify three main groups of inter-related river basins with similar behaviour with respect to drought parameters. The principal method of factor analysis (PFA method, principal factors, VARIMAX rotation) was applied; four factors were extracted when evaluating the drought parameters (Table 4) in respective basins. Three of the factors were the common ones; the fourth factor was the unique one. Results of factor loadings calculated after VARIMAX rotation are in Table 5. Numbers in bold in Table 5 are the highest values in the respective factor. The initial communality estimates have been constructed from the squared multiple correlations of each variable with all of the other variables. The resulting communalities for all variables were very high, reach-ing the values 0.83 (Oravica) to 1.0 (Rimava and Poprad). The model of four extracted factors explained the 98.99% of the total variability of the original data.
The factor 1 is a common factor which implies all river ba-sins located in the western, southern and eastern part of Slo-vakia (Myjava, Kysuca, Nitra, Žitava, Ipeľ, Rimava, Torysa and Topľa). Factor 2 is also a common factor implying river basins located in the central part of the country (Váh, Nitra and Hron) and factor 3 implies river basins in the northern part of Slovakia (Váh, Oravica and Poprad), all three representing the mountainous (alpine) type river basins. The factor 4 is a unique factor, implying only the Kysuca River basin. It can be seen, that high factor loading of the same river basin drought parame-ters could be found in two factors at the same time, as it is the case of the Kysuca River basin (factor 1 and 4), Nitra River basin (factor 1 and 2) and the Váh River basin (factor 2 and 3). The 3D plot of factor loadings for factors 1, 2 and 3 is in Fig. 8. The plot shows the distinct group of the mountainous basins located in the northern Slovakia (Poprad, Váh and Oravica), then the group of basins in the central Slovakia (Hron, Nitra) and the group of basins of the western, southern and eastern Slovakia (Myjava and Kysuca; Žitava, Ipeľ and Rimava; Topľa and Torysa).
The unobserved (underlying) variables which enabled the extraction of four factors can be identified as geographical location of the river basins, influencing the climatic conditions through the geomorphologic conditions, geological conditions, altitude, orientation towards the prevailing wet air masses movement, etc.
Inter-relationships between water balance components
Considerable changes in the water balance are observed in
Slovakia, especially during the last twenty to thirty years. After extremely low precipitation totals during normal period 1961–1990, next period 1991–2016 precipitation totals were extreme-ly high (Table 3). Despite this, runoff from the Slovak territory decreases significantly. The course of 7-years moving averages of the water balance components is presented in Fig. 9; together with the course of the Hurbanovo 7-years moving averages air temperature.
The trend in precipitation is better visible in Fig. 10 where the period 1871–2016 is showed. It is obvious, that the trend in precipitation is not monotonic unlike the winter and summer temperature courses.
A multiple linear regression (Eq. 1) was used to determine the effect of air temperature and rainfall on the areal runoff depth:
Rar = 167.60 + 0.3360 P – 17.392 T, (1) where:
Table 5. Results of drought parameters factor analysis.
River basin Factor 1 Factor 2 Factor 3 Factor 4Myjava 0.949 0.212 0.116 0.049Váh 0.026 0.710 0.665 –0.046Oravica 0.378 0.021 0.828 0.078Kysuca 0.736 0.194 0.157 0.624 Nitra 0.668 0.668 0.279 0.128Žitava 0.961 0.0728 0.246 0.098Hron 0.293 0.919 0.156 0.098Ipeľ 0.911 0.109 0.160 0.147Rimava 0.944 0.191 0.273 0.024Poprad 0.181 0.481 0.869 0.069Torysa 0.822 0.475 0.156 0.075Topľa 0.865 0.351 0.211 0.225
Fig. 8. Plot of factor loading after VARIMAX rotation.
Fig. 9. Course of 7-years moving averages of the water balance components for areal values of: R – runoff, ETb – balance evapo-transpiration, P – precipitation in Slovakia; local values of: T – 7-years moving averages of the air temperature at Hurbanovo station, Slovakia, 1931–2016 period.
Rar – average runoff from the Slovak territory; P – average precipitation annual totals on the Slovak territory; T – average annual air temperature at meteorological Hurbano-vo station.
The multiple correlation coefficient of 0.64 was reached, with the standard error of estimation amounting 46.9.
It follows from the long-term water balance analysis (Eq. 1) that a 100 mm drop in precipitation in Slovakia will cause the runoff drop of 33.6 mm. An increase of the mean annual tem-perature by 1°C brings decrease of runoff by 17.4 mm. Syn-chronously an increase of the mean annual air temperature by 1°C brings increase of balance evapotranspiration by 17.4 mm.
3
5
7
9
11
13
100
300
500
700
900
1100
1930 1950 1970 1990 2010
THu
r [°
C]
R, E
Tb, P
[mm
]
R ETb P T Hur

Analysing 21st century meteorological and hydrological drought events in Slovakia
401
Fig. 10. Course of the 11-years moving averages of the (top) pre-cipitation totals on the Slovak territory (P) and (bottom) air tem-perature (Ts-a summer-autumn, Tw-s winter-spring seasons) at Hurbanovo station (1881–2016). DISCUSSION
Slovakia is located in the boundary zone between the south-
ern Europe, where precipitation decrease is projected by cli-mate change scenarios, and the northern Europe with expected precipitation increase (European Environmental Agency, 2012). Therefore, high inter-annual, as well as multiannual variability of precipitation is implied. Air temperature increase in winter and summer was proved by many studies not only in Slovakia, but on the global scale (e.g. Bindoff et al., 2013; Labudová et al., 2015).
Warmer air can hold more moisture, which is consequently transported over the continent. In summer, the continent can be very hot and intensive rainfalls occur more frequently also in Slovakia. But the intensive convective precipitation has only regional occurrence and the most of them is consumed by vege-tation, or evaporates. The SPI and the SPEI cannot filter out such cases and often indicate normal conditions after heavy rainfalls occurring on only one day in month even thought the rest of month is without precipitation and high temperatures are recorded. Changing intensity and distribution of the precipitation in Slovakia is also noted by the values of the SPI and the SPEI, which reach extremer values on the both sides of the scale.
Increasing winter air temperature can cause higher precipita-tion in winter season due to potentially higher moisture content in air masses. This could be one possible explanation of the SPI results for the northern river basins. On the other hand, higher winter temperatures causes change of the precipitation state (snow – rain) and also duration of the snow cover. Increase in winter temperatures results in higher ratio of liquid precipita-tion on total winter precipitation and shorter snow cover duration (Pecho et al., 2010; Záhradníček et al., 2016). Conse-quently, higher discharges during the cold season could occur. Therefore, more attention should be paid also to snow condi-tions changes in further studies focused on the relationship between meteorological and hydrological drought occurrence.
The causes of increased evapotranspiration are several: es-pecially higher air temperature and higher precipitation totals. There could be also other reasons, as increased forestation, or growing stock of wood (Pekárová et al., 2017).
The evaluation of the longest hydrological drought periods within the 2003, 2012 and 2015 years showed that there are some general similarities among the respective river basins. This was shown by the results of the factor analysis, where three main groups of river basin were estimated. The groups are regionally distributed, creating the group of the northern Slo-vakian river basins (Poprad, Váh and Oravica), group of the central Slovakian river basins (Hron, Nitra) and the group of the western, southern and eastern Slovakian river basins (Myja-va and Kysuca; Žitava, Ipeľ and Rimava; Topľa and Torysa). This could point on differences in physical-geographical condi-tions in various parts of Slovakia causing differences in the wet/dry air masses movement, average annual/seasonal tempera-tures and consequently different values of evapotranspiration. All these factors are the important drought influencing conditions.
However, the situation seems more complicated when com-paring adjacent river basins in detail, as published by Fen-deková et al. (2017a). A detailed study of drought parameters in the Ipeľ and Rimava, and in the Topľa and Torysa River basins was done. Despite of the basins vicinity, there are differences in temporal and spatial manifestation of droughts in 2003, 2012 and 2015. The difference between the Ipeľ and the Rimava River basin consists in the basin area, and consequently in the average annual and minimum discharges. The Ipeľ River basin with the smallest area, lowest altitude and highest air tempera-ture suffered from the 2012 drought which is in a good compli-ance with the meteorological drought occurrence expressed by the SPEI12 index calculated for the Boľkovce meteorological station. The situation in the Rimava basin was different despite of very similar meteorological drought parameters (Rimavská Sobota meteorological station) to those in the Ipeľ basin. The most pronounced drought period in the Rimava basin occurred in 2003, similarly to the Eastern Slovakian River basins of Torysa and Topľa. However, return periods of drought dura-tion, deficit volume, and deficit volume intensity estimated for the Rimava basin were much lower than those calculated for the Torysa and Topľa basins. There, the basin area and river dis-charge could contribute to partial balancing the unfavourable climatic conditions.
Drought development in the Kysuca River basin gives an-other example of different conditions influencing the drought parameters. The Kysuca River basin was the only one basin with the most pronounced drought in all parameters in 2015. This was the most probably caused by the quite dry climatic conditions in the Kysuce region during the four preceding years 2011–2014 (Fendeková et al., 2017b). So, the degree of water saturation of the basin could also play the important role.
Quite good correlation between the meteorological and hy-drological droughts occurrence in more than the half of the evaluated river basins was proven. The best results were ob-tained for the Myjava, Váh, Oravica, Kysuca, Nitra, Hron, Ipeľ and Topľa basins, where the meteorological drought was fol-lowed by the hydrological one. The lowest SPI values were obtained in the same year as the majority of the hydrological drought parameters in the respective basin. The drought in 2015 was exceptional in the Kysuca River basin, where the dry con-ditions since 2011 influenced the highest drought intensity in 2015.
On contrary, the hydrological drought parameters were in contradiction with the meteorological drought occurrence in Žitava, Rimava, Poprad and Torysa River basins. The hydro-logical drought intensity in the Žitava, Rimava and Poprad River basins in 2003 was the lowest one among the evaluated years, despite of the most pronounced low SPI values. The intensity of hydrological drought was better fitted by the values
1.5
2.5
3.5
4.5
15
16
17
18
1871 1891 1911 1931 1951 1971 1991 2011T
w-s
[°C
]
Ts-
a [°
C]
T winter - spring period, (XI. - IV.)
T summer - autumn period, (V. - X.)
660
710
760
810
860
1871 1891 1911 1931 1951 1971 1991 2011
P [
mm
]
Precipitation
11-year moving average

Miriam Fendeková, Tobias Gauster, Lívia Labudová, Dana Vrablíková, Zuzana Danáčová, Marián Fendek, Pavla Pekárová
402
of the SPEI index values in the case of the Žitava and Rimava River basins. The specific situation occurred in the Poprad River basin because of quite long, wet period since late 1990s. The situation in the Torysa River basin is also remarkable be-cause the comparable SPI values in all three evaluated years resulted in the comparable drought intensities; however the 2012 drought intensity was a bit higher which was in coinci-dence with the lowest values of the SPEI in the same year.
The differences in methodology used for meteorological and hydrological drought evaluation within the presented study did not influence the results of the meteorological and hydrological droughts evaluation. However, the mutual comparison of the meteorological and hydrological droughts, as presented above, could be influenced by them. Whilst the SPI and SPEI compare the rainfall/potential evapotranspiration in a monthly step with the long-term value (1981–2010), the SPA method is based on the recovery of the daily discharges after their decrease below a certain threshold, similarly estimated as a long-term value of the same period. In both cases, there is a threshold limiting the drought occurrence – fixed value of the discharge Q80 in the case of hydrological drought and fixed limit value for meteoro-logical drought occurrence – value of –1 of the SPI/SPEI. De-spite of uncertainties connected to use of the two different methods, the obtained results of meteorological and hydrologi-cal droughts occurrence gave a simple picture on relations between the two types of drought in evaluated river basins.
The obtained results are in a good accordance with the re-sults of Laaha et al. (2017). According to conclusions of Laaha et al. (2017), the hydrological drought of 2015 was character-ised by a different spatial extent than the drought of 2003. In terms of low flow magnitude, a region around the Czech Re-public was most affected with annual low flows in 2015 that exhibited return intervals of 100 years and more. This was also the case of the Kysuca River basin, neighbouring the Moravian part of the Czech Republic, where the highest return periods of all drought parameters were reached in 2015 (Table 4). Com-paring the drought onset in 2003 and 2015 (Laaha et al., 2017), this was more dramatic in 2003, covering more quickly and more homogeneously a larger region of Europe. This was also the case of Slovakian river basins, as showed in Fig. 5. Accord-ing to drought onset and duration, the 2003 drought was con-sistent over the whole territory of Slovakia. The only exception was the 2003 drought duration in the Kysuca River basin. Laaha et al. (2017) also stated, that the difference in spatio-temporal characteristics of the climatic and hydrological drought can best be explained by diverging conditions in the river basins. They found evidence that extreme droughts emerged as a consequence of dry preconditions in the preceding winter and spring months. Such a conclusion was fully con-firmed in the case of the Kysuca River basin drought in 2015.
CONCLUSIONS
The evaluation of three drought periods in Slovakia showed
that there is a significant difference between the drought pa-rameters in respective years and evaluated river basins.
In general, considering meteorological drought, the increas-ing air temperature is resulting in the increasing potential evap-otranspiration. The role of the potential evapotranspiration in the assessment of water balance has been evident since the mid-1990s, when the SPEI often reached lower values than the SPI. The most remarkable differences were noted in Poprad, Oravi-ca, Torysa and Topľa River basins, located in the northern and eastern Slovakia.
Despite of generally similar weather conditions in all three evaluated years, the response of assessed river basins differed significantly. The deficit volume parameters during the most extreme drought period were the highest in the majority of evalu-ated basins in 2003 and 2012. The only exception was the Ky-suca River basin, where the year 2015 was the most extreme one.
The summer droughts prevailed within the evaluated drought periods in the territory of Slovakia beginning in late May to June and peaking in July-August period. However, many of evaluated drought periods continued during the winter up to the next year, ending in early spring months. This was the case of the hydrological drought in the Myjava, Váh, Oravica, Kysuca, Poprad and Topľa River basins where the hydrological drought started already in the period between 31 August and 29 October 2011 and lasted until January to March 2012, or of the Topľa and Torysa River basins where the 2015 drought lasted until 13 January 2016 in Torysa and 3 February 2016 in the Topľa River basin.
The results of the study confirmed that according to evaluat-ed drought parameters, the geographical location of the river basin, its climatic conditions, geological conditions, river basin area, discharge conditions and the climatic situation of the preceding years (influencing the water saturation of the basin) are the most important factors of drought occurrence and inten-sity.
Acknowledgement. The contribution was prepared and support-ed by the APVV-0089-12 (principal investigator Miriam Fen-dekova) and by the VEGA No. 2/0009/15 projects. The re-search also supports the work of the UNESCO-IHP VIII FRIEND-Water programme. REFERENCES Alexandersson, H., 1986. A homogeneity test applied to
precipitation data. J. Climate, 16, 6, 661–675. Alexandersson, H., Moberg, A., 1997. Homogenization of Swedish
temperature data. Part I: Homogeneity test for linear trends. J. Climate, 17, 1, 25–34.
Andreu, J., Solera, A., Paredes-Arquiola, J., Haro-Monteagudo, D., van Lanen, H.A.J. (Eds.), 2015. Drought: Research and Sci-ence-Policy Interfacing. Taylor & Francis Group, London.
Bindoff, N.L., P.A. Stott, K.M. AchutaRao, M.R. Allen, N. Gillett, D. Gutzler, K. Hansingo, G. Hegerl, Y. Hu, S. Jain, I.I. Mokhov, J. Overland, J. Perlwitz, R. Sebbari, Zhang, X., 2013. Detection and Attribution of Climate Change: from Global to Regional. In: Stocker, T.F., Qin, D., Plattner, G.-K., Tignor, M., Allen, S.K., Boschung, J., Nauels, A., Xia, Y., Bex, V., Midgley, P.M. (Eds.): Climate Change 2013: The Physical Sci-ence Basis. Contribution of Working Group I to the Fifth As-sessment Report of the Intergovernmental Panel on Climate Change Cambridge University Press, Cambridge, United King-dom and New York, NY, USA.
Ciais, Ph., Reichstein, M., Viovy, N., Granier, A., Ogeé, J., Allard, V., Aubinet, M., Buchmann, N., Bernhofer, C., Carrara, A., Chevallier, F., De Noblet, N., Friend, A., Friedlingstein, P., Grünwald, T., Heinesch, B., Keronen, P., Knohl, A., Krinner, G., Loustau, D., Manca, G., Matteucci, G., Miglietta, F., Ourci-val, J.M., Papale, D., Pilegaard, K., Rambal, S., Seufert, G., Soussana, J.F., Sanz, M.J., Schulze, E.D., Vesala, T., Valentini, R., 2005. Europe-wide reduction in primary productivity caused by the heat and drought in 2003. Nature, 437, 529–533. DOI: 10.1038/nature03972.
Cindrić, K., Telišman Prtenjak, M., Herceg-Bulić, I., Mihajlović, D., Pasarić, Z., 2016. Analysis of the extraordinary 2011/2012 drought in Croatia. Theor. Appl. Climatol., 123, 3–4, 503–522.

Analysing 21st century meteorological and hydrological drought events in Slovakia
403
Corduneanu, F., Bucur, D., Cimpeanu, S.M., Apostol, I.C., Stru-gariu, A., 2016. Hazards resulting from hydrological extremes in the upstream catchment of the Prut River. Water Resources, 43, 1, 42–47.
European Environmental Agency, 2012. Climate Change, Impacts and Vulnerability in Europe 2012. An Indicator Based Report. EEA Report No. 12/2012. EEA, Copenhagen, 300 p.
Fendeková, M., Danáčová, Z., Gauster, T., Labudová, L., Fendek, M., Horvát, O., 2017a. Analysis of hydrological drought param-eters in selected catchments of the southern and eastern Slo-vakia in the years 2003, 2012 and 2015. Acta Hydrologica Slovaca, 18, 2, 135–144.
Fendeková, M., Gauster, T., Slivová, V., Vrablíková, D., Fendek, M., Labudová, L., Danáčová, Z., 2017b. Surface and groundwa-ter drought in the Kysuca river basin in the three dryiest years of the 21st century. Podzemná voda, 23, 1, 25–37.
Ionita, M., Tallaksen, L. M., Kingston, D. G., Stagge, J. H., Laaha, G., Van Lanen, H. A. J., Scholz, P., Chelcea, S. M., Haslinger, K., 2017. The European 2015 drought from a climatological perspec-tive. Hydrology and Earth System Sciences, 21, 3, 1397–1419.
Kendon, M., Marsh, T., Parry, S., 2013. The 2010–2012 drought in England and Wales. Weather, 68, 88–95.
Laaha, G., Gauster, T., Tallaksen, L.M., Vidal J.-P., Stahl, K., Prudhomme, C., Heudorfer, B., Vlnas, R., Ionita, M., Van Lanen, H.A.J., Adler, M.-J., Caillouet, L., Delus, C., Fendekova, M., Gailliez, S., Hannaford, J., Kingston, D., Van Loon, A.F., Mediero, L., Osuch, M., Romanovicz, R., Sauquet, E., Stagge, J.H., Wong, W.K., 2017. The European drought from a hydrological perspective. Hydrol. Earth Syst. Sci., 21, 3001–3024.
Labudová, L., Faško, P., Ivaňáková, G., 2015. Changes in climate and changing climate regions in Slovakia. Morav. Geogr. Rep., 23, 71–82.
Landscape atlas of the Slovak Republic, 2002. Ministry of the Environment of the Slovak Republic, Bratislava, 344 p.
Marsh, T.J., 2004. The UK drought of 2003: A hydrological review. Weather, 59, 8, 224–230. DOI: 10.1256/wea.79.04.
McKee, T.B., Doesken, N.J., Kleist, J., 1993. The relationship of drought frequency and duration to time scales. In: Proceedings of the 8th Conference on Applied Climatology, 17.–22.1.1993. Anaheim, California, 1993, 179–183.
Melová, K., Lupták, L., 2006. Hydrological evaluation of surface streams in 2001 – 2005 period. Vodohospodársky spravodajca, 50, 1–2, 34–35. (In Slovak.)
Mikhailova, M.V., Mikhailov, V.N., Morozov, V.N., 2012. Ex-treme hydrological events in the Danube River basin over the last decades. Water Resources, 39, 2, 161–179.
Orth, R., Zscheischler, J., Seneviratne, S. I., 2016. Record dry summer in 2015 challenges precipitation projections in Central Europe. Scientific Reports, 6, 21, Article No. 28334.
Pecho, J., Faško, P., Mikulová, K., Šťastný, P., Nejedlík, P., Košťálová, J., 2010. Comparative analysis of selected snow cover characteristics in Slovakia within the 1950/1951-1979-1980 and 1980/1981–2009/2010 winters. Geophysical Research Abstracts, 12, EGU2010-11543.
Pekárová, P., Miklánek, P., Pekár, J., Pramuk, B., 2017. Identifica-tion of the Slovak rivers daily discharge regime changes. Part II Comparison of the two periods. Acta Hydrologica Slovaca, 18, 2, 183–192.
Rebetez, M., Mayer, H., Dupont, O., Schindler, D., Gartner, K., Kropp, J. P., Menzel, A., 2006. Heat and drought 2003 in Eu-rope: a climate synthesis. Ann. For. Sci., 63, 569–577. DOI: 10.1051/forest: 2006043.
Sekáčová, Z., Šťastný, P., Faško, P., Lapin, M., 2004. Extremal manifestations of the weather in Slovakia in 2003. In: Rožnovský, J., Litschmann, T. (Eds): Extremes of weather and climate. Brno, pp. 1–6. ISBN 80-86690-12-1. (In Slovak.)
Slivová, V., Kullman, E., 2016. Evaluation of hydrological year 2015 from the point of view of groundwater. Vodohospodársky Spravodajca, 59, 3–4, 17–19. (In Slovak.)
Stepanek, P., 2003. AnClim - software for time series analysis and homogenization. http://www.climahom.eu/software-solution/anclim
Stojkovic, M., Plavšic, J., Prohaska, S., 2017. Annual and seasonal discharge prediction in the middle Danube River basin based on a modified TIPS (Tendency, Intermittency, Periodicity, Sto-chasticity) methodology. J. Hydrol. Hydromech., 65, 2, 165–174.
Škoda, P., Blaškovičová, L., Melová, K., 2016. Evaluation of the hydrological year 2015. Vodohospodársky Spravodajca, 59, 3–4, 14–16. (In Slovak.)
Šustek, Z., Vido, J., Škvareninová, J., Škvarenina J., Šurda, P., 2017. Drought impact on ground beetle assemblages (Coleop-tera, Carabidae) in Norway spruce forests with different man-agement after windstorm damage – a case study from Tatra Mts. (Slovakia). J. Hydrol. Hydromech., 65, 4, 333–342.
Tallaksen, L.M., Van Lanen, H.A.J. (Eds.), 2004. Hydrological drought: processes and estimation methods for streamflow and groundwater. Developments in Water Science, 48, The Netherlands, Amsterdam, Elsevier Science, 579 p.
Überla, K., 1971. Faktorenanalyse. Eine systematische Einführung für Psychologen, Mediziner, Wirtschafts- und Sozialwissen-schaftler. 2 Auflage. Springer, Berlin, 399 p.
Van Lanen, H.A.J., Laaha, G., Kigstnon, D.G., Gauster, T., Ionita, M., Vidal, J.-P., Vlnas, R., Tallaksen, L.M., Stahl, K., Hannaf-ord, J., Delus, C., Fendekova, M., Mediero, L., Prudhomme, C., Rets, E., Romanowicz, R.J., Gailliez, S., Wong, W.K., Adler, M.-J., Blauhut, V., Caillouet, L., Chelcea, S., Frolova, N., Gudmundsson, L., Hanel, M., Haslinger, K., Kireeva, M., O-such, M., Sauquet, E., Stagge, J.H., Van Loon, A.F., 2016. Hy-drology needed to manage droughts: The 2015 European case. Hydrological Processes, 30, 17, 3097–3104.
Vido, J., Střelcová, K., Nalevanková, P., Leštianska, A., Kandrík, R., Pástorová, A., Škvarenina, J., Tadesse, T., 2016. Identifying the relationships of climate and physiological responses of a beech forest using the Standardised Precipitation Index: a case study for Slovakia. J. Hydrol. Hydromech., 64, 3, 246–251.
Vincente-Serrano, S. M., Beguería, S., López-Moreno, J. I., 2010. A Multi-scalar drought index sensitive to global warming: The Standardized Precipitation Evapotranspiration Index – SPEI. Journal of Climate, 23, 1696–1718.
WMO, 2004. WMO Statement on the Status of the Global Climate in 2003. World Meteorological Organization, WMO-No. 966, Geneva, Switzerland, 2004, 11 p., ISBN 92-63-10966-4.
WMO, 2013. WMO Statement on the Status of the Global Climate in 2012. World Meteorological Organization, WMO-No. 1108, Geneva, Switzerland, 2013, 33 p., ISBN 978-92-63-11108-1.
WMO, 2016. WMO Statement on the Status of the Global Climate in 2015. World Meteorological Organization, WMO-No. 1167, Geneva, Switzerland, 2016, 23 p., ISBN 978-92-63-11189-0. www.shmu.sk
Zahradníček, P., Trnka, M., Brázdil, R., Možný, M., Štěpánek, P., Hlavinka, P., Žalud, Z., Malý, A., Semerádová, D., Dobrovolný, P., Dubrovský, M., Řezníčková, L., 2015. The extreme drought episode of August 2011–May 2012 in the Czech Republic. In-ternational Journal of Climatology, 35, 11, 3335–3352.
Zahradníček, P., Štepánek, P., Trnka, M., Farda, A., 2016. Projevy změny klimatu na území České republiky. In: Rožnovský, J., Vopravil, J. (Eds.): Půdní a zemědelské sucho (28.–29.4.2016 Kutná Hora, ČR). Výskumný ústav meliorací a ochrany půdy, Praha.
Received 21 July 2017
Accepted 2 January 2018