an online operational alert system for the early detection of shrimp
TRANSCRIPT

Aquaculture 277 (2008) 164-173
Contents lists available at ScienceDirect
Aquaculture
j ourna l homepage: www.e lsev ie r.com/ locate /aqua-on l ine
An online operational alert system for the early detection of shrimp epidemics at theregional level based on real-time production
Bonny Bayot a,b,⁎, Stanislaus Sonnenholzner a, Xavier Ochoa c, Johanna Guerrerro c, Teresa Vera d,Jorge Calderón a, Ignacio de Blas e, María del Pilar Cornejo-Grunauer f, Sam Stern a, Frans Ollevier b
a Fundación CENAIM-ESPOL, P.O. Box 09-01-4519 Guayaquil, Ecuadorb Laboratory of Aquatic Ecology, Catholic University of Leuven, Ch. de Bériotstraat 32, B-3000 Leuven, Belgiumc Centro de Tecnologías de la Información, Escuela Superior Politécnica del Litoral, Campus Prosperina, edificio Tecnológicas, Ecuadord Centro de Estudios Ambientales, Escuela Superior Politécnica del Litoral, Campus Prosperina, edificio CEMA, Ecuadore Facultad de Veterinaria, Universidad de Zaragoza, c/Miguel Servet 177-50013 Zaragoza, Spainf Facultad de Ingeniería Marítima y Ciencias del Mar, Escuela Superior Politécnica del Litoral, Campus Prosperina, edificio FIMCM, Ecuador
⁎ Corresponding author. Fundación CENAIM-ESPOL, PEcuador. Tel.: +593 4 2269494; fax: +593 4 2269492.
E-mail address: [email protected], bonny
0044-8486/$ – see front matter © 2008 Elsevier B.V. Adoi:10.1016/j.aquaculture.2008.02.035
A B S T R A C T
A R T I C L E I N F OArticle history:
Diseases are among the gr Received 1 February 2007Received in revised form 17 February 2008Accepted 22 February 2008Keywords:Early detection systemVeterinary disease surveillanceOnline alert systemShrimp epidemicsEcuadorAquatic epidemiology
eatest threats affecting the sustainability of shrimp aquaculture. In Ecuador,diseases of cultured shrimp have been quickly transmitted from one region to another. Therefore, an earlydetection system of impending epidemics could serve as an important management tool for the aquaculturesector. We developed a system for the early detection of shrimp epidemics for the largest shrimp zone ofEcuador based on production surveillance. The system, called Epidemiological Alert System and AquacultureManagement (SAEMA), uses a geographical information system (GIS) with an imaginary grid cartography(12,860 ha per grid) dividing the study area. A production and management index is calculated with theharvest data of each pond. A standardized deviation around the historical averages and an alert level iscalculated per grid and month. Normal conditions of production and therefore the absence of disease aredepicted in green and yellow. While, orange and red colours express a disease warning manifested throughsuboptimal production levels. As a result, a map of the study area with grid divisions is displayed, with aspecific alert colour for each grid where information is available. SAEMAwas developed as a Web application(http://www.saema.espol.edu.ec) that enables producers to record data via a worksheet format using anyweb browser. Instantaneously, the applications perform a calculation of the alert index and provide feedbackto the alert levels displayed in an interactive map. A feedback process was initiated in May 2006 with 19participating shrimp farms. The objective of this research is to develop a platform for an early detection ofshrimp epidemics on a regional scale. The detection of an epidemic, expressed as suboptimal production in aspecific region, can provide producers from other zones and government authorities to engage in timepreventive and control measures in order to reduce the spread of diseases.
© 2008 Elsevier B.V. All rights reserved.
1. Introduction
Spatial distribution of diseases can be studied using geographicalinformation systems (GIS) (Carpenter, 2001), which are computerizedsystems with geographically referenced information. GIS advantagesinclude the incorporation of layers of geographically referencedinformation to maps, cluster analysis, modelling disease spread andplanning control strategies, among others. While GIS and informationsystems arewidely used inpublic health andepidemiology (Glass et al.,1995; Clarke et al., 1996, among several other studies), applicationshave been relatively less common in veterinary epidemiology (Sansonet al., 1991; Yilma and Malone, 1998; Tum et al., 2004). Moreover, very
. O. Box 09-01-4519 Guayaquil,
[email protected] (B. Bayot).
ll rights reserved.
few studies have been directed towards aquatic animal health. Moststudies in aquaculture using GIS have mainly focused on site selectionin aquatic farming operations (Aguilar-Manjarrez and Ross,1995; Nathet al., 2000) and studies of relationship betweenmangroves and farms(Shahid and Pramanik, 1986). Smith (1999) applied GIS to studypatterns of production costs and disease problems in Thai shrimpfarms. Recently, a shrimp disease monitoring system using GIS in thePhilippines has been reported (Lavilla-Pitogo et al., 2006). However,there are no additional reports of systematic surveillance systems inthe shrimp industry using GIS. There are even fewer veterinary diseasesurveillance systems combiningWeb-basedmap services and GIS (Gai,2003; Staubach et al., 2003; Cameron, 2004; Conte et al., 2005).
Over the past 15 years, the Penaeus (Litopenaeus) vannamei shrimpculture industry in Ecuador has been challenged by a number ofserious epidemics quickly transmitted from one region to another(Alday de Graindorge and Griffith, 2001). The most recent disease

165B. Bayot et al. / Aquaculture 277 (2008) 164-173
occurred in 1999 when white spot disease (WSD) was detected innorthern Ecuador (Esmeraldas) and subsequently spread to the entireshrimp farming industry (Calderón et al., 1999). The economic impactwas huge and production dropped from 160,000 tonnes in 1999 to40,000 tonnes in 2000 (Hill, 2002).
Infectious diseases propagate in a population through spatial–temporal contagious patterns exhibiting clusters. Based on thecontagious nature of infectious diseases, we hypothesize thatdetection of production drops in farms sharing a similar geographiczone could be a cost-effective control system for detecting the onset ofan epidemic on a regional level. The detection of an epidemic,expressed as suboptimal production, in a specific region could provideproducers from other zones as well as government authorities toengage in timely preventive and control measures.
We developed an online, automated and interactive alert system,called Epidemiological Alert System and Aquaculture Management(SAEMA) for the detection of an epidemic on a regional level (for thelargest shrimp producing zone of Ecuador), based on real-timeinformation of production drops, using GIS and novel technology forinformation systems. The aim of this paper is to describe the structureand contents of SAEMA and to present preliminary results. This is thefirst report for an automated disease outbreak detection system basedon production data for shrimp epidemics at a regional level.
2. Materials and methods
2.1. Study area
The Gulf of Guayaquil (Ecuador), located on the Pacific coast, between latitudes2°13′S and 4°07′S (Fig. 1), is the largest estuary on the western coast of South America(Cucalón,1996). SAEMAwas developed for Ecuadorian shrimp farms in these zones. Thetotal area of shrimp farms in the region is about 140,000 ha, representing 83% of theEcuadorian production area.
Fig. 1. Study area: shrimp farms located
The climate is tropical and subtropical with two climatic seasons. The wet/warmand dry/cold seasons occur from January to May and from June to December,respectively (Cucalón, 1996). The climatic pattern governs shrimp production, withthe highest levels reported during the wet/warm season (Regueira, 2001). Shrimpproduction also shows variability in space with some zones presenting higher levelsthan others (Regueira, 2001).
The study area was divided into imaginary rectangular grids, covering approxi-mately 12,860 ha, overlapping with the cartographic grid of the Ecuadorian NationalChart (scale 1:25,000; IGM, 1999).
2.2. General methodology
There were three chronological steps involved in the SAEMA development (Fig. 2).In the first step, the tools to identify the alert levels were created. In step 2, the SAEMAplatform was implemented building a desktop based GIS that was converted into anonline GIS. The Web application enables producers to record data via a definedworksheet format to the SAEMA website using a web browser. The SAEMA websiteautomatically calculates the alert index and provides feedback for the alert levels.Finally, in step 3, the SAEMA feedback at real time was started on May 2006 with datafrom shrimp farms of the study area.
2.3. Step 1: development of the alert index and alert levels
2.3.1. Alert indexProduction andmanagement datawere collected from ponds of fifteen large shrimp
(P. vannamei) farms from the study area for the period 1996–2002. The objective was tobuild a production variable indicative of farm/pond performance that could be used asan alert variable for the detection of suboptimal production. In order to standardize theinformation of production among ponds with different management, an indexcomposed of production and management variables was elaborated in the frameworkof this study (Sonnenholzner et al., 2004). The index, called Production andManagementIndex (IPM) (Eq. (1)) contains two terms: (1) a standardization of the production,dividing the yield by the stocking density and (2) the shrimp growth rate during theproduction cycle. The final units were g2 shrimp−1 day−1.
IPM ¼ Production
Pond area� Number of stocked shrimp
Pond area
� ��1" #
� shrimp weight at harvest
duration of the production cycle
� �:
ð1Þ
in the Gulf of Guayaquil (Ecuador).

Fig. 2. Schematic diagram of the steps involved in the SAEMA development.
166 B. Bayot et al. / Aquaculture 277 (2008) 164-173
In the validation phase a normalization was done through calculation of thestandardized anomaly (standardized deviations from the normal values) of IPM(AIPM). For each farm, historical averages and standardized deviation of IPM for eachmonth (12 historical averages and 12 standardized deviations) were calculated. In thisphase, AIPM was validated with the standardized survival for two (Farms A and B) ofthe fifteen shrimp farms in order to verify whether the index could be linked to diseaseproblems in ponds and farms. Such validation was performed through a distributed laganalysis between monthly time series of AIPM (independent variable) and standar-dized survival (dependent variable) looking for significant cross correlations betweenboth time series at different month lags. The statistical analyses were performed usingStatistica 6.0 (1994–2001, StatSoft, Oklahoma, USA). AIPM was used as the SAEMA alertindex.
2.3.2. Alert levelsIn order to compare the production levels at different scales, namely at regional,
farm and pond level, appropriate AIPMs were calculated. For the alert at regional level,AIPM was calculated for each grid and month using Eq. (2). For the alert at the farmlevel, AIPM was calculated for each farm and month similar to (2) but grid values werereplaced by farm values. For the alert at pond level AIPM was calculated using Eq. (2)and replacing grid and month values by pond and production cycle, respectively. Also,at that level, month in the
PPIPMhistorical and SIPM historical terms of Eq. (2) were replaced
by season. In this way, each grid or farm had one historical average for each month(IPM). At pond level, only two historical averages of IPM were obtained for eachpond: wet/warm and dry/cold season (for ponds harvested between January to May
and June to December, respectively). The historical period covered the years 2000–2005 for all cases.
AIPMgrid; month ¼PIPMgrid; month �PPIPMhistorical ðgrid; monthÞ
SIPM historical grid; monthð Þ: ð2Þ
Where,
AIPMgrid,month=standardized anomaly of IPM for a particular grid and for thecurrent monthPIPMgrid; month =average of IPM for all ponds harvested in the same grid during thecurrent monthPPIPMhistorical ðgrid; monthÞ =average of IPM for all ponds harvested in the same gridand month during the historical periodSIPM historical (grid, month)=standard deviation of IPM for all ponds harvested in a samegrid and month during the historical period.
AIPMs were used to categorize the alert levels. The mathematical criteria fortheir categorization were based on: (1) the sign and value of the AIPM for a par-ticular point in time (AIPMt) and (2) the sign and absolute value of the differencebetween AIPMt and its previous value (AIPMt−1). Four alert levels were delineated,which were identified with colours (green, yellow, orange and red) using the criteriashowed in Table 1.

Table 1Alert levels and mathematical criteria for their categorization
Alertlevel
Mathematical criterion for the categorization Interpretation in terms of production
Sign and valueof AIPMt
Slope sign(AIPMt−AIPMt −1)
Absolute value of theslope ∣AIPMt−AIPMt −1∣
Green⁎⁎ AIPMt≥0 ⁎ ⁎ Production above the historical averagesYellow AIPMt≥0 b0 ≥0.25 Production above the historical averages
with (strong) decreasing trendOrange −0.5bAIPMtb0 ⁎ ⁎ Production below the historical averages.
Standard deviation up to 0.5Red AIPMt≤−0.5 ⁎ ⁎ Production far below the historical averages.
Standard deviation higher than 0.5
Alert interpretation in terms of production.⁎: criterion not applied.⁎⁎: The alert colour is green if AIPMt≥0 and if both two other criteria of the alert level yellow are not fulfilled.
167B. Bayot et al. / Aquaculture 277 (2008) 164-173
2.4. Step 2: development of the SAEMA platform
2.4.1. Development of the SAEMA-desktop GISThe SAEMA geographical information system (SAEMA-GIS) contains a Landsat 7
(2001) satellite image (15-meter resolution), with ponds as the smallest unit of thegeographical database. The satellite image and cartographic grid were integrated into adesktop geographical database of the SAEMA-GIS using MapInfo 5.0 (MapInfoCorporation, Troy, NY, USA).
2.4.2. Development of the SAEMA-online GISAWeb application was developed using open source tools: i) UMN MapServer, was
used for converting vector maps into images, ii) PostGIS, was used to store geographicalinformation, iii) JavaServer pages (JSP) served as programming platform and iv) ApacheTomcat as a Web Server. The Web application is available at a website (URL: http://www.saema.espol.edu.ec) with three main sections containing each of the alerts at theregional, farm and pond level. For the alert at the regional level, the geographicalinformation of the SAEMA-GIS is embedded in an interactive map into the web page.The map includes the satellite image of the Gulf of Guayaquil and the grids are colouredaccording to the alert level. For the alert at farm level, the map with the contour of thefarm is placed on the page, while for the alert at pond level themapwith the contours ofthe previous farm and also its ponds is presented. The first three sections are connectedto a fourth section, called Online Data Input. The Web application allows online datainput from any personal computer with access to Internet. Data are sent online andsaved in the PostGIS database. The application links the data according to the codes andrespective section, calculates the equations and updates the alert levels for each section.The system uses Spanish as the communication language.
JSP programming for the calculations of IPMs and AIPMs variables was doneaccording to Eqs. (1) and (2) using the data contained in the PostGIS database andpresented in the respective section.
The interactive maps of the first three sections present the alert level with colourslimited by grid, farm and pond contours using the criteria explained in Table 1. TheWebapplication allows for automatic interactive changes as data are obtained from theproducers.
2.5. Step 3: SAEMA feedback process with real-time data from shrimp farms
2.5.1. Collection of historical data from shrimp farmsIn May 2006, information of production and management of 19 shrimp farms from
the study areawas collected from 2000 until April 2006. According to the programmingdescribed above, the system recognizes as historical data only information from the
Fig. 3. Time series (3-month moving average) of yield (kg ha−1), survival (%) and AIPM (g2
2000–2005 period. Data editing, reviewing of consistency, outliers, and validity of thedata were performed for each pond.
2.5.2. Incorporation of shrimp farm cartographies to the SAEMA-desktop GIS andconversion to the SAEMA-online GIS
The cartography (geographical position of the farm contour and ponds, and codesfor the farm and ponds) of each farm was collected. Each farm was located on thesatellite image, already installed in the SAEMA-desktop GIS. A map of each shrimp farm(obtained by the satellite image) with the farm and pond contours was created and gridcodes where the farm and ponds are located were determined. The cartography wasalso incorporated onto the SAEMA-desktop GIS and then was embedded in the maps ofthe first three sections of theWeb application, according to the programming describedin item Development of the SAEMA-online GIS.
2.5.3. Feedback process of SAEMA at real timeFrom May to July 2006, an online SAEMA feedback process in real time with data
from 19 shrimp farms was performed. They recorded monthly harvest data via aworksheet file through the third section Online Data Input using a web browser, ausername and a password. Data were automatically recorded at the SAEMA database.
3. Results
3.1. Alert index
AIPM drops presented a 2-month forward warning concerning reduction insurvival (strongest significant cross correlation at 2-month lag, r=0.70, t=4.06,Pb0.0001). In order to smooth the data and observe a periodic trend a 3-monthmoving average of the AIPM, the yield and survival for farm A was performed (data offarm B are not shown) (Fig. 3). The trendwas stronger at the end of 1998 and early 1999,the months prior to the onset of the WSD epidemic (Fig. 3). These results suggest thatAIPM could be used as an indicator of the health status at the farm level. In addition, therange for the historical period was chosen from 2000 to 2005 to discard the period priorto the WSD epidemic (before 1999).
3.2. SAEMA feedback process at real time
From May to July 2006, 19 farmers sent their data online from their personalcomputers to the SAEMA server. The alerts at regional, farm and pond level wereautomatically updated as data were entered. The nineteen farms were distributed onfifteen grids. Not all fifteen grids were activated at the same time due to the fact that the
shrimp−1 day−1) for farm A during 1996 to 2002. All three variables are standardized.

168 B. Bayot et al. / Aquaculture 277 (2008) 164-173
alert levels are updated when the producers enter their data in the system. When theproducers began with the SAEMA feedback process, the system was placed in a URLaddress. From May to July 2006, 1137 hits were registered.
3.3. Regional, farm and pond alerts
Fig. 4 presents, as an example, the alert at the regional level for the Gulf ofGuayaquil from April 2006. The figure shows 14 grids with information of IPM, with twogrids showing a red alert level and the remaining green and yellow alerts. ForMay 2006(figure not shown) one of the red grids changed to green and grids with red colour weretherefore no longer observed, although four new orange grids were reported. In Juneand July 2006 (figure not shown), almost all grids showed production levels above thehistorical levels with green and yellow grids indicating a recovery of the productionlevel status.
Time series of AIPM and alert levels for a 1-year cycle can be consulted for each gridby clicking on the grid of interest. The time series of AIPM for grid No.178 Puerto Bolívar,located in the study area, showed in April and May 2006 a decreasing trend of
Fig. 4. Epidemiological alert at regional level for the Gulf of Guayaquil at April 2006. The figyellow, o: orange and r: red. (For interpretation of the references to colour in this figure leg
production levels below the historical averages (Fig. 5). Such a trend was also observedfor some zones of the Gulf of Guayaquil. Thus, an orange alert was displayed in May2006 and a recovery was reported in June 2006. For the case of Fig. 5, a decrease ofproduction was observed in April and May 2006 with a recovery for June 2006. Also inthis figure, the alert level for eachmonth, the number of ponds used to calculate the IPMaverage for each month (
PIPMgrid; month) and the number of ponds used to calculate the
monthly historical average of IPM (PPIPMhistorical grid; month) are displayed.
The alert output at the farm level is shown for one of the nineteen farms for April2006 (Fig. 6). The farm area is filled with one of the four possible alert colours, accordingto the criteria described in the section material and methods. In addition, as in Fig. 5, byclicking on the farm map, time-series graphs for the 1-year AIPM and a table with themonthly alert levels for a 1-year cycle, the number of ponds used to calculate the IPMaverage for each month (
PPIPMfarm; month) and the monthly historical averages
(PIPMhistorical ðfarm;monthÞ) are generated at the farm level.
The output for the pond alert follows the same scheme as presented for theprevious alert scales (Fig. 7). A click on the pond of interest opens the time-series graphsfor 1-year AIPM and a table with the monthly alert level for the 1-year cycle, the
ure contents have been translated into English for this article. Alert colour: g: green, y:end, the reader is referred to the web version of this article.)

Fig. 5. Time series of AIPM and alert levels from July 2005 to July 2006 for grid No.178 Puerto Bolívar, located in the study area. Historical period is from 2000 to 2005. Alert colour: g:green, y: yellow, o: orange and r: red. (For interpretation of the references to colour in this figure legend, the reader is referred to the web version of this article.)
169B. Bayot et al. / Aquaculture 277 (2008) 164-173
number of ponds used to calculate the IPM average for each month and the monthlyhistorical average. The user can also “zoom” into a pond group or into a farm zone ofinterest to consult more details.
4. Discussion
A disease has a risk of introduction and likelihood of becomingestablished in a country. Such risk can be split into two components:“the hazard” is the likelihood of pathogen occurrence, and “thevulnerability” of the exposed elements being the likelihood of internalrisk as consequence of their intrinsic predisposition to be affected. InEcuador, as in other shrimp producing countries, the hazard risk ofintroduction is high, mainly as a result of the movement of infectedlive animals. Highly contagious diseases of significant economicimportance have been propagated between hemispheres. Although,the government of Ecuador is increasing its control and implementingrestrictions on movement of live animals and products, the riskcontinues to be high. Moreover, the vulnerability of the Ecuadorianaquatic production systems is high considering that P. vannamei ishighly susceptible to infectious pathogens at low water temperatures(Vidal et al., 2001; Rodríguez et al., 2003). In addition, evidence relatescold climatic events such as La Niña with production losses anddiseases (Bayot and Chavarría, 2004). After each La Niña event, ashrimp epidemic appeared in the Ecuadorian aquatic productionsystems. The last La Niña event occurred in 1999 and months laterWSD was reported in Ecuador (Calderón et al., 1999).
There is no formal study of risk analysis for shrimp diseases inEcuador, but we are convinced that the risk of a new epidemiccontinues to be high, as both risk components (hazard and vulner-ability) are high. At the moment there are indications that newdiseases infecting cultured shrimp being detected on the SouthAmerican continent. Venezuela has been struck with a variant of theTaura syndrome virus (TSV) (OIE, 2005). In Brazil, a new viral disease,infectious myonecrosis virus (IMNV), is generating major losses(Lightner et al., 2004). Recently, Penaeus vannamei nodavirus hasbeen reported in Belize (Tang et al., 2007). Therefore, the possibility ofa quick spread of a disease in Ecuador, as was the case with WSD,needs to be taken into account (Calderón et al., 1999; Rodríguez et al.,2003). In the livestock sector, early detection of diseases is the mostimportant factor to handle animal disease epidemics. If a disease is
detected early in its development, there is a possibility to eliminate itbefore inflicting major damage (Paskin, 1999). This is equallyapplicable in shrimp aquaculture. An early detection can create animportant advantage by creating physical or management relatedbarriers. Consequently, it is critical that each tool providing an earlywarning is implemented to provide an additional layer of “protection”for shrimp producers.
The perceived risk for new shrimp epidemics has increased theinterest in surveillance systems for the early detection of diseases. Theword “surveillance” is commonly used interchangeably with “mon-itoring”. It is nevertheless important to differentiate between them.Surveillance is a mechanism applied to collect and interpret data onthe health status of animal populations, with the aim of earlydetection and control of animal diseases of economic importance(Paskin, 1999; Salman et al., 2003; Subasinghe et al., 2004). Moni-toring follows when surveillance indicates an early detection of di-sease and it is part of an early reaction after detection. Monitoring isrelated to the activities, which quantify changes in prevalence of aspecific disease and determines the rate and direction of its spread(Paskin, 1999; Salman et al., 2003).
In accordance to the above definitions SAEMA falls in thesurveillance category. Surveillance systems are extensively used inanimal populations (Salman et al., 2003; Gibbens et al., 2003).However, we identified just one report of the systematic applicationof such a system in the shrimp industry at the regional or nationallevel, namely in the Asia-Pacific region (NACA/FAO, 2006). Our systemcovers a specific region of Ecuador, while the surveillance system ofNACA/FAO covers a wider region of several countries. Our system alsodifferentiates from the NACA/FAO system in that the surveillance ofproduction levels is used as indicator of health problems. Severalreasons can be suggested to explain the scarcity of surveillancesystems. They require among other items costly investments forveterinary service networks, sample analysis by certified referencelaboratories, a legal framework, complex sampling systems (sampledesign, sampling and data analysis), and organized informationchannels and information analysis. The SAEMA platform functions asthe first phase for the early detection of epidemics and may establishcriteria to start into a second phase of early response.
In spite of the fact that SAEMA is not a traditional surveillancesystem, it fulfils a number of criteria: usefulness, simplicity for the
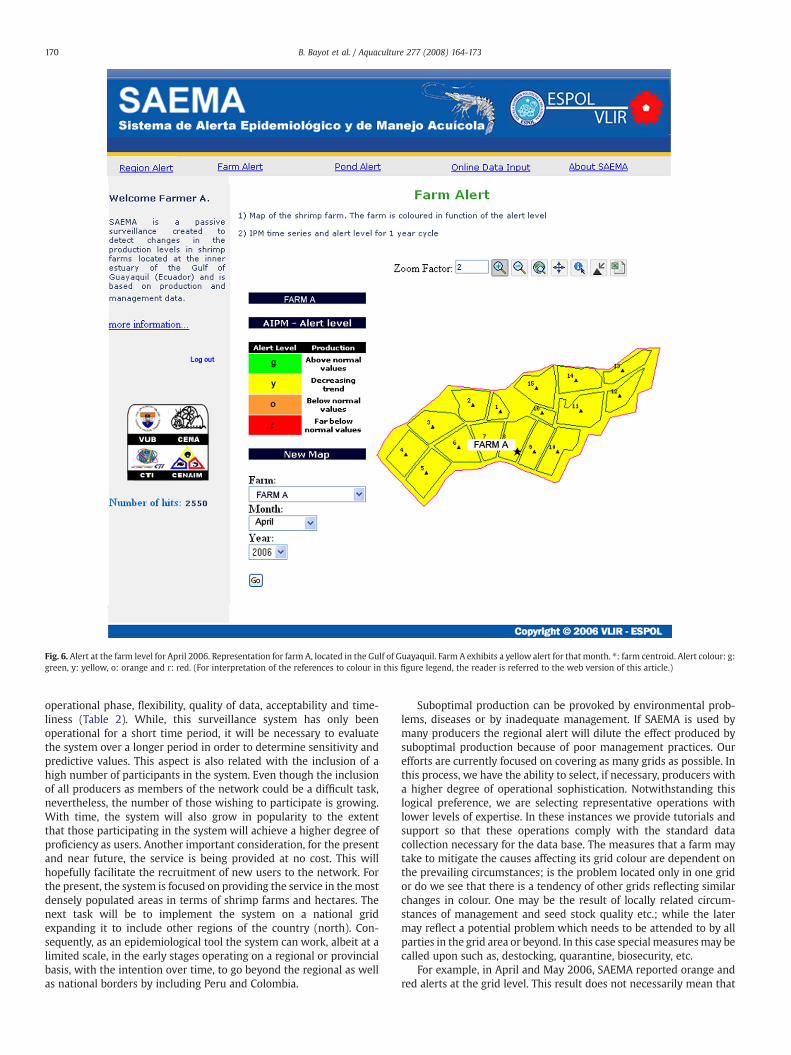
Fig. 6. Alert at the farm level for April 2006. Representation for farm A, located in the Gulf of Guayaquil. Farm A exhibits a yellow alert for that month. ⁎: farm centroid. Alert colour: g:green, y: yellow, o: orange and r: red. (For interpretation of the references to colour in this figure legend, the reader is referred to the web version of this article.)
170 B. Bayot et al. / Aquaculture 277 (2008) 164-173
operational phase, flexibility, quality of data, acceptability and time-liness (Table 2). While, this surveillance system has only beenoperational for a short time period, it will be necessary to evaluatethe system over a longer period in order to determine sensitivity andpredictive values. This aspect is also related with the inclusion of ahigh number of participants in the system. Even though the inclusionof all producers as members of the network could be a difficult task,nevertheless, the number of those wishing to participate is growing.With time, the system will also grow in popularity to the extentthat those participating in the system will achieve a higher degree ofproficiency as users. Another important consideration, for the presentand near future, the service is being provided at no cost. This willhopefully facilitate the recruitment of new users to the network. Forthe present, the system is focused on providing the service in themostdensely populated areas in terms of shrimp farms and hectares. Thenext task will be to implement the system on a national gridexpanding it to include other regions of the country (north). Con-sequently, as an epidemiological tool the system can work, albeit at alimited scale, in the early stages operating on a regional or provincialbasis, with the intention over time, to go beyond the regional as wellas national borders by including Peru and Colombia.
Suboptimal production can be provoked by environmental prob-lems, diseases or by inadequate management. If SAEMA is used bymany producers the regional alert will dilute the effect produced bysuboptimal production because of poor management practices. Ourefforts are currently focused on covering as many grids as possible. Inthis process, we have the ability to select, if necessary, producers witha higher degree of operational sophistication. Notwithstanding thislogical preference, we are selecting representative operations withlower levels of expertise. In these instances we provide tutorials andsupport so that these operations comply with the standard datacollection necessary for the data base. The measures that a farm maytake to mitigate the causes affecting its grid colour are dependent onthe prevailing circumstances; is the problem located only in one gridor do we see that there is a tendency of other grids reflecting similarchanges in colour. One may be the result of locally related circum-stances of management and seed stock quality etc.; while the latermay reflect a potential problem which needs to be attended to by allparties in the grid area or beyond. In this case special measuresmay becalled upon such as, destocking, quarantine, biosecurity, etc.
For example, in April and May 2006, SAEMA reported orange andred alerts at the grid level. This result does not necessarily mean that

Fig. 7. Pond alert for farm A during April 2006. Farm A exhibits three ponds with green alert for that month. Alert colour: g: green, y: yellow, o: orange and r: red (For interpretation ofthe references to colour in this figure legend, the reader is referred to the web version of this article.).
171B. Bayot et al. / Aquaculture 277 (2008) 164-173
an epidemic started in these grids, as these colours were the result ofAIPM averages of only 1 or 2 farms per grid. Such a small numbers offarms are explained by the fact that the system became operational at“real time” only three months previous. Several owners from farmslocated in these grids areas provided us with sanitary information.Most of those problems were generated by WSD and coincided withthe transition from thewet/warm to the dry/cold season. Coincidently,other producers from these affected zones reported more diseaseproblems compared to 2005. However, a recovery was observed fromJuly to August 2006 (data of August not shown) as green and yellowcolours were reported in all grids.
AIPM (per month and per grid) and the alert levels, as describedin this article, are the result of temporal and spatial analysis of datafrom farms and can be used during early detection phases ofdiseases. If a disease outbreak or an epidemic is confirmed during theearly reaction phase, SAEMA can be the operational framework for anoverview of disease clustering in space and time. SAEMA wasdesigned as an online alert system for the detection of shrimpdiseases but has potential to be applied for other species. The SAEMAplatform can be used among others for: geographical correlationstudies in an epidmic; risk point studies; selecting grid parcels with
problems; and locating farms with lowest AIPM. As research is still inprogress, the next steps will be to: (1) further refine the calibrationsof the criteria for each alert level (especially the orange and redalerts); (2) establish criteria for early reactions and (3) elaboratepreparedness and action plans using the SAEMA as the operationalframework.
SAEMA is one component of a Contingency Plan against shrimpdiseases which consists of a Preparedness Plan and an Action Plan. Insuch a framework, SAEMA is the tool proposed by Academia fordetecting the onset of an epidemic, with producer participation as akey component of the network. The Contingency Plan considers thestatutory authorities participation as the competent authority for thecontrol and execution of sanitary actions. The industry in Ecuadoroperates within the context of a tripartite of authorities of whichAcademia plays an important advisory role linking itself with theAquaculture Chamber of Commerce as the industry representativeand finally the Subsecretariat of Aquaculture in representation of theGovernment. Thus, decisions are not unilateral but multilateralwhich should reduce friction among potential interest groups. Thisissue is potentially sensitive and admittedly will take time and coo-peration, however we do believe that it is feasible once having

Table 2Evaluation of the performance of the SAEMA system using the criteria (taken from Salman et al., 2003) for assessing a surveillance system
Criterion
Usefulness The beneficiaries are all linked to the shrimp industry. It concerns mainly: (1) The shrimp industry itself, since a detection of an epidemic focus in adetermined region, expressed as suboptimal production, could help to prevent its spreading, and eventually, gain interest from policy makers. Additionally,the system could act as a framework for preparedness and action plans to counteract shrimp diseases, (2) Producers, in supporting management decisions,(3) Research organizations: the system could serve as a platform for future epidemiological research studies (e.g. disease mapping, geographical correlationstudies in an epidemic, risk point studies) and (4) Statutory authorities: SAEMA is one component of a Contingency Plan against shrimp diseases whichcontains a Preparedness Plan and an Action Plan. The Contingency Plan considers the statutory authorities participation as competent authority for thecontrol and execution of sanitary actions for rapid detection.
Simplicity The rather complex system needed to develop SAEMA has been created in order to simplify the operational phase. The SAEMA feedback is performed by theproducer through online input of harvest data. The geographical position of the farms can be done, inclusive direct viewing on the GIS map, without GPSpositioning.
Flexibility Once the system has been installed on the Internet website it needs: one part-time operator for the inter-phase GIS-Web, one part-time operator for the GIS,one assistant for the visits and coordination with the farmers and one general coordinator between the disciplines. Funds needed for the operation ofSAEMA are not high and can be shared by the participating farms.
Quality of data The data fed into the SAEMA system are the same as those used by the producers in their dailymanagement. Therefore, the risk to deal with bad data qualityis low. The system presents restrictions (an online error message is displayed) if data entered are not logical (e.g. survival must be lower than 100%, durationof the production cycle cannot be negative, etc.). AIPM per grid dilutes wrong data, or extreme low values of a farm (provoked by inadequate management).
Acceptability Private sector participation has been essential for the SAEMA development. Participants have expressed their satisfactionwith the system. FromMay to July2006 a counter installed on thewebsite registered 1137 hits, which confirms that the system is been used by the producers. Producers feel safe to enter theirdata because the confidentiality level of their information is high (without a password there is no access to specific farm or pond information).
Sensitivity and positivepredictive value
The system has run at real time only for three months (from May to July 2006). Sensitivity, specificity and predictive values cannot be calculated at themoment. If needed the mathematical criteria for the categorization of the alert levels can be changed during the operational phase through a re-calibrationprocess. This applies especially for the cut offs of the orange and red levels.
Representativeness As part of a Pilot Plan, producers from 19 farms of the study area have entered data to the alert system from May to July 2006. In implementing an earlywarning system at a national scale, the current SAEMA template could serve as the operational framework. In this context, it is the purpose to involve moreshrimp farms from the study area and to create a similar framework for shrimp farms in the area not yet covered.
Timeliness SAEMAprovides quick information to the producers on a real-time basis with data provided by its users. The information is easily accessible via the Internet.During the feedback process, fromMay to July 2006, informationwasmainly updated at amonthly frequency. SAEMAdisplayedmaps with data valid for theprevious month as producers enter data to the system approximately one month after the harvest. Therefore the system gives information with a one-month delay. Such delay is not considered a problem as there is a 2-month lag between AIPM and survival, with drops of AIPM occurring twomonths beforethe survival drops. During a disease event, producers can be encouraged to decrease the delay between harvest and entering the data.
Stability Efforts have been made to automate the system in order to avoid human errors. In this way, the system collects, manages and provides data properlywithout failures. The system is operational all day round.
172 B. Bayot et al. / Aquaculture 277 (2008) 164-173
demonstrated the benefits achieved through the SAEMA platform ona small scale.
Acknowledgements
This project was supported by the Project VLIR-ESPOL, subcompo-nent 4.3: Geographical Information Systems for Aquaculture Manage-ment and the Centro Nacional de Acuicultura e InvestigacionesMarinas (CENAIM). The research is part of the doctoral thesis ofBonny Bayot, who was funded by the Belgian Technical Cooperation(BTC) in the framework of the Master of Science Marine AquacultureProject (NI 17693/12). The authorswish to thank Dr. F. Volckaert for hiscomments on the original manuscript and Inge Vissers for Englishcorrections. We would like to thank all participating shrimp farms,especially Bravito and ENACA.
References
Aguilar-Manjarrez, J.A., Ross, L.G., 1995. Geographical information system (GIS)environmental models for aquaculture development in Sinaloa State, Mexico.Aquacult. Int. 3, 103–115.
Alday de Graindorge, V., Griffith, D., 2001. Ecuador: national review on managementstrategies for major diseases in shrimp aquaculture. In: Subasinghe, R., Phillips, A.R.,Reantaso, M. (Eds.), Proceedings of the workshop on Thematic Review onManagement Strategies for Major Diseases in Shrimp Aquaculture, 28–30November 1999, Cebu, Philippines, pp. 17–19.
Bayot, B., Chavarría, J., 2004. Effect of the climatic variability on shrimp diseases andproduction in Ecuador. Aquaculture Europe 2004 Conference. European Aqua-culture Society, Special publication No. 34, Barcelona, Spain, pp. 150–151.
Calderón, J., Bayot, B., Betancourt, I., Alday de Graindorge, V., 1999. Monitoreo del virusde la mancha blanca en Ecuador. El Mundo Acuícola 5, 211–214.
Cameron, A.R., 2004. Data management and analysis systems for bluetongue viruszoning in Australia. Vet. Ital. 40, 365–368.
Carpenter, T.M., 2001. Methods to investigate spatial and temporal clustering inveterinary epidemiology. Prev. Vet. Med. 48, 303–320.
Clarke, K.C., McLafferty, S.L., Tempalski, B.J., 1996. On epidemiology and geographicinformation systems: a review and discussion of future directions. Emerg. Infect.Dis. 2, 85–92.
Conte, A., Colangeli, P., Ippoliti, C., Paladini, C., Ambrosini, M., Savini, L., Dall’Acqua, F.,Calistri, P., 2005. The use of a Web-based interactive Geographical Informationsystem for the surveillance of bluetongue in Italy. Rev. Sci. Tech. OIE 24, 857–868.
Cucalón, E., 1996. Oceanografía y Sistemas Físicos. In: Comisión Asesora Ambiental de laPresidencia de la República (Ed.), Sistemas Biofísicos en el Golfo de Guayaquil,Guayaquil, Ecuador, 100–105.
Gai, H., 2003. China built national health information system. Electronic proceeding ofthe Tenth Symposium of the International Society for Veterinary Epidemiology andEconomics (ISVEE 10), 17–21 November 2003, Viña del Mar, Chile.
Gibbens, J.C., Lysons, R.E., Smith, L.H., 2003. Veterinary surveillance in the UK:approaches to working in Partnership. Electronic proceeding of the TenthSymposium of the International Society for Veterinary Epidemiology andEconomics (ISVEE 10), 17–21 November 2003, Viña del Mar, Chile.
Glass, G.E., Schwartz, B.S., Morgan, J.M., Johnson, D.T., Noy, P.M., Israel, E., 1995.Environmental risk factors for Lyme disease identified with geographic informationsystems. Am. J. Public Health 85, 944–948.
Hill, B., 2002. National and international impacts of white spot disease of shrimp. B. Eur.Assoc. Fish P. 22, 58–65.
IGM, 1999. Ecuadorian National Chart 1:25000. Instituto Geográfico Militar.Lavilla-Pitogo, C.R., de la Peña, L.D., Tendencia, E.A., 2006. Electronic Proceeding of the
Tenth Symposium of the International Society for Veterinary Epidemiology andEconomics (ISVEE 11), 6–11 August 2006, Cairns, Australia.
Lightner, D.V., Pantoja, C.R., Poulos, B.T., Tang, K.F.J., Redman, R.M., Andreas, T.,Bonami, J.R., 2004. Infectious myonecrosis (IMN): a new virus disease of Litope-naeus vannamei. Book of Abstracts of World Aquaculture 2004, 2–5 March 2004,Honolulu, USA. World. Aquaculture Society, Baton Rouge, LA, USA.
NACA/FAO, 2006. Quaterly Aquatic Animal Disease Report (Asia and Pacific Region),January–March 2006. NACA, Bangkok, Thailand.
Nath, S.S., Bolte, J.P., Ross, L.G., Aguilar-Manjarrez, J., 2000. Applications of geographicalinformation systems (GIS) for spatial decision support in aquaculture. Aquacult.Eng. 23, 233–278.
OIE, 2005. Disease Information 11 March 2005 18, No. 10.Paskin, R., 1999. Manual on livestock disease surveillance and information systems. FAO
Animal Health Manual, vol. 8. FAO, Rome, p. 71 pp.Regueira, E., 2001. Patrones espaciales y temporales de la producción camaronera en el
Golfo de Guayaquil. MSc. Thesis, Escuela Superior Politécnica del Litoral, Ecuador.Rodríguez, J., Bayot, B., Amano, Y., Panchana, F., de Blas, I., Alday, V., Calderón, J., 2003.
White spot syndrome virus infection in cultured Penaeus vannamei (Boone) inEcuador with emphasis on histopathology and ultrastructure. J. Fish Dis. 26,439–450.
Salman, M.D., Star, K.D.C., Zepeda, C., 2003. Quality assurance applied to animal diseasesurveillance systems. Rev. Sci. Tech. OIE 22, 689–696.
Sanson, R.L., Pfeiffer, D.U., Morris, R.S., 1991. Geographic information systems: theirapplication in animal disease control. Rev. Sci. Tech. OIE 10, 179–195.

173B. Bayot et al. / Aquaculture 277 (2008) 164-173
Shahid, M.A., Pramanik, M.A.H., 1986. The application of remote sensing techniques tostudy the relationship between the shrimp/fish farm and the mangrove ecosystemof the Bangladesh coastal region. Proceedings of the Regional Seminar on theApplication of Remote Sensing Techniques to Coastal Zone Management andEnvironmental Monitoring, Dhaka, Bangladesh, SPARRSO-UNDP/ESCAP. UnitedNations Development Programme/Economic and Social Commission for Asia-Pacific, pp. 108–119.
Smith, P.T., 1999. Application of GIS to the Thai shrimp farm survey. In: Smith, P.T. (Ed.),Proceeding of theWorkshop on Towards sustainable shrimp culture in Thailand andthe region, 28 October–1 November 1996, Hai Yai, Songkhla, Thailand. ACIARProceeding No. 90. Canberra, Australia.
Sonnenholzner, S., Bayot, B., Apolo, I., Vera, T., Ochoa, X., Cisneros, Z., Van Biesen, L.,Cornejo, M.P., Calderón, J., 2004. Development of a shrimp yield index for ageographic information system (GIS) assisted determination of production levels:implementation of an alert system for the shrimp farming industry of Ecuador.Aquaculture 2004 Meeting abstract 2004, Hawaii, USA.
Staubach, C., Klob, D., Kroschewski, K., Demel, W., Kramer, M., 2003. CSF of wild boar— asurveillance data base for Belgium, France, Germany, Luxembourg and The
Netherlands. Electronic proceeding of the Tenth Symposium of the InternationalSociety for Veterinary Epidemiology and Economics (ISVEE 10), 17–21 November2003, Viña del Mar, Chile.
Subasinghe, R.P., McGladdery, S.E., Hill, B.J. (Eds.), 2004. Surveillance and zoning foraquatic animals diseases. . FAO Fish. Tech. Pap., 451. FAO, Rome. 73 pp.
Tang, K.F.J., Pantoja, C.R., Redman, R.M., Lightner, D.V., 2007. Development of in situhybridization and RT-PCR assay for the detection of a nodavirus (PvNV) that causesmuscle necrosis in Penaeus vannamei. Dis. Aquat. Org. 75, 183–190.
Tum, S., Puotinen, M.L., Copeman, D.B., 2004. A geographic information systems modelfor mapping risk of fasciolosis in cattle and buffaloes in Cambodia. Vet. Parasitol.122, 141–149.
Vidal, O.M., Granja, C.B., Aranguren, F., 2001. A profound effect of hyperthermia onsurvival of Litopenaeus vannamei juveniles infected with white spot syndromevirus. J. World Aquacult. Soc. 32, 364–372.
Yilma, J.M., Malone, J.B., 1998. A geographic information system forecast model forstrategic control of fasciolosis in Ethiopia. Vet. Parasitol. 78, 103–127.