an introduction to micromachined biochemical sensors p. grutter physics department, mcgill...
TRANSCRIPT

An introduction to An introduction to micromachined biochemical micromachined biochemical
sensorssensors
P. GrutterPhysics Department,
McGill University,
Montréal, Canada
www.physics.mcgill.ca/~peter

OutlineOutline
• Introduction• What is a sensor?• Issues in sensors: what are the problems?• Cantilever based sensors
– Alkanethiol self-assembled monolayers on gold from the vapor phase
– Surface stress at the solid-liquid Interface
• Conclusions:– Connections to molecular electronics

Why sensors?
Why sensors?
Intellectually challenging, intersection between
fundamental science and applications, excellent training for graduate students, complex, fun, cross fertilization between
different research fields, fundable
Why sensors?
Intellectually challenging, intersection between
fundamental science and applications, excellent training for graduate students, complex, fun, cross fertilization between
different research fields, fundable
e.g. nanowire FET - sensor – tunable catalyst electronic nose – cooperative hunting strategy in wolves

Why sensors?
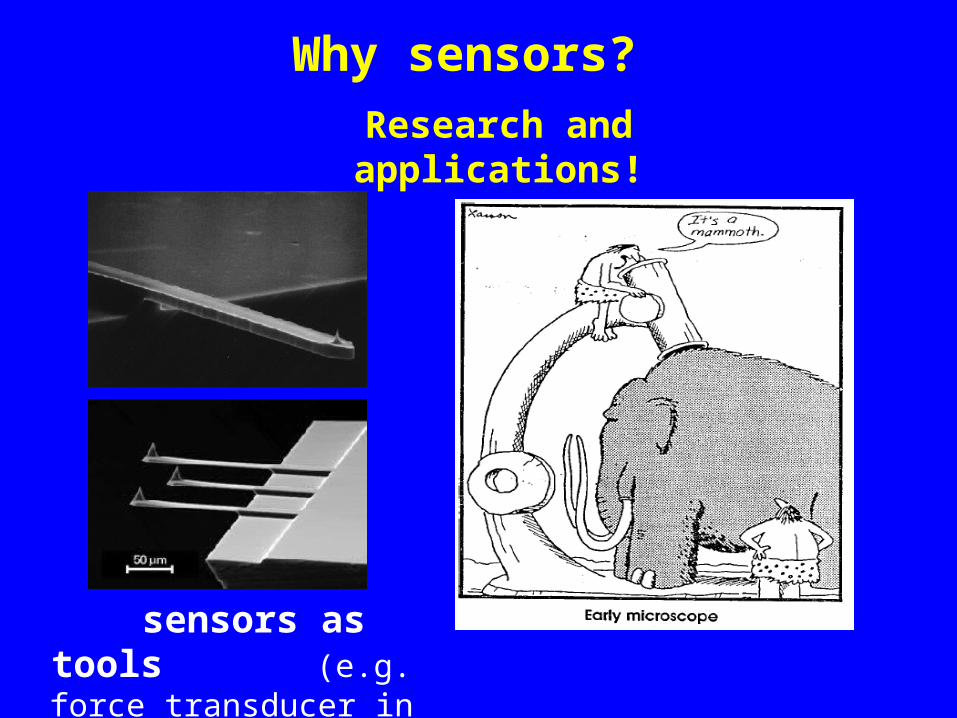
Research and applications!
Why sensors?
sensors as tools (e.g. force transducer in
AFM)
Research and applications!

Why sensors?
sensors as tools (e.g. force transducer in
AFM)
Research and applications!
AFM image of PTCDA on KBr
Grutter Group

Why sensors?
sensors as diagnostic platforms (‘personalized
medicine’)
Research and applications!
sensors as research tool(how big is the human genome ?)

Introduction to Introduction to sensorssensors
•what is a sensor?
•terminology of detection
•overview of sensor classes with some examples

from Stephen Creager (Clemson University):

Distinctions between probes, reporters, and sensors...
• Probes provide feedback about a physical state (T, force, etc.)
• Reporters provide feedback by the nature of their distribution in heterogeneous media (dyes, tagged lipids, etc.)
• Sensors report the presence of a chemical species in the presence of many others.

Detector vs. Sensor
centrifuge
acid treatment
centrifuge
ion chromatography (separation)
detector (flame ionization)
direct measurement in crude sample
blood sample

Sensors examples
• pH (litmus paper; pH electrode-potentiometry)
• Breathalyzer (alcohol dehydrogenase, colorimetric detection of NADH produced)
• pregnancy tests (antibody linked to color change)
• carbon monoxide (canary; metal oxide resistance change)

Sensitivity, selectivity & dynamic range
• What concentration of target is measurable?
• Does signal need to be integrated over time or is “instant read” possible?
• Selectivity : Are common interferents going to effect response? Do they enhance signals? Reduce them?
• Matrix effects : Is response dependent upon capture of target by sensor? Does matrix viscosity affect signal?

Reproducibility
• Repetitive use or single use?
• Internally calibrated or per-use calibrated?
• Tolerance limits of (ir)reproducibility?
0.1%? 5%? 30%?
• Shelf life?

Limitations of Chemosensors
• tend to be powerful for ions, metals, some low MW molecules
• very limited for organic molecules of interest (sugars, drugs/metabolites, peptides/proteins, antibodies, DNA/RNA)

• Use a biorecognition event to initiate detection process
• Extent of binding, kinetics of binding, fate of bound species are all crucial
Biosensors
Enzyme
SubstrateActive site

• Affinity sensor :
• Catalytic sensor :
Biosensors : 2 types
+
+ +Measure this

• HCG sensing (pregnancy test)
Affinity Biosensors
Ab
++ HCG
250 kD 425 g/mol
HCG
(Human chorionic gonadotropin (hCG) is a glycoprotein hormone produced in pregnancy that is made by the developing embryo soon after conception.)

Affinity sensor: DNA Biosensor
•Complementary strands of ssDNA form dsDNA.
GeneChip technology:
•Specific DNA sequences used as probe to detect fluorescent tags in complementary target ssDNA.
fluorescent tag
Technique: Hybridization
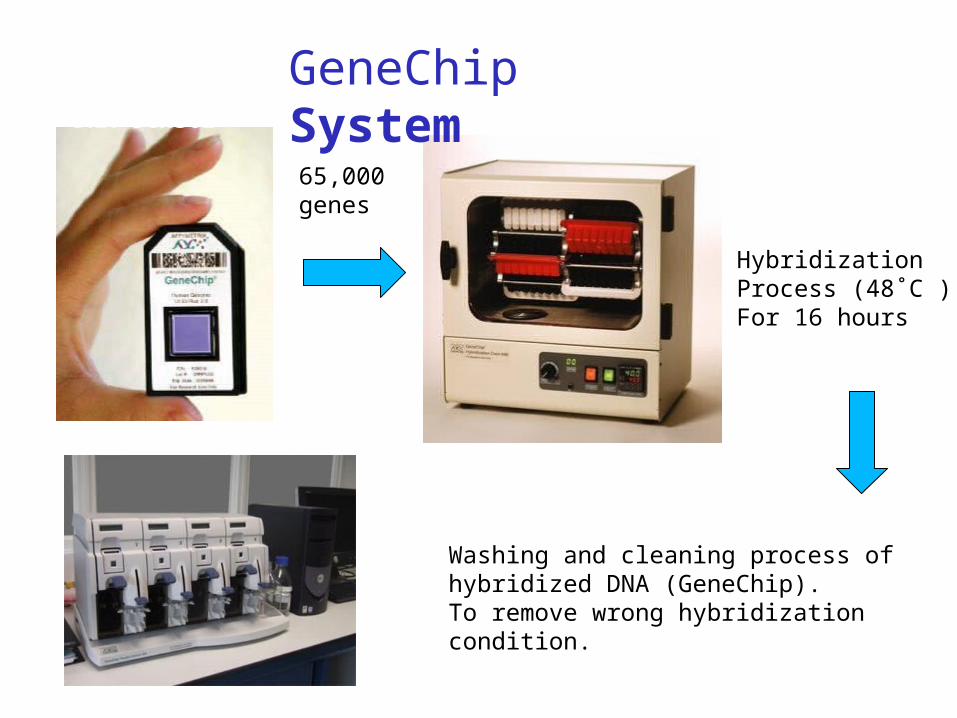
GeneChip System
HybridizationProcess (48˚C )For 16 hours
Washing and cleaning process of hybridized DNA (GeneChip).To remove wrong hybridization condition.
65,000genes
DNA sensor

GeneChip System
Issues & Problems:
• PCR amplification const?• fluorescence intensity (e.g. focus, bleaching,.. ) -> limits quantitative analysis• Sensitivity limit: 16pM• Mismatch binding (false positives) • Chip not reusable (depends on perspective)

Bio-catalytic Sensors
Glucose sensing• Diabetes (Type I, Type II) creates about 15%
of our total healthcare costs• Glucose management is the only route to
minimization/delay of vision and circulation problems
• $2.7 billion market (2002) and growing

• Glucose
• 2 electrons per reaction
Sensing via Redox-Active Enzymes
glucose
gluconolactone
O2
H2O2
τ ≈ 2 yrs

• Sensing with redox enzyme is an exercise in electronics
gluconolactone
glucose
glucose oxidase-reduced(GOD·H2)
glucose oxidase(GOD)
O2
H2O2
τ ≈ 10 ms

Clark Electrode (1962)
• Still the “gold standard”; cumbersome, expensive
GOD·H2
GOD
O2
H2O2
e-
Pt electrode
glucose
membrane

LifeScan® Glucose Sensor
• Handheld reflectometer measures amount of “blue” produced in 30s,60s,90s and interpolates to a calibration curve
• Prone to variations in O2, interferents in blood including Vit. C
GOD·H2
GOD
O2
H2O2Colorless molecule
Blue molecule
glucose
membrane

In-vivo: wired vs. ‘wireless’ sensors
• in situ use of molecules, complexes, and materials which undergo a well understood change in optical or physical properties
• Dyes (incl. genetic constructs such as GFP), quantum dots, metal nanoparticlesA. L. Lucido F. Suarez, P. Thostrup,
et al (Coleman & Grutter group)Journal of Neuroscience (2009)

What properties would the dream nanoparticle sensor have?
• targeted localization within cellular environment
• single-particle detection (and change thereof)
• single–species selectivity
• non-perturbing incident/exiting radiation


Schematic of the overall structure of a Qdot nanocrystal conjugate. The layers represent the distinct structural
elements, and are drawn roughly to scale.
Qdot nanocrystals are roughly protein-sized clusters of
semiconductor material.
A functionalized Qdot nanocrystal
Chemical issues with QDs
•Ligand coating is difficult to design and keep
•Hole-electron pair can do chemistry (Nadeau, Nat. Mat. 2006)
•Early availability of commercial products that do not have certificates of analysis

Sensors: what are the problems?Sensors: what are the problems?
a sensor needs to be:
1. selective 2. transduce signal3. timely

a sensor needs to be:
1. selective 2. transduce signal (*)3. timely
(*) smallest detectable signal (s/n), dynamic range (DR), quantitative or ‘yes-no’, stability/shelf life, cost… all very relevant issues.
Note: optimizing them an interesting challenge!

a sensor needs to be:
1. selective 2. transduce signal3. time constraints
So – what are the ultimate limits?
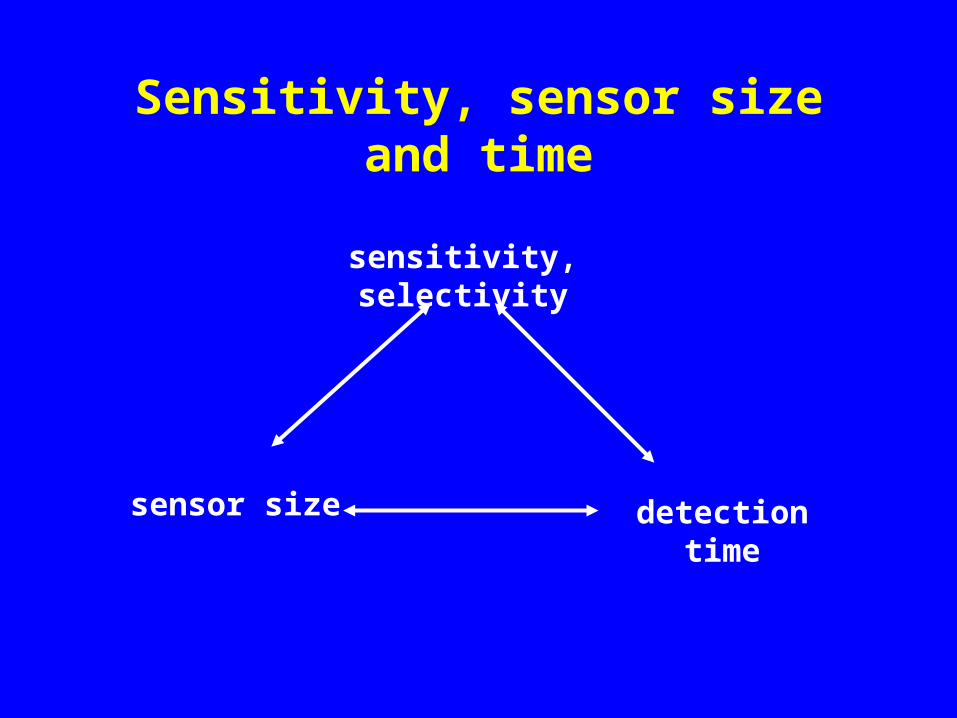
Sensitivity, sensor size and time
sensitivity, selectivity
sensor size detection time

Sensitivity, sensor size and time
sensitivity, selectivity
sensor size detection time
what are the scaling laws???

Understanding the details necessary to determine relationships
Lavrick et al, Rev. Sci. Instrum. 75, 2229 (2004)

Step 1:How does the reagent get to the sensor?

Step 1:How does the reagent get to the sensor?
Diffusion!

Step 1:How does the reagent get to the sensor?
Diffusion ?

Reality check……..number of molecules in your sample
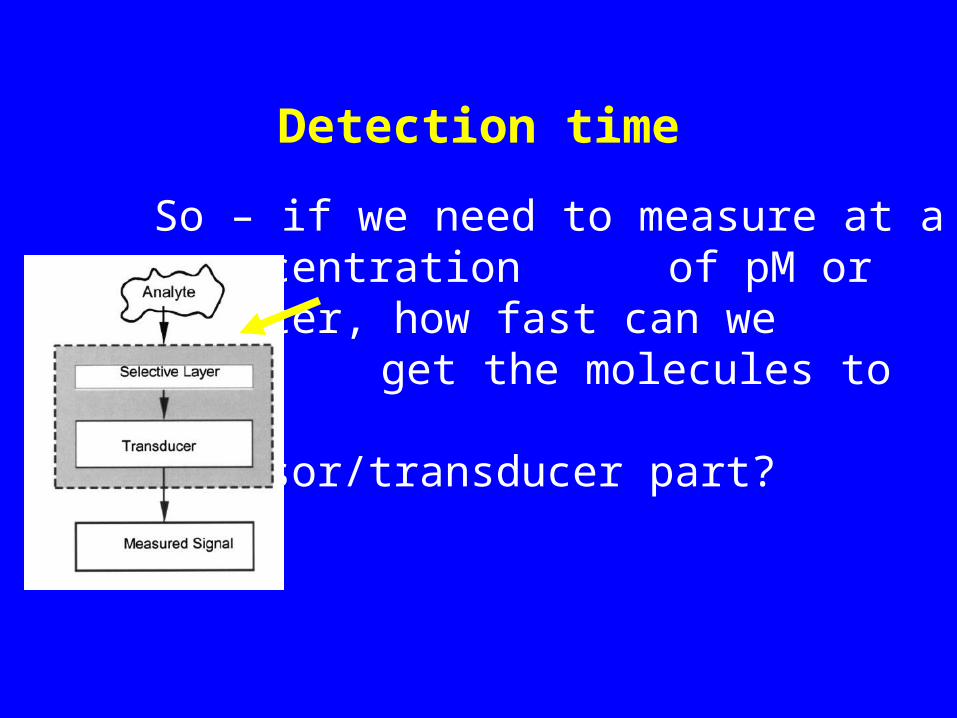
Detection time
So – if we need to measure at a concentration of pM or better, how fast can we
get the molecules to the sensor/transducer
part?

Detection time
So – if we need to measure at a concentration of pM or better, how fast can we get the molecules to the sensor/transducer part?
In the case of ‘doing nothing’ – diffusion!

Lets look at diffusion
Diffusion constant D = 10-8 cm2 /s in H2O
= 1 m2 /s
Probed volume V = D3/2 t (dimensional analysis)
for 1 molecule to probe 1 m3 wait 1 s for 1 molecule to probe 1 l wait 109 s
Reality check!
How long and far does pollen ‘jump’ on water (Brownian motion)

Reality check!
How long and far does pollen ‘jump’ on water (Brownian motion)
How long do you wait for milk in your coffee (with a volume substantially larger than 1 l ) to diffuse?

Reality check!
How long and far does pollen ‘jump’ on water (Brownian motion)
How long do you wait for milk in your coffee (with a volume substantially larger than 1 l ) to diffuse?
Activated diffusion is the key! thermal, electrochemical, magnetic,
mechanical, convection, turbulence, flow, … scaling???

So – what about kinetics?
A + B AB

For 10% reaction yield:
You will wait 10 minutes at 10 nMYou will wait 100 minutes at 1 nM
You will wait 100 x 1000 minutes = 70 days at 1 pM
ASSUMING a (low) reaction rate constant of 107 M -1 (typical reaction rate for RNA hybridization)

The Tyranny of Langmuir Adsorption Isotherms(Robert Corn, UC Irvine)

Conclusion
You better speed up things by:
applying a strong driving force (e.g. electrochemical, magnetic driving forces, turbulence…)
or/and
Conclusion
You better speed up things by:
applying a strong driving force (e.g. electrochemical, magnetic driving forces, turbulence…)
or/andconcentrating analyte (e.g. evaporation, magnetic beads,
PCR, …)
(even if your sensor/transducer is VERY sensitive)
Nano to the rescue!
Small short distances fast
Small/nano sensitive small concentration and small number of analytes work!

Nano to the rescue?
Small short distances fast
Small & nano sensitive small concentration and small number of analytes work!
But not all things scale well: 1. really hard to get turbulence/mixing in a
microfluidics device; 2. s/n might be better, but DR reduced, etc.

Understanding the details is importantUnderstanding the details is important
Transport times and reaction kinetics will determine how big system can be
which determines
How many parallel sensors can be operated
which determines
How complex a reaction one can monitor
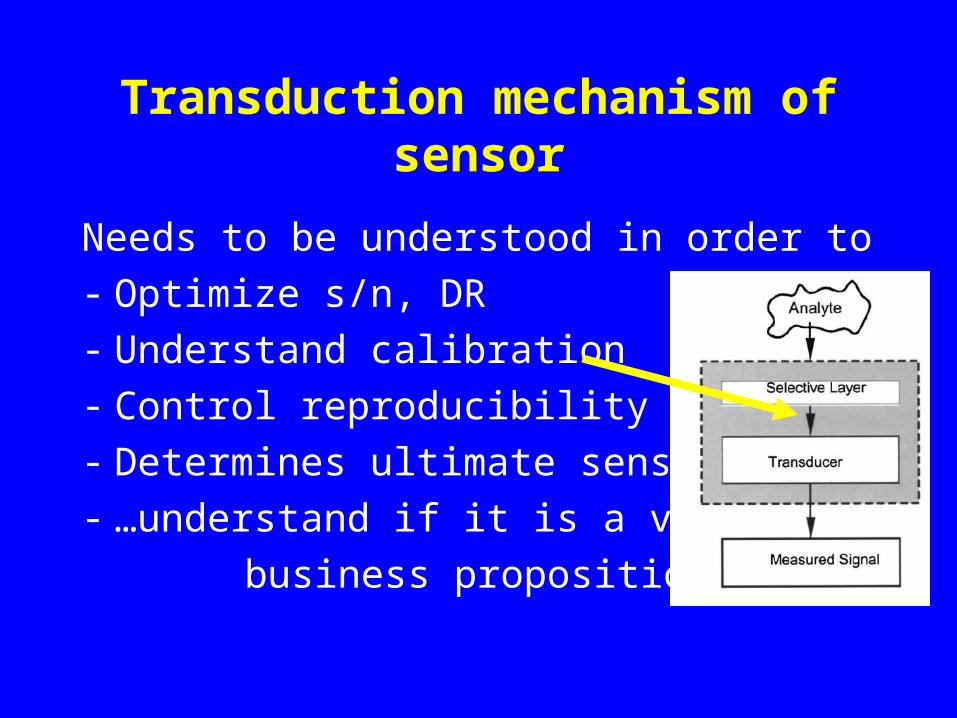
Transduction mechanism of sensor
Needs to be understood in order to
- Optimize s/n, DR
- Understand calibration
- Control reproducibility
- Determines ultimate sensitivity
- …understand if it is a viable
business proposition

Understand system noise (=output noise)
small numbers sqrt(n) fluctuations !
[or very different operation mode: counting of individual molecules (discrete output)]
Intrinsic noise sources of transducer:
cantilever sensor: external vibrations, bimetallic bending, thermal vibrations
optical sensor: shot noise, scattering depth, …
resistor: shot noise, 1/f noise, …
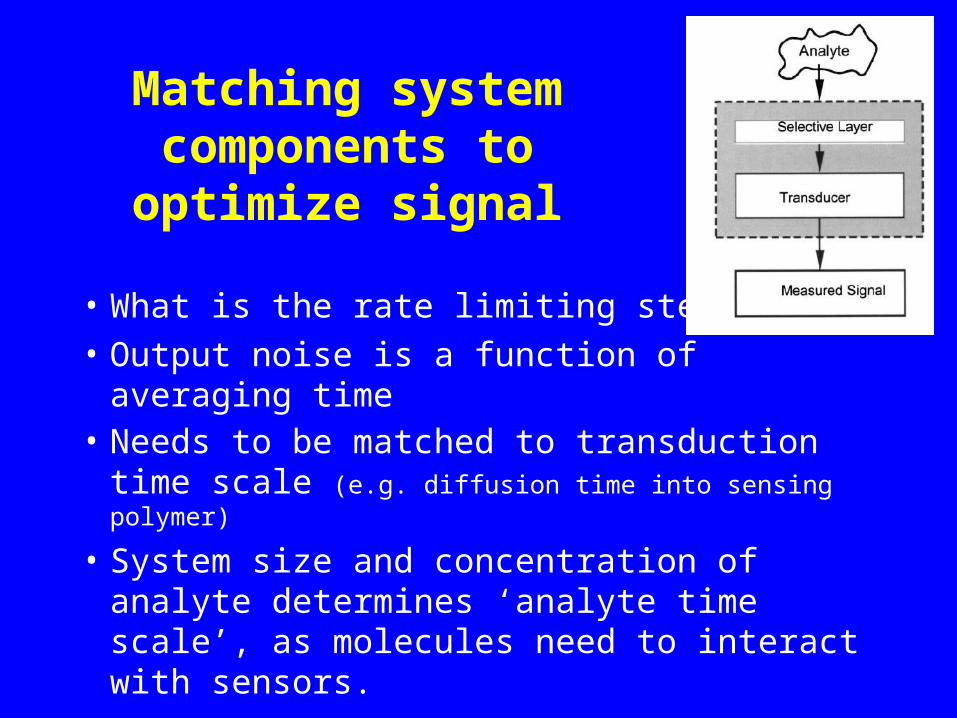
Matching system components to optimize
signal
• What is the rate limiting step?
• Output noise is a function of averaging time• Needs to be matched to transduction time
scale (e.g. diffusion time into sensing polymer)
• System size and concentration of analyte determines ‘analyte time scale’, as molecules need to interact with sensors.

Maximizing signal
Understand where it comes from!
(i.e. what is the transduction mechanism ?)

For ultimate sensitivity do single molecule counting!

For ultimate sensitivity do single molecule counting!
But hard to do…

For ultimate sensitivity do single molecule counting!
So – single molecule biophysics research could have an impact on ultimate sensing!
e.g. quantum dots!

For ultimate sensitivity do single molecule counting!
So – single molecule biophysics research could have an impact on ultimate sensing!
e.g. quantum dots!
but, they blink…

For ultimate sensitivity do single molecule counting!
So – single molecule biophysics research
could have an impact on ultimate sensing!e.g. quantum dots! but, they blink…and might kill cells…
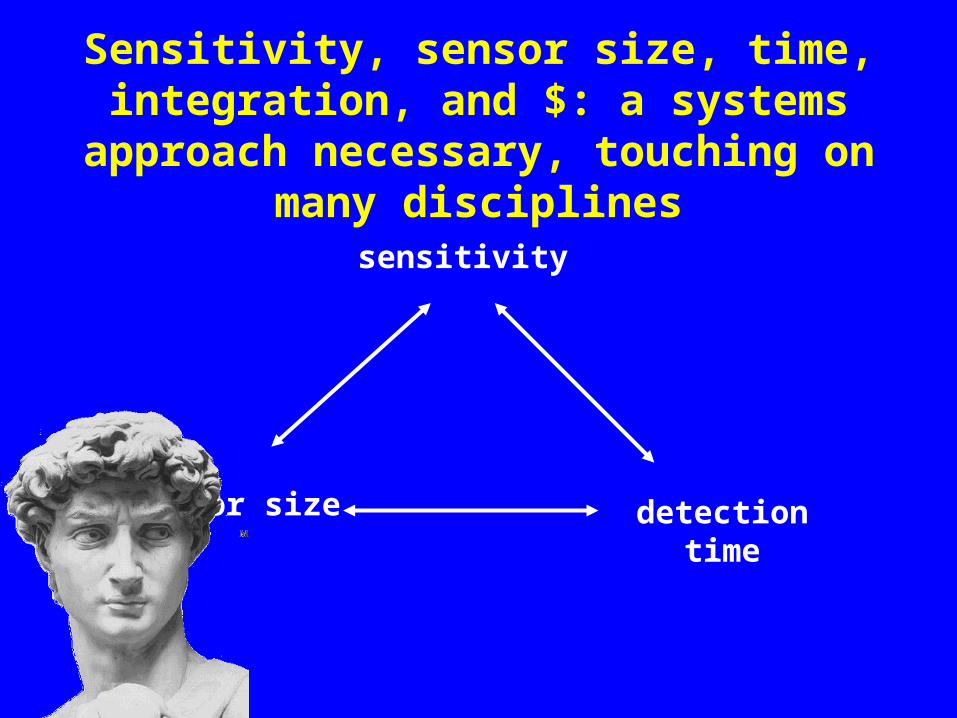
Sensitivity, sensor size, time, integration, and $: a systems approach necessary,
touching on many disciplines
sensitivity
sensor size detection time
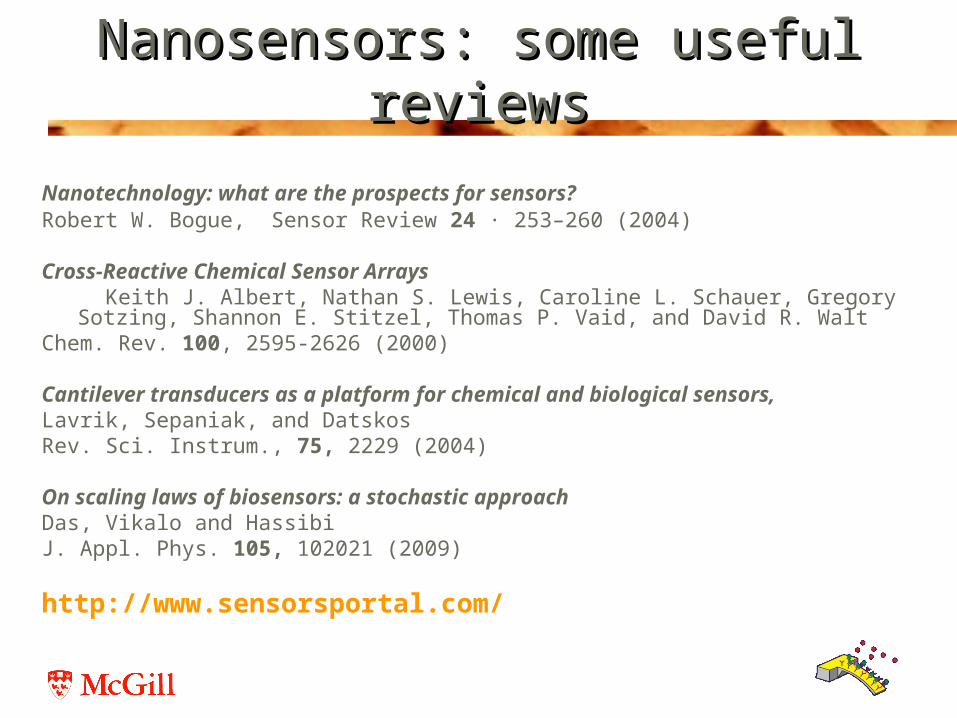
Nanosensors: some useful reviewsNanosensors: some useful reviews
Nanotechnology: what are the prospects for sensors? Robert W. Bogue, Sensor Review 24 · 253–260 (2004)
Cross-Reactive Chemical Sensor Arrays Keith J. Albert, Nathan S. Lewis, Caroline L. Schauer, Gregory Sotzing, Shannon E.
Stitzel, Thomas P. Vaid, and David R. WaltChem. Rev. 100, 2595-2626 (2000)
Cantilever transducers as a platform for chemical and biological sensors, Lavrik, Sepaniak, and DatskosRev. Sci. Instrum., 75, 2229 (2004)
On scaling laws of biosensors: a stochastic approach Das, Vikalo and HassibiJ. Appl. Phys. 105, 102021 (2009)
http://www.sensorsportal.com/

Cantilever-based SensorsCantilever-based Sensors
Thermometer/Calorimeter1010-5-5 K / 1 pJ Sensitivities K / 1 pJ Sensitivities
Mass Balance1010-18-18 g sensitivity g sensitivity
Surface Stress SensorSpecific Target MoleculesSpecific Target Molecules
• Single E. Coli bacterium (665 fg)
• Single vaccinia virus - Smallpox (9.5 fg)
•DNA
• Proteins
• Antigen-Antibody
• pH sensing
• …
• Phase Transitions of metal clusters, alkanes (picoliters)
• Landmine detection
Lang et al. Nanotechnology 13, R29-R36 (2002)
Alkanethiol SAM
Solid-liquid Interface
Polypyrrole Actuators

Concept of DNA SensorConcept of DNA Sensor
McKendry et al., PNAS 99, 9783 (2002) Fritz et al. Science 288, 316 (2000)

Systems IntegrationSystems Integration
Lang et al., Materials Today, April 2005

Towards Understanding Towards Understanding Stress Associated with the Stress Associated with the
Self Assembly of Alkane Self Assembly of Alkane Thiols on Au(111)Thiols on Au(111)
J. Delantes, V. Tabard-Cossa, M. Godin, T. Monga, Y. Nagai, H. Bourque, R.
Sladek, R.B. LennoxPhysics, Chemistry & Genomics Department,
McGill University, Montréal, Canada
www.physics.mcgill.ca

OutlineOutline
Motivation: Cantilever based biochemical sensors
Question: origin of signal?
1. Model gas phase system: alkanethiol SAM on Au(111) thin film
2. Electrochemical system: extra control button!
3. Dramatic improvement of DNA sensing signal

Model systemModel system
Alkanethiol Self-Assembled Monolayers (SAM) HS-(CH2)n-CH3 [Head – Chain – Endgroup]
Model for a variety of self-assembled systems Stable - Covalent binding to gold surface Simple - Simple chemical composition Versatile - Various functionalizations
Applications Surface passivation Surface functionalization (sensing) Molecular electronics
defined contacts straightforward assembly

Differential SensorDifferential SensorSecond
cantilever acts as a reference,
eliminating effects of
• temperature
• noise
• non-specific binding
• etc.
Differential signal purely due
to chemical interaction of
interestM. Godin et al. Rev. Sci. Instrum.74, 4902 (2003)
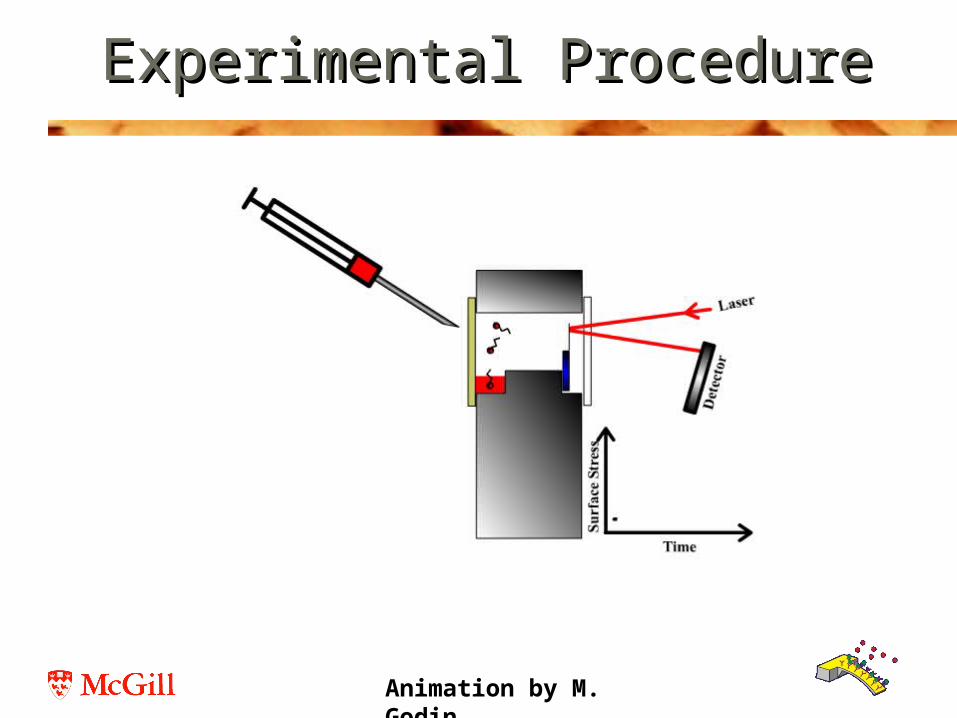
Experimental ProcedureExperimental Procedure
Animation by M. Godin

CalibrationCalibration
• Optical beam deflection technique
The surface stress () is in turn directly proportional to the microcantilever deflection (z) through :
For small deflections, the microcantilever deflection (z) is linearly proportional to the acquired PSD signal (S).
M. Godin et al. Appl. Phys. Lett. 79, 551 (2001) L. Y. Beaulieu et al. Appl. Phys. Lett. 88, 083108 (2006)
Ccal = (3.42 ±0.07) 10-6 m/V

Previous StudiesPrevious Studies
Berger et al. Science 276, 2021 (1997)
• Big variability in the surface stress – puzzling…– Must control SAM formation conditions
n = 12
• Berger et al. first to measure surface stress induced during the formation of alkanethiol SAM from the vapor phase
• Reproduced: ~0.5 N/m (dodecanethiol – C12)

3 µm × 3 µm – Large-Grained Gold
Gold Substrate MorphologyGold Substrate Morphology3 µm × 3 µm – Small-Grained Gold
100 nm Au, 10 nm Ti (adhesion)Grainsize: 90 ± 50 nm
ST
M
Tip
Bia
s 60
0 m
V;
I =
100
pA
Godin et al. submitted for publication
100 nm Au, T = 200oC - 260oCGrainsize: 600 ± 400 nm
C12C10
Godin et al. Langmuir 20, 7090 (2004)

Alkanethiol SAM FormationAlkanethiol SAM Formation
G.E. Poirier, Langmuir 15, 1167 (1999)
Str
uctu
re w
ith in
crea
s ing
co v
e ra g
e
Lying-Down Striped Phases
Standing-up Phase

Complementary info: STMComplementary info: STM24.5 × 24.5 nm
C12 SAM on Small-Grained GoldPredominantly Stacked lying-down Phase
“Kinetics Trap”
Tip
Bia
s: 6
00m
V ;
I =
25
pA
44.7 × 44.7 nm
C12 SAM on Large-Grained GoldAll Standing-up Phase c(4×2) of (√3×√3)R30o

Kinetics TrapKinetics Trap
Y. Yourdshahyan et al. J. Chem. Phys. 117, 825 (2002)
Seems consistent with literature: G. E. Poirier; Langmuir 15, 1167 (1999) and H. Kondoh et al.; J. Chem. Phys. 111, 1175 (1999)
Nucleation of the standing-up phase occurs at the domain boundaries of the lying-down phase
Small-Grain size Few domains Few domain boundaries restricted transition into the standing-up phase (i.e. kinetics trap)

Kinetics of SAM formationKinetics of SAM formation
A: Initial adsorption
B: Lying down phase
C: Standing up phase
Long time scales:

Rate of change of vapor concentrationRate of change of vapor concentration

‘‘Aging’ of substrate Aging’ of substrate
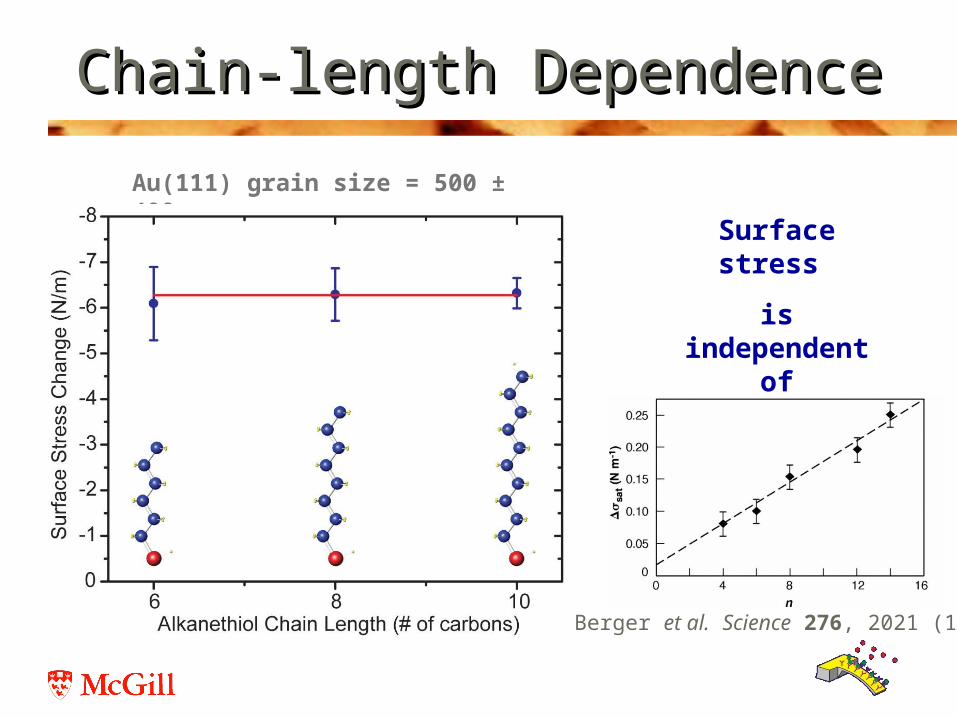
Chain-length DependenceChain-length Dependence
Au(111) grain size = 500 ± 400 nm
Surface stress
is independent of
chain-length !
Berger et al. Science 276, 2021 (1997)

Some Conclusions…Some Conclusions…
Godin et al. Langmuir 20, 7090 (2004)
Factors critical to SAM growth; explains reproducibility problems (Schwartz, Annu. Rev. Phys. Chem. 52, 107 (2001))
6 N/m is a lower bound in surface stress. ( ~ 10 N/m)
Substrate morphology & analyte introduction conditions (concentration) strongly influences kinetics and SAM structure

• 1. Chain-Chain Interactions– Lennard-Jones (van der Waals)– Steric Repulsion
• 2. Electrostatic repulsion
[Berger et al. Science 276, 2021 (1997)] – Between Au+S- bonds
• 3. Changes in electronic structure of Au surface atoms– Surface reconstruction of Au(111)
Modeling Origins of Surface StressModeling Origins of Surface Stress
d
d

Origin of Surface StressOrigin of Surface Stress
In essence, as in the gas-phase experiments, the induced surface stress at the solid-liquid interface is due to changes in the electronic structure of the underlying gold surface upon ionic adsorption.
tensile compressive

• Relevance of various contributions to the surface stress:
Lennard-Jones 0.001 – 0.01 N/m steric hindrance
Electrostatic 0.1 – 1 N/m dipole interactions
Surface charge redistribution 1 – 10 N/m charge transfer
Modeling: conclusionsModeling: conclusions

Surface charge redistribution important!Surface charge redistribution important!Nanotechnology 21, 5501 (2010)
Grutter group, Nanotechnology 21, 5501 (2010)

Why an Electrochemistry Set-up?Why an Electrochemistry Set-up?
Electrochemistry: a knob to gain extra control over the interface Well-defined, clean surfaces kinetics measurements and in a reversible fashion.
Measurements of thermodynamic parameters surface stress and surface energy surface charge density (via Coulomb chronometry)
Gain a deeper understanding of the physical origins of surface stress through testing of theoretical modeling of the cantilever-electrolyte interface.

Combined stress and Combined stress and electrochemistry measurementselectrochemistry measurements
V. Tabard-Cossa et al. Sensors and Actuators B 107, 233-241 (2005) V. Tabard-Cossa et al.
Analyt.Chem. 79, 8136 (2007)

Thermodynamics Thermodynamics at theat the Solid-Liquid Interface Solid-Liquid Interface
qE
Shuttleworth Equation
Lippmann Equation
surface stress
surface energyDerivative ofsurface energywith surface strain
potential
charge density
Simplest model of electrical double
layer assumes constant capacity, C
Electrocapillary curve
Lipkowski et al. J. Electroanal. Chem. 452 (1998)
221
2 2
qCE
C
,dw
dA
1, ( )
dwdA A d
A d
surface energy
surface stress

Solid-Liquid InterfaceSolid-Liquid Interface
Double layer region :Adsorption of ClO4
- takes place to compensate for the build up of
positive charge on the cantilever surface, analogous to the charging of a capacitor
PZC

Surface EnergySurface Energy
Cantilever results same as electrochem. on single crystal!

Morphology independence in electrolytesMorphology independence in electrolytes
The inset of the graph represents data from surface A, B and C normalized by a constant factor.
V. Tabard-Cossa et al., Anal. Chem, 79, 8136 (2007)
Image size 500nm x 500 nm
evaporated gold film on a Ti adhesion layer
sputtered gold film at 300 °C grown on a Nb adhesion layer
sputtered gold film at 400 °C grown on a Nb adhesion layer

Origin of Surface StressOrigin of Surface Stress
Simple Model of a parallel-plate capacitor [1] to model electrostatic repulsive interaction between charges at the interface:
2
202 eff
qd
A
Possible to produce the magnitude and the right sign
BUT Not a quadratic function of q
No maximum at the PZCNot symmetric about the PZC
[1] Ibach et al. PRL vol. 77, 127-130 (1996)
PZC
2
,0
1
2estat
estateff
EqE d
A A
deff = Rion = 0.24 nm, Y. MARCUS, Chem. Rev. 1988. 88. 1475-1498
PZC

Major ConclusionsMajor Conclusions
Surface energy surface stress
Potential-induced surface stress is dominated by the differential capacitance.
( ) ( )E q q E
Capacity
V. Tabard-Cossa, M. Godin, I. J. Burgess, T. Monga, R.B. Lennox, and P. Grutter
Anal. Chem, 79, 8136 (2007)

Modeling Surface Stress in Liquids: Modeling Surface Stress in Liquids: Challenging!!!Challenging!!!
tensile compressive
Reminder:
In solution: Competing effects due to charge density redistribution on cantilever Au surface through:
a) Battery (or open circuit)b) Ion adsorption (with possible charge transfer,
depending on nature of interaction)
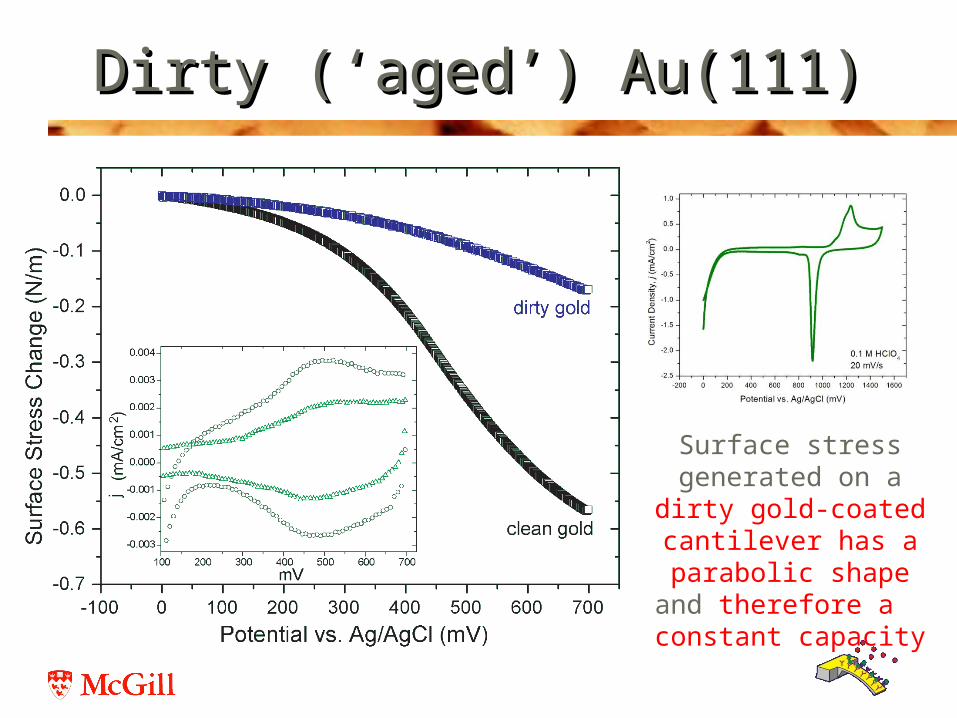
Dirty (‘aged’) Au(111)Dirty (‘aged’) Au(111)
Surface stress generated on a dirty
gold-coated cantilever has a parabolic shape
and therefore a constant capacity
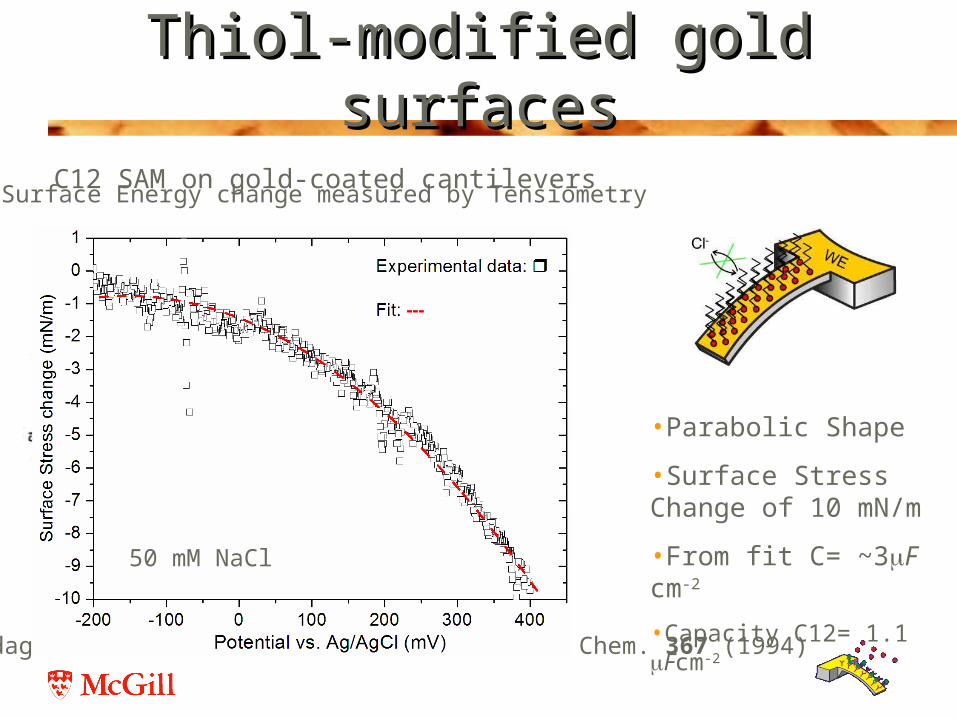
Thiol-modified gold surfacesThiol-modified gold surfaces
C12 SAM on gold-coated cantilevers
•Parabolic Shape
•Surface Stress Change of 10 mN/m
•From fit C= ~3F cm-2
•Capacity C12= 1.1 Fcm-2
Surface Energy change measured by Tensiometry
Sondag-Huethorst & Fokkink, J. Electroanal. Chem. 367 (1994)
50 mM NaCl

Defect density (surface coverage)
0 30 60 90 %
Stress as a function of defect densityStress as a function of defect density
C12 SAM on Au(111) in Cl-, measured by ferrocene replacement reaction, quantified electrochemically

Surface stress in 100 mM solutionSurface stress in 100 mM solution

Defect Engineering is crucial!Defect Engineering is crucial!
Probe:
ssDNA persistence length ~1nm
probe + target
~ 50nm for dsDNA
Defect EngineeringDefect Engineering
• Changes in persistence length ~1nm for ss-DNA, 50 nm for DS-DNA
• Sequence dependent melting temperature• Charge transfer reactions• Competitive binding: bonds are dynamic• many other possibilities….

Outlook: large signals for DNAOutlook: large signals for DNA
Au Cantilever~160 m N/m
25 bp ssDNA Au Cantilever~145 m N/m
25 bp dsDNA perfect matchAu Cantilever~110 m N/m
Periodic SquarePotential Wave
TRIS-HCl 10 mM NaCl 50 mM buffer, pH = 7.2-7.5Patent pending

Some concluding remarksSome concluding remarks
If specific interactions involve charge transfer to a metallic layer, this can lead to large changes in cantilever stress. Connection to molecular electronics, in particular the role of contacts.
For NEMS, this is an issue and an opportunity: mass change as well as charge transfer can lead to changes in resonance frequency.
Cantilever sensors very sensitive. BUT how to make the few analyte molecules find the detector?
Use electrochemistry to drive them onto the receptor surface (well defined, cleaned) !
Beware of or use defects in sensing layer!
Can dominate response!

Sensitivity, sensor size and time: a systems approach necessary, touching on many
disciplines
sensitivity
sensor size detection time

Beware of cartoons!Beware of cartoons!
• Inspirational, drive new fields• Reality often more transpirational, as real systems
can be much more complicated (and exciting) !• Ask yourself critically ‘do we really know?’
www.physics.mcgill.ca/~peter

AcknowledgementsAcknowledgements• McGill group members:
– Jorge Dulanto– Vincent Tabard-Cosa*– Michel Godin*– Tanya Monga– Brian Seivewright– Dr. Helène Bourque– Dr. Luc Beaulieu***– Dr. Ian Burgess– Dr. Yoichi Miyahara
* Assist. Prof, U. Ottawa
*** Assit. Prof, Memorial University, NF
– Fundin
• Group Leaders:– Prof. B. Lennox (Chemistry McGill) – Prof. P. Grütter (Physics McGill)
• Collaborators: Current:– Prof. R. Sladek (Genomics McGill)– Dr. Y. Nagai (Genome Québec)– Prof. J. White (Physiology, McGill)
Past:– Prof. A. Badia (Chem., U Montréal)– Prof. P. Williams (Acadia U.)
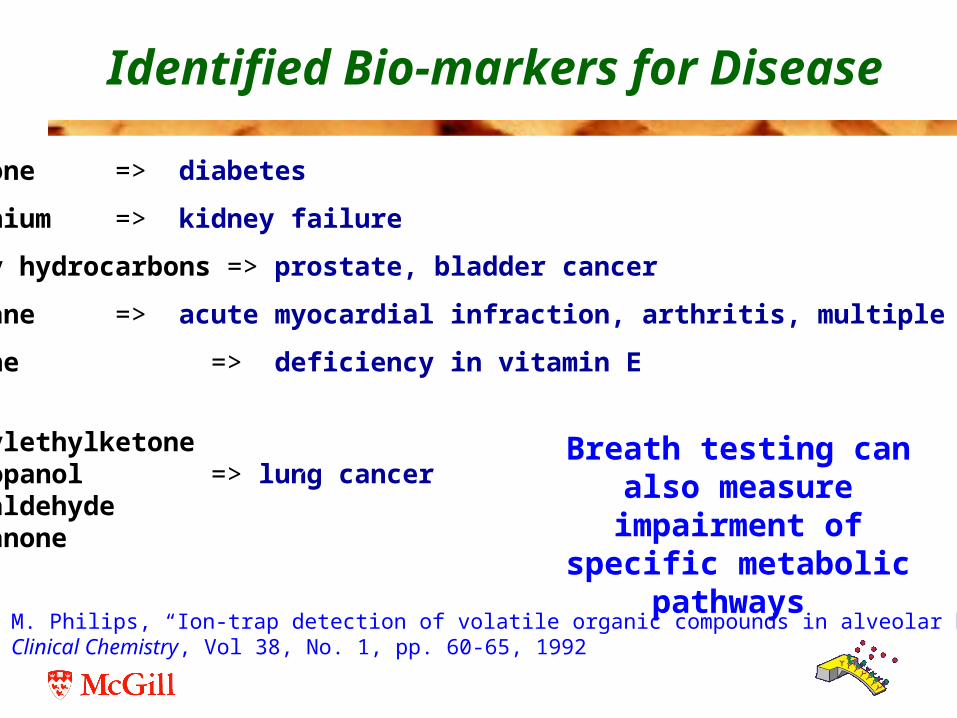
Breath testing can also measure impairment of
specific metabolic pathways
Identified Bio-markers for Disease
Acetone => diabetes
Ammonium => kidney failure
Heavy hydrocarbons => prostate, bladder cancer
Pentane => acute myocardial infraction, arthritis, multiple sclerosis
Ethane => deficiency in vitamin E
methylethylketonen-propanol => lung cancertolualdehyde oxepanone
M. Philips, “Ion-trap detection of volatile organic compounds in alveolar breath”Clinical Chemistry, Vol 38, No. 1, pp. 60-65, 1992