an experimental thin-bonded concrete overlay pavement · 2013-04-30 · an experimental thin-bonded...
TRANSCRIPT
TECHNICAL REPORT STANDARD TITLE PAGE. 1. Report No. 2. Government ... ~~e .. ion No. 3. Recipient's Catalog No.
I FHWA/TX-87/63+357-2F I
4. Titie and Subtitle S. Reporl Dale I AN EXPERIMENTAL THIN-BONDED
November 1985 ~
CONCRETE OVERLAY PAVEMENT 6. Perlorming Orgoni lolion Code
7. Author; .J B. Per/armIng Orgoni lotion Report No. Moussa Bagate, B. Frank McCullough, Research Report 357-2F D. W. Fowler, and M. Muthu 9. Per/arming Organi lotion Nome and Addre .. 10. Work Unit No.
Center for Transportation Research The University of Texas at Austin 11. Contract or Grant No.
Austin, Texas 78712-1075 Research Study 3-8-83-357 13. Type 01 Report and Period Covered
~ .. 1"< Sp~ •• ,;., A,_<, N_. ~d Add .... Final Texas State Department of Highways and Public Transportation; Transportation Planning Division
! P. O. Box 5051 14. Sponsoring Agency Code
i i I I
I I I
Austin, Texas 78763 15. Supplementary Noles Study conducted in cooperation with the U. S. Department of Transporta tion, Federal
Highway Administration Research Study Title: t'Experimen ta 1 Thin-Bonded Concrete Overlay" 16. Abstract
This report follows through design, construction and pavement evaluation of an experimental thin-bonded concrete overlay pavement placed on the south Loop 610 freeway in Houston, Texas, during the summer of 1983.
The body of knowledge gained from this experiment and laboratory work conI ducted at the Center for Transportation Research, The University of Texas at I 1 J Austin, is reported. Specifica ly, surface preparation techniques which will I result in good and durable bond between the concrete overlay and pavement, conI struction techniques which would provide a high level of serviceability and an ! assessment of cost and structural value are included herein. j This report is arranged so as to provide a i between those people and agencies contemplating i as a pavement rehabilitation alternative. i
framework for information exchange the use of Bonded Concrete Overlay
I
i i
I 17. Key Word.
pavement, overlay, concrete, thin-bonded, design, construction, evaluation, data analyses, reinforcement, thickness
lB. Distribution StDtemenl
No restrictions. This document is available to the public through the National Technical Information Service, Springfield, Virginia 22161.
19. Security Clollif. (of Ihi. report) 20. Security CI ... If. (of thi s page) 21. No. of Poge. 22. Price
Unclassified Unclassified 156
Form DOT F 1700.7 (S-IIi)
I I
I I
I I
AN EXPERIMENTAL THIN-BONDED CONCRETE OVERLAY PAVEMENT
Moussa Bagate B. Frank 11cGuUough
D. W. Fowler M. Huthu
Research Report Number 357-2F
Experimental Thin-Bonded Concret~ Overlay Research Project 3-8-83-357
comille ted for
T~xas State Department ot Highways and Public Transportation
in cooperation with the U. S. Department ot Transportation
Federal Highway Administration
by the
Center for Transportation Research Bureau of Engineering Research
The University of Texas at Austin
aovember 1985

The contents ot this report reflect the views of the authors, who are responsible for the facts and the accuracy of the data presented herein. The contents do not necessarily reflect the official views or policies ot the Federal Higl1way Administration. Tllis report does not constitute a standard, specitication t or regulation.
There was no invention or discovery conceived or first actually reduced to pract1ce in the course ot or under this contract, including any art, methOd, prr)cess, machine, manutacture, design or composition of matt.er, or any new and useful imlJrOVement thereof, or any variety of plant wilich is or may be patentable under the patent laws ot the United States of Acllerica or any toreign country.
11.
PREFACE
This is the second ana findl report which documents work done under
Project 3-8-83-357, "Experimental Thin-Bonaed Concrete Overlay." The project
was conducted as part of a cooperative highway research program between the
Center tor Transportati.on Resedrcl1, the Texas State Department of Highways
(:\11d Pub L ic Tral1spor tat ion, ana the Federal Highway ddmini::; trat ion.
Many people have contributed their help toward the completion ot this
stUdy. The authors would like to thank the Center tor Transportation
personnel for their assistance dnCl support throughout the stUdy, l.n
particular Jim Long and EduardO Ricci for technical assistance, Lyn Gabbert
and H.achel Hinshaw tor typing the manuscript, and Bob Gloyd and Jeannette
Garcia tor assistance with the computer systems.
Thanks are also extended to the Texas State Department at Highways and
Publ ic Transport':ltion and the Federal Highway Administration personnel who
made the South Loop 610 experiment a reality, especially Hr. W. V. Want,
formerly of tl1<! HOllston Urban Office and now of the Center for Transportation
Research.
ii.i

LIST OF REPORTS
Report 357-1, "A Study ot the Etfects ot Interh,ce Condition on Thin
Bonded PCC Overlay," by Kandiah Kailasananthan, B. F. McCullough, ana D. W.
Fowler, presents the findings of the laboratory experiments on thin-bonded
overlay which were conducted as a prelUde to completing the Houston 610 Loop
experimental section and the results ot the experiments on the field cores
obtained from the test $ections. October 1984.
Report 357-2F, "An i:'.:xperimental Thin-Bonded Concrete Overlay Pavement,1I
by iilo11ssa Bagate, B. Frank McCullough, D. W. FOWler, and N. Nuthu, describes
the design, construction, and pavement monitoring program on the S011th Loop
610 project in Houston and presents various data analyses which evaluate two
years of performance. November 1985.
v


ABSTl{ACT
This report follows tilrough design, construction, and pavement evaluation
,:>t an experimental thin-bonued concrete overlay pavement placed on the south
Loop 610 freeway in Houston, Texas, auring the summer of 1983.
The bOdy ot knowledge gained from this experiment ana laboratory work
conaucted at the Center for Transportation Research, TIle University of Texas
at Austin, is reportea. Specitlcally, surface preparation techniques w~lich
will result in gooa and aurable bona between the concrete overlay and
pavement, construction techniques which would provide a high level of
serviceabi.lity and an assessment of cost and structural value are included
herE:in.
This report is arrangea S0 as to proviae a tramework tor information
exchange between those people anCl agencies contemplating the use of Bonded
Concrete Overlay as a pavement rehabilitation altenlative.
vii

SUMMARY
The use of thin-bonded concrete over lay pavement is rapidly emerging as
a vidble means to rehabilitate concrete pavements. In recent years, several
projects have been constructed, and valuable information has been gathered,
with the Iowa Department of Transportation leading the way.
However, a survey of the available literature reveals that the
inforlll<:ttion is scattered ana in Il.I0St cases, ditticulty arises when it comes
to making statist ica l inferences, simp ly because the information was not
collected for that purpose (i.e., not task-oriented) or there has been no
prior well-defined experiment design.
During the summer ot 1983, an experimental 1,000 feet of thin bondea
concrete overlay pavement was placed in IH-610, an eight-lane divided freeway
in Houston, Texas. The original pavement structure is an eight-inch-thick
co~tinuously reinforced concrete pavement. Five design sections were
construe ted. Two main fac tors (conc ret e reinforcement and over lay thickness)
were ased at three ana two levels, respectively.
This report discusses several aspects of Bonded Concrete Overlay (BCD)
construction using the South Loop 610 experiment. First, design
considerations, construction aspects anCl pavement evaluation surveys are
presented followed by extensive d<ita analyses ~n an effort to ascertain
pavement pertorffidnce.
The report enos with
Second, interpretation of the analyses is presented.
conclusions derived from this stUdy and various
laboratury investigations ot BCD.

IMPLEMENTATION STATEMENT
Based on this study and the previous laboratory investigation, the
following are recommended for implementation:
(1) The thin-oonded concrete over lay scheme used in the Sou th Loop 610
experiment is a viable rehabilitation alternative, ana thus should
be included in the tuture project level Pavement Management System
decision making process in Texas.
(2) During BCQ construction, the SGime grade control requirements which
were used during construe tion of th e exist ing pavement should be
used. This is particularly important since the BCQ is expected to
proviae many yei:ir~ ot service lite.
(3) Until further information is known of the cost effectiveness of
other bonding agents, a mix:ture of water, cement, and plasticizer
should be used. This will deliver the expected bond performance.
(4) The use of steel-mat-reinforcetl BCQ design is warranted in areas of
high trattie l\:'vel and intensity or high ex:isting pavement
deflection.
(5) The use of tiber-reintorced BCQ design ~s warranted when cracking
LS the prime concern.

TABLE OF CONTENTS
PREFACE
I...I5T OF REPORTS
ABSTRACT
SUM.'1AR'i
IMPLEM~NTATlON STATEMENT
CHAPfC;l{ 1. Ii~TRODl1CTlOl~
Hackgroulld Objectives Urganization and Scope ot the Report
CHAPTER 2. BACKGROUND ON EXP~R H!~NTAL Tt: ST SECTIONS
Design Consiaerations Project Intormation • Project Specitications NeaSllremellts Program Construction
Tratti.c Handling Sequence ot Construction Operations
CHAPTER 3. FIiLD MEASUREMENTS
Pavement Oetlec tion . Test Points Location i'Iet'1odo logy
SUffiffidry ana Cone lllB ions for the Det lee t ion Study Concrete Movement at Cracks
Experiment Design Testing Procedure Rec0t'ded Concrete Movement
Concrete Fiela Tests
xiii
iii
v
V 1.1.
LX
Xl.
1 2 3
5 7 8
15 20 20 21
23 23 25 28 30 30 41 41 43
CHAPTER 4. ANALYSIS OF PERFORMAi.~C~ DATA
Conaition Survey Data. • • • • • • • • • • • • • •• 47 Roughnes s Da ta •••• • • • • • • • • • • 57 SUllIIIlary and Conc lusions for the Analysis of Performance Data 59
CHAPTER 5. OVERLAY COST INFORl:1ATION
Agency Cost User Cost • Conc lusiuns for th e Cost Study
CHAPTER 6. DISCUSSION OF RESULTS
Overall Observation •••••
63 66 67
73 Estimation of Pavement Fatigue Life After Overlay. 75
Concept of Fatigue • • • • • • • • • • • • • • • • •• 75 Concepts of Damage and Remaining Life • • • • 76 Application ot the Concepts to the Determination of Added
Fatigue Life.. ••••••• • • 77 Warrants of Bonded Concrete Overlay • • • • • • • • • • • •• 82
CHAPTER 7. G~NERAL CONCLUSIONS AND RECOMMENDATIONS
Conclusions •• Recornmendat ions •
85 87
REFERENCES • • • • • • • • • • • • • • • • • • • • • • • • • • • • •• 91
APPENDICES
Appenaix A. Specl.dl Specification - Experilnental Thin Bonded Concrete Overlay, Loop 610, Houston
Appenaix B. Dynatlect Deflection Data Andlysis •
xiv
97
103
CHAPTER 1. INTRODUCTION
This report is concerned with the use of a thin layer (2 to 4 inches) of
Portland cement concrete (PCC) to rehabilitate an existing concrete pavement.
This chapter presents background information, the objectives,
organization and scope of the report.
BACKGROUND
and the
In recent years, the highway industry 1.n the United States has shifted
its attention from construction of new pavements to maintenance, repair, and
rehabilitation of the existing infrastructllre. This shift has occurred
primarily due to two factors:
(1) TIle Interstate Highway program is nearing completion. The basic
highway network is now 1.n place, and fllture activities will be
directed towards preserving this initial investment of public funds
through resurfacing, restoring, rehabilitating, or recolHtructing
these highways.
(2) Most of the pavements now 1.n service were built with a theoretical
twenty year design life. They are reaching the end of this peC'iod,
and rehabilitation of these pavements is needed.
In addition to these factors, there are financial, environmental, and
ecological fac tors contributing to th e tC' end towa r.:t maintenanc e anel repair
(Ref 6). In Houston, the highway and street network comprises many miles of
continuously reinforced concrete pavements (CRCP). Overall, these pavements
are in good structural condition. However, pavement condition and evaluation
surveys indicate the need for rehabilitation 1.n the near future.
This report 1.S the second in a series of reports on a study of thin
bonded concrete overlay (BCO) pavements conducted under a cooperative highw~y
research program between the Center for Transportation Research, The
RR357-2F/Ol 1
2
University of Texas at Austin, the Texas State Department of Highways and
Public Transportation, and the Federal Highway Administration. The report
specifically covers an experimental highway rehabilitation project
constructed on South Loop 610, a busy freeway in Houston. The South Loop 610
experiment ·Was constructed in July and August 1983 and is performing
excellently as of the latest pavement evaluation survey, in November 1985.
The rehabilitation of concrete pavements with BeQ is desirable because
of thermal and structural compatibi lity between the over lay material and the
over laid pavement.
the rehabil itat ion
Although concrete has been used for over thirty years for
of cone rete pavements (Ref 11), thin-bonded concrete
overlay pavement is only now emerging as a viable rclla~ilitation alternative.
This is primarily due to the availability of high production milling machines
and pavers and the introduc tion of new, energy effic ient highway construe tion
materials, mainly concrete admixtures (synthetic and natural fibers, super
plasticizers). Theoretical studies have shown that a BeQ will substantially
increase the structural capacity of an existing concrete pavement and,
therefore, could buy additional fatigue life for the structure. The Loop 610
experiment provides a good opportunity to test the theory under high traffic
loadings.
Successfu 1 use of BeQ would permit optimum use of resources availab Le
for rehabi litation of the pavement network and allow the rehabi litation of
many more miles of pavement in the system.
OBJECTIVES
The objectives of this report are the following:
(1) Describe the design, construction and pavement monitoring program
for the South Loop 610 project in Houston.
(2) Report on the initial pavement performance as determined by
periodic evaluation surveys.
(3) Interpret the data coLLected during two years of observation.
RR357-2F/01

3
ORGANIZATION AND SCOPE OF THE REPORT
Chapter 2 highlights the design and construction of the South Loop 610
experiment in Houston. Concepts and design considerations that led to the
construction of a 1,000 foot stretch of BCO are reviewed and discussed.
Chapter 3 presents field measurements, including Dynaflect deflections,
concrete movement measurement, collection of concrete cores to test in the
laboratory, and concrete quality control data during construction.
Chapter '+ is concerned wit';} performanc e data from periodic pavement
evaluation s~rveys.
Chapter') attempts to estimate the total cost of the project from the
viewpoints of the users and the Houston Urban Office.
Chapter 6 discusses the results of the experiment and underscores its
achievements and weaknesses overall.
Finally, concluding remarks and recommendations derived from the study
are presented in Chapter 7.
It should be noted that this report does not seek to be exhaustive or
authoritative on the subject of rehabilitating concrete pavements with
BCOs; the approach is rather selective and inferential in that immediate and
related answers could not be found but could be calculated or derived from
the wealth of data available to the authors. Again, the South Loop 610
experiment constitutes the centerpiece of the report, and the primary concern
is for highway pavements; nonetheless the methodology and techniques ased
could equally well apply to airport pavements. Laboratory investigations
were summarized in Ref 5 and more theoretical considerations will be
presented in a subsequent report, which will
design of BCOs and related 1.Ssues.
RR357-2F/01
also address the mechanistic


CHAPTER 2. BACKGlliJUND ON EXP~KD1ENTAL TEST S~CTIONS
This chapter introduces the field experiment in Houston, which uses
various types of thin-bonded concrete overlay pavements.
construction of the test sections are discussed.
DESIGN CONSIDERATIONS
The des ign and
The South Loop 610 experiment was designed uSl.ng the principles of
statistics. Main factvrs which were thought to have a significant effect on
the performance of BeOs were first identifiea. These were (1) type of
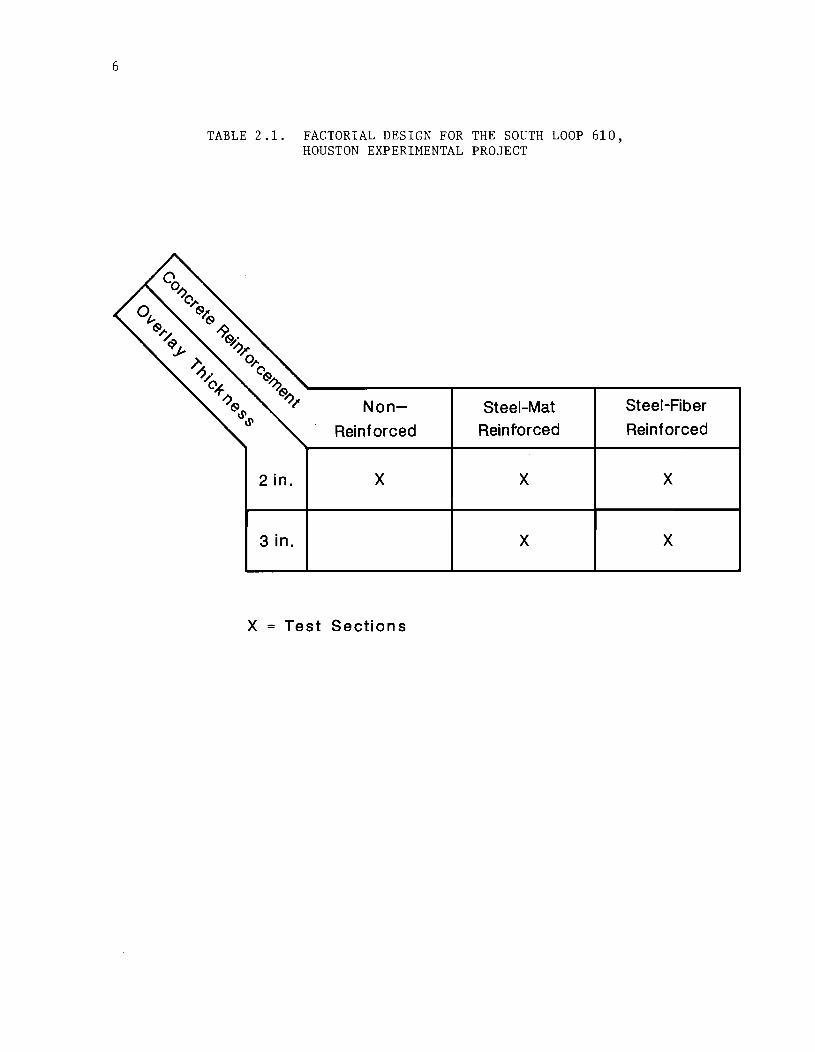
concrete reinforcement and (2) overlay thickness (see Table 2.1).
The following design sections were actually built in the field.
(1 ) Two-inch thick plain concrete over lay.
(2 ) Two-inch thick steeL reinforced (we lded wire fabric) concrete
over lay.
(3) Three-inch tllick steel reinforced (we lded wire fabric) concrete
over lay.
(4) Three-inch thick steel fiber-reinforced (Bekaert's Dramix Z1:' 50/5U)
concrete overlay.
(5) Two-inch thick steel fiber-reinforced (Bekaert's Dramix ZP 50/50)
concrete overlay.
Note that the factorial experi,aent <1esi6 n did not incluae a 3-inch-thick
plain concrete section and is, therefore, only a partial factorial.
It was desired to assess the eff~cts of the main factors and their
interactions, if any. At the same time, an effort was made to factor out
possible confounding of undesirable secondary effects. Two such effects that
were factored out are traffic level and temperature differential for the
over lay and the origina 1 pavements attr ibutab le to coarse aggregate types.
To overcome traffic effect, the project location was selected so that no
RJ{35 7- 2F /02 5
6
TABLE 2.1. FACTORIAL DESIGN FOR THE SOUTH LOOP 610, HOUSTON EXPERIMENTAL PROJECT
2 in.
3 in.
Non
Reinforced
x
X Test Sections
Steel-Mat
Reinforced
x
x
Steel-Fiber
Reinforced
x
x
7
entry nor exit ramp eKisted for the entire length of the project (1,000
feet). Therefore, if we assume that only a few lane changes occur on the
1,000 foot section and that weaving ~s also at a minimum, we can accept that
;} given design section receives the same number of load applications as the
section next to it within a given lane. The analysis of performance data
therefore can be conducted as a two-way design where lane ~s the blocking
variable. We shall return to this in a subsequent chapter. As can be seen,
the phydical layout is here coupled with an intended purpose, that of
assessing the main etfects of significant factors. To avoid the temperature
diff'~rential effect, not only was the same type of coarse aggregate specified
but also the same source, ~.e., the ColoradO River; the gravel was a
quar tz ite.
Since the type of coarse aggregate has a significant effect on concrete
strength and coefficient of thermal expansion, it atfects temperature induced
,uovement and thus CRCP-BCO system performance. When the same source of
coarse aggregate is used, only the inherent variability within the borrows
r<::mains. Since this is conceivably of the same order of magnitUde as existe<1
when the original CRCP was constructed, the chances of differential movement
b<::tween the original and overlay pavements are considerably reduced after a
good bond has been ach ieved; there fore poss ib le debond ing due to in ter face
shear failur~ is reduced.
Finally, a noteworthy feature of the experimental design was simplicity.
It was thought that any concrete paving coatractor with reasonable experience
could handle this project without specialized equipment, and the materials
selected would be readily available.
PROJECT INFOlli1ATlON
The Loop 610 experiment consisted of overlaying a 1,000 foot section of
IH-61O, a major urban freeway which encircles downtown Houston. The site
s,~lected for the experiment is on South Loop 610 between Cullen Boulevard and
Calais Street, approximately 3.5 miles east of the AstroWorldjWaterWorld
RR35 7- 2F j 02
8
amusement park complex. At this location, the roadway is an 8-lane divided
highway with four through lanes in each direction, and a concrete median
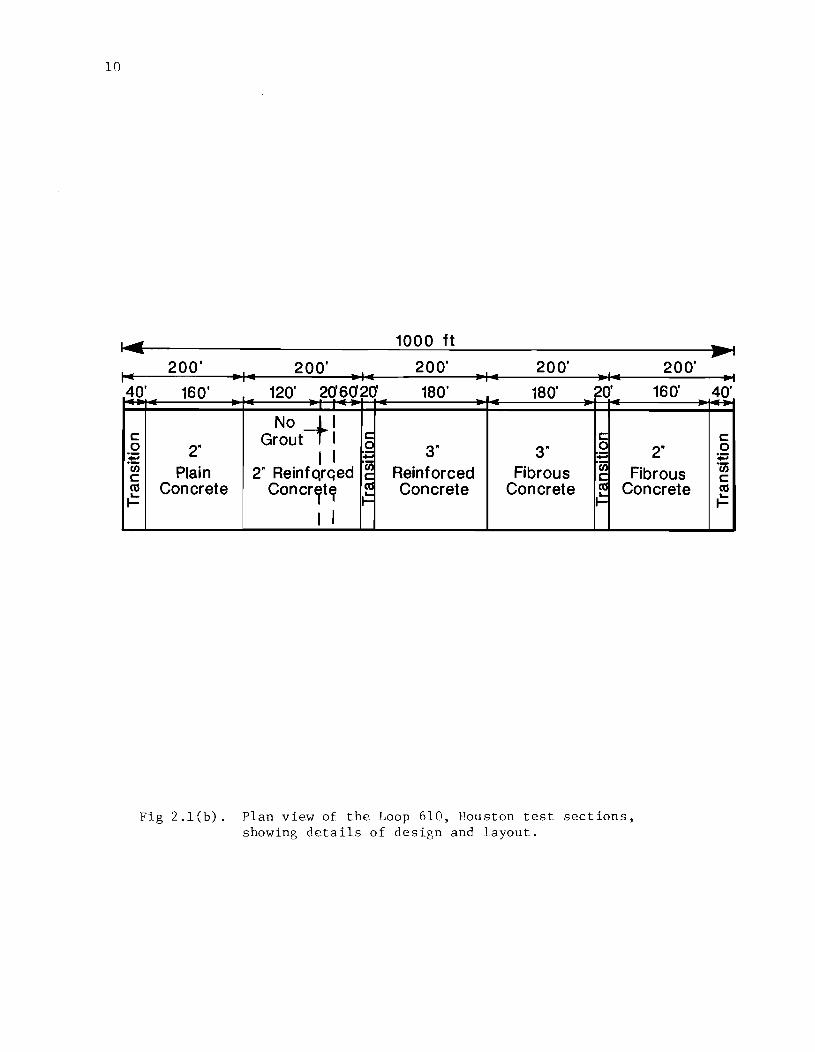
barrier. Main lane widths are 12 feet and shoulders are 10 feet wide
(Fig 2.2). Only the four eastbound lanes were overlaid ~n this experiment.
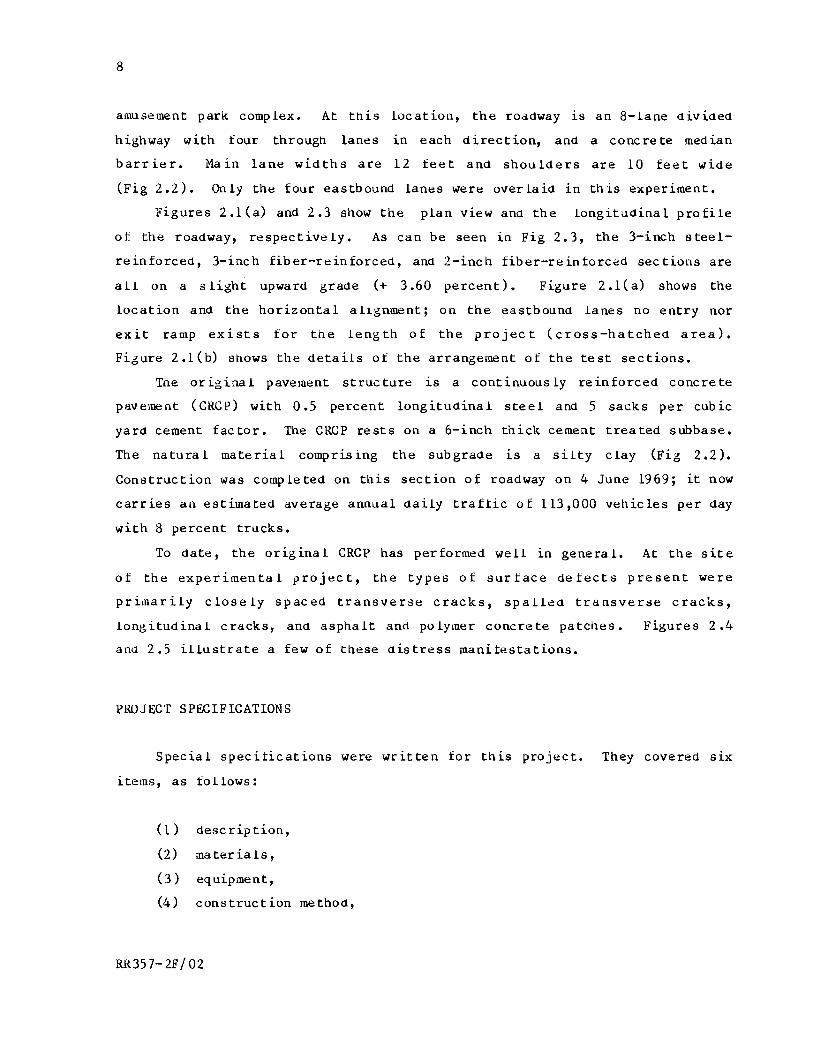
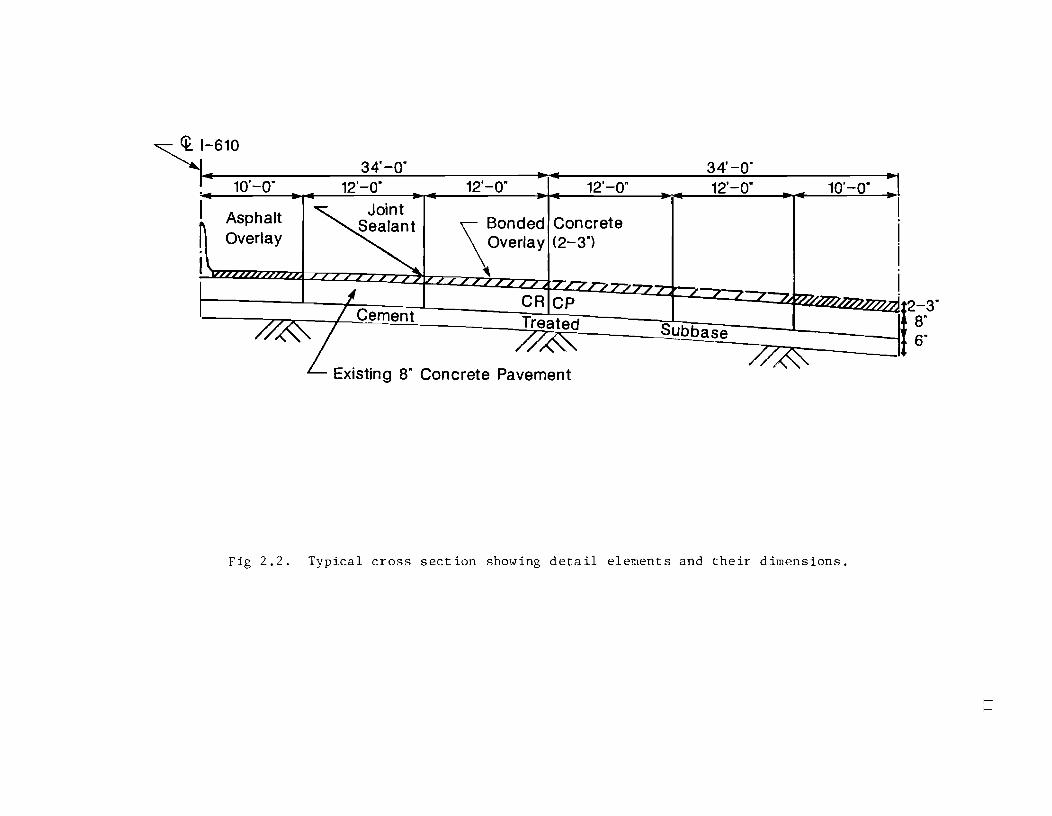
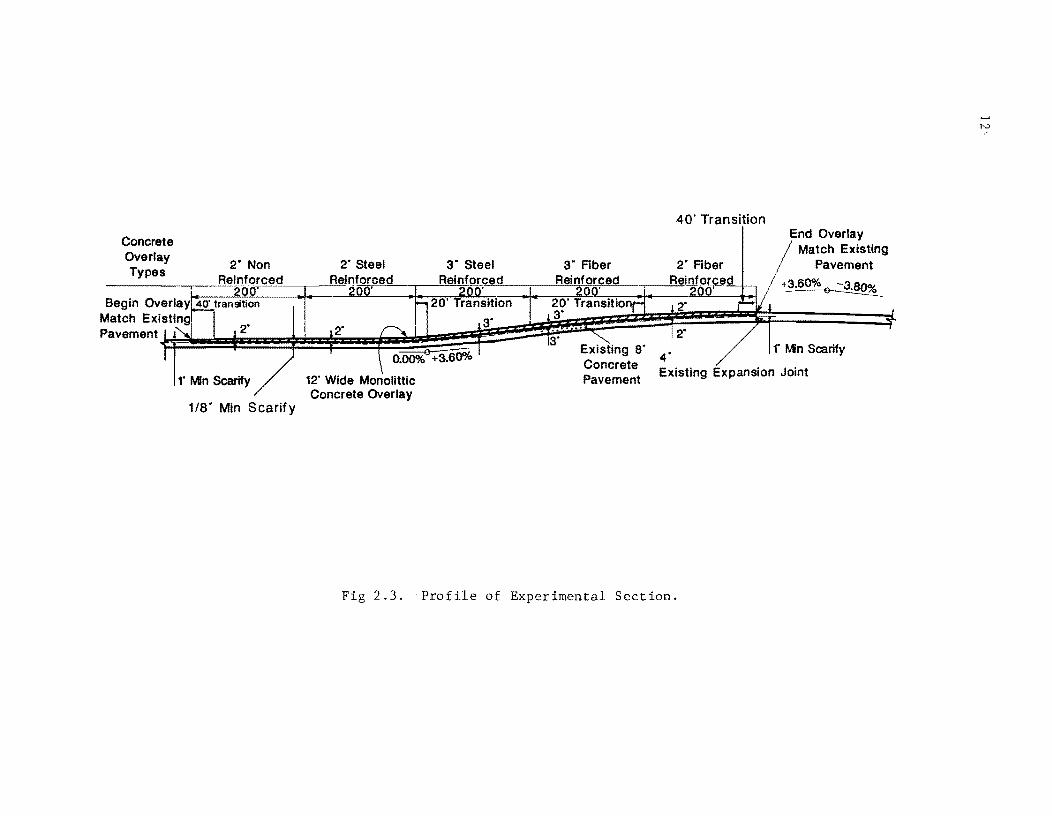
Figures 2.1(a) and 2.3 show the plan view ana the longitudinal profile
of the roadway, respectively. As can be seen in Fig 2.3, the 3-inch steel-
reinforced, 3-inch fiber-reinforced, and 2-inch fiber-reinforced sections are
all on a slight upward grade (+ 3.60 percent). Figure 2.1 (a) shows the
location and the horizontal alignment; on the eastbound lanes no entry nor
exit ramp exists for the length of the project (cross-hatched area).
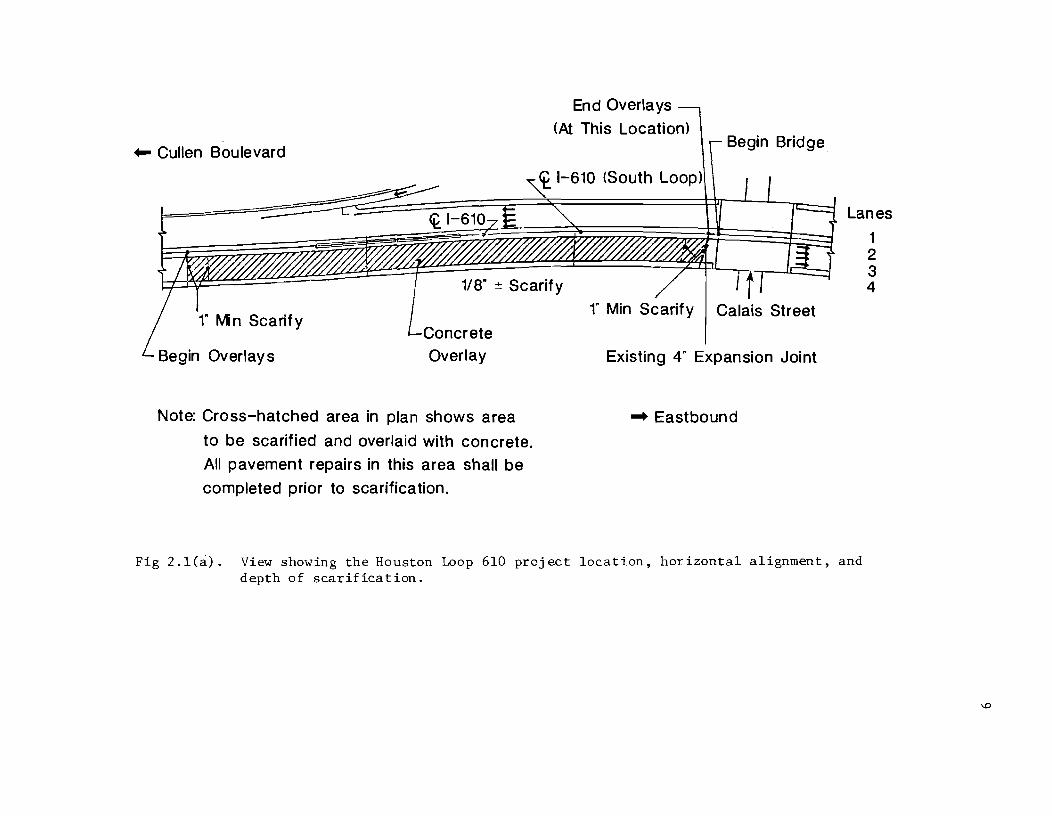
Figure 2.1(b) shows the details of the arrangement of the test sections.
The original pavement structure is a continuously reinforced concrete
pavement (CRCP) with 0.5 percent longitUdinal steel and 5 sacks per cubic
yard cement factor. The CRCP rests on a 6-inch thick cement treated subbase.
The natural material comprising the subgrade ~s a silty Clay (Fig 2.2).
Construction was completed on this section of roadway on 4 June 1969; it now
carries an estimated average annual daily traftic of 113,000 vehicles per day
with 8 percent trucks.
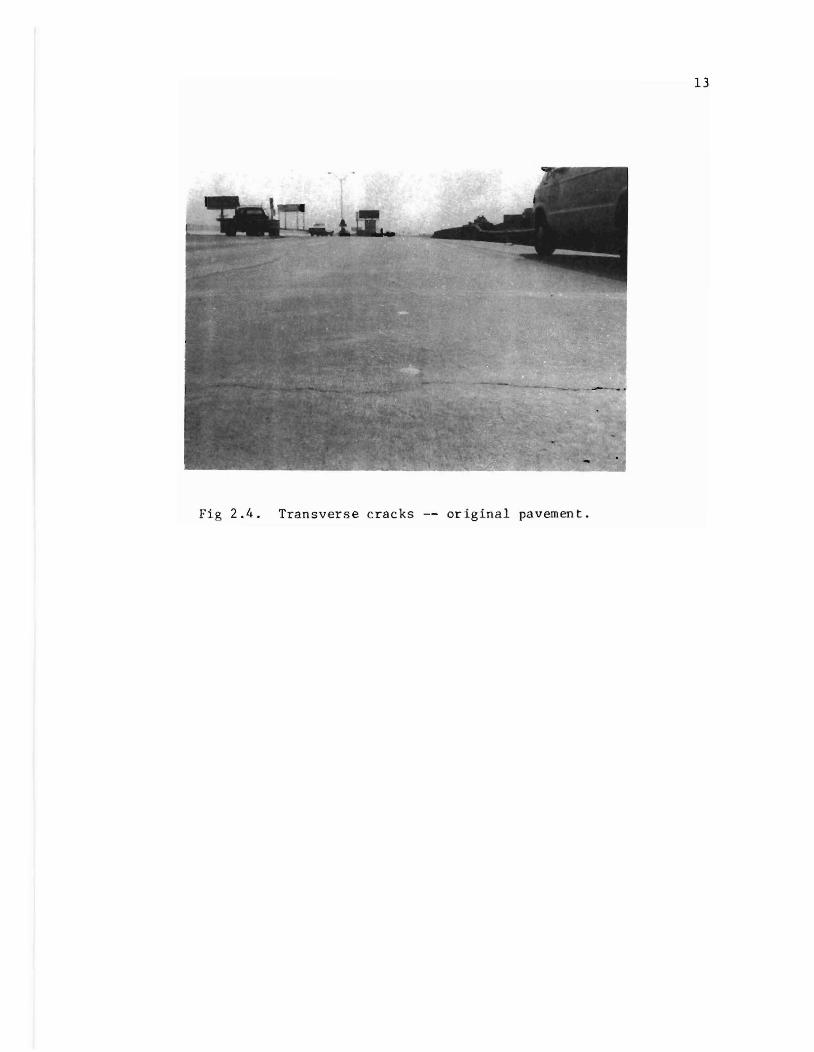
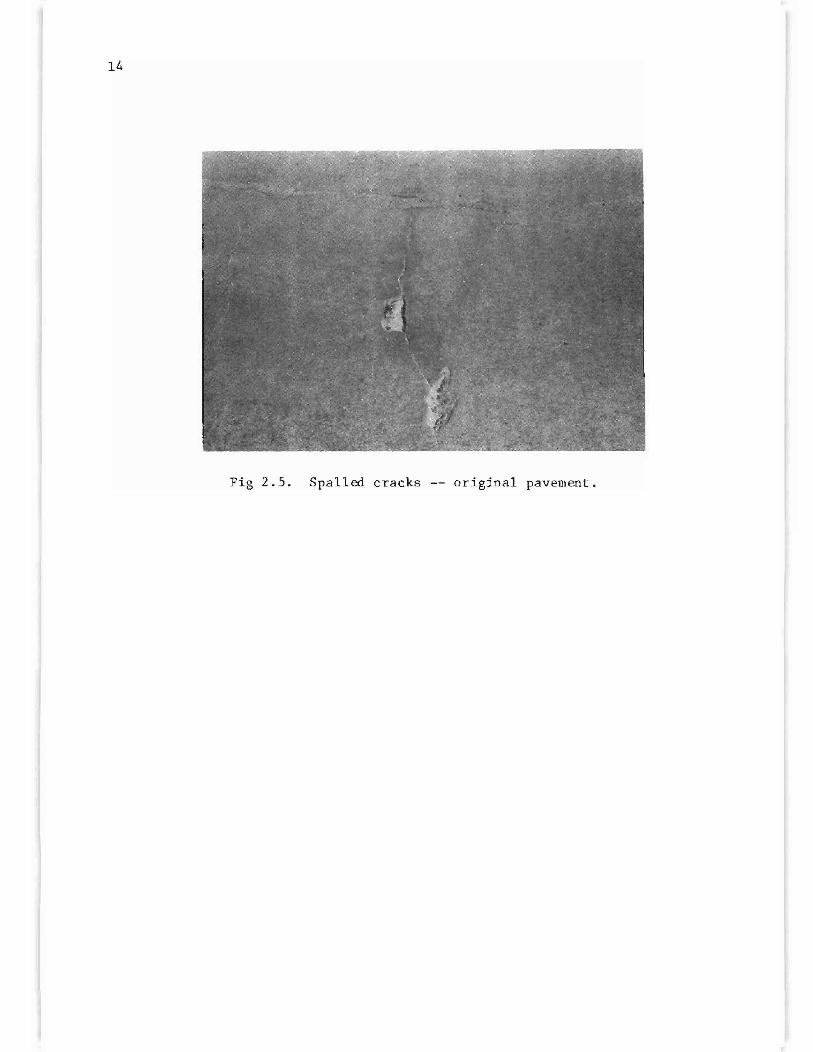
To date, the original CRCP has performed well in general. At the site
of the experimental project, the types of surtace detects present were
primarily closely spaced transverse cracks, spalled transverse cracks,
longitudinal cracks, and asphalt and polymer concrete patches.
ana 2.5 illustrate a few of these distress manitestations.
PROJECT SPECIFICATIONS
Figures 2.4
Special specitications were written for this project. They covered six
items, as tollows:
(1) description,
(2) materia ls,
(3) equipment,
(4) construction methOd,
RR35 7- 2F /02
... Cullen Boulevard
1" Min Scarify Concrete Overlay
Note: Cross-hatched area in plan shows area
to be scarified and overlaid with concrete.
All pavement repairs in this area shall be
completed prior to scarification.
End Overlays
(At This Location) Begin Bridge
It 1" Min Scarify I Calais Street
Existing 4" Expansion Joint
.... Eastbound
Lanes
1 2 3 4
Fig 2.l(a). View showing the Houston Loop 610 project location, horizontal alignment, and depth of scarification.
I.D
10
I.e 1000 ft
200' 200' 200' 200' 200'
40' 160' 120' 206020 180' 180' ~O· 160'
No -tl c: Grout I ~~ .2 0 2" I I 3" 3" 2" :E ~ -rn Plain 2" ReinfqrGed Reinforced Fibrous
.~ Fibrous c: ~ co Concrete ConcrErt~ I.~ Concrete Concrete Concrete ... .= ~ I ....
I I
Fig 2.l(b). Plan view of the Loop 610, Houston test sections, showing details of design and layout.
40'
c: 0 ~ ·CiS c: co ... ~
~ 1-610
10'-0" 12'-0" 12'-0" 12'-0" 12'-0" 10'-0"
Asphalt ~onded Concrete
Overlay Overlay (2-3")
Treated Subbase //& -- /72\. Existing 8" Concrete Pavement
Fig 2.2. Typical cross section showing detail elements and their dimensions.
12-3"
8" 6"
r-' r-'
Concrete Overlay Types
2· Non 2· Steel 3· Steel ~=,,--~_-,-,R=einforced .. _ .... ~ - 200' ~ ... -
Pavement , 2-
r Mn Scarify /
1/8- Min Scarify
12' Wide Monolittic Concrete Overlay
40' Transition
2' Fiber
End Overlay Match Existing
Pavement
+~~
f Mn Scarify
Existing Expansion Joint
Fig 2.3. Profile of Experimental Section.
....... N
13
Fig 2.4. Transver s e cracks -- or i ginal pavement.
14
Fig 2.5. Spa11ed cracks -- original pavement.
(5) measurement, and
(6) payment.
The special specifications are incluaed ~n Appendix A.
15
Note that the
concrete m~x designs under Item 2 were different for fiber and no-fiber
(i.e., plain concrete and steel reinforced concrete) sections. The fiber
sections were designed with a higher cement factor (8 sacks versus 7 sacks
per cubic yard) and a higher water factor (5 gallons versus 4.5 gallons per
sack 0 f cemen t).
The specitications on the BCO project were to be in accordance with the
details shown on the plans; from these, the wire fabric sizes for the steel
r~inforced sections were specifi~d as follows:
(1) 3-inch over lay 6 x 12 -- D12 x D4.2
(2) 2-inch overlay 6 x 12 - D8 x D4
(3) permitted end lap -- 12-inch minimum, and
(4 ) permitted edge lap - 6-inch minimum.
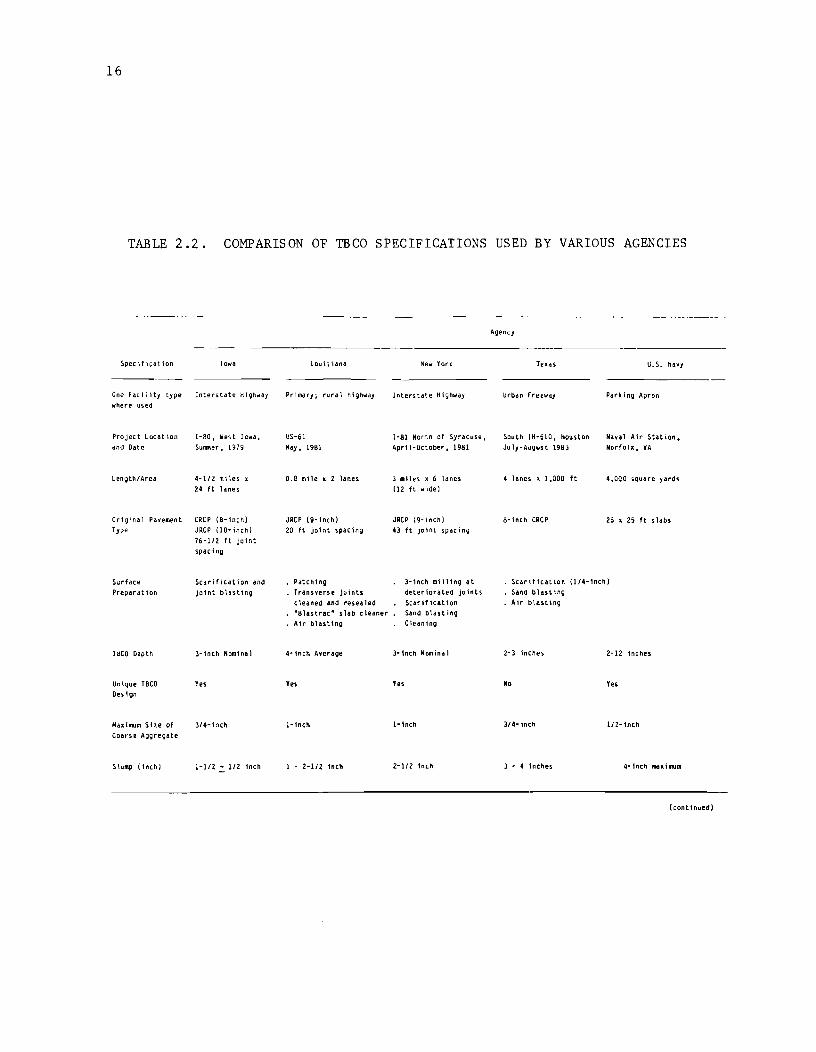
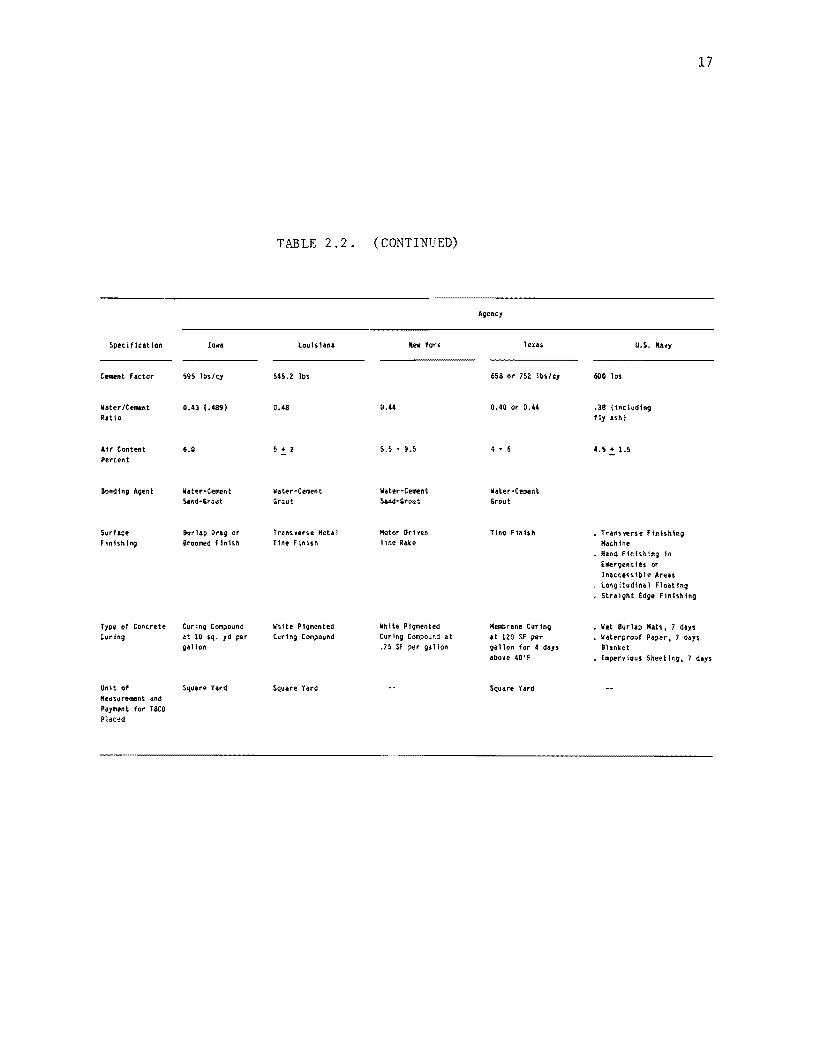
Finally, Table 2.2 3fiords a comparison uf the special specifications
tor the Loop 610 project with those for various BCO projects constructed in
recent years.
MEASUREMENTS PROGRA~
Measurement of several variables was considered on this experimental
project. They can be thought of as response variables, CRCP-BCO system
output variables, or performance variables.
A modified Nikon camera was mounted on a horizontal pole attached to a
truck foe photo logging. Photologging allowed a pictorial record of pavement
surface conditions before and after overlay construction.
The Dynaflect .lS widely used for measuring pavement surface
def lec t ions. In pavement engineering pra-::tice, surface deflections are used
for many purposes (e. g., characterization of materials, detection of voids
RR357-2F/02
16
TABLE 2.2. COMPARISON OF TBCO SPECIFICATIONS USED BY VARIOUS AGENCIES
Speciflcdt.ion Iowa
One Facility type Interstate Hi~h_ay
where used
Project Locat ion dnd Date
lenQth/Area
Or191n.]1 Pavement
Tn'
Surface
Preparat ion
T~CO Depth
Untque TeCO
Des 1 gn
Maximum Size of Coarse A;Jgregate
Slump ( Inch)
I·ao, West Iowa, Sumner, 1979
4-11l mi les x.
24 ft lanes
CRCP (B- inch)
JRCP (lO-inch)
76-112 ft joint
spaCing
Scarification and joint blasting
3-inch Nominal
Yes
3/4-inch
1-112 ~ 112 inch
loul:iiana
Primary; rural hi9hwdy
US-61
May, 19B1
0.8 mile x 2 lanes
JRCP (9- inch)
20 ft joint spaCing
Patching Transverse ju1nts
cleaned and resealed -Slutrac· slab cleaner Air blasting
4- inch Average
y"
I-inch
1 - 2-112 inch
New York
Interstate H'~hllllay
1-81 Mortn of Syracuse I
April-October. 1981
3 lit les x 6 lanes (12 It wid.)
JRCP (9-inch)
43 ft joint spacing
3-inch mi 11 ing at deteriorated joints Scarification Sand b\ast ing Cleaning
3-1nch Nominal
Ye.
1-lnch
2-lIZ lnch
Agency
Urbdn Freeway
South IH-610. Houston Ju ly- A_Qu. t 19B J
4 lanes , 1,000 ft
8- inch CRCP
U.S. Navy
Park ing Apron
Naval Air Station. Norfoh. VA
4.000 square yards
25 x 25 ft slabs
Scarification {1/4-1nch} Sand blasting Air b1asting
2-3 inches 2-12 inches
NO Yes
l/4-inch 11l-lnch
3 • 4 inches 4- tnch max imum
(contInued)
Specifl.:at jon
C .... nt factor
W.t.rlC .... t R.tio
Atr Content Percent
Bonding Agent
Surface Finhhing
Typ. of Concrete turing
Unit of "easureaent ind Payment for TatO Placed
low.
595 lbs/c]
0.43 1.489)
6.0
W.ter·C ..... t ~a.d·Grout
'urlap Drag or Broomed finish
Curing Compound at 10 sq. yd per gallon
Square Yord
TABLE 2.2.
Loui$1ana
545.Z lbs
0.48
5 • Z
water-Cement Graut
Trans yerse M.eta 1 Tine finish
WhIte Plgment.d Curing Com,ound
Squ.re Yard
( CONTINUED)
New York
0.44
5.5 • 9.5
Water'CeNnt Sand'Grout
Motor Dr hen nn. Rak.
White Pigmented Curing Compound at .75 SF p.r gallon
Ag •• cy
Tex.as
658 or 752 lbs/.:y
0.40 or 0.44
4 • 6
Water-Cement Grout
Tine Finish
Membrane- Cur1ng at IZO SF per gallon for 4 d.ys above 40'F
Square Yard
U.S. Navy
600 lbs
.38 (Including fly ash)
4.5.!. 1.5
Tr ........ F IntsMng Maohine Hand Finishing \n Emerge.Cies or Inaccessible Areas longitudi.al Floating Straight Edge finishing
17
Wet 8urlap Mats. 7 days W.terproof P.p.r. 7 d.ys Blanket Imp.rvious Sheeting. 7 days
18
underneath slabs, evaluation of load carrying capacity of pavement
structures). In this case, the latter application was sought. Specifically,
it was desired to know how surface deflections were affected by the various
thin-bonded concrete overlay designs.
The General Motors Research (GMR) digital profilometer was used to
record road profiles before and after overlay construction. By using
roughness data, the profilometer permits the engineer to estimate
serviceability index, a user-oriented performance measure of the roadway.
Visual condition surveys were conducted before and after overlay
construction. The detailed method used ~n this case is called the "small
sections" method. A crew walked the pavement and recorded any visible
distress manifestations. Cracks were mapped and spalls were counted and
classitied as minor or severe. A condition survey ~s the single most
important item of the pavement monitoring activities and will usually dictate
the course of action (routine maintenance or major repair) to be taken.
Concrete movement across cracks and, therefore, crack width is a major
factor contributing to the performance of CRCP. A mechanical strain gauge
was used ~n this project to monitor concrete movement after overlay
placement. To this end, metallic boxes with removable metal tops were
inserted at quarter points within each of the five design sections; gauge
plugs were placed ~n the boxes on the origina 1 CRCP and above the boxes
across the same cracks on the BCOs. Prior to the over laying, crack widths
were read with a graduated microscope. The data appear in Table 2.3.
During construction, field tests were performed. They included concrete
and air temperatures, concrete air value, slump test, and for the flexural
strength test on beams.
After construction, 4-inch field cores were taken for laboratory
testing. The tests were CRCP-BCO intertace shear strength, using a modified
shear collar, and splitting tensile strength.
RR357-2F/02
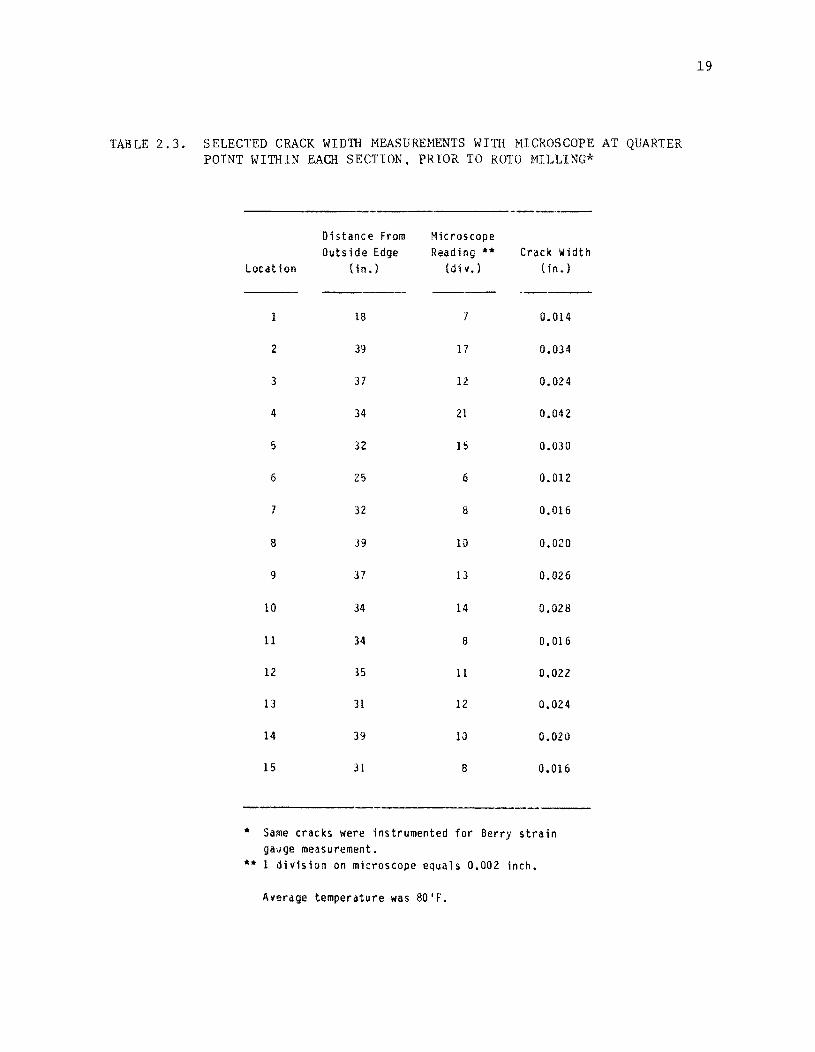
TABLE 2.3. SELECTED CRACK WIDTH MEASUREMENTS WITH MICROSCOPE AT QUARTER POINT WITHIN EACH SECTION, PRIOR TO ROTO MILLING*
---_._--Distance From Microscope Outside Edge Reading ** Crack Width
Locdtion (i n.) (d i v. ) (in.)
._---1 18 7 0.014
2 39 17 0.034
3 37 12 0.024
4 34 21 0.042
5 32 15 0.030
6 25 6 0.012
7 32 8 0.016
8 39 10 0.020
9 37 13 0.026
10 34 14 0.028
11 34 8 0.016
12 35 11 0.022
13 31 12 0.024
14 39 III 0.020
15 31 8 0.016
* Same cracks were instrumented for Berry strain gauge measurement.
** 1 division on microscope equals 0.002 inch.
Averdge temperdture was 80'F.
19
20
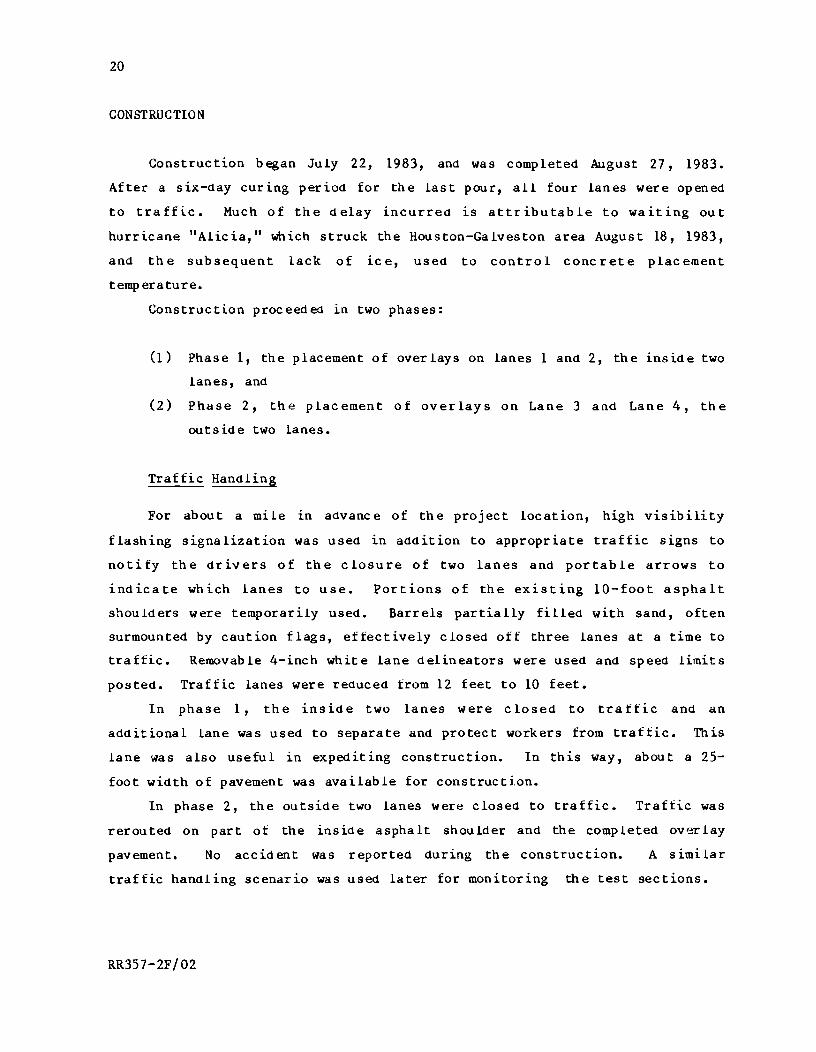
CONSTRUCTION
Construction began July 22, 1983, and was completed August 27, 1983.
After a six-day curing period for the last pour, all four lanes were opened
to traffic. Much of the delay incurrea is attributable to waiting out
hurricane "Alicia," which struck the Houston-Galveston area August 18, 1983,
and the subsequent Lack of ice, used to control concrete placement
temperature.
Construction proceeded in two phases:
(1) Phase 1, the placement of overlays on lanes 1 and 2, the inside two
lanes, and
(2) Phase 2, the placement of overlays on Lane 3 and Lane 4, the
outside two lanes.
Traffic Handling
For about a mile ln advance of the project location, high visibility
flashing signalization was used in addition to appropriate traffic signs to
notify the drivers of the closure of two lanes and portable arrows to
indicate which lanes to use. Portions of the existing 10-foot asphalt
shou ld ers were temporarily used. Barrels partia lly fi lied with sand, often
surmounted by caution flags, effectively closed off three lanes at a time to
traffic.
posted.
In
Removable 4-inch white lane delineators were used and speed limits
Traffic lanes were reduced from 12 feet to 10 feet.
phase 1, the inside two lanes were closed to traffic and an
additional lane was used to separate and protect workers from traffic. This
lane was also useful in expediting construction. In this way, about a 25-
foot width of pavement was available for construction.
In phase 2, the outside two lanes were closed to traffic. Traffic was
rerouted on part of the inside asphalt shoulder and the compLeted overlay
pavement. No accident was reported during the construction. A similar
traffic handling scenario was used later for monitoring the test sections.
RR357-2F/02
21
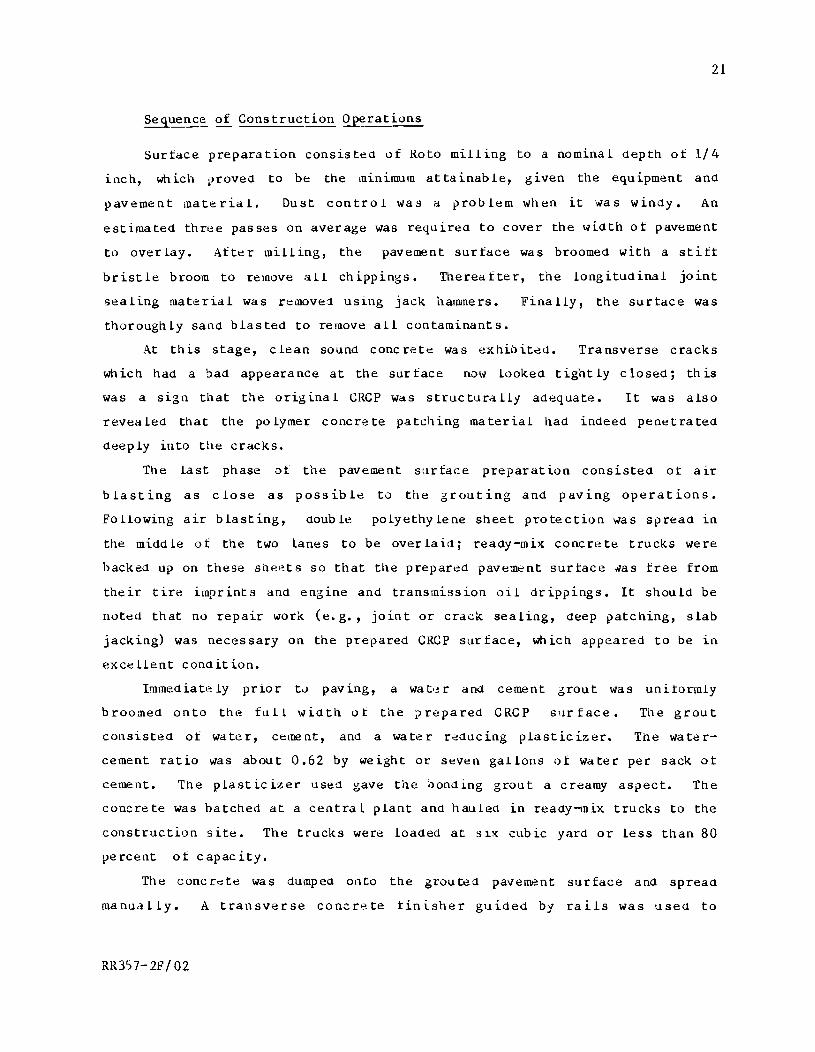
Sequence of Construction Operations
Surface preparation consisted of Rota milling to a nominal depth of 1/4
inch, which proved to be
pavement material. Dust
the minimum attainable, given the equipment and
control was a problem when it was windy. An
estimated three passes on average was required to cover the width of pavement
to overlay. After milling, the pavement surface was broomed with a stiff
bristle broom to remove all chippings. Thereafter, the longitUdinal joint
sealing material was removed using jaCk hammers. Finally, the surtace was
thoroughly sand blasted to remove all contaminants.
At this stage, c lean sound cone rete was exhib itea. Transverse cracks
wh ich had a bad appearance at the sur face no\~ looked tightly closed; this
was a sign that the original CRCP was structurally adequate. It was also
revea led that the po lymer concre te pa teh ing rna ter ial had indeed pene t ra ted
deeply into the cracks.
The last phase of the pavement surface preparation consisted of air
blasting as close as possible to the grouting and paving operations.
Following a~r blasting, double polyethylene sheet protection was spread in
the midd le of the two lanes to be over laid j ready-mix concre te trucks were
hacked up on these sheets so that tlle prepared pavement surface ;Jas free from
their tire imprints and engine and transmission oil drippings. It should be
noted that no repair work (e.g., joint or crack sealing, deep patching, slab
jacking) was necessary on the prepared CRCP surface, which appeared to be in
exce Uent cond it ion.
Immediate ly prior tv paving, a wat,~r and cement grout was unitormly
broomed onto the full width ot the ?repared CRCP S11r face. The grout
COllsisted of water, cement, and a water reducing plasticizer. The water
cement ratio was about 0.62 by weight or seven gallons of water per sack of
cement. The plast ic izer used gave the bond ing grou t a creamy aspect. The
concre te was hatched at a centra 1 plant and hauled in ready-mix trucks to the
construction site. The trucks were loaded at ~:nl{ cubic yard or less than 80
percent of capacity.
The cone rete was dumped Ol1to
manually. A transverse concrete
RR35 7- 2£ /02
the grou ted pavement surface and spread
finisher guided bJ rails was used to
22
conso lidate and fin is h the concrete to grade. The inspector took frequent
readings to insure that the nominal specified thicknesses were obtained.
Surface texturing consisted of transverse metal tine finish (i.e., wire
combing), and was accomplished by hand from a working bridge.
Following surface texturing, a white pigmented impervious curing
component was spread uni formly onto the over lay sur face from a second working
briuge.
Within 24 hours of a pour, the pavement edge and centerline longitudinal
joints were saw cut. The centerline longitudinal joints were cut to a
nominal one inch depth and sealed with a hot-poured asphaltic material.
In phases one and two of the construction, the last pour was allowed to
cure for a minimum of six diiYS before the lanes were opened to traffic.
RR357-2F/02
CliAPTER 3. FIELD M.l!:ASUREMENTS
This chapter presents fiela aata collectea as part of the Loop 610
experiment; various analyses of the data are conducted 1n an effort to
ctscertain the responses of interest. Specifi..:::ally, Dyna£lect aeflection
a,it<l, c<)ncrete'a')v~ment aata, dlld qlv:tlity control/quality 3,;-jAllr!:tnce data are
':'.lliatea and interpretel1. T'lis constitutes the basic purpose of the
expe~imentaL ?roject.
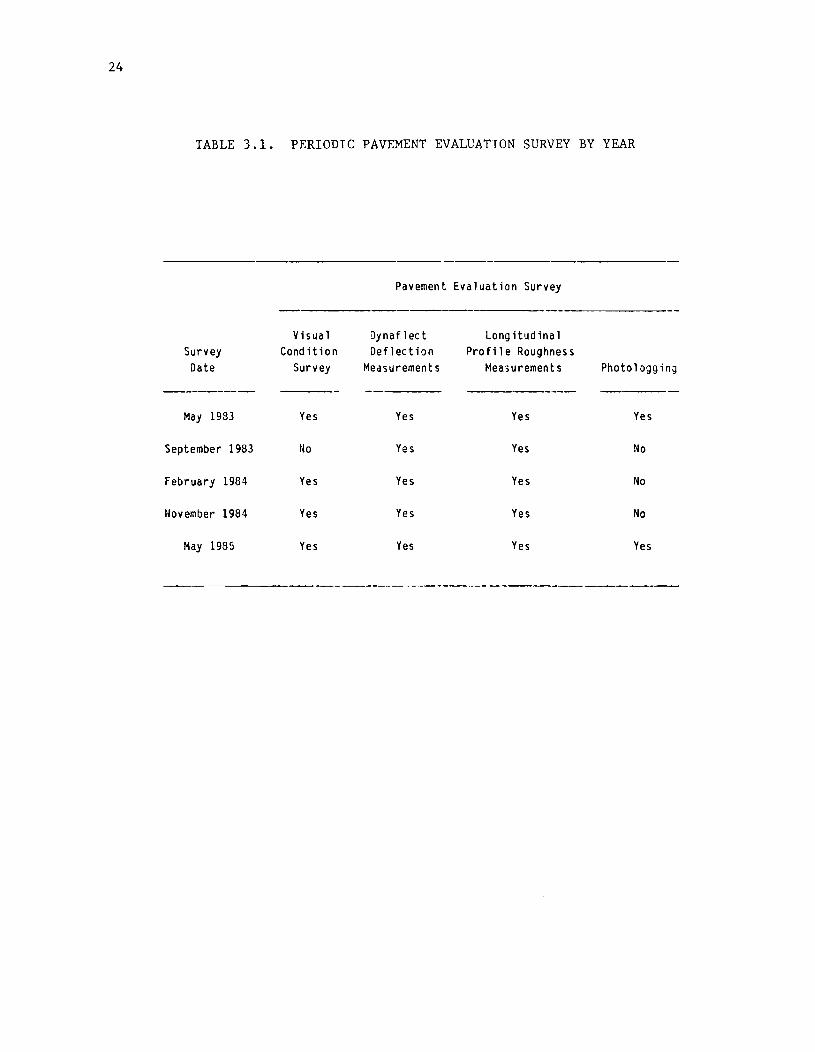
During the cours~ of the stuay, five perioaic pavement evaluation
surveys were conduc teet by Center for Transpor tat ion Research personnel as
foUows:
(1) M.ay 11, 1983: Before overlay.
(2) September 8, 1983: First SilrVey immeaiately aEter overlay.
0) February 15-16, 1984: Second survey after overlay.
(4) November 7-8, 1984: Third $llrvey after overlay.
(5) May 7-8, 1985: Faurth and fin~l survey after overlay.
Notf! tlliit overlay c<..l'l'ltr.llction was completed August 'l7, 1983. The various
actitTtties conductel1 were as shown ill TilhLe 3.1 over a. t",o year period before
and atter overlay cORstruction.
PAVEMENT DEFLeCTION
Tne Lane-Wells Dyna£lect aevice was usea throllghout this study to
measure pavement aet Lections. Dynaflect defle,~tions were taken during all
fiVe pavement evaluation surveys.
t Points Location
The Dynaflect test points were located with reference to the expansion
j.)Lnt at the approach slab of the Calais Street overpass bridge; as can be
RIl357-2F/03 23
24
TABLE 3.1. PERIODIC PAVEMENT EVALUATION SURVEY BY YEAR
Pavement Evaluation Survey
Visual Dynaflect Long itud ina 1 Survey Cond ition Deflection Profile Roughness Date Survey Measurements Measurements Photologging
------- --------May 1983 Yes Yes Yes Yes
September 1983 No Yes Yes No
February 1984 Yes Yes Yes No
November 1984 Yes Yes Yes No
May 1985 Yes Yes Yes Yes
2S
seen 1n Fig 2.1, the Calais Street overpuss bridge is at the end of the test
sections. Nine to twelvt! points were sell:!,~ted approximately on the
ceTlterline of each lane within each design sec:tion for both the crack
r~l)!ldition (i.e., Dynaflect loading wheels close to a designated transverse
crack) and ttle midspan condition (i.e., Dynaflect loading wheels midway
between two consecutive transverse cracks). Crack and midspan points were
alternated, before and after overlay construction. Once selected, the test
POillt3 were marked with spray paint and labelled C (tor crack) or M (for
midspan). In general, the paint endured the traEfic remarkably well. Also,
a rolling tape was used befoce and after overlay to reference all test points
marked to the expansion j.>int; the mea:3tlrelnents obtained ...,ere recorded for
p"ssible future use.
The methOdology adopted calls for repeat measurements of the same test
points before and after overlay construction. Although the stated objective
was to test ten points per design section for crack condition and ten more
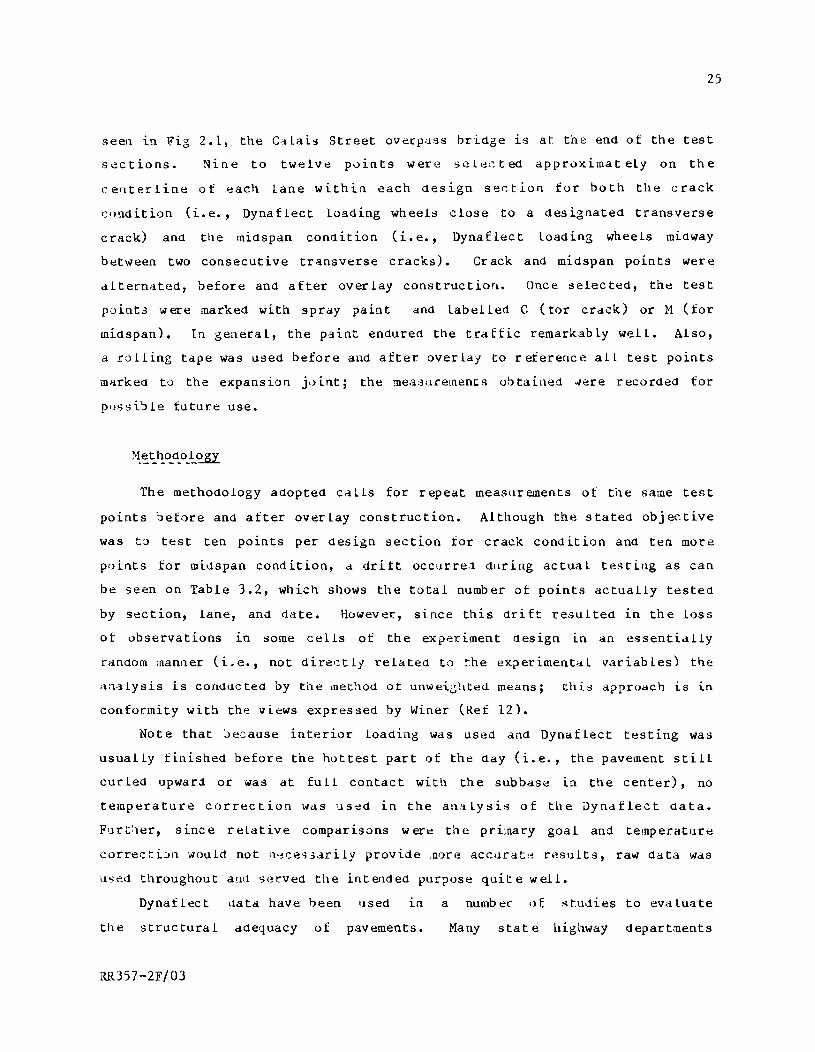
points for midspan condition, a drift occurre,l dllring actual testing as can
be seen on Table 3.2, which shows the total number of points a.ctually tested
by section, lane, and date. However., since this dri ft resulted in the loss
of observations 1.n some cells of the experiment design Ln an essentially
random manner (Le., not direr;tly related to the ex?erimentiil variables) the
arHlysis is condllcted by tile illethod of unwei;;!lted means; this approach is in
confor.mity with the views expressed by Winer (Ref 12).
Note that :)E!::ause interior loading was used and Dynaflect testing was
usually finished before the hottest part of the day (i.e., the pavement still
curled upward or was at full contact with the subbase in the center), no
temperature correction was used in the analysis of the Dynaflect data.
F'H't:ler, s inc e relative comparisons were th e primary goal and temperature
correctL.IIl would not a~ce'l3drily provide ,nore accurat'~ c,~slllts, raw data was
u'lell throughout aUll serVed the intended pur;>ose quit ewelL
Dynaflect (lata have been used 1.0 a numbel" of. ~tlldies to evaluate
the structural adequa.cy of pavements. Many stat e highway depart;nents
RR357-2F/03
26
TABLE 3.2(a). NUMBER OF DYNAFLECT DEFLECTION POINTS TESTED BY DESIGN SECTION AND DATE
Design Sections May 1985 November 1984 February 1984 September 1983 May 1983
---- ---- ----- ---2" NR 76 76 48 74 74
2" R 92 92 58 92 92
3" R 84 83 54 82 80
3" F 92 90 54 88 88
2" F 71 74 46 76 76
-----Total 415 415 260 412 410
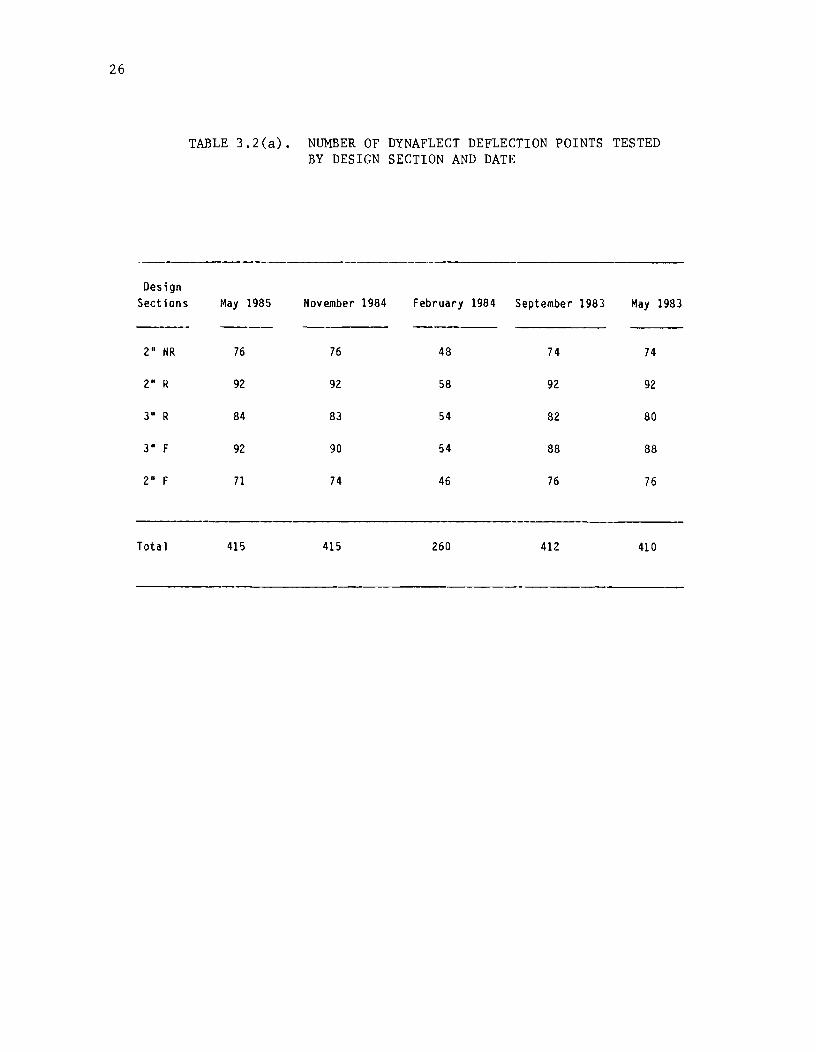
TABLE 3.2(b). NUMBER OF DYNAFLECT DEFLECTION POINTS TESTED BY LANE NUMBER AND DATE
._----------------_._.
Date
-----_._-_._--Lane* Number May 1985 November 1984 February 1984 September 1983 May 1983
---------- ------- -------- ---105 104 104 100 100
2 104 104 52 104 104
3 104 102 52 104 104
4 102 105 52 104 102
-----------------------------------
Total 415 415 260 412 410
------------.---*Note: Lanes are numbered outwardly, i.e, the innermost lane (closest to the median barrier) is labeled Lane 1 and the outermost lane (closest to the outside shoulder) is labeled Lane 4.
27
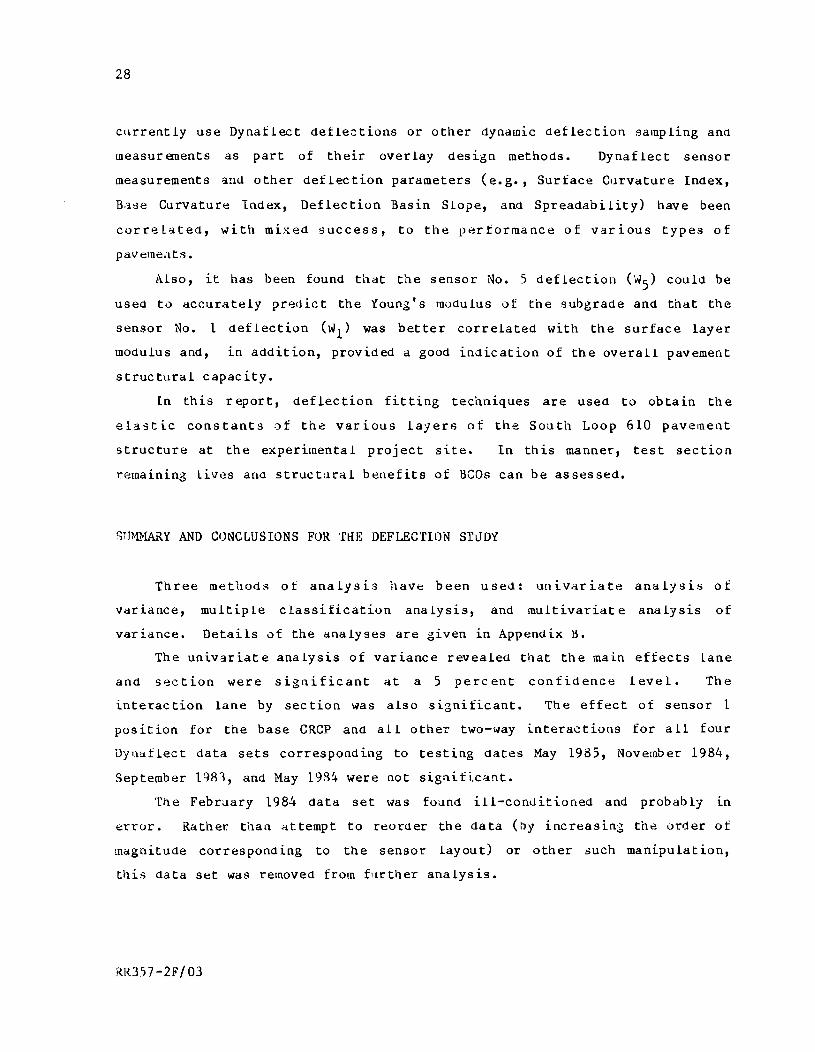
28
cllrrently use Dynatlect defle::tions or other dynamic deflection sampling ana
measur ements as part of their over lay des ign methods. Dynaf lect sensor
measurements and other deflection parameters (e.g., Surface Curvature Index,
B.'ise Curvature Index, Deflection Basin Slope, and Spreadability) have been
correl~ted, with mixed success, to the performance of various types of
pavements.
Also, it has been found that the sensor No. 5 deflection (W5 ) could be
used to accurately prec1ict the Young's modulus of the subgrade and that the
sensor No. 1 deflecti0n (WI) was better correlated with the surface layer
mOdulus and, in addition, provided a good indication of the overall pavement
structural capacity.
In this report, deflection fitting techniques are used to obtain the
elastic constants of the various layers of the South Loop 610 pavement
structure at the experimental project site. In this manner, test section
remaining lives ana structural benefits of Beos can be assessed.
SnMHARY AND CONCLUSIONS FOR TilE DEFLECTION STUDY
Three methodR ot analysi.s have been used: univariate analysis of
variance, multiple Classification analysis, and multivariat e analysis of
variance. Details of the analyses are given in Appendix B.
The univariate analysis of variance revealed that the main effects lane
and section were siguificant at a 5 percent confidence level. The
interaction lane by section was also si6nificant. The effect of sensor 1
position for the base CRG? and all other two-way interactions for all four
DY'ltif lec t data sets corresponding to testing dates May 1985, November 1984,
September 11R1, and May 1984 were not significant.
The February 1984 data set was found ill-conuitioned and probably 1.n
error. Rather. thau attempt to reorl1er the data (by increasing the order of
magnitUde corresponding to the sensor layout) or other such manipulat ion,
this data set waS removed from further analysis.
RR357-2F/03

29
The multiple classification analysis allowed for ordering of lane and
section effects for a given survey date.
Before Lwer1ay, the 2"F section had the lowest mean deflection and the
211R the highest. Lane 1 had the lowest mean aef1e'~tion and Lane 3 the
11ighest.
Immediately after overlay, the (titt~rences bet"yeen the mean lane
def1ectiuns were negligible (about one-tenth their initi~l values) and
dift:erences between mean section deflections varied depending on the sensor
llUmber.
After overlay, the 3 11 F secti.on had the lowest mean deflection and the
211Ni1 the highest. The difference bet.ween the mean lane def 1eet ion varied
depending on the sensor number.
Th e before mial.ls the after Dynaf 1ec t data allowe:l for an assessment of
tile structur;ll henefit of th~ five SCO design sections. Tilis i,ulnedlate
effc-!ct was analyzed using univariate analysis of variance, m'lltip1e
classifi'>ltiol1 analy3i'~, and multivar:-i..ate analysis of vdt"iance. It ''l·iS found
tll'lt s igniticant e t tects were lane, section and their interac tion. The
posi.tion of sensor 1 was significant for sensor 1 and sensor 2 :neasurements
'm1y.
Again, it was found that the 3"R secti.on induced the greatest reduction
i.n pavement deflection. Lane 3, the lane with the worst deflection
'~haracteristics, showed the largest improvement after overlay. In fact, the
order 1.n lane ,1eflection chanh~teristics improvement remained unchanged
(i.. e., 2nd \>1orst, 2nd largest improvement, etc.).
In the multivariate analysis of varia'lce, three effe2.ts were studied:
survey date effect, ,:;ection effects for e:'l.ch survey dat'-!, and immediat.e
section effect after Bel) GIHlstruction. The analysis ;If ttlt'! date effect
revealed that even if the before overlay data set is n0t considered, t~e data
sets aEter overlay wer~ significantly different; tlms, these datd >3ets could
be studied on a dat e basis.
The section eftect stUdy showed that all other sections had
signi..ficantly different deflection basins from the 3"R, the s~ctionwllich had
tite Largest reauction in deflection after overlay, on all survey dates but
~·lay 1985 and November 1984, when the 3"R and the 211R had statisti':;illy tile
RR357-2F/03
30
same deflection characteristics. Therefore, the thickness effect varied by
survey date (i.e., there is a date by thickness interaction).
The immediate section effect study revealed that thickness effect ~s
significant for a high level and intensity of traffic and that this effect
appears sooner for the fiber sections than for the steel reinforced sections.
For a level of traffic the fibers were more effective in reducing
the deflection of overlaid CRCP.
CONCRETE MOVEMENT AT CRACKS
Experiment Design
As part of the measurement program on the South Loop 610 BCO project, it
was proposed to stUdy for a period of time immediately following construction
the movements of the CRCP and the five overlay sections across designated
cracks. It was felt that three typical cracks at quarter points within each
design section would provide representative data to be extended to the entire
section in question. The main issue to address at that point was how to
maintain contact with the original CRCP after overlay placement. To this
end, 15 metal boxes were fabricated at the Center for Transportation
Research. These were to be fastened onto the milled CRCP surface so that
their tops would be flush with the overlay surface. Accordingly, nine 2-
inch-high boxes and six 3-inch boxes were required. Figure 3.1 shows typical
measurement boxes used at the site. Note that all boxes were coated with a
multilayer of paint to inhibit rusting.
The measuring equipment selected was a Whittemore type mUlti-position
strain gauge developed by Soil Test, Inc., Evanston, Illinois. It is a high
precision mechanical strain gauge capable of "measuring movements through a
range of 0.2 inch with dial gradation of 0.0001 inch" (Ref 15).
RR357-2F/03
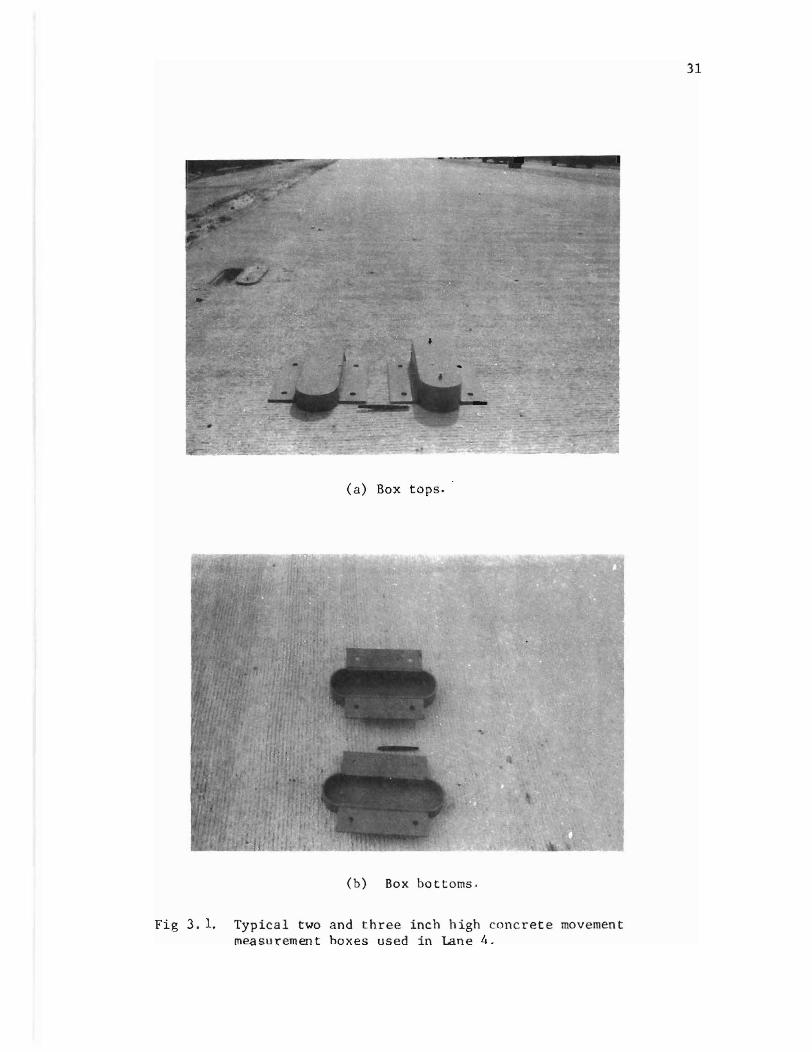
(a) Box tops.
(b) Box bottoms.
Fig 3. 1. Typical two and three inch high concrete movement measut:"ement boxes used in Lane 4.
31
32
For a period of two to three weeks immediately following overlay
constrllction, concret e movement was measurea along I/ith air temperature. The
meaSllrements were taken. three times daily: morning, afternoon, and night. An
out,11)·)r thermometer with glass casing was first used during the exper.iment.
It was hung on a string and swung in the air above the pavement to ohtain an
werage air. temperature at the time of concret e movement measurement. During
the experiment, this thermometer broke and was rep laced by a fresh concrete
thermometer with a metal probe. Air temperature was measured in. an identical
manner.
Two sets of gauge plugs were installed on the CRCP (inside the boxes)
and on the !:leO (o,ltsLle the boxes), respectively, as part of the Phase II
construction operations encompassing the overlaying of the outside two lanes,
3 and 4.
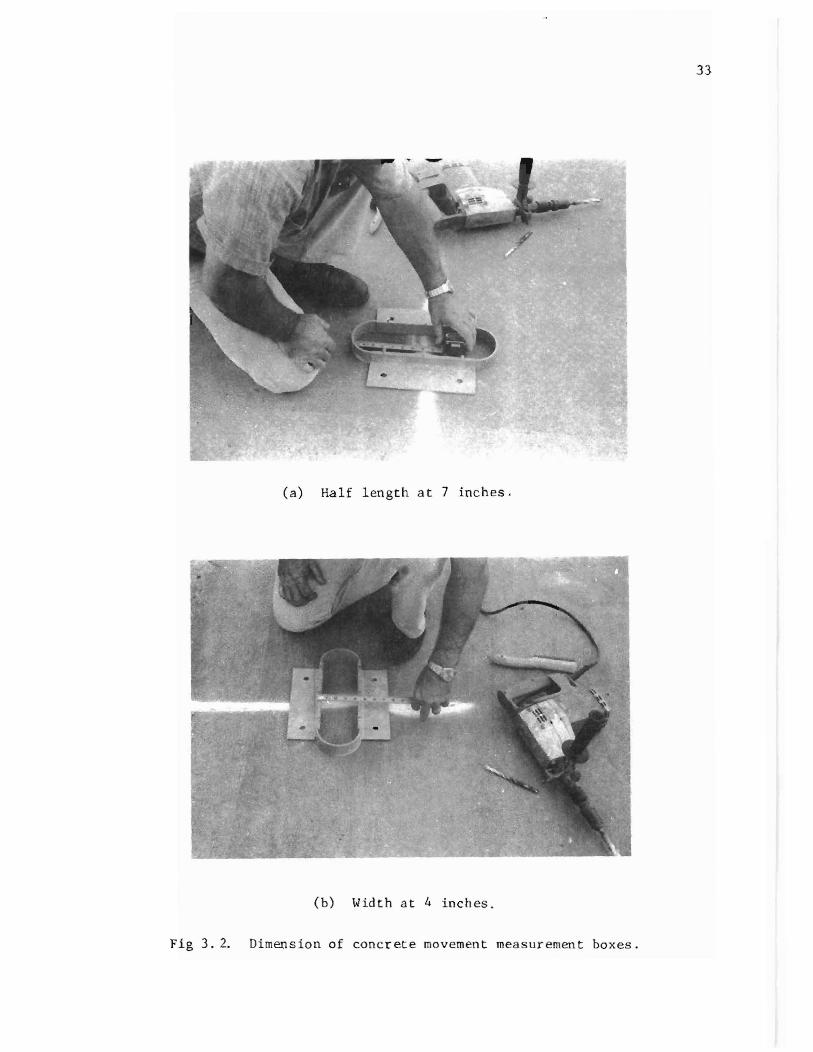
Tile inside dirnens ions of the measur ement boxes were approximate ly 4 x
14 inches (Fig 3.2). These boxes were installed at 18 inches on center from
the outside sl10ulder edge. The outside gauge plugs were il1stalled at 12
inches fro,n the boxes or a total of 10 inches from the pavement edge
(Fig 1.3). All concrete movement measurements wer.:: confined to Lane 4, the
on termost lane.
The installation procedure for the two sets of plugs was not the same;
the ins ide t> lags were epo:<it.!d down on the mi. 1 led CRCP Sllr face whereas the
()lltside plubs '.<Jere mounted on brass inserts that were first drilled into the
"green" con"rete and then e?oxied down to the proper elevation.
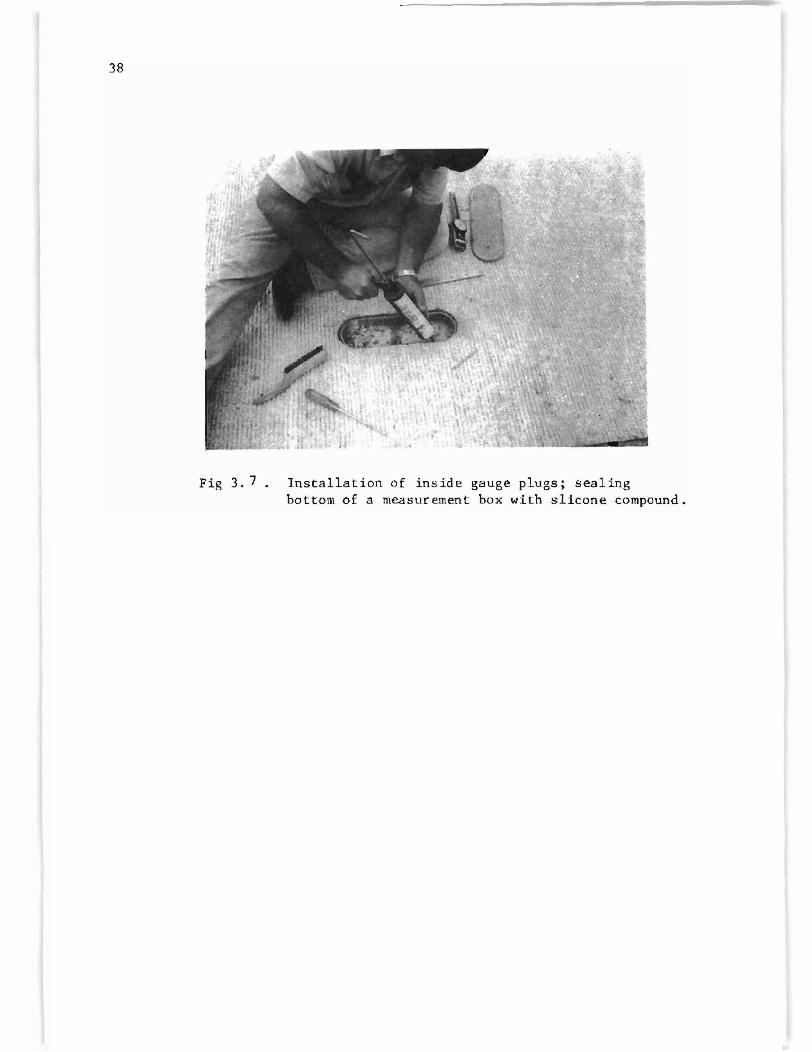
Tile sequence of the box and gauge plug installation is illustrated 1.n
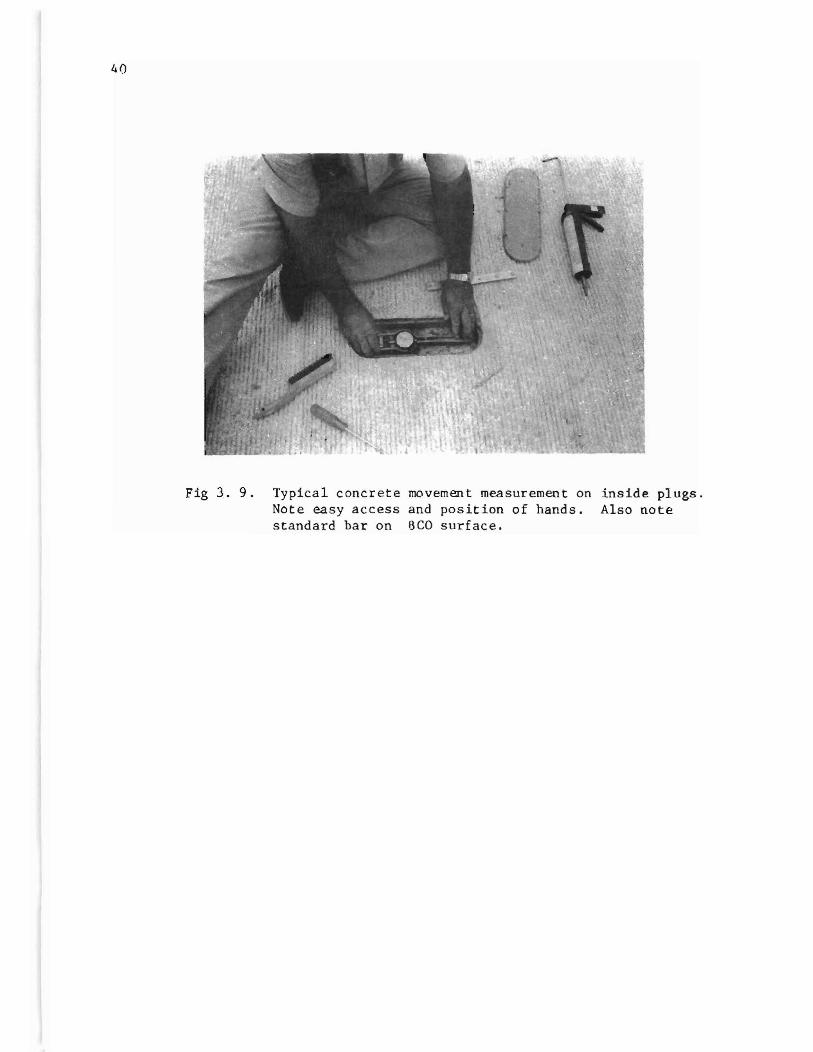
Figs 3.4 tllrough 3.7. The finished product is illustrated in Fig 3.8, anct
Fig 3.9 shows a typical measnr ement.
Finally, it must be said that the shape and the dimensions of the boxes
were designed to snst<:lin traffic loading while allowing for easy access to
the gauge plugs. By and large, this objective was achieved as revealed by
the periOdic condition surveys.
RX35 7·- 2F /03
33
(a) Half length at 7 inches.
(b) \~idth at 4 inches.
Fig 3.2. Dimension of concrete movement measurement boxes.
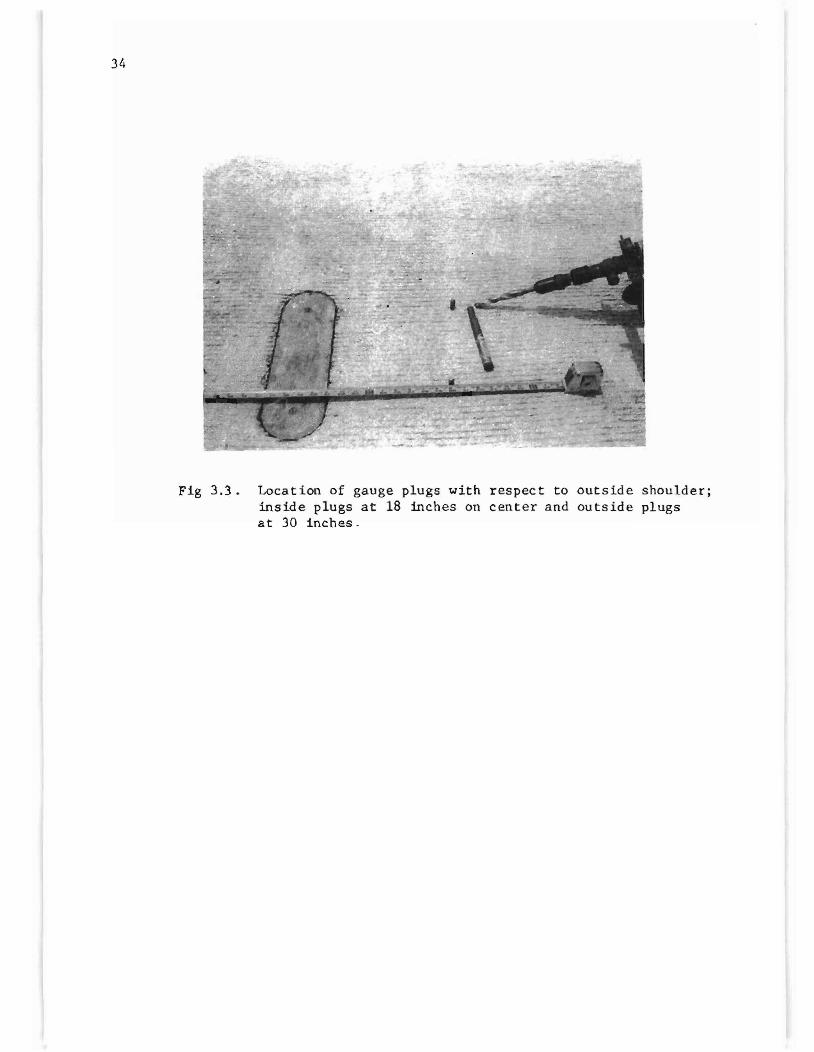
34
Fig 3.3. Location of gauge plugs with respect to outside shoulder; inside plugs at 18 inches on center and outside plugs at 30 inches.
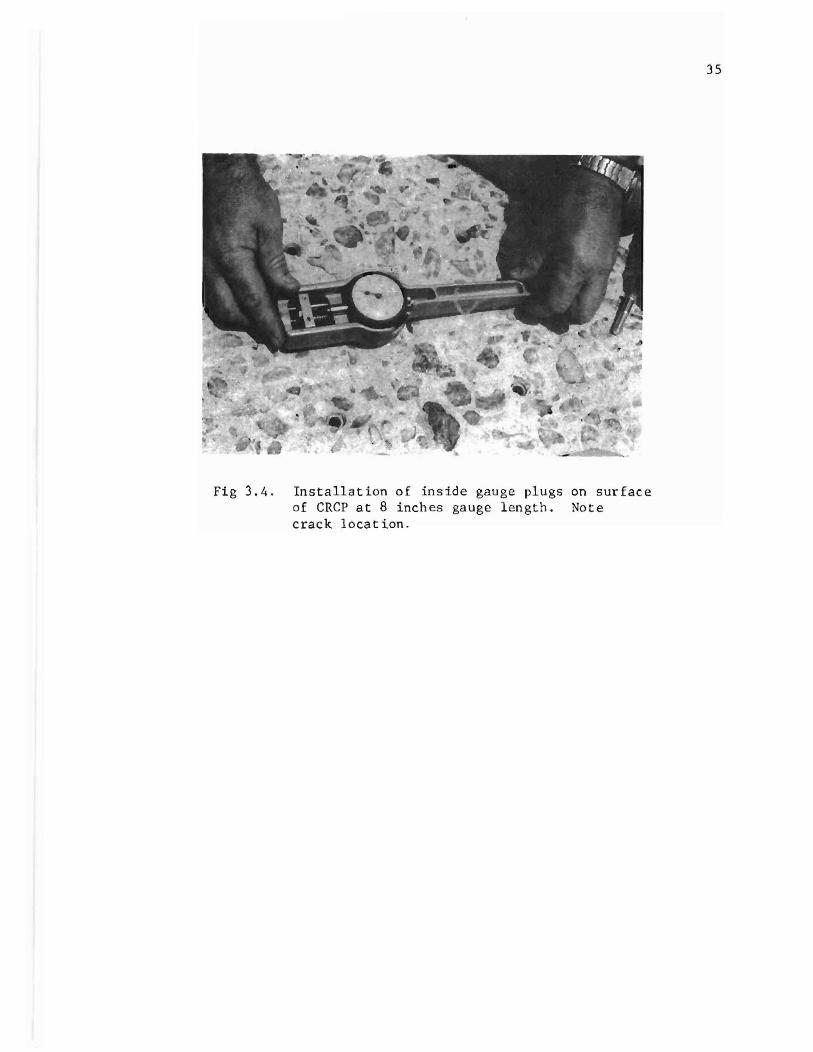
Fig 3.4 . Installation of ins i de gauge plugs on surface of CRCP at 8 inches gauge l ength . Note crack location.
35
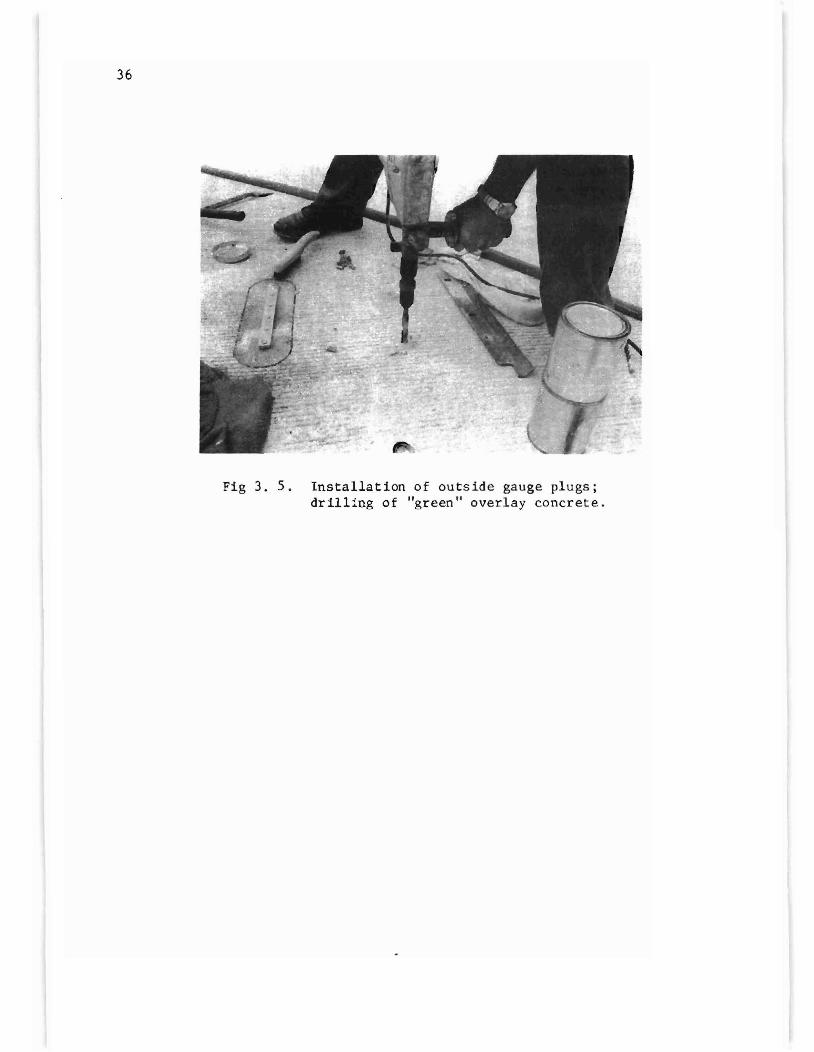
36
Fig 3. S. Installation of outside gauge plugs; drilling of "green" overlay concrete.
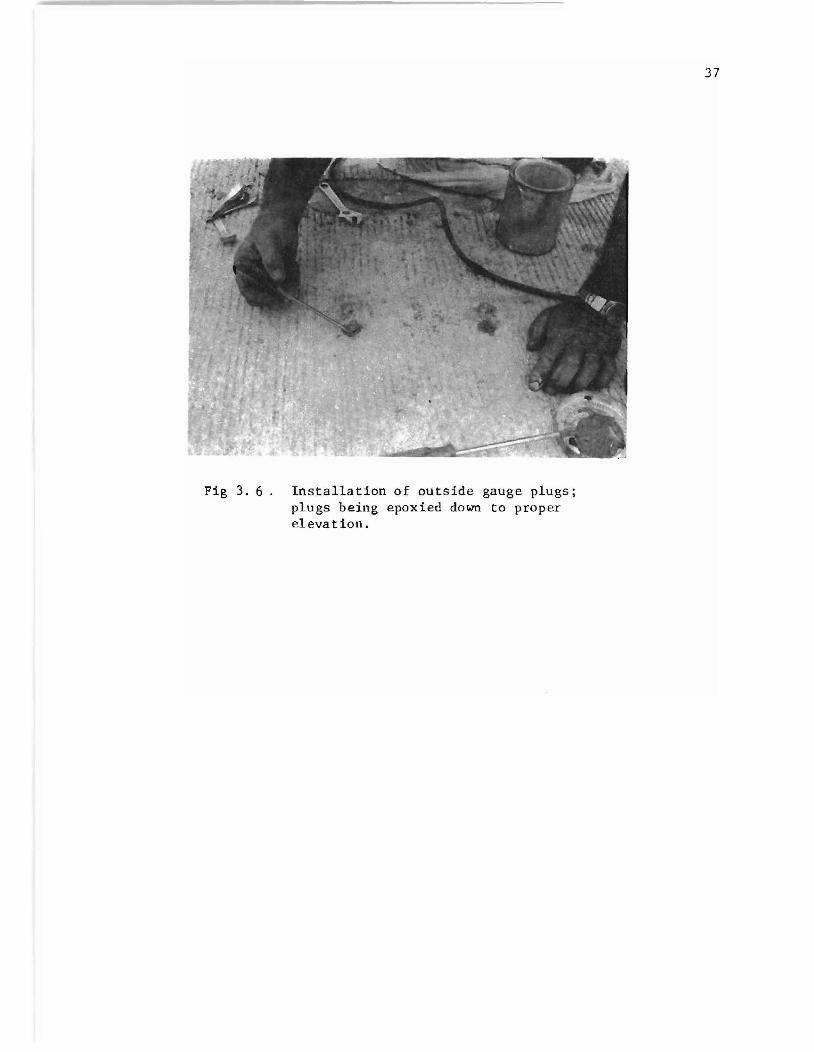
Fig 3.6. In s tallation of outside gauge plugs; plugs being epoxied down to prop er elevation.
37
38
Fig 3. 7. Installation of inside gauge plugs; sealing bottom of a measurement box with slicone compound.
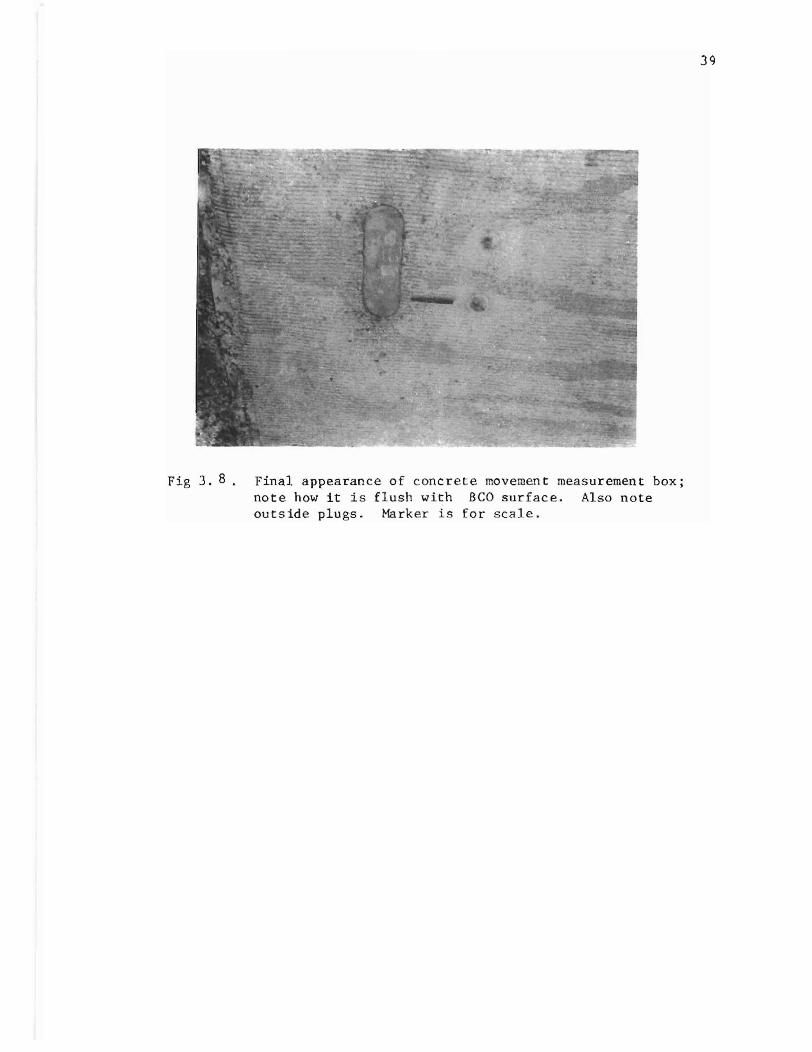
Fig J. 8. Final appearance of concrete movement measurement box; note how it is flush with BCO surface. Also note outside plugs. Marker is for scale.
39
40
Fig 3. 9. Typical concrete movemen t measurement on inside plugs. Note easy access and position of hands. Also note standard bar on SeQ surface.

41
A gauge length of 8 inches was used throughout for both inside plugs and
outside plugs. On each test run, the top covers of the boxe$ were removed to
give access to the inside gauge plugs. A reading was taken on the inside
plugs followed by a reading on the outside plugs, and this sequence was
repeated allover a5ain. If the two measurements r elated to either set of
pll1gs differed by a significant amount, then additional measurements were
called for. Otherwise, the operators proceeded to the next set of plugs.
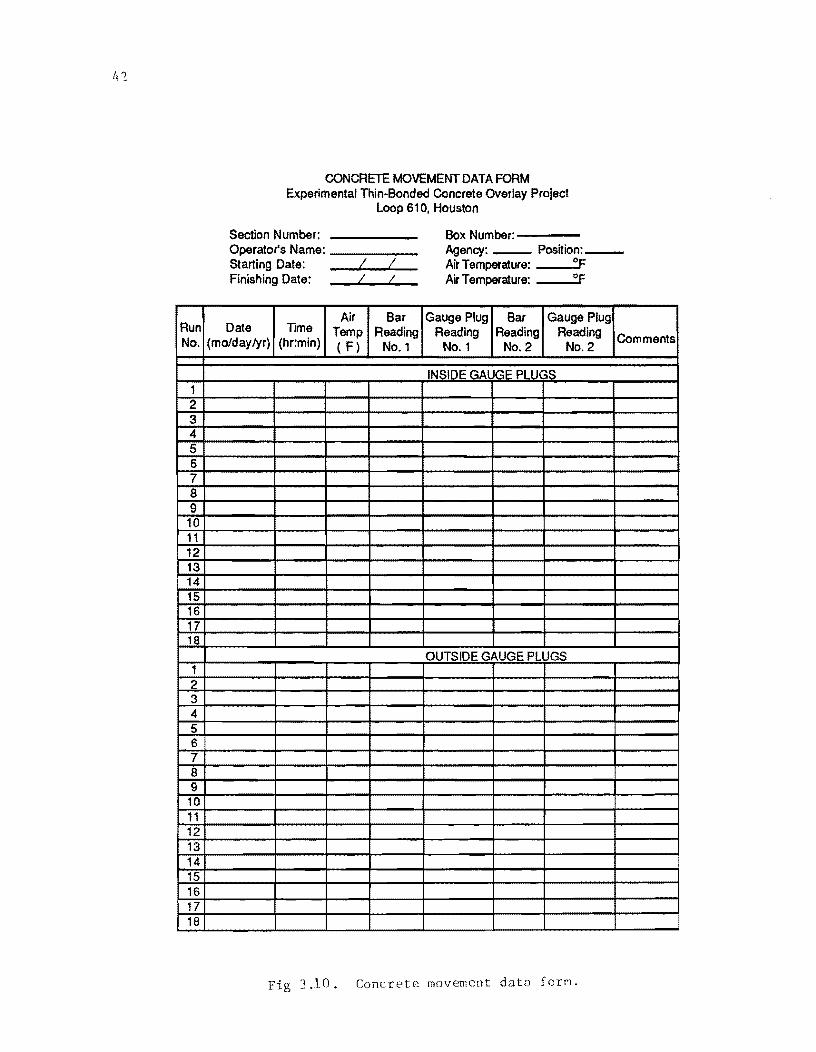
This procedure allowed for true replicates of measurements. Figure 3.10
shows th e form used in th e fi e Id to r e::: ord th e da ta. It was specifically
laid out to be easy to use in the field as well as practical.
Recorded Concrete Movement
First, the concrete movement, XG or successive readings was calculated
as follows:
where
C· ~
=
=
initial difference between bar reading, Ao and gauge piug
reading, Bo; and
subsequent difference.
and 1. is an index that
denotes the incidence of measurements o~er time.
Co is also ~alied the reference constant. Its algebraic value is
subtracted from all subsequent measurements to obtain the relative movement
of concrete across a crack, XG (i.e, crack opening and closing). This
relative movement can be related to many variables. In this stUdy, how~er,
temperature and time after over lay construction in 1/2 hour increments (a
,~ubstitute variable for shrinkage) were used as explanatory variables.
RR357-2F/03
Run
CONCRETE MOVEMENT DATA FORM Experimental Thin-Bonded Concrete Overlay Project
Loop 610, Houston
Section Number: Operator's Name: ____ _ Starting Date: / / Finishing Date: / /
Air Bar Date Time
Box Number: ---Agency: __ Position:_ Air Temperature: OF Air T emperalure: OF
Gauge Plug Bar Gauge Plug Temp Reading Reading Reading Reading
No. (mo/day/yr) (hr:min) ( F) No.1 No.1 No.2 No.2 Comments
INSIDE GAUGE PLUGS 1 2 3 4 5 6 7 8 9
10 11 12 13 14 15 16 17 18
OUTSIDE GAUGE PLUGS 1 2 3 4 5 6 7 8 9
~ 15 16 17 18
3.10. Concrete movement data forl'l.
43
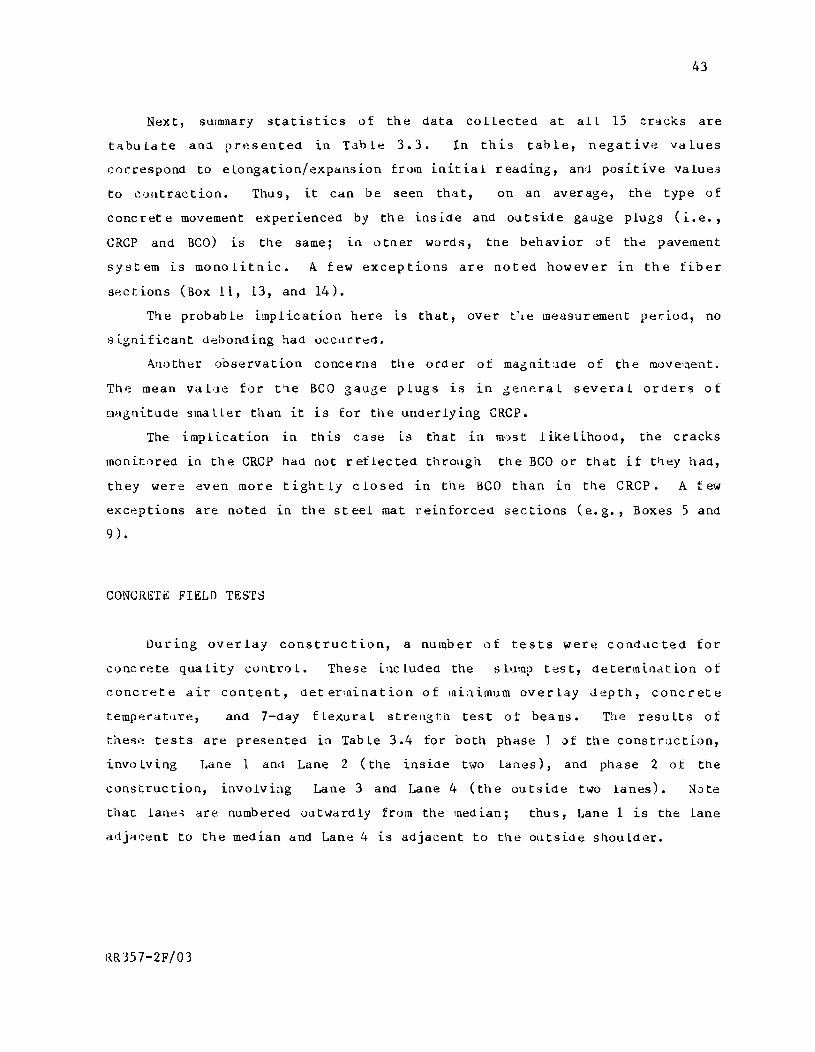
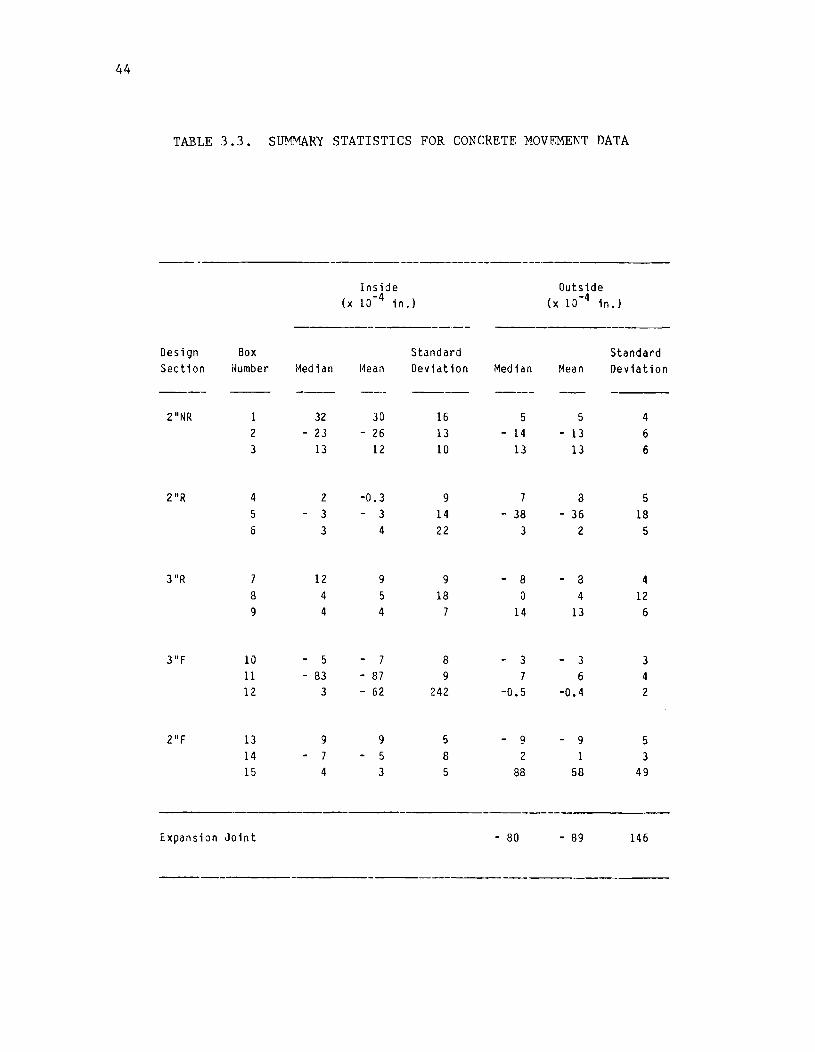
Next, sUlIunary statistics of the data collected at all 15 cracks are
tabulate aud presented in Table 3.3. In this table, negative values
r;()I~respond to elongat ion/expans ion frl)m init ial reading, an'1 posit ive values
to I>Jntraction. Thus, it can be seen that, on an average, the type of
conc ret e movement experienced by th e ins ide and outside gauge plugs (i. e. ,
CRCP and BCO) is the same; in other words, the behavior af the pavement
system is monolithic. A few exceptions are noted however in the tiber
sp.ctions (Box 11, 13, and 14).
The probable Lnplication here 1S that, over t'le measurement per:-iod, no
Bignifica~t debonding had occ~rred.
Arlother observation concerns tlle order of magl1it!lde of the movelaent.
The mean value for t~e BCa gauge plugs is 1n general several orders of
EHlgnitude sma l Ler than it is for tlle under lying CRCP.
The implication in this case 18 that in most likelihood, the cracks
monitored in the CRCP had not reflected through the BCO or that if they had,
they were even more tightly closed in the BCO than in the CRCP. A few
excp.ptions are noted in the steel mat reinforced sections (e.g., Boxes 5 and
9) •
CONCRETE FIELD TESTS
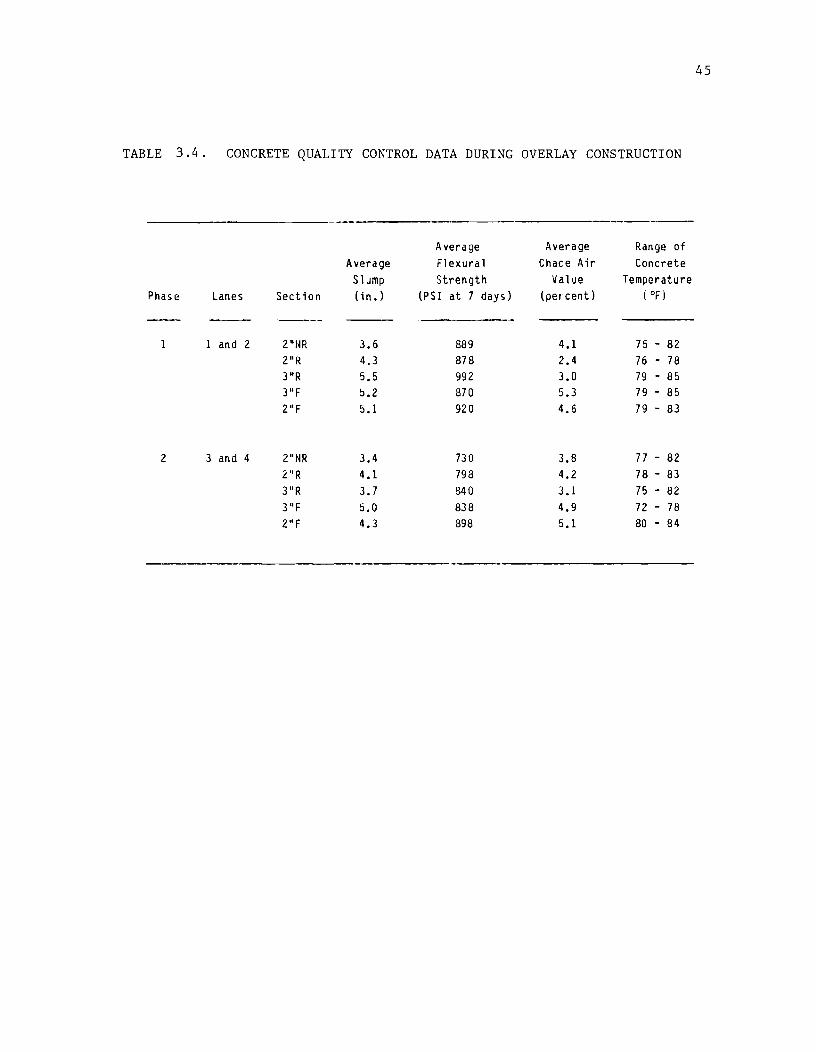
During overlay construction, a number of tests were condllcted for
cone rete quality contro 1. These inc luded the s lU1np tes t, determindt ion of
concrete air content, determination of miaimum overlay depth, concrete
temper,'!t1lre, and 7-day fLexural streng th test of beams. The results of
thes.! tests are presented in Table 3.4 for both phase 1 .:If the constr:lction,
invo LYing Lane 1 an<.1 Lane 2 (the inside t,-lO lanes), and phase 2 of the
construction, inVOlving Lane 3 and Lane 4 (the outside two lanes). Note
that: lane~ are numbered o'ltwardly from the lnedian; thus, Lane 1 is the Lane
adjacent to the median and Lane 4 is adjacent to the outside shoulder.
RR357-2F/03
44
TABLE 3.3. Sl~RY STATISTICS FOR CONCRETE MOVEMENT DATA
--- -----------------
Inside Outside (x 10-4 in. ) (x 10-4 in. )
Design Box Standard Standard Section i~umber i~ed i an 14ean Deviation Median Mean Deviation
---- ----2"NR 32 30 16 5 5 4
2 - 23 - 26 13 - 14 - 13 6
3 13 12 10 13 13 6
2"R 4 2 -0.3 9 7 8 5
5 - 3 - 3 14 - 38 - 36 18
6 3 4 22 3 2 5
3"R 7 12 9 9 - 8 - 8 4
8 4 5 18 0 4 12
9 4 4 7 14 13 6
3"F 10 - 5 - 7 8 - 3 - 3 3
11 - 83 - 87 9 7 6 4
12 3 - 62 242 -0.5 -0.4 2
2"F 13 9 9 5 - 9 - 9 5
14 - 7 - 5 8 2 3
15 4 3 5 88 58 49
----Expansion Joint - 80 - 89 146
-------
45
TABLE 3.4·. CONCRETE QUALITY CONTROL DATA DURING OVERLAY CONSTRUCTION
----.----
Average Average Range of Average Flexural Chace Air Concrete
Slump Strength Value Temperature Phase Lanes Section (i n • ) (PSI at 7 days) (percent) ( oF)
----
I 1 and 2 2"NR 3.6 889 4.1 75 - 82 2"R 4.3 878 2.4 76 - 78 3"R 5.5 992 3.0 79 - 85 3"F !>.2 870 5.3 79 - 85 2"F 5.1 920 4.6 79 - 83
2 3 and 4 2"NR 3.4 730 3.8 77 - 82 2"R 4.1 798 4.2 78 - 83 3"R 3.7 840 3.1 75 - 82 3"F 5.0 838 4.9 72 - 78 2"F 4.3 898 5.1 80 - 84
46
As can be seen, the flexural strength of concrete for the 7 days test is
well above the 700 psi specified for the entire population; the mean flexural
strength is f = 864 psi with a standard deviation = 75 psi.
Although no durability test (e.g., freeze - thaw) was performed, it can be
inferred from the Chace air values (2.4 to 5.3 percent) that this concrete
property would most likely be adequate.
Workability, as measured by the concrete slump, varied between 3.4 and
5.5 inches. This made for a concrete that could easily be placed. The fiber
sections did not present any particular difficulty in that respect. In
general the fiberous concrete was easily cast and surface finished. The
metal tine finish adopted was particularly appropriate in that it would
rearrange the steel fibers at the surface in a direction perpendicular to
traffic, thus effectively eliminating any potential for damage to rolling
tires caused by the steel fibers used in the paving concrete mix.
RR357-2F/03
CHAPTER 4. ANAL'! Sl S OF PERFORMANCE DATA
In this chapter, performance of the test sections is evaluated in terms
of the condition survey variables (e.g., cracking and spalling) and ride
quality (i.e., longitudinal profile roughness data).
CONDITION SURVEY DATA
Condition survey data were collected l.n May 1983 (before overlay
construct ion), February 1984 (first cond it ion survey a fter construct ion),
November 1984 (second condition survey after construction), and lliy 1985
(third condition survey after overlay).
The method used is called the small sections method. It is a detailed
procedure used for eRG pavements when complete information is desired and is
particularly appropriate for roadways that are experimental in nature
(Ref 16). At the Houston site, two lanes at a time were blocked off to
traffic. To conduct t.he survey, a team walks onto the pavement in the lane
to be surveyed. Any visible distress is noted and referenced with a rolling
tape to some fixed highway element (e.g., milepost). In particular,
10n6 itudinal and transverse cracks are mapped, and spalling is counted and
classified as either minor or severe spalling.
Subsequently, the data are entered on a computer file and processed
through the computer program CONSl1S. The purpose is to store the data so
they can be easily accessed or manipulated at a later stage. Tne output from
CONSMS is sUIIiluary information fr,)m all previous surveys. For the south Loop
610 experiment, the condition survey information derived from the CONSMS
output is presented in Tables 4.1 through 4.4. The data are first
aggregated by section, then by lane.
Tables 4.1 through 4.4 are derived from Tables 4.5 through 4.8, which
are three-way classifications of longitudinal cracking (Table 4.5),
transverse cracking Crab Ie 4.6), minor spall ing (Tab Ie 4. n, and severe
spalling (Table 4.8). The classification factors are lane (4 levels),
RR35 7- 2F /04 47
48
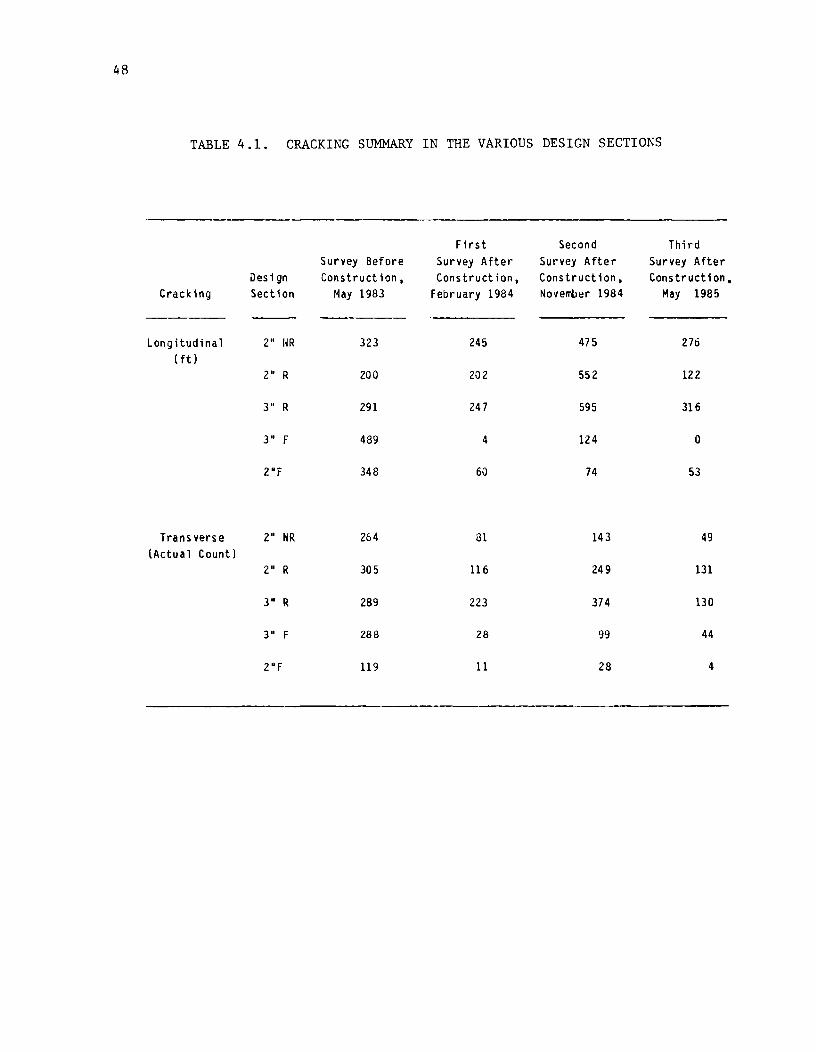
TABLE 4.1. CRACKING SUMMARY IN THE VARIOUS DESIGN SECTIONS
First Second Third Survey Before Survey After Survey After Survey After
Des i gn Construction, Construction, Construction, Cons truct ion, Cracking Section May 1983 February 1984 No~ember 1984 May 1985
Longitudinal 2" NR 323 245 475 276 (ft)
2" R 200 202 552 122
3" R 291 247 595 316
3" F 489 4 124 0
2"F 348 60 74 53
Transverse 2" NR 264 81 143 49 (Actual Count)
2" R 305 116 249 131
3" R 289 223 374 130
3" F 288 28 99 44
2"F 119 11 28 4
49
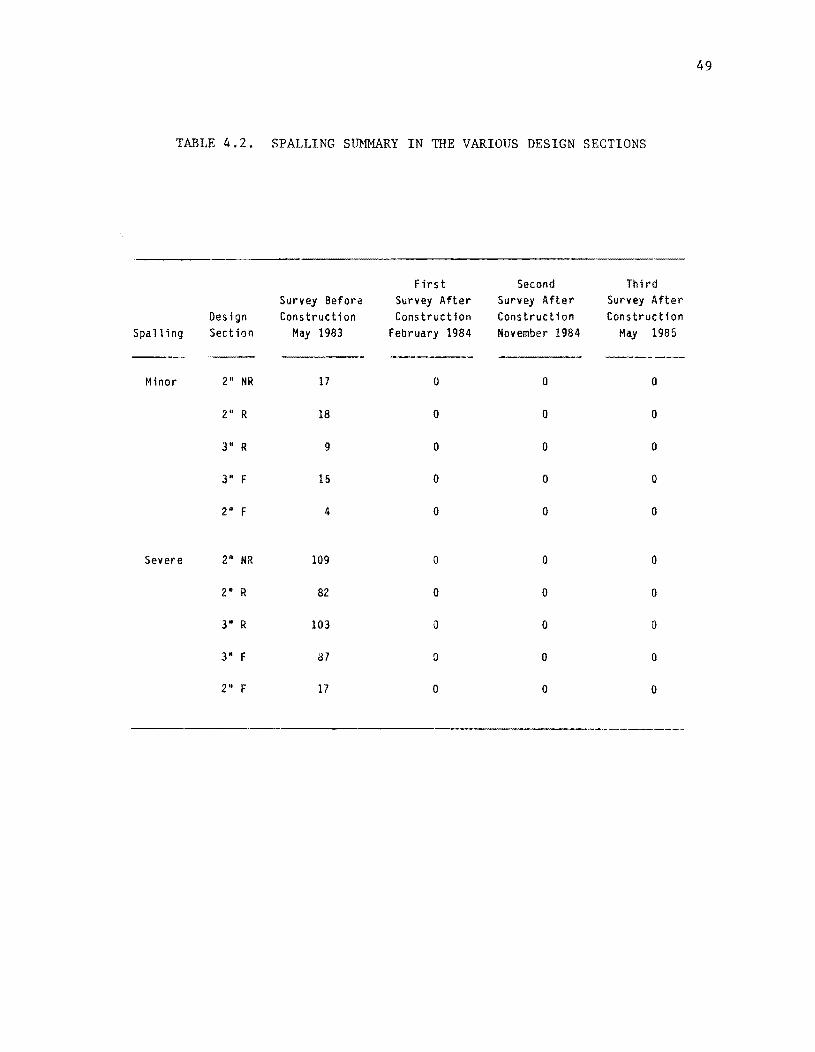
TABLE 4.2. SPALLING SUMMARY IN THE VARIOUS DESIGN SECTIONS
First Second Third Survey Before Survey After Survey After Survey After
Design Construction Construction Cons tructi on Construction Spalling Section May 1983 February 1984 November 1984 May 1985
---- ---- ------Minor 2" NR 17 0 0 0
2" R 18 0 0 0
3" R 9 0 0 0
3" F 15 0 0 0
2" F 4 0 0 0
Severe 2" NR 109 0 0 0
2" R 82 0 0 0
3" R 103 0 0 0
3" F 87 () 0 0
2" F 17 0 0 0
---------
so
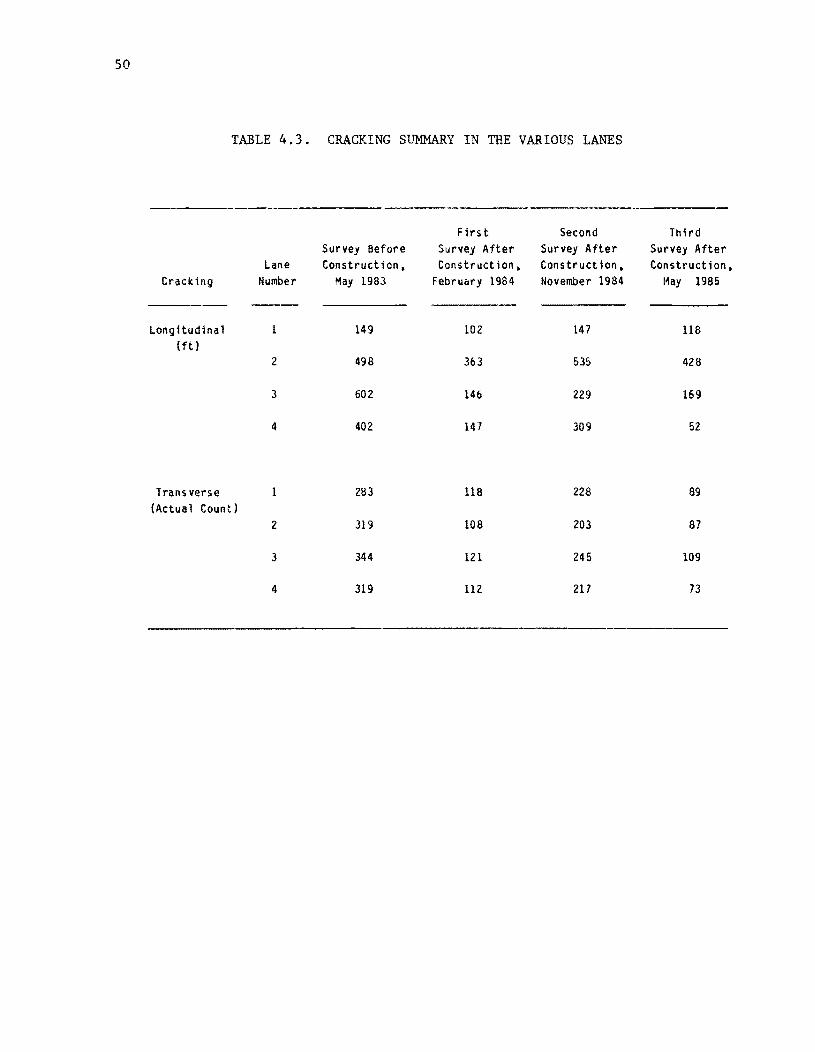
TABLE 4.3. CRACKING SUMMARY IN THE VARIOUS LANES
Cracking
Longitudinal (ft )
Transverse (Actual Count)
Lane Number
----1
2
3
4
2
3
4
Survey Before Construction,
May 1983
149
498
602
402
283
319
344
319
Firs t Second Survey After Survey After Construction, Construct ion,
February 1984 November 1984
102 147
363 535
146 229
141 309
l18 228
108 203
121 245
112 217
Third Survey After Construction,
11ay 1985
118
428
169
52
89
87
109
73
51
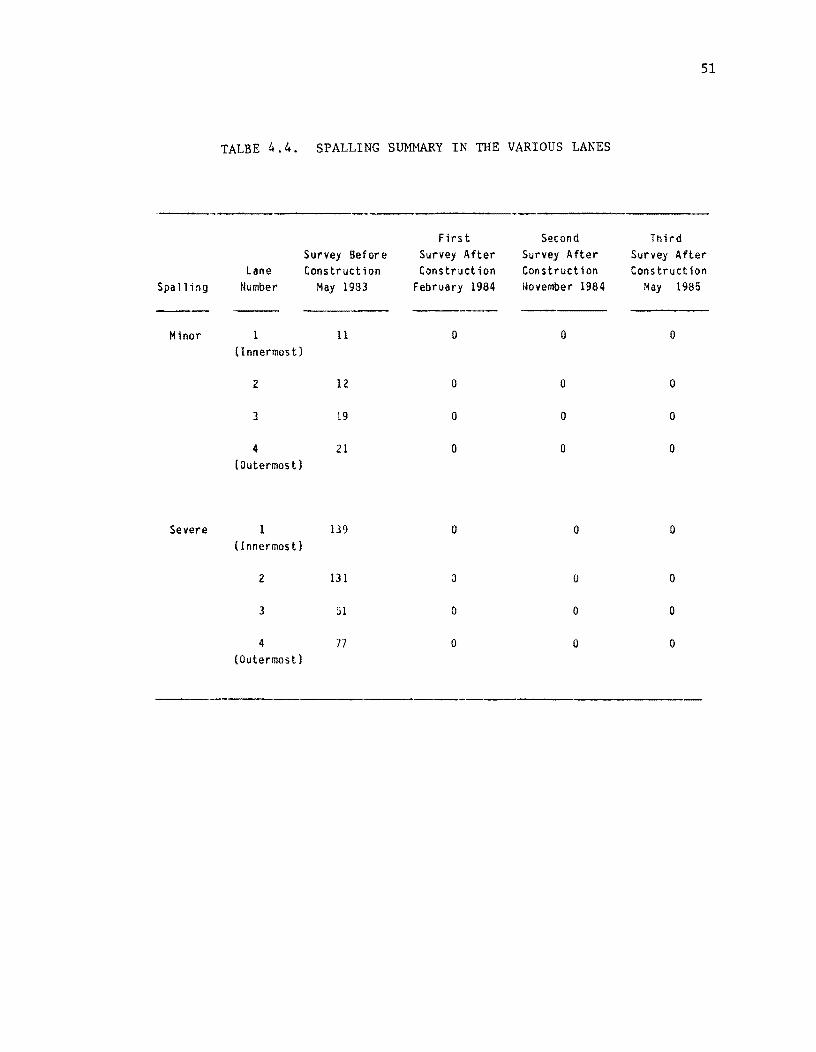
TALBE 4.4. SPALLING SUMMARY IN THE VARIOUS LANES
Firs t Second Third Survey Before Survey After Survey After Survey After
Lane Construction Construction Construction Construction Spallir\g Number May 1983 February 1984 110vember 1984 May 1985
---Minor 11 0 0 0
(Innermost)
2 12 0 0 0
3 19 0 0 0
4 21 0 0 0 (Outermost)
Severe 139 0 0 0 (Innermost)
2 131 a 0 0
3 51 0 0 0
4 77 0 0 0 (Outermost)
52
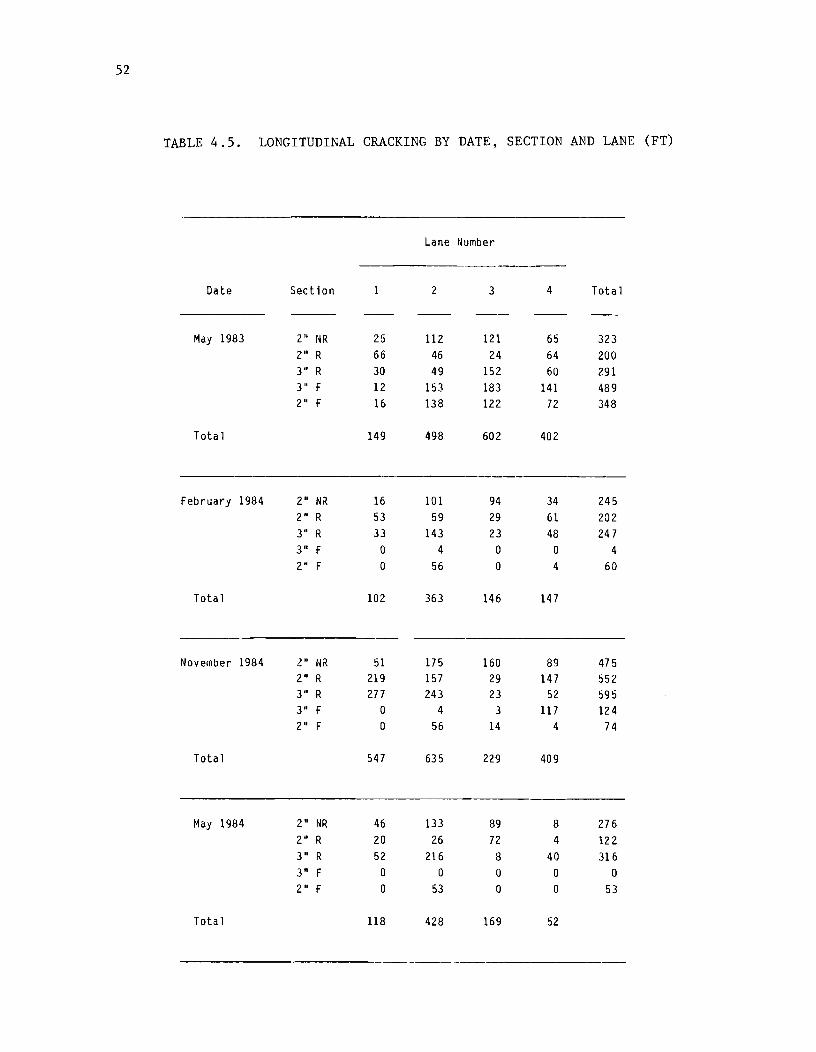
TABLE 4.5. LONGITUDINAL CRACKING BY DATE, SECTION AND LANE (FT)
Lane Number
Date Section 2 3 4 Total
---May 1983 2" liR 25 112 121 65 323
2" R 66 46 24 64 200 3" R 30 49 152 60 291 3" F 12 153 183 141 489 2" F 16 138 122 72 348
Total 149 498 602 402
February 1984 2" NR 16 101 94 34 245 2" R 53 59 29 61 202 3" R 33 143 23 48 247 3" F a 4 a a 4 2" F a 56 a 4 60
Total 102 363 146 147
November 1984 2" IiR 51 175 160 89 475 2" R 219 157 29 147 552 3" R 277 243 23 52 595 3" F a 4 3 117 124 2" F a 56 14 4 74
Total 547 635 229 409
May 1984 2" IiR 46 133 89 8 276 2" R 20 26 72 4 122 3" R 52 216 8 40 316 3" F a a a a a 2" F 0 53 0 0 53
Total 118 428 169 52
53
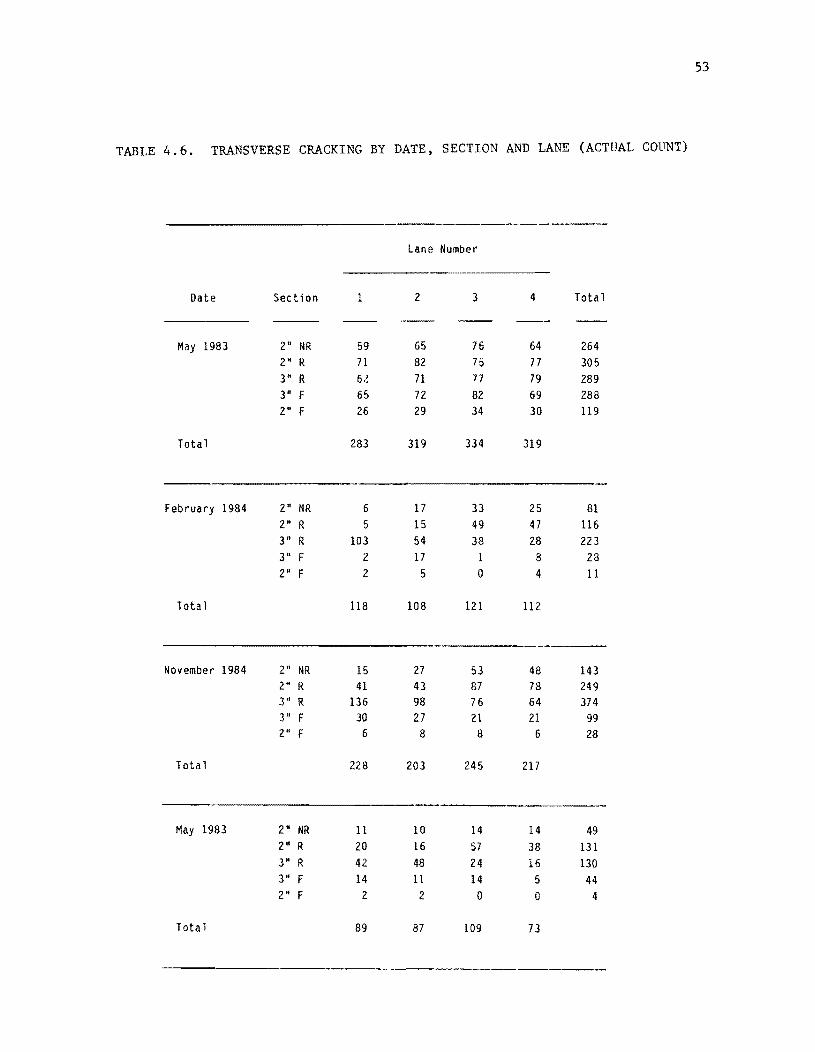
TABLE 4.6. TRANSVERSE CRACKING BY DATE, SECTION AND LANE (ACTUAL COUNT)
Lane Number
Date Section 2 3 4 Total
May 1983 2" NR 59 65 76 64 264 2" R 71 82 75 77 305 3« R 62 71 77 79 289 3· F 65 72 82 69 288 2· F 26 29 34 30 119
Total 283 319 334 319
February 1984 2" NR 6 17 33 25 81 2" R 5 15 49 47 116 3" R 103 54 38 28 223 3· F 2 17 8 28 2" F 2 5 0 4 11
Total 118 108 121 112
November 1984 2· NR 15 27 53 48 143 2· R 41 43 87 78 249 3· R 136 98 76 64 374 3" F 30 27 21 21 99 2· F 6 8 8 6 28
Total 228 203 245 217
May 1983 2" NR 11 10 14 14 49 21t R 20 16 57 38 131 3· R 42 48 24 16 130 3" F 14 11 14 5 44 2· F 2 2 0 0 4
Total 89 87 109 73
S4
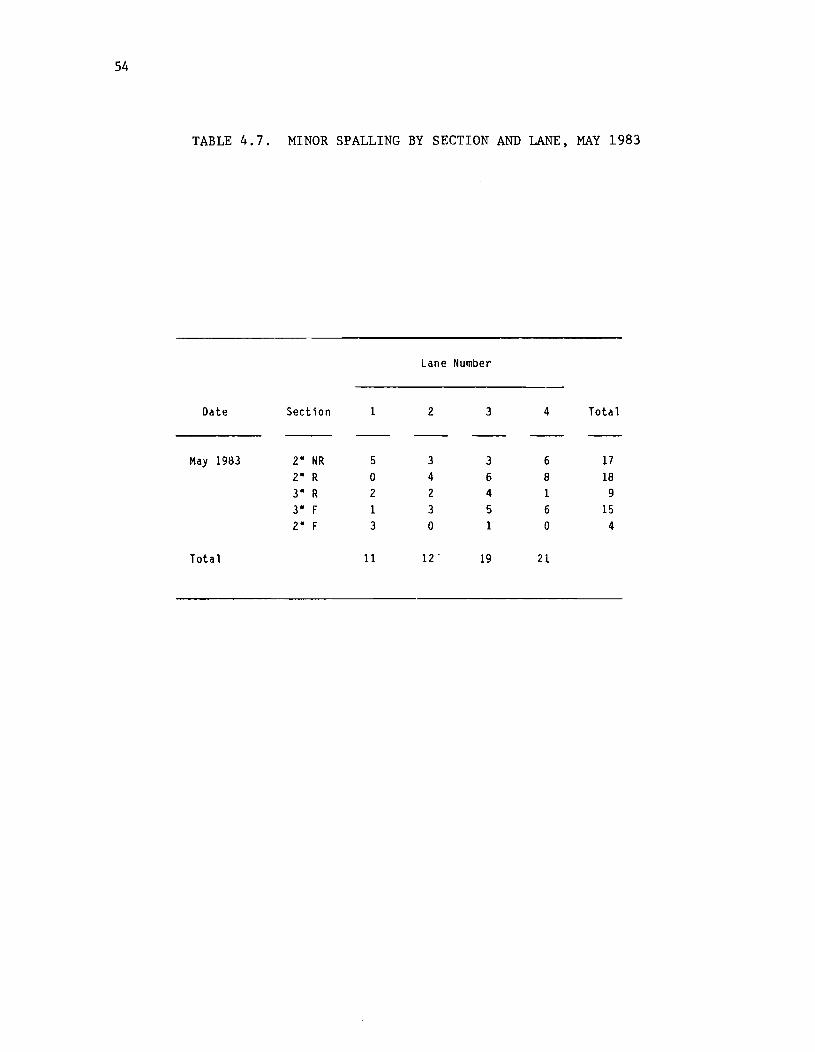
TABLE 4.7. MINOR SPALLING BY SECTION AND LANE, MAY 1983
Lane Number
Date Section 1 2 3 4 Total
May 1983 2" NR 5 3 3 6 17 2" R 0 4 6 8 18 3" R 2 2 4 1 9 3" F 1 3 5 6 15 2" F 3 0 1 0 4
Total 11 12 . 19 21
ss
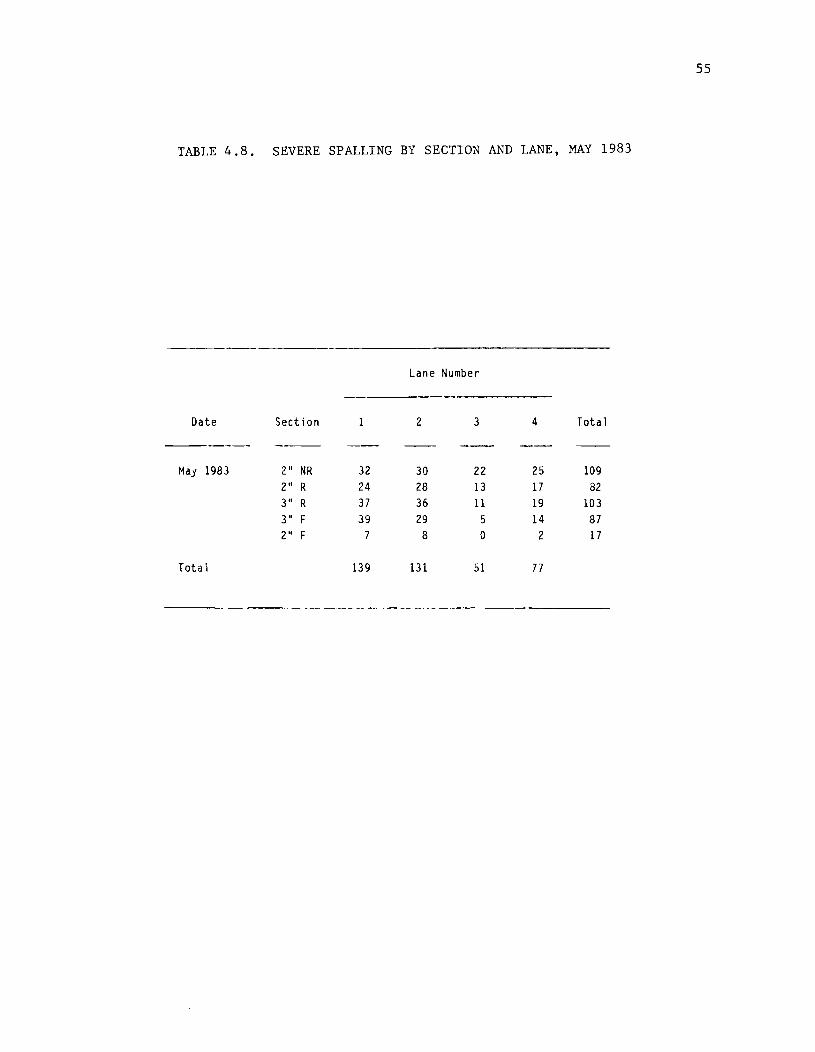
TABLE 4.8. SEVERE SPALLING BY SECTION AND LANE, MAY 1983
Lane Number
Date Section 2 3 4 Total
-----
May 1983 2" NR 32 30 22 25 109 2" R 24 28 13 17 82 3" R 37 36 11 19 103 3" F 39 29 5 14 87 2" F 7 8 0 2 17
Total 139 131 51 77
S6
sec tion (S leve is) and date (4 leve ls) • In Ta b 1 e s 4. Sand 4. 6, the
information is i>resented for four time periods (one before overlay and three
after overlay); in Tables 4.7 and 4.8, the information is presented only for
the before overlay survey, because no spall had occurred when the last three
condition surveys were taken. Thus, in February 1984, November 1984, and May
1985 table entries tor both minor and severe spalting categories are all
zeros. Tables 4.5 through 4.8 are presented to give the reader insight into
the level of aggregation which is not evident from an ex:.amination of
Tables 4.1 through 4.4. The latter set of tables summarizes the distress
manifestation under consideration.
Table 4.1 presents cracking in the various design sections for the four
time periOdS when condition survey data were collected. Two types of
cracking were recorded: longitudinal cracking and transverse cracking.
LongitUdinal cracking is measured in units of lineal feet whereas transverse
cracking is measured as number of occurrences (Le., actual count).
As can be seen, a significant decrease in the amount of both types of
cracking was noted S1X months after overlay placement, and the harshest
winter on record 1n the recent past in Houston (February 1984 data), followed
by a tremendous increase for the November 1984 data and, finally, a sudden
decrease. The history of cracking is as would normally be expected, except
for the last change. The recordeCl decrease in the amount of cracking is best
explained by a combination of factors, but most importantly a change 1n
S\lrvey team. In addition, weather condition (the tightly closed cracks in a
CRCP are best seen shortly after a light to medium rain when the pavement is
still wet) and seasonal effect (e. g., pavement temperature at the time of the
condition survey) may have influenced the visual condition survey. However,
the trend in Table 4.1 still indicates that the fiber sections exhib it the
best performance with respect to cracking, and the 3-inch steel reinforced
section the worst.
Table 4.2 presents the number of spaUed cracks by section tor before
and after overlay conditions. As can be seen, virtually no spall has
occurred afte r almost two years of thin bonded conc rete over lay placement.
RR357-2F/04

57
Table 4.3 presents the cracking information by Lane. Aga in, the un it s
of measurement are lineal feet for longitUdinal cracking and number of
occurrences (i.e., actual count) for transverse cracking. In this form of
presentation, the data primarily indicate the effect of traffic. Basically,
after over lay construction in February 1984, the amount of longitudinal and
tranverse cracking was halved in the various lanes. At the next survey date,
the amount of cracking had almost returned to the original level. Finally, a
significant decrease is noted at the May 1985 survey. The effect ot BCO on
cra,:::king is evident in all lanes in February 1984. In November 1984, the
~ncrease in cracks is most likely due to reflection cracking of tile base
CRCP. The survey team effect manifested itself in the difference between
November 1984 and May 1985 data.
Transverse cracking across the four lanes seems to occur more unitormly
than longitUdinal cracking. Most likely, transverse cracks reflect through
the BCO earlier and more systematically than longitUdinal cracks.
Overall, Lane 1 has the least amount of cracking and Lane 3 the most.
Therefore, an informal observation that the second right most lane on south
Loop 610 is the most heavily trafficked lane is confirmed.
Table 4.4 presents stlalling by lane. Notice that no cracks showed
evidence ot spall after overlay until May 1985 (twenty months after overlay
construction) •
ROUGtlNESS DATA
The new GMR digital profilometer was used in at least two consecutive
runs within each of the four lanes of the test sections. The data obtained
wen~ subsequently processed through the VERTAC computer program at the Genter
tor Transportation Research. The VERTical ACceleration (VERTAC) program
computes road profile statistics and estimates serviceability index, a user
oriented performance measure, based on combined information obtained under
both trailing wheels of the profilometer.
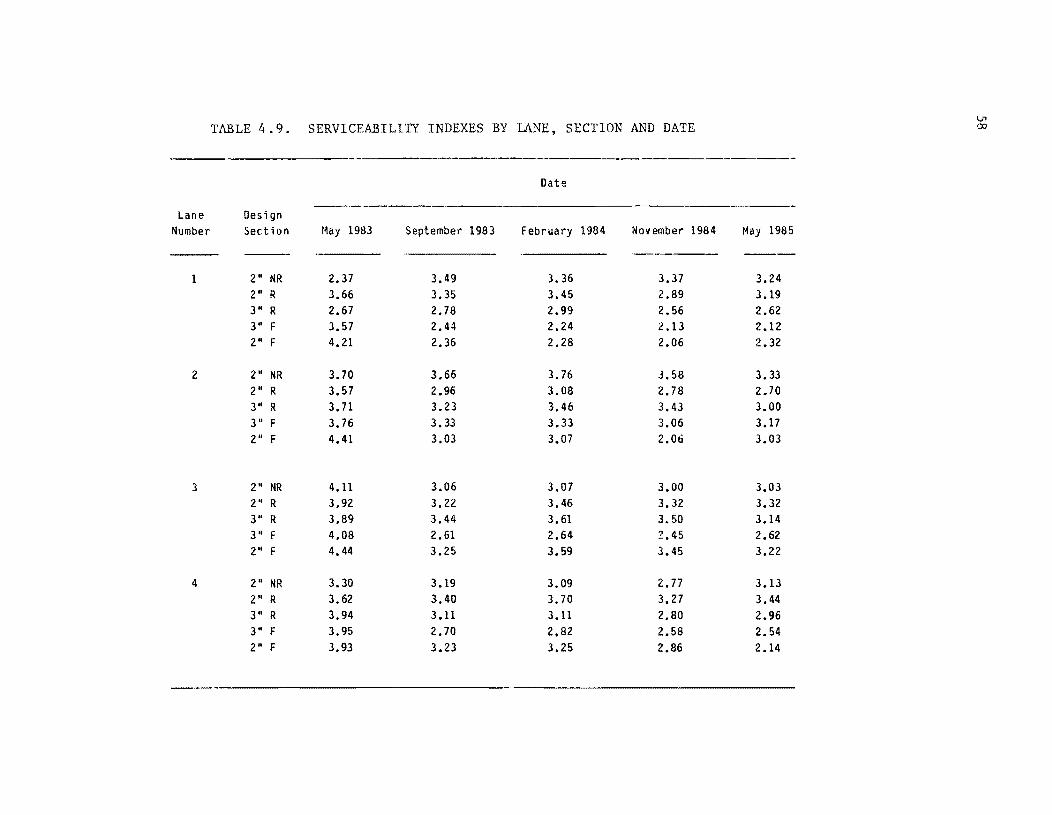
The Serviceability Index (Sl) values are presented ~a Table 4.9 by lane,
design sectio~, and date. Because short sections, approximately 200 feet
Rl{35 7- 2F /04
\.i1
TABLE 4.9. SERVICEABILITY INDEXES BY LANE, SECTION AND DATE (Y:)
--------------Date
--.----- ----Lane Design
Number Section May 1983 September 1983 February 1984 November 1984 May 1985
----I 2" fiR 2.37 3.49 3.36 3.37 3.24
2" R 3.66 3.35 3.45 2.89 3.19 3" R 2.67 2.78 2.99 2.56 2.62 3" F 3.57 2.44 2.24 2.13 2.12 2" F 4.21 2.36 2.28 2.06 2.32
2 2" NR 3.70 3.66 3.76 J.58 3.33 2" R 3.57 2.96 3.08 2.78 2.70 3" R 3.71 3.23 3.46 3.43 3.00 3" F 3.76 3.33 3.33 3.06 3.17 2" F 4.41 3.03 3.07 2.06 3.03
3 2" NR 4.11 3.06 3.07 3.00 3.03 2" R 3.92 3.22 3.46 3.32 3.32 3" R 3.89 3.44 3.61 3.50 3.14 3" F 4.08 2.61 2.64 2.45 2.62 2" F 4.44 3.25 3.59 3.45 3.22
4 2" NR 3.30 3.19 3.09 2.77 3.13 2" R 3.62 3.40 3.70 3.27 3.44 3" R 3.94 3.11 3.11 2.80 2.96 3" F 3.95 2.70 2.82 2.58 2.54 2" F 3.93 3.23 3.25 2.86 2.14
---
59
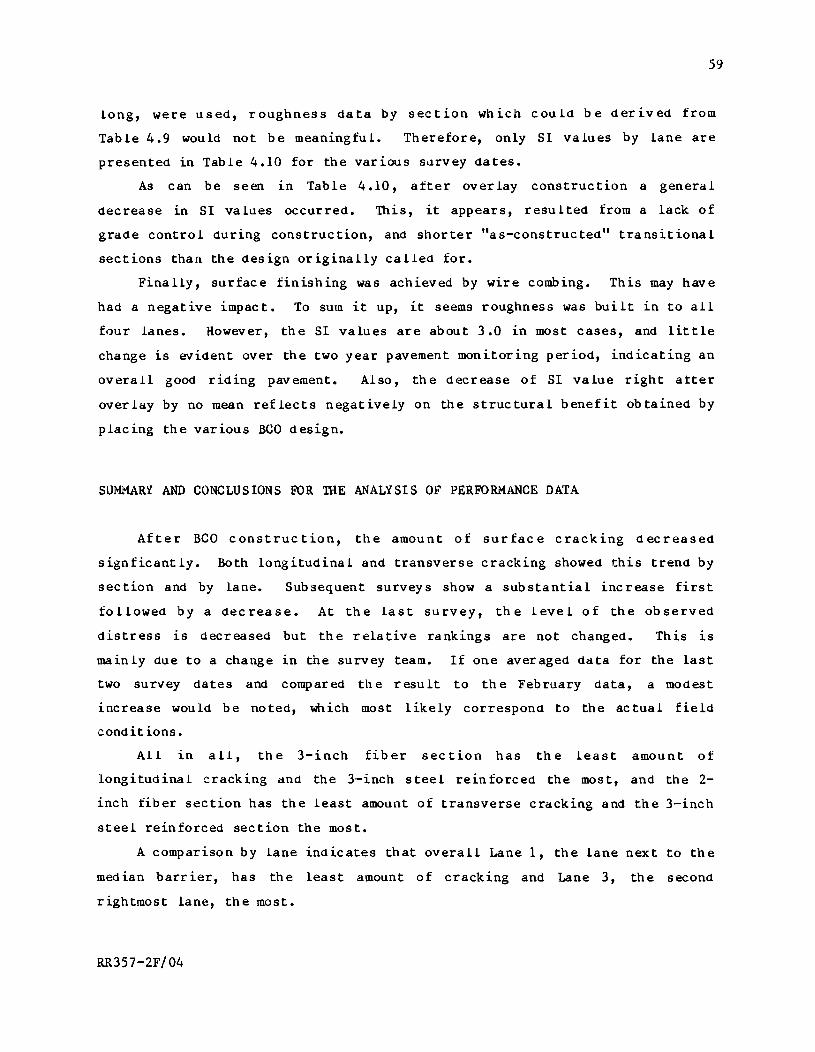
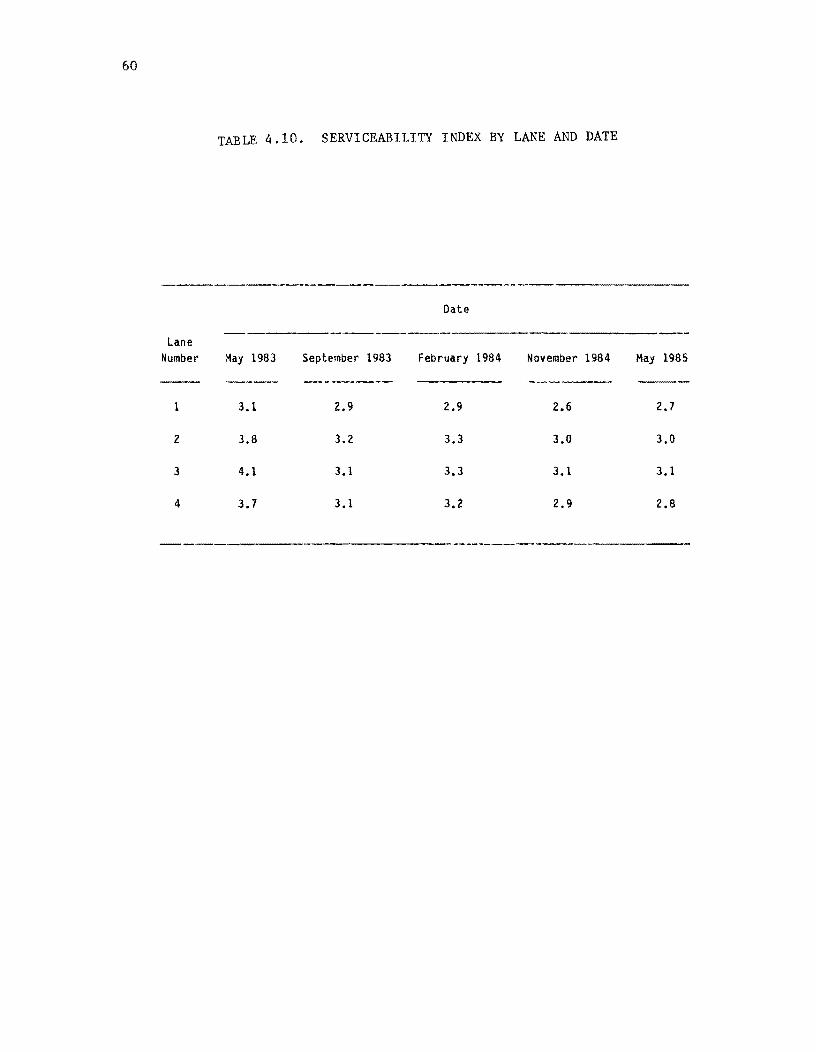
long, were used, roughness data by section which could be derived from
Table 4.9 would not be meaningfuL. Therefore, only SI values by lane are
presented in Table 4.10 for the various sllrvey dates.
As can be seen in Table 4.10, after overlay construction a general
decrease in SI values occurred. This, it appears, resulted from a lack of
grade control during construction, and shorter "as-constructed" transitional
sections than the design originally called for.
Finally, surface finishing was achieved by wire combing. This may have
had a negative impact. To sum it up, it seems roughness was built in to all
four lanes. However, the SI values are about 3.0 in most cases, and little
change is evident over the two year pavement monitoring period, indicating an
overall good riding pavement. Also, the decrease of SI value right after
overlay by no mean reflects negatively on the structural benefit obtained by
placing the various BCO design.
SUMMARY AND CONCLUSIONS FUR THE ANALYSIS OF PERFURMANCE DATA
After BCO construction, the amount of surface cracking decreased
signficantly. Both longitudinal and transverse cracking showed this trend by
section and by lane. Subsequent surveys show a substantial increase first
followed by a decrease. At the last survey, the level of the observed
distress is decreased but the relative rankings are not changed. This is
mainly due to a change in the survey team. If one averaged data for the last
two survey dates and compared the result to the February data, a modest
increase would be noted, which most likely correspond to the actual field
conditions.
All in all, the 3-inch fiber section has the least amount of
longitudinal cracking and the 3-inch steel reinforced the most, and the 2-
inch fiber section has the least amount of transverse cracking and the 3-inch
steel reinforced section the most.
A comparison by lane indicates that overall Lane 1, the lane next to the
median barrier, has the least amount of cracking and Lane 3, the second
rightmost lane, the most.
RR357-2F/04
60
TABLE 4.10. SERVICEABILITY INDEX BY LANE AND DATE
Date
--------Lane
Number May 1983 September 1983 February 1984 November 1984 May 1985
---- -----.-- ----- ---1 3.1 2.9 2.9 2.6 2.7
2 3.8 3.2 3.3 3.0 3.0
3 4.1 3.1 3.3 3.1 3.1
4 3.7 3.1 3.2 2.9 2.8
-----------
61
After a Imost two years of BCO placement, vir tually no crack showed
evidence of spalling.
The reader should recall that longituainal cracking and transverse
cracking are counted in different units and thus are not directly comparable.
Also, no distinct relationship is evident between the two types of cracking
(e. g., the most amount of longitudinal cracking, the least of transverse
cracking). Another point deserves serious consideration: although the
numbers ~n Tables 4.1 and 4.3 are close for the before construction and
secolld after construction conditions, the methodology usea for the condition
survey reveals nothing of the severity of the observed distress. Any visible
surface defect that could be seen was recorded and counted. For transverse
cracking, for example, the crack width or len6th was nut relevant.
Therefore, it is desirab le that some measure of severity be inc luded. If the
exact len6th of transverse cracks would be too time consuming to record and
process, then at least transverse cracks could be classified in two groups:
those which extend to one-half the lane width or more, and those which dO
not. Also, labels, such as close, normal, or open, could be attached to both
types ot cracks to denote severity.
The serviceability indexes estimated frum the GMR profilometer have only
slightly varied over the two-year monitoring periOd.
Overall, Lane 3 has the highest serviceability index and Lane 1 the
worst. Compare this result with the amount of cracking: the smoothest lane
has the most cracking.
The trend 10 serviceability index is ~n keeping with the before
construction condition, as of May 1983. Therefore, it can be hypothesized
that this parameter has reached a natural level and ranking (compare for
example the change 1.U Table 4.10 for the last three survey dates). Thus,
only minor changes can be expected in the next few years (i.e., the dllration
of BCO service life before fatigue occurs).
iUnS7-2F /04

CHAPTER 5. OVERLAi COST INFOIU1ATION
The purpose of thi.s chapter is to provide cost information which can be
used at the planning stage when various rehabi litation al ternat ives are being
consi,1ered. Cost to the agency and to the user of the facility are estimated
and reported llerein.
The reader should keep ~n mind the implications on cost analysis of the
experimental nature of this project; even if precise cost figures could be
determined, these would not be representative of typical jobs ill urban
areas, let alone rural Texas. Therefore, the cost figures reported herein
should be VieIJed. as best estimates within the realm of the assumptions made,
and as guidelines for future projects utilizing BCOs.
AGENCi COST
The experimenta 1 BCO sections were part of a larger roadway repair
program compr is ing 13 .882 miles of south Loop 610. The prime contrac tor for
the overall project was Simonsen Co., Inc., the lowest bidder. The
subcontractor involved in actual construction of the five test sections was
Stan Forde Construction Co., Inc. A summary of the mate ria l cost bid by
Simonsen is presented in Table 5.1 along with the average of the three lowest
bid and the engineer's estimate.
As would be expected, the unit price increased with thickness; note that
the most expensive material is tibrous concrete and that the unit price for
2-inch fiber concrete is about the same as the unit price for 3-inch steel
mat-reinforced concrete. Scarification of the base CRGP is about one-quarter
the average unit price for material.
The detailed cost on this experiment was obtained from the
subcontrac tor. It is informat ive to see the breakdOwn 0 f these cost s so that
efficiency may be sought on future projects.
his costs as follOWS:
RR35 7- 2F /05 63
The subcontractor broke down
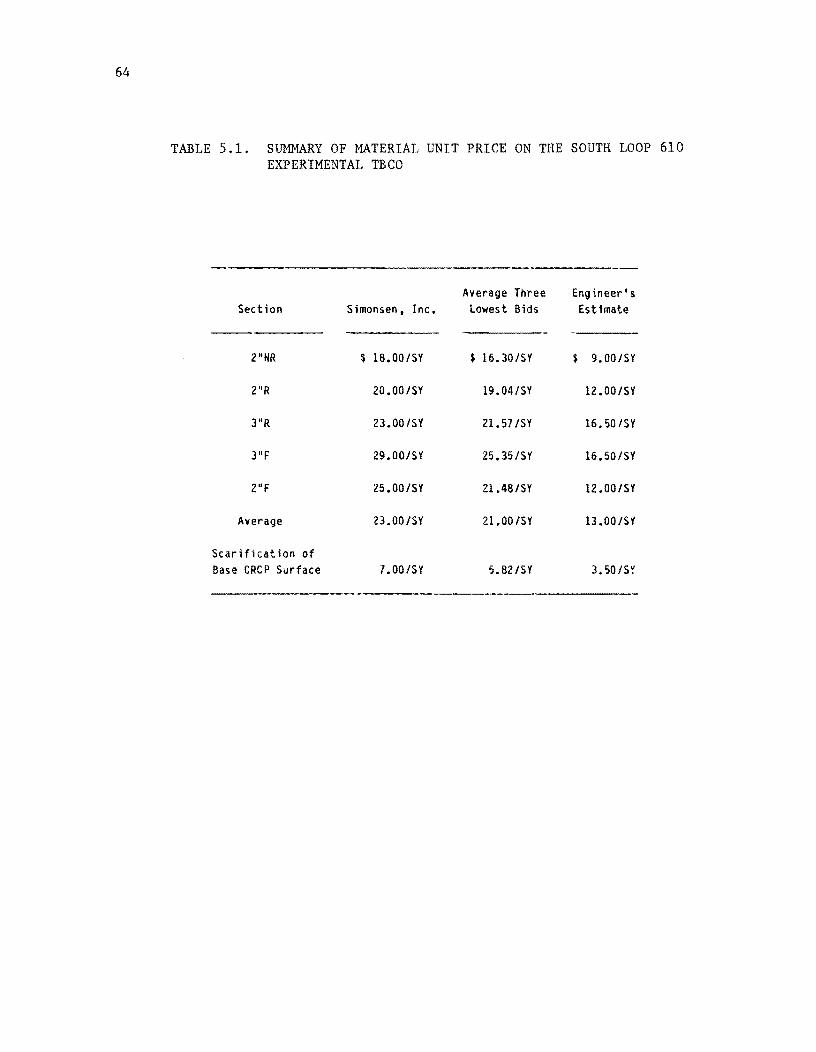
64
TABLE 5.1. SUMMARY OF MATERIAL UNIT PRICE ON THE SOUTH LOOP 610 EXPERIMENTAL TBCO
----------Average Three Engineer's
Section Simonsen, Inc. lowest Bids Estimate
2HNR $ 18.00/SY $ 16.30/SY $ 9.00/SY
2"R 20.00/SY 19.04/SY 12.00/SY
3"R 23.00/SY 21. 57/SY 16.50/SY
3"F 29.00/SY 25.35/SY 16.50/SY
2"F 25.00/SY Zl.48/SY 12.00/SY
Average 23.00/SY 21.00/SY 13.00/SY
Scarification of Base CRCP Surface 7.00/SY 5.821SY 3.50/5':'
------.--
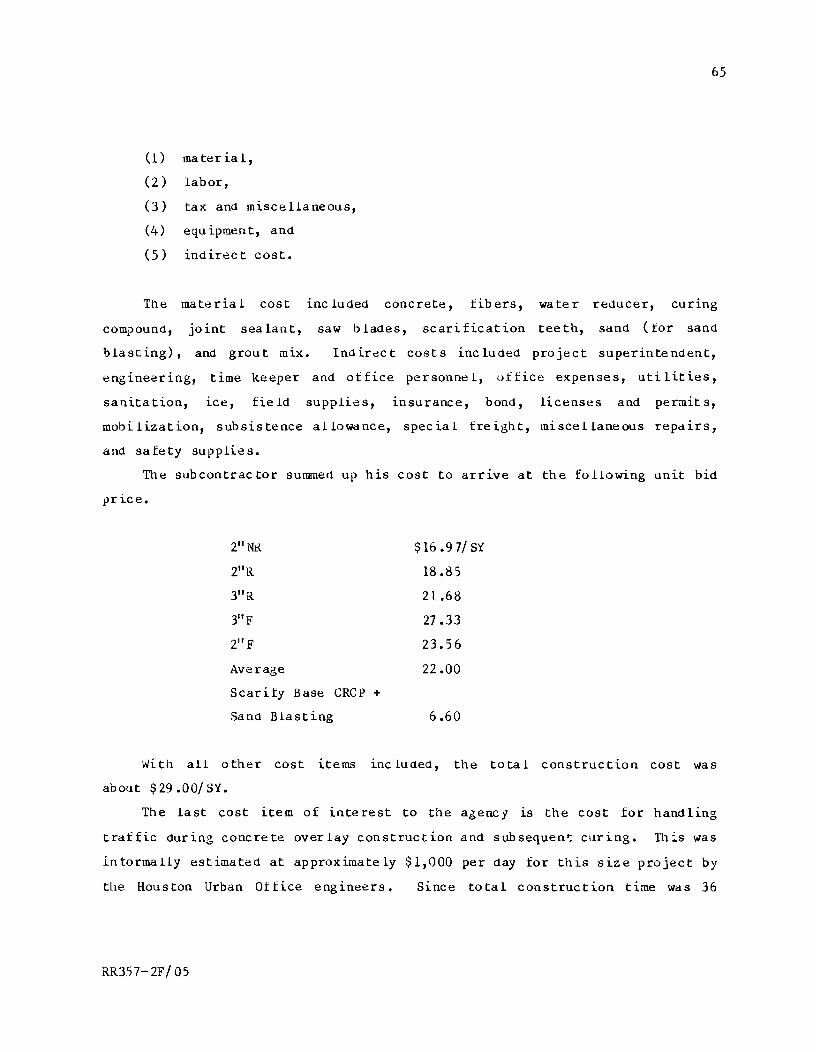
(1) ma t~r ia 1,
(2) labor,
(3) tax and miscellaneous,
(4) equipment, and
(5) indirect cost.
65
The material cost inc luded concrete, fibers, water reducer, curing
comround, joint sealant, saw blades, scarification teeth, sand (for sand
blasting), and grout mix. Indir~ct costs included project superintendent,
engine~ring, time keeper and office personnel, office expenses, uti lities,
sanitation, ice, field supplies, insurance, bond, licenses and permits,
mobilization, subsistence allowance, special. freight, miscellaneous repairs,
and safety supplies.
The subcontrac tor summec1 up his cost to arrive at the fa 11.0 wing unit bid
price.
2" Nt{ $16 .97/ S'{
2"R 18.85
3"R 21.68
3" F 27.33
2" F 23.56
Average 22.00
Scarify Base eRep +
Sand Bl.asting 6.60
With all. other cost items inc luaed, the tota 1 construction cost was
about $29.00/S'l.
The last cost item of interest to the agency ~s the cost for handling
traffic auring concrete overlay construction a.nd subsequen': curing. Thi.s was
informall.y estimated at approximately $1,000 per day for this size project by
the Houston Urban Office engineers. Since total construction time was 36
RR35 7- 2F / OS
66
days (July 22 - August 27, 1983) and 6 days were allowed for the curing
p~ri,)d, the unit cost for handli rl 6 traffic can be estimated at $8/SY.
USER COST
The cost to the user of a facility during rehabilitation includes delay
costs, costs associated ""ith changes in vehicle operational characteristics,
and accident costs. Howel/er, of all these costs, only delay and vehicle
()peration costs have been st.l<1ied and little is yet known of the relationship
between rehabilitation and accidents (i.e., no convincing data have shown
that certain rehahilitation practices cause traffic accidents).
The traffic delay cost model used in this stUdy was extracted from the
:ligid Pavement SJs tern - Version 3 (RPg-3) and incorporated in a c,)mpu tel"
program called USER-CST. The USER-CST program is ""ell <.tocument ed elsewhere
(Ref 17).
Basically, US~R-CST differentiates between asphaltic concrete and
Portland cement COQcrete overlays because of the longer curing period
required for PCC overlays. This was the case on the Loop 610 project. The
program accumulates costs on a twenty-four honr basis, distinguishing between
vehic 1e operational mode during construction time and time of the day when
constru·:tion does not occnr. Subsequently, costs are accumulated for the
wi1011~ construction period and the specified curing period.
lnrat tl) the progr-lln inc.ludes tratEie, traffiG delay, overlay, material,
constructiun, and interest rate. Output is in terms of present worth cost per
square yard.
Fi'Je traffic handling models are built into the program. The model used
Ul thiR stUdy assumes that two lanes are merged in the vicinity of the work
zone for the overlay direction but that the traffic flow is not affected in
the non-overlay direction (i.e., mojel nO. By and large, this scheme
reflects the practice followed throughout construction and evaluatioQ survey
for the Loop 610 project. However, the model fail" to recognize that I1sers
of the facility could choose alternate routes after an illitia1 learning
period. No effort was also devoted to keeping traffic CO'lnt or change in
RR35 7- 2F/ 05
67
traffic count duc.i.ng overlay construction dnd curing periods versus periods
{.",hen the traftic flow was unrestricted (i.e., either before or after
cO[1structi.o.] an(i curing periOd). For thi,:; reason, the program may over
estimate actual user cost on thi.5 experimental project.
Figure 5.1 presents the relevant input data, iacluding the asslHllptions
made, and output from the program. Note that tile current ADT is the result
of a recent traffic count at the experiment site. The four lane highway was
treated as two lanes (24 feet each) highway, to be compatible with the
traffic models inherent in the program. Finally, the constJ:'tlction rate was
back calculated to correspond to the 36-day construction period actually
neeaed fOr" th:.s experiment (this periOd includes waitirl~ out hurricane Alicia
and the sub.3equent unavailability of ice used to control concrete
temperature).
Within the realm of these assumptions, the total user cost is estimated
at $77.40/SY or ap2roximately 2.7 times the construction cost. Note that the
user cost.s \IIere actualized to 1978 figures in the USER-CST model. A more
rigorous analysis \IIOuld bring these costs to 1983 figures or bring the
construction cost back to 1978 figures. In either case, the relative
magnitUde of '.lser and a6ency costs wouLd be of the order .)f 3:1.
CONCLlJSIONS FOR THE COST STUDY
In ti1is study, the total cost of BeO placement was estimated [or the
south Loop 610 experiment. The unit constru,:tion cost was approximatelj
$29/St and the traffic handling cost was $8/St, for an agency cost of $37/St.
The user cost estimated in 1978 figures by the USER-CST model (Ref 17) was
$77. i 't-0/St, which becomes after adjustment for inflation, say 3 perc~nt per
year, $90/St.
Therefore, the best estimate of the total cost for the experiments BCO
13 !$l27/SY, of ;.lhich 30 percent is agency cost and 70 percent user cost.
Tl1is shows thdt, once started, BCO construction must proceed without delay in
ot"'l~r to keep the total cost do",n anc1 make it a ,ll')re competitive
cehabilitation alternative.
RR357-2F/05
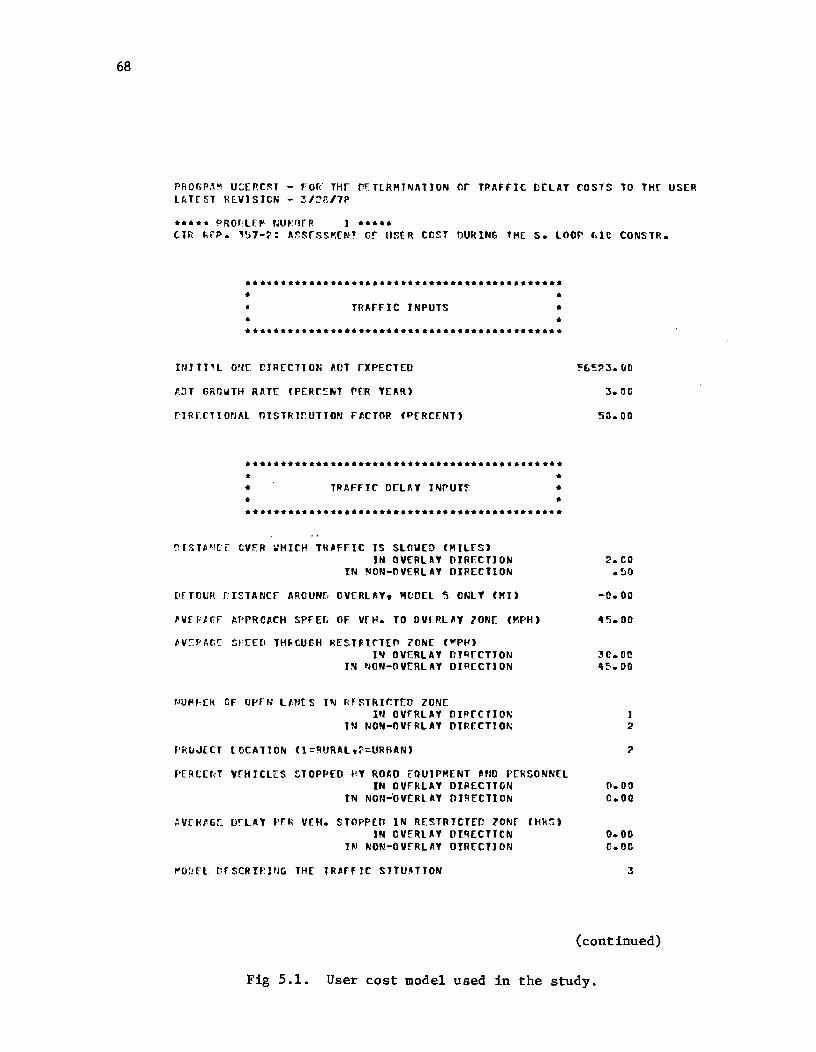
68
PROGP~~ U=[RC~T - FO~ THE D~T[RMI~ATJON or TPAFFIC DELAY COSTS TO THf USER L~TrST REVISICN - 3/~~/7P
**6*. PRorL[~ ~u~~rR ••••• tIR J;fP. ~'j7-~: ASSESSt';ENT Cf USER CCST DURING THE S. LOOP C,lC CONSTR.
• • •
TRAFFIC INPUTS
I~JTI~L ONE CJRECTION AUT rXPECTED
AOT GRO~TH RATE (PERC~NT rEp. YEAR)
rIR[CTIONAL OISTRlnUTIO~ [fCTOR (PERCENT)
• • •
••••••••• * ••••••••••••••••••••••••••••••••••• • • •
TRAFFIC DELny INrUT~ • • •
•••••••••••••••••••••••••••••••••••••••••••••
OIST'~CE eVER WHICH TRJfFIC IS SLOWEO (MILES) l~ OVERLAY OIRECTION
IN ~ON-nVERLAY DIRECTION
OfTCUH rrSTANCE AROUN~ OVERLAY. "DDEL ~ ONLY (HI)
'V[PtEf APPRCACH SPEED OF V[~. TO OVlRLAY lONE (MPH)
I',v:pr,cr. SFEE[l TH"CUGH RESHtCTED lONE O'NO l~ OVERLAY nT~[CTTON
IN 'JON-OVERL AY DIPECTI ON
~U~~(R OF OPEN LANES I~ RESTRICTEO lONE IN OVfRLAY DIprCTIO~
IN NON-OVfRLAY DIRECTION
PROJECT LOCATION (l=~URAL.~=URBAN)
P[RC[f<T VEHICLES ::'10PPEO I'Y ROAD EQUIPMENT ~flD PERSONN[L IN OV~RLAY DIRECTION
IN NON~OV[RlAY DJ~ECTION
~V[H'G[ orl.' PfR V[H. STOPPEO IN RESTRICTED lON[ (HRS) IN OVERLAY OIRECTICN
I~ NON-OVfRLAY DIRECTION
~OD[l nrSCRIPING THE lR~rFIC SITUATION
3.00
50.00
2. CO .~Q
-0.00
45.00
30.00 45.00
1 2
0.00 c.oo
0.00 o.oc
(continued)
Fig 5.1. User cost model used in the study.
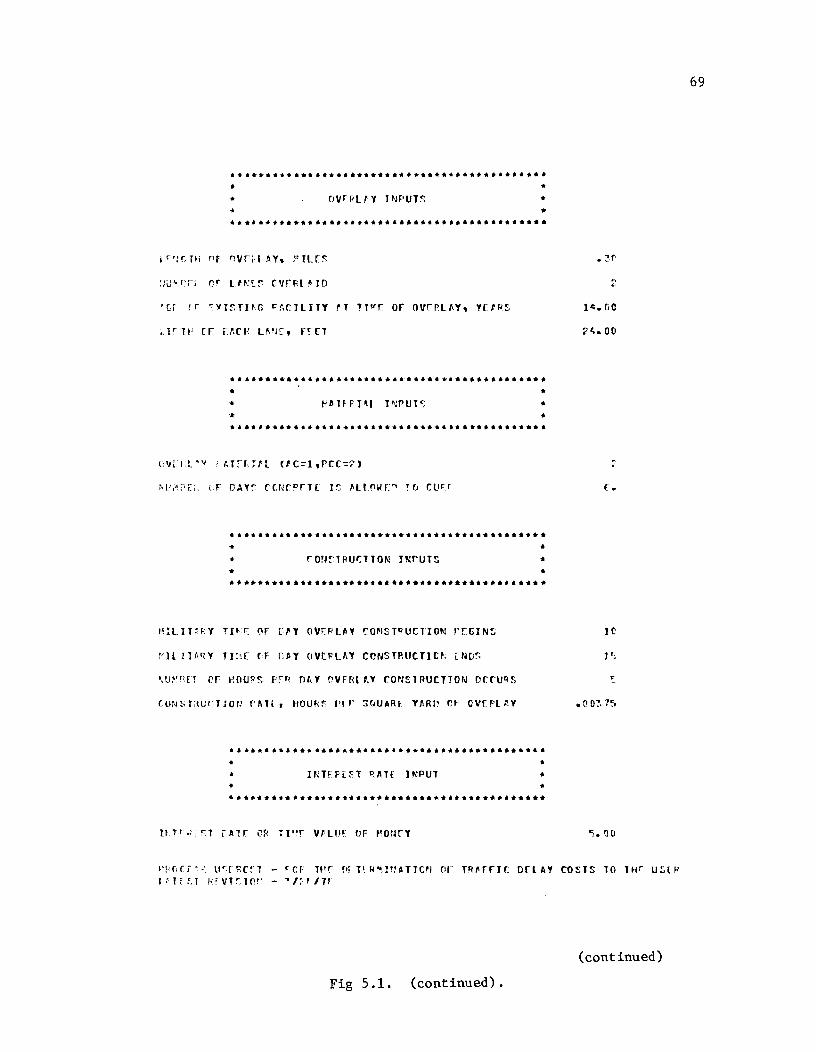
•••• * •••••••••••••••••••••• ' •••••••••••••••••• .. .. •
ovrfilf Y INPUTS .. •••••••••••••••••••••••••••••••••••••••••••••
jP)C IH nr '1VrH,I!,'Y. ~'IlrS
'GI (r ~VISTI~G r~(JlITY rT 'T~r Of OVrrlAY. yr/PS
•••••••••••••••••••••••••••••••••••••••••••••• .. .. *
..
.. .. •••• , ••••••••••••••••• * ••••••••••••••••••••••
••••••••••••••••••••••••••••••••••••••••••••• .. .. .. COU~lRUCTTON INrUTS .. .. •
•••••••••••••••••••••••••••••••••••••••••••••
FItIT[.f,y TJr'i( (JF n~Y oVCPU.'Y CONSTRlICTIU; ttm~
'.tJ~'''[f cr I~OU~'S fTH n~ Y {1V[Rt r.Y rONSTJlUCTJON DCfUQS
WTEFLn RAH ]NPUT .. •
•••••••••••••••••••••••••••••••••••••••••••••
n,TI". Sl j'A1[ OR il"f" V/ll.ll: UF ~orJrY
21,.00
f •
1C
1'5
>'Lr,u',,: w,rp.c~'l' fer' m r [t; l'.,II!",I'!,\T1CrJ £II" TRHfIC DflA' COSlS 10 lW U:;lf' IIlr~.T ",VT~Jnr' - ~/~"71
(continued)
Fig 5.1. (continued).
69
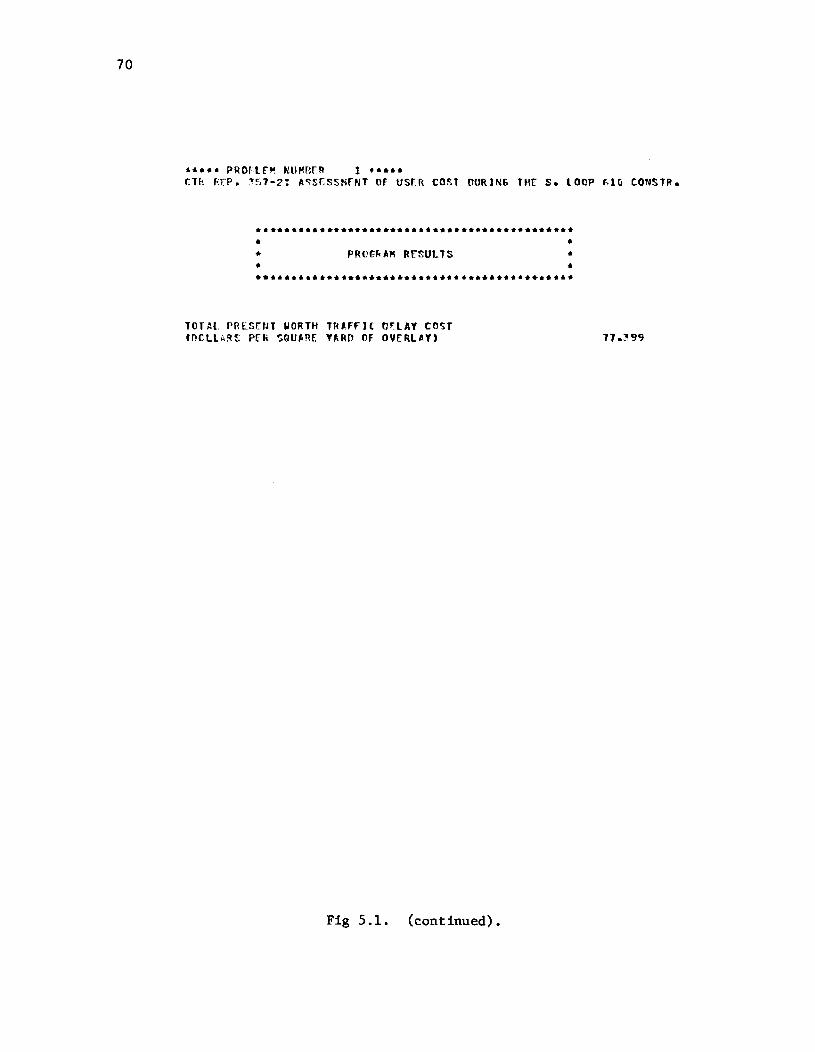
70
••••• PRO~Lr~ ~UMRrR 1 ••••• elk ~[P. ~57-2: A~S[SShrNT or USFR COST OURING THE S. lOOP ~10 CONSTR.
• • •
PRot~A~ RfSULTS
TorAl PRESENT WORTH TRAFFIC O(LAY COST rnCLl~~S PfR SQUARE YARD OF OVERLAY)
Fig 5.1. (continued).
• • •

71
Finally, note tilat these costs are indicative and should not be taken as
abso lu teo
R;D5 7- 2F lOS

CRAPTER 6. DISCUSSION OF RESULTS
This chapter discusses experience gained on the South Loop 610
experiment and contrasts it with other rehabilitation alternatives that may
have been considered. An assessment of the additional life resulting from
the placement of the five design sections is made, along with the number of
years it will take to exhaust the fatigue life that is now added to the
remaining lite of the old CRG pavement.
Results from laboratory experiments conducted during this study are also
presented and discussed.
OVERALL OBSERVATION
Three concrete paving materials and two overlay thicknesses were used in
the BCO experiment on South Loop 610, Houston. The three materials were
fibrous concrete, steel mat reinforced concrete, and plain concrete. The two
thicknesses were 2 and 3 inches. PeriOdic evaluation surveys of the test
sections indicate gOOd performance on most of the variables measured.
However a site inspection revealed that, unquestionably, the current
cond it ion of th e test sec tions is far superior to that prior to May 1983.
For example, the recorded cracks are in many cases hairline cracks.
that perspective, the experiment can be gauged as successful.
From
Fibrous concrete and steel-mat-reinforced concrete performed differently
with respect to cracking and deflection reducing capabilities. Fibrous
concrete is a more resilient material than steel mat reinforced concrete.
Although more brit t le, steel-.nat-reinforced conc rete is stronger. Fibrous
concrete is tougher. Therefore, when spalting does occur on the five test
sections, one would expect it to occur earlier on the steel-mat-reinforced
sections than on the fiber sections. This inference is based on field
observation which revealed the prevalence of microcracking (D-cracking) along
longitudinal saw-joints in the steel mat reinforced sections but found
virtuaUy none along the same joints in the fiber sections. It is expected
RR357-2F/06 73
74
that the material inside the D-cracking will elTentually chip off, resulting
1n a spall.
The data in Table 3.4 indicate that average slumps and Chace air values
were higher in the fiber sections than in the no-fiber sections. There is a
concern that these tests may not be relevant for quality control or quality
assurance of fibrous concrete under field paving conditions and thus, other
avenues should be explored (e.g., flow table for workability).
The base pavement for the South Loop 610 experiment is an 8-inch CRCP.
The reader should keep in mind this important factor when examining the
performance of the BCO sections. Other important factors to consider are
environment and traffic; loadings. The information obtained on this project
can be extended to cover other conditions through more experimentation.
In the 2-inch thick steel-.nat-reinforced section, approximately 20 feet
were tried without a bonding grout, and no adverse effect seems to have
resulted. Note that laboratory testing has shown that the use of a bonding
agent, cement grout 1n this case, resulted in a marginal increase in the
interface shear strength when the pavement was dry, and that the most benefit
of '~sing a bonding grout was achieved when the pavement surface was wet.
Other important results from the laboratory study include the following:
(l) Scarifying the base pavement yields a roughened surface which
allows for a better bond between the old and new pavements.
(2) The reinforcing steel position in the thin overlay has little
impact on the strength as measured in a bond pullout test. Whether
the reinforcing steel was at the interface between the original
slab and the overlay or at middepth within the overlay pavement,
the steel failed in tension before the bond strength was reached.
Therefore, from the view point of practical considerations, time
and money saved, it is better to lay the reinforcing steel flat on
top of the prepared base pavement when the steel mat reinforced
design 1S adopted in BCQ construction without any fear of bond
failure.
RR357-2F/06
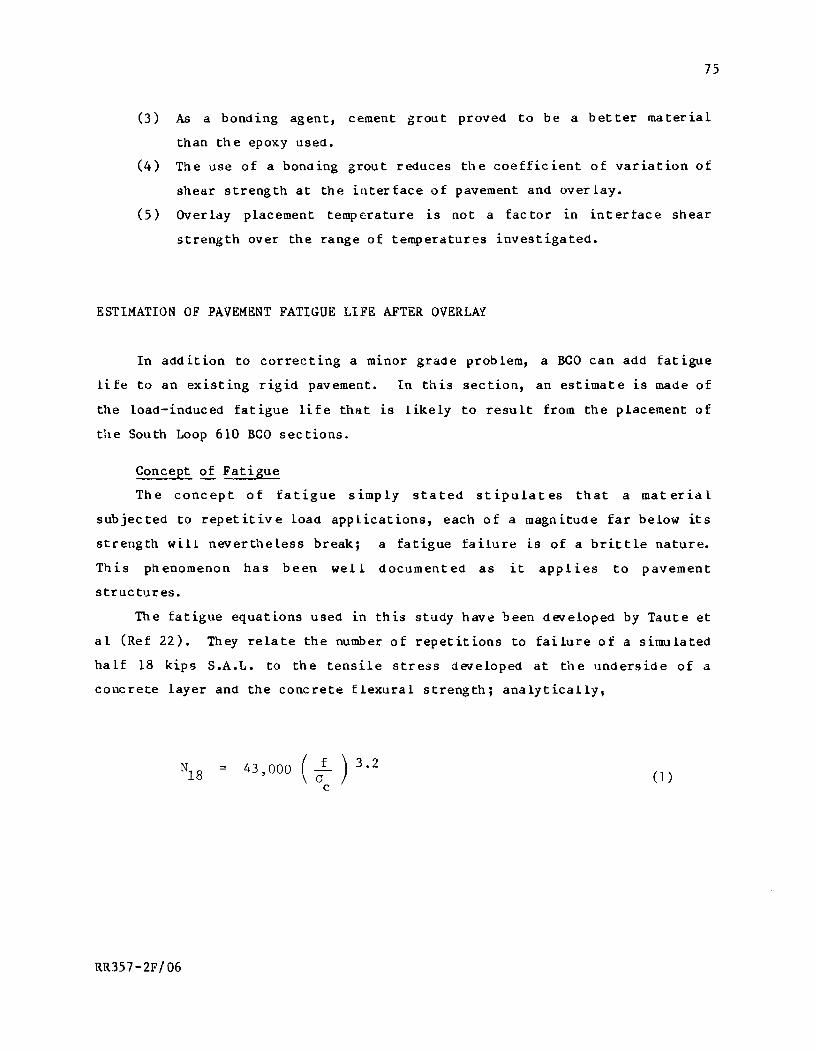
75
(3) As a bonding agent, cement grout proved to be a better material
than th e epoxy used.
(4) The use of a bonding grout reduces the coefficient of variation of
shear strength at the interface of pavement and overlay.
(5) Overlay placement temperature is not a fac tor in interface shear
strength over the range of temperatures investigated.
ESTIMATION OF PAVEMENT FATIGUE LIFE AFTER OVERLAY
In addition to correcting a minor grade problem, a BCO can add fatigue
life to an existing rigid pavement. In this section, an estimate is made of
the load-induced fatigue life that is likely to result from the placement of
the South Loop 610 BCO sections.
Concept of Fatigue
The concept of fatigue simply stated stipulates that a material
subjected to repetitive load applications, each of a magnitude far below its
strength will nevertheless break; a fatigue failure is of a brittle nature.
This phenomenon has been well documented as it applies to pavement
structures.
The fatigue equations used 1.n th is study have been dt?lleloped by Taute et
al (Ref 22). They relate the number of repetitions to failure of a simulated
half 18 kips S.A.L. to the tensile stress dt?lleloped at the underside of a
co\~rete layer and the concrete flexural strength; analytically,
43,000 (af )
c
3.2 (1)
RR357-2F/06
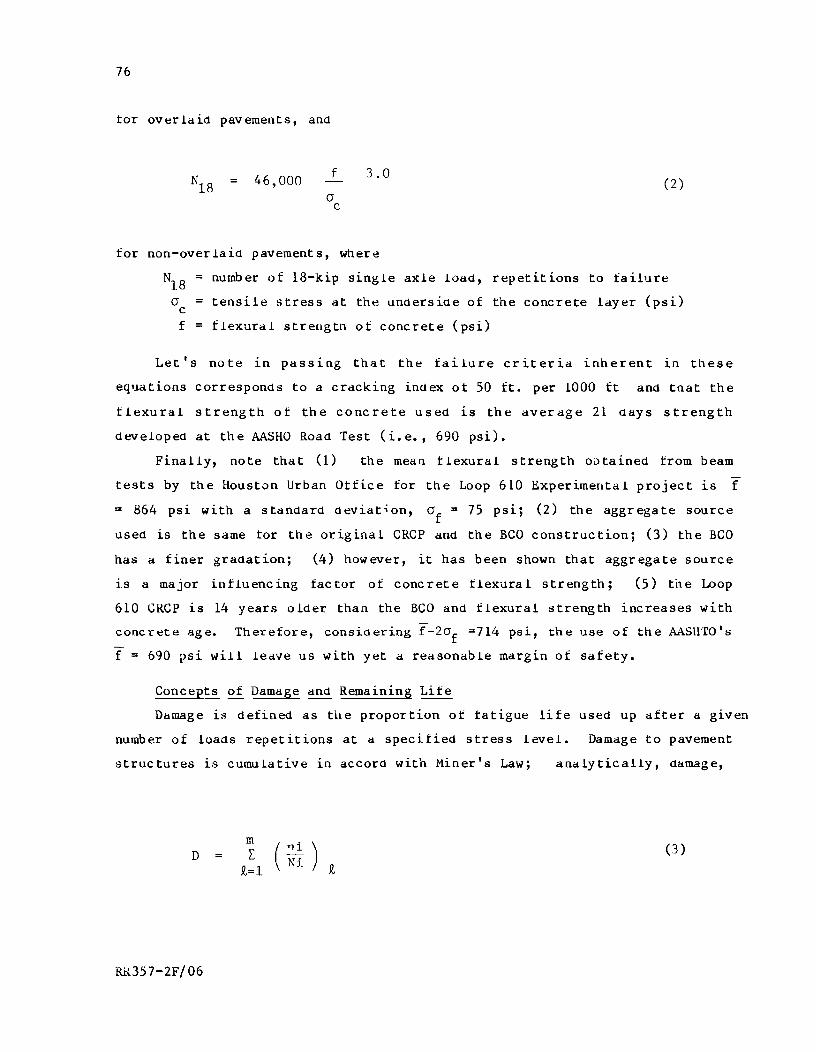
76
tor overlaid pavements, and
46,000 f
a c
3.0
for non-overlaid pavements, where
(2)
N18
= number of 18-kip single axle load, repetitions to failure
a = tensile stress at the undersiae of the concrete layer (psi) c f = flexural strength of concrete (psi)
Let's note 1n passing that the failure criteria inherent in these
equations corresponds to a cracking index of 50 ft. per 1000 ft and that the
flexural strength ot the concrete used is the average 21 days strength
developed at th e AASHO Road Test (i. e., 690 psi).
Finally, note that (1) the mea[l tlexural strength o;)tained from beam
tests by the Houston Urban Otfice for the Loop 610 Experimental project is f
= 864 psi with a standard deviat1on, a = 75 psi; (2) the aggregate source f
used is the same tor the original CRCP and the BCD construction; (3) the BCD
has a finer gradation; (4) however, it has been shown that aggregate source
is a major influencing factor of concrete flexural strength; (5) tile Loop
610 CRCP 1S 14 years older than the BCD and flexural strength increases with
concrete age. Therefore, considering f-2af
=714 psi, the use of the AASllTO's
f = 690 psi will leave us with yet a reasonable margin of safety.
Concepts of Damage and Remaining Life
Damage is defined as the proportion of tatigue life used up after a given
number of loads repetitions at a specified stress level. Damage to pavement
structures is cumulative in accord with Miner's Law;
D
RK357-2F/06
rn L
Q.=l
analytically, damage,
(3)
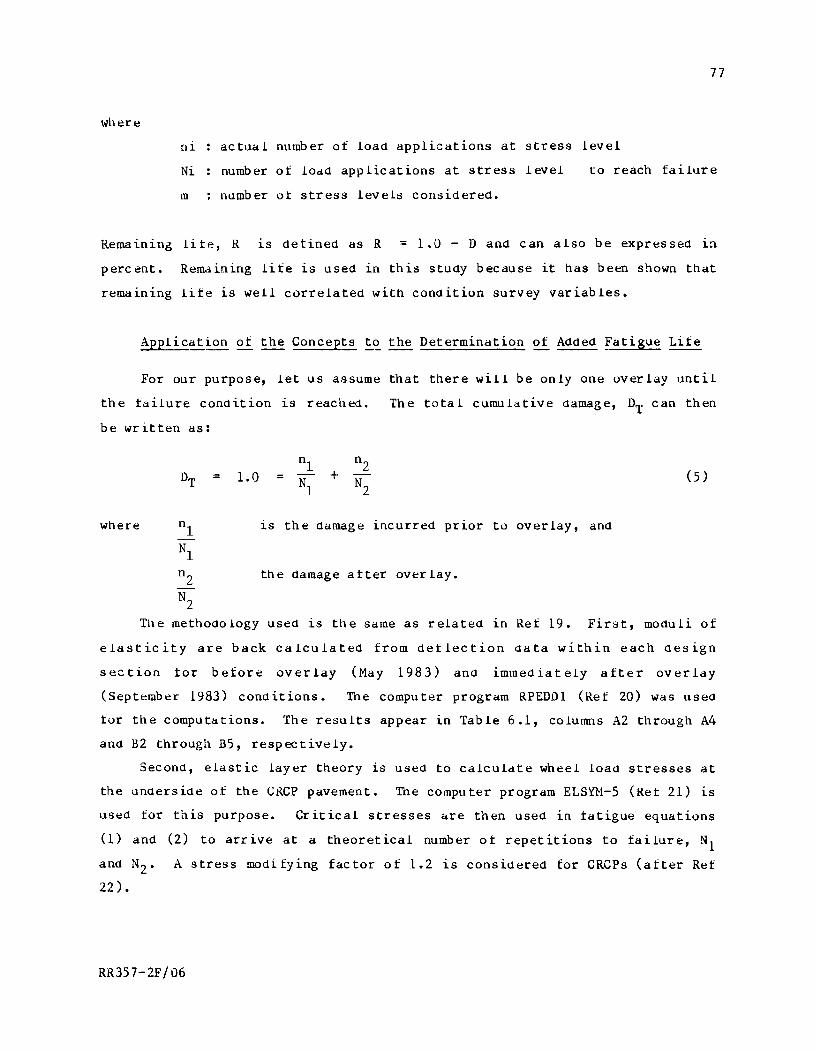
77
where
n~ actual number of load applications at stress level
Ni number of load applications at stress level to reach failure
m number ot stress levels considered.
Remaining lite, R is detined as R = 1.0 - D and can also be expressed in
percent. Remaining lite is used in this stUdy because it has been shown that
reroa~n~ng life is well correlated with condition survey ~ariables.
Application of the Concepts ~~ the Determination of Added Fatigue Life
For our purpose, let us assume that there will be only one overlay until
the tailure condition is reached. The total cumulative damage, DT can then
be written as:
where n1
N1 n
2
N2
= 1.0 = + (5 )
is the damage incurred prior to overlay, and
the damage atter overlay.
The methOdology used ~s the same as related in Ref 19. First, moduli of
elasticity are back calculated from detlection data within each aesign
section for before overlay (May 1983) and immediately after overlay
(September 1983) conditions. The computer program RPEDDI (Ref 20) was used
for the computations. The results appear in Table 6.1, columns A2 through A4
and B2 through BS, respectively.
Second, elastic layer theory is used to calculate wheel load stresses at
the underside of the eRCP pavement. The computer program ELSYH-5 (Ret 21) is
used for this purpose. Critical stresses are then used in fatigue equations
(1) and (2) to arrive at a theoretical number at repetitions to failure, N1
and N2 • A stress modifying factor of 1.2 is considered for CReps (after Ref
22) •
RR35 7-2F /06
78
Therefore, the number of load applications the system can sustain after
overlay, n2 , is such that,
(6 )
where the expreSSl.on in parenthesis represents the remaining life of the
original pavement at the time of overlay, i.e.,
= (7)
and N2 is the theoretical number of applications to fa.ilure of the pavement
over lay system.
Note that NZ is calculated using the fatigue equation for overlaid
pavements and that the stress is taken to be the stress at the bottom of
layer Z. The reason for this is apparent from Fig 6.1.
After overlay, the remaining life of the BCa decreases rapidly until it
reaches that of the original pavement primarily due to ref If.lCtioil cracking.
Thus,
690 3.0 Nl = 46,000 ( and
° x stress factor Col A.S
NZ 43,000 ( 690 3.2
° Col B. x stress factor
(*Column A.S refers to column S in Table 6.1(a); column B.6 refers to column
6 in Table 6.1(b» and finally,
= x 43,000 ( °Col B.6
690 ) ----------- 3.2 x stress factor
(8)
As can be seen from this expression, the number of load repetitions to
failure after overlay, n 2 is dirf.lCtly proportional to the remaining life of
the original pavement at the time of overlay. This suggests that more
benefit will be achieved if the Bca is placed when r L is still high.
To calculate remaining life at the time of overlay placement, damage is
first estimated under the following assumptions:
RR357-2F/06
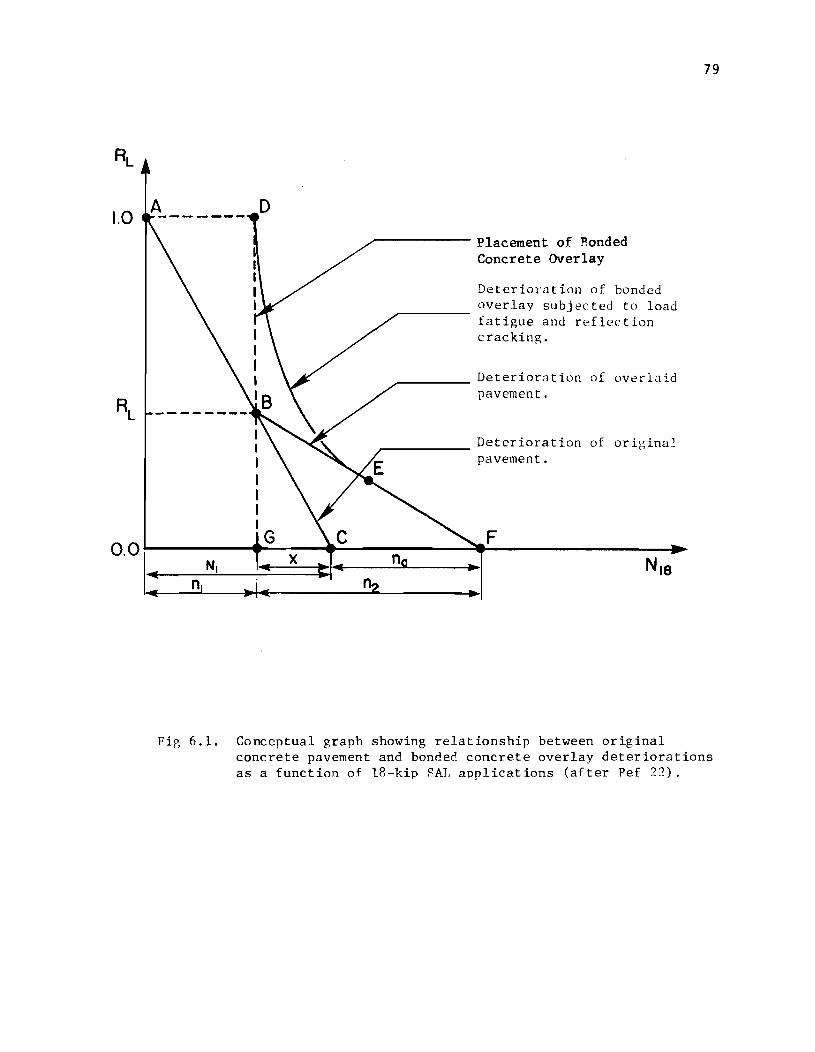
1.0 D
~-----------Placement of Bonded Concrete Overlay
Deterioration of bonded overlay subjected to load fatigue and reflection cracking.
Deterioration of overlaid pavement.
Deterioration of original pavement.
79
F 00°
1
_....-----.!N~I ___ ~~~_.-.:....:.n:!L-a -~:II ~o:~~nl ___ ~~ ________ ~~ ______ --'_I
Fig 6.1. Conceptual graph showing relationship between original concrete pavement and bondec concrete overlay deteriorations as a function of 18-kip SAL applications (after Fef 22).
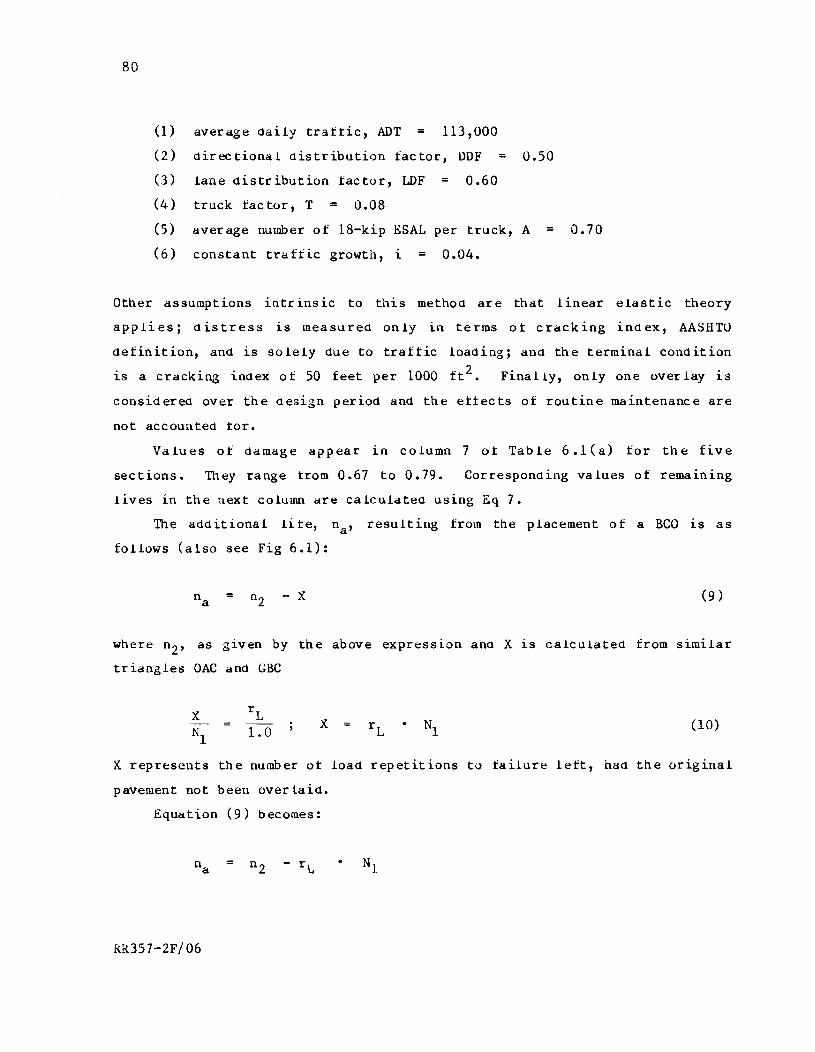
80
(1) average daily traffic, ADT = 113,000
(2)
(3)
(4 )
directional distribution factor, DDF
lane distribution factor, LDF 0.60
truck fac tor, T = 0.08
= 0.50
(5) average number of l8-kip ESAL per truck, A = 0.70
(6) constant traffic growth, i = 0.04.
Other assumptions intrinsic to this method are that linear elastic theory
applies; distress is measured only in terms ot cracking index, AASHTO
definition, and is solely due to traffic loading; and the terminal condition
is a cracking index of 50 feet per 1000 ft2. Finally, only one overlay is
considered over the design period and the effects of routine maintenance are
not accounted tor.
Values of damage appear in column 7 of Table 6.1(a) tor the five
sections. They range trom 0.67 to 0.79. Corresponding values of remaining
lives in the uext column are calculated using Eq 7.
The additional lite, n a , resulting from the placement of a BCO is as
follows (also see Fig 6.1):
= - X (9 )
where n 2 , as given by the above expressi.on and X is calculated from similar
triangles OAC and GBC
X (10)
X represents the number ot load repetitions to failure lett, haa the original
pavement not been overlaid.
Equation (9) becomes:
=
RR357-2F/06
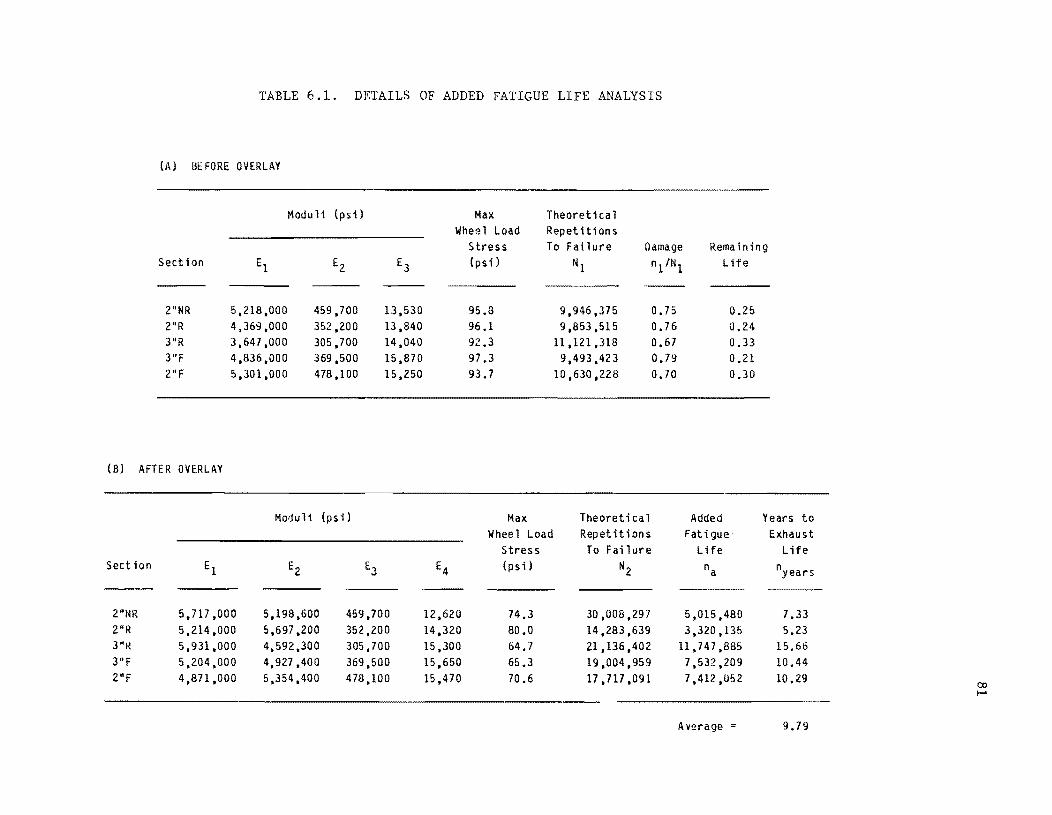
TABLE 6.1. DETAILS OF ADDED FATIGUE LIFE ANALYSIS
(A) BE FORE OVERLAY
Modu 11 (DS i) Max Theoretical Wheel Load Repetitions
Stress To Failure Damage Remaining Section E1 EZ E3 (psi) N1 n11N· Life
2"NR 5,218,000 459,700 13,530 95,8 9,946,375 0,75 0,25 2"R 4,369,000 352,200 13 ,840 96.1 9,853,515 0.76 0,24 3"R 3,647,000 305,700 14.040 92.3 11.121,318 0,67 0,33 3"F 4.836,000 369.500 15,870 97.3 9.493.423 0.79 0.21 2"F 5.301.000 478,100 15.250 93.7 10,630.228 0.70 0.30
(8) AFTER OVERLAY
Moduli (psi) Max Theoret; ca 1 Added Years to Wheel Load Repet it i on s Fati gue Exhaust
Stress To Failure Life Life Section E1 EZ E., E4 (psi) N2 na nyears ...
2"NR 5.717,000 5.198,600 459,700 12,620 74.3 30,008,297 5,015,480 7,33 2"R 5,214,000 5,697.200 352.200 14.320 80.0 14,283,639 3,320.135 5,23 3"~ 5,931.000 4,592.300 305,100 15.300 64.7 21,136,402 11,741,885 15.66 3"F 5,204.000 4,927.400 369,500 15,650 65,3 19,004,959 7,532,209 10.44 2"F 4,871,000 5,354,400 478,100 15,470 70.6 17 ,717 ,091 7,412.052 10.29 co .....
Average 9.79
82
anel substituting n2 and Nl by previollS expressions:
43,000 (_cr __ 6_9_0 __ S_Fj3.2
Col B.6 X (
_69_0 )3.0 rL 46,000 cr
col A.S x SF
finally,
~.:Ox SF)r) n = a 46,000 (cr Col (10)
The results of the addeel fatigue lite na are presented in Table 6.1-
This represents the additional fatigue craclting life that is "bought" by
placing a BCD.
The values for na are in column 8 of Table 6.1(b). The next and final
column represents the estimated values of fatigue life in years, nyears that
it will take under prevailing traffic conditions (Le., current traffic and
assumetl growth rate of 4 percent) to consume the additional lives, na. This
comes to be 9.8 years on average for this section of roadway on South Loop
610. In other words, after the time required for the prevailing traffic to
cause failure of the original CRCP, and additional 9.8 years will be
available. The lite of the overlaid pavement can be estimated by summing the
life remaining in the existing pavement (X) and that provided by the overlay
This results in an expecteel life of over 13 years assuming no
maintenance.
WAl{RANTS OF BONDED CONCRETE OVERLA'l S
At a recent symposium held at the Balcones Research Center of The
Univers ity of Texas at Aust in with highway engineers from Texas, contrac tors
and industry representatives, the following known and potential advantages of
bonded concrete overlays were mentioned at the symposium:
(1) The use of a bonded concrete overlay has the potential to reduce
user cost; to reeluce delays during construction, and to reduce
operating costs due to a smoother riding surface.
RR357-2F/06
83
(2) A bonded concrete overlay placed on a pavement 1.n good condition
will extena its fatigue lite.
(3) A bonded concr~te overlay is warranted on the basis of taster
construction than complete reconstruction; the technology does now
exist for bonded concr~te overlays. However, the us~ of a BCO must
be justified if it is to be the appropriate solution.
(4) The use of bondea concr~te overlays would allow a pavement agency
to utilize the cost savings for other rehabilitation projects
because the operation is Less costly than, say, complete
restorat ion.
(5)
(6)
Bonded concrete overlays
friction/skid resistance
pavement.
can be warranted on
and riding quality of
the
the
basis of
existing
A bonded
where an
concrete overlay would cocr~ct under-design (in cases
unexpected increase in traffic volume or load limit
occurs) •
(7) Physical fac il it ies and roadway geometry such as bridges, grade
control may warrant bonded concrete over lays, over unbond~d (hence
thicker) ov~rlays over unbonded. ov~rlays.
(8) The use of a bonded concrete overlay is warranted if it can be
shown that it is a competitive alternativ~. Length of pavement and
total bonded concrete overlay quantity that may be placed at one
time (e.g., total square yardage) before the method is cost
effective must be examined.
RR357-2F/06

CHAPTER 7. GENERAL CONCLUSIONS AND RECOMMENDATIONS
In this chapter, the principal results reported throughout the study are
assembled and organiZed for conciseness. Conclusions stemming from the study
are presented first, followed by recommendations for this project and future
research in the use of BCOs.
CONCLUSIONS
This study warrants the following conclusions:
(1) The constructibility of the various thin-bonded concrete overlay
designs has been amply demonstrated; with current paving materials
and equipments, it is possible to build BCO of rigid pavements as a
viable rehabilitation alternative.
(2) In BCO construction, a mixture of water, cement, and plasticizer 1.S
an adequat e bond ing agent.
(3) BCO design sections, lane number, and survey dates had a
significant effect on the observed variation of the Dynaflect
deflections in the South Loop 610 experiment.
If lane number is considered a surrogate variable for traffic
loading (the heavy trucks are usually 1.n the right lanes, and
weaving is at a minimum over the 1,000-foot-long test sections)
then an equivalent statement is that traffic level and intensity,
BCO thickness, and concrete reinforcement influenced the load
carrying capacity of the pavement structure.
(4) The observed variation in the Dynaflect deflections cannot be
explained by the combined, additive effects of section, lane, and
survey date alone. These factors interact. For example, the
variation of Dynaflect deflections explained by the sections
depends on the lane number.
RR357-2F/07 85
86
(5) Immediately after overlay construction, it was found that the 3-
inch thick, steel mat reinforced section was the most effective
design in reducing Dynaflect surface deflections.
(6) After overlay construction, the effects or cracking indicator were
no longer signi ficant. A different formulation of this statement
1.S to say that (at least for sensor 1) the construction of BCO re
establishes load transfer across the CRCP cracks.
(7) For a low level of traffic loading, 2- and 3-inch thick BCO
resulted 1.n statistically the same reduction of Dynaflect
deflections.
(8) For a high level of traffic loading, 2- and 3-inch BCO performed
differently 1.1l reducing surface deflections.
(9) The level and intensity of traffic for which the BCO thickness
effect becomes significant 1.S lower for the fiber sections than for
the steel mat sections.
(0) For 2-inch thick BCO, fiber-reinforced and steel-mat-reinforced
sections per formed different ly in their abi lity to reduce sur face
deflections.
(11) For 2-inch-thick BCO, the inclusion of fiber 1.n the paving concrete
mix, resulted in a significant change in the deflection basins
irrespective of past traffic loadings.
(12) For 2-inch-thick BCO, the inclusion of steel mat in the paving
concrete mix resulted in a significant change in the deflection
basins only when past traffic level and intensity had been high.
(13) For 3-inch-thick BCO, the two materials investigated performed the
same 1.n reducing surface deflections, except when past traffic
loading had been high.
(14) Overall, the type of movement across cra,;ks experienced by the BCO
sections and the underlying CRCP is the same (Le., expansion or
contraction); the BCO and CRCP seem to act as a monolithic
s truc ture.
(15) Two to three years after BCO placement no significant debonding
seems to have occurred.
RR357-2F/07
87
(16) The fiber sections proved to be far superior 1n their ability to
control longitudinal and transverse cracking.
(17) After almost two years of BCO service virtually no crack showed
evil! enc e of spalling.
(18) For the SUCceSS1ve survey dates, only a modest decrease of
serviceability index was noted in all four lanes.
(19) Unit construction cost WaS estimated at $29/SY on this experimental
projec t, and agency cost at $ 37/ S'f. inc luding traffic hand ling.
Agency cost was about 30 percent of total cost.
t{EGO~1ENDATIONS
(1) The five test sections on South Loop 610 have been monitored for
approximately two years. During this period, satistactory
performance has been noted on most of the pavement response
(2 )
variables. However, the long term performance still needs to be
established. Therefore, careful periodic evaluation surveys need
to be conducted in order to meet this important objective. Only in
this way can the state-of-the-art be advanced.
Short of test tracts or a full-scale road test,
pro j ec ts such as construc ted on Sou th Loop 610,
experimental
Houston, will
provide invaluable information at relatively low cost for the
design and construction of BCOs. Thus, such experiments should be
carefully designed and constructed so as to yield definitive
answers. The area of past and future traffic loadings of these
projects deserves particular attention. A new methOdology which is
now emerging, the weigh-in-motion technique (Ref 18), could be used
to adVantage to gatLler lanewise data on traffic level and
intensity.
(3) To improve the quality of ride as measured by the GMR profilometer,
stringent grade control requirements should be inc luded in the
RR357-2F/07
88
specifications for construction of BCO and/or equipment capable of
de l ivering the desired pavement smoothness sp.'!c i_ Eied.
(4) Are a sot f u t u r ere sea r c h w h i c h co u 1 d b e in v est i gat ed 1. n
experimental projects inclu(j'~ evaluation ot v':irious surface
preparation techniques for type, amount, and cost effectiveness
(e.g., compare scarifying, shot blasting, and aci.d etching) and
experimenta tion with var1.OUS "exotic" materia ls (poly propy lene
fibers, latex mo,1ified concrete, $uper plastieizect concrete, etc.).
(5) Still, field work on BCO needs to address mode of failure of
:).,Terlay pavement st("llctures. t\.lso, ,.,hether the interface bond
el1dur es over the service life of the BCO or whether it fatigues and
fails along ~ith the base slab and the overlay needs further
research.
(6) It is recommended that tlle lHtlire of bond failure be studied
carefully. Whether loss of bond 1.S localized or generalized by
and how to remedy either situation (e.g., BCO anchorage or
special end tr.eatment) should be considered during long term
evaluation surveys of BCO experiments.
(7) Deb,)nding in South L'Jop 610 should be checked 1.n subsequent
surveys. The Delamtech machine, which has been used 1.n Iowa, could
be used for til LS pnrpose. Other avenues whic~ !lold promise i'lclude
\J:i'Je propagation and thermo!;raphy techniques.
(8) The two levels of Ben thickness used in this experi-neat may have
been too close together. Trying extreme values (e.g., 2 and 5
inches) with suitable transition $t:!ctions is reco!llmended.
(9) Along with fi.eld test ing, laboratory work and theoretical ana lyses
should be conducted to advance the state-of-the-art in BCO d-<!sign
':ina construction.
(0) A laboratory experiment should evaluate suitable tests for quality
~')ntrol/quality a~surance ()F. fiber reinforced .:.)llCrete in its
application for BCO in the f-i ~ld.
RlU57-2F/07

89
(11) Theoretical analyses of BCO should include mechanistic design,
predict fatigue lite, and find optimum overlay thickness and
interface bond strength requirements.
RR357-2F/07


KEFERENCES
1. "Innovative Highway s: A New Era Begins, II Trans portation Res earch News, No. 113, Transportation Research Board, July-August 1984.
2. Haas, Ralph C., and W. R. Hudson, Pavement Management Systems, McGraw Hill Book Co., New York, 1978.
3. "Pavement Manag~ment Guide, II Roads and Transportation Association of Canada, Ot tawa, Canada, 1977.
4. "Pavement Management System Development," NCHRP Report 215, Transportation Research Board, November 1979.
5. Kandiah, Kailasananthan, B. Frank McCullough, and D. W. Fowler, "A Study of the Effects of Interface Condition on Thin Bonded PCC Overlays," Research Report 357-1, Center for Transportation Research, The University of Texas at Austin, Austin, Texas, uctober 1984.
6. Knutson, M. J., "Introduction to Concrete Overlays," 15th Annual ICPA Workshop, Des Moines, Iowa, February 15, 1979.
7. Bergren, V. Jerry, "Bonded Portland Cement Concrete Resurfacing," Divis ion ot Highways, Iowa Department of Transpor tat ion, Ames, Iowa.
8. Federal Highway AdlDinistration, "Highway Statistics,1I U. S. Government Printing Office, Washington, D. C., 1980.
9. Walpole, Ronald E., and Raymond H. Hyers, Probability and Statistics for ~~~neers and ~£~~~~sts, 2na Edition, MacMillan Pub liflhing Company, Inc., New York, 1978.
10. Nie, Norman H., et al, Statistical Package for the Social Sciences, 2nd Edition, McGraw-Hill Book Company, New York, 1975.
RR357-2F/RR 91

92
11. "1977 Condition Survey Concrete Resurfacing Plain and Reinforced Concrete," Portland Cement Concrete Association and American Concrete Pavement Association, Skokie, Illinois, 1978.
12. Winer, B. J., _~t:.~~~l!.ti~! Pr0~~E.les in Exp~ri~~~! De:!ign, Second Edition, McGraw-Hill Book Company, New York, 1971.
13. Rohlf, John G., and Ramey O. Rogness, "Multivariate Analysis of Pavement Dynaflect Deflection Data," 64th Annual Meeting of the Transportation Research Board, Washington, D. C., January 1985.
14. Morrison, Donald F., Mult~vari~te Statistical M~thodS, McGraw-Hill Book Company, New York, 1967.
15. "Operating Instructions Multi-position Strain Gauge," Soil Test, Inc., Evanston, Illinois, March 1979.
16. Gutierrez de Velasco, Manuel, and B. Frank McCullough, "Rigid Pavement Network Rehabilitation Scheduling Using Distress Quantitites ," Research Report 249-5, Center for Transportation Research, The University of Texas at Austin, August 1983.
17. Daniel, James I., "A Methodology to Determine an Optimum Time to Overlay", MasterLs Thesis, The University of Texas at Austin, December 1979.
18. Izadmehr, Banman and Clyde E. Lee, "Evaluation and Applications Vehicles Weigh-in-Motion," Research Report 1024-1F, Center Transportation Research, The University of Texas at Austin, (in preparation).
of for
1985
19. Bagate, Moussa, "Theoretical Study of Added Fatigue Life and Shear Stress ," Technical Memorandum 357-22, Center for Transportation Research, The University of Texas at Austin, May 1984.
20. Uddin, Waheed, A. H. Meyer, and W. Ronald Hudson, "A UserL s Guide for Pavement Evaluation Programs RPEDD1 and FPEDD1, II Research Report 387-2, Center for Transportation Research, The University of Texas at Austin, July 1985.
21. Ahlburn, Gale, "ELSYM-5 3/72-3, Elastic Layered System with One to TEn Normal Identical Circular Uniform Loads ," Institute of Transportation and Traffic Engineering, University of California at Berkeley, 1972.
RR357-2F/RR

93
22. Taute, Arthur, B. F. McCullough, and W. R. Hudson, IIImprovements to the ~1aterials Characterization and Fatigue Life Preaiction Methods of the Texas Rigid Pavement Overlay Design Procedure," Research Report 249-1, Center for Transportation Research, The Univeristy of Texas at Austin, November 1981.
RR357-2F/RR


APPENDIX A. SPECIAL SPECIFICATION
EXPERIMENTAL THIN BONDED CONCRETE OVERLAY, LOOP 610, HOUSTON

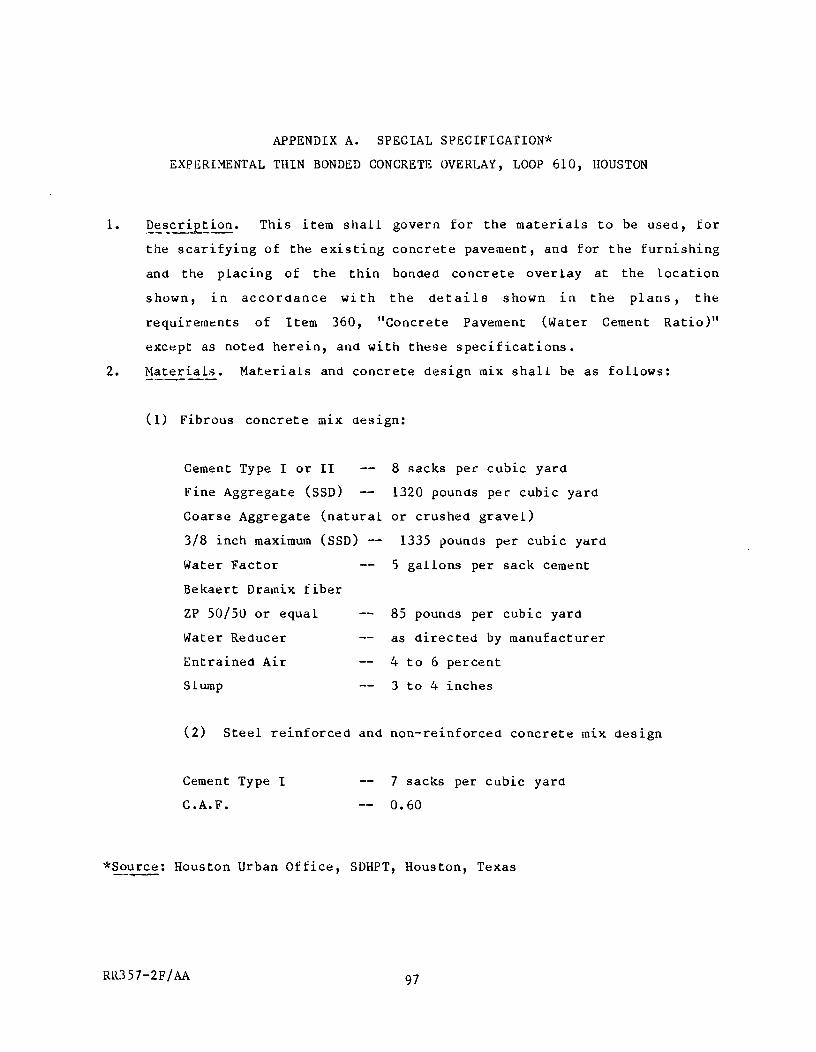
1.
2.
APPENDIX A. SPECIAL SPECIFICATION*
EXPERIMENTAL THIN BONDED CONCRETE OVERLAY, LOOP 610, HOUSTON
This item shall govern for the materials to be used, for
the scarifying of the existing concrete pavement, and for the furnishing
and the placing of the thin bonded concrete overlay at the location
shown, in accordance with the details shown 1.n the plans, the
requirements of Item 360, "Concrete Pavement (Water Cement Ratio)"
except as noted herein, and with these specifications.
Materials. Materials and concrete design mix shall be as follows:
(1) Fibrous concrete mix design:
Cement Type I or II
Fine Aggregate (SSD)
8 sacks per cubic yard
1320 pounds per cubic yard
Coarse Aggregate (natural or crushed gravel)
3/8 inch maximum (SSD) -- 1335 pounds per cubic yard
Water Factor 5 gallons per sack cement
Bekaert Dramix tiber
ZP 50/50 or equal
Water Reducer
Entrained Air
Slump
85 pounds per cubic yard
as directed by manufacturer
4 to 6 percent
3 to 4 inches
(2) Steel reinforced and non-reinforced concrete ml.X design
Cement Type I
C.A.F.
7 sacks per cubic yard
0.60
*So~: Houston Urban Office, SDHPT, Houston, Texas
RR357-2F/AA 97
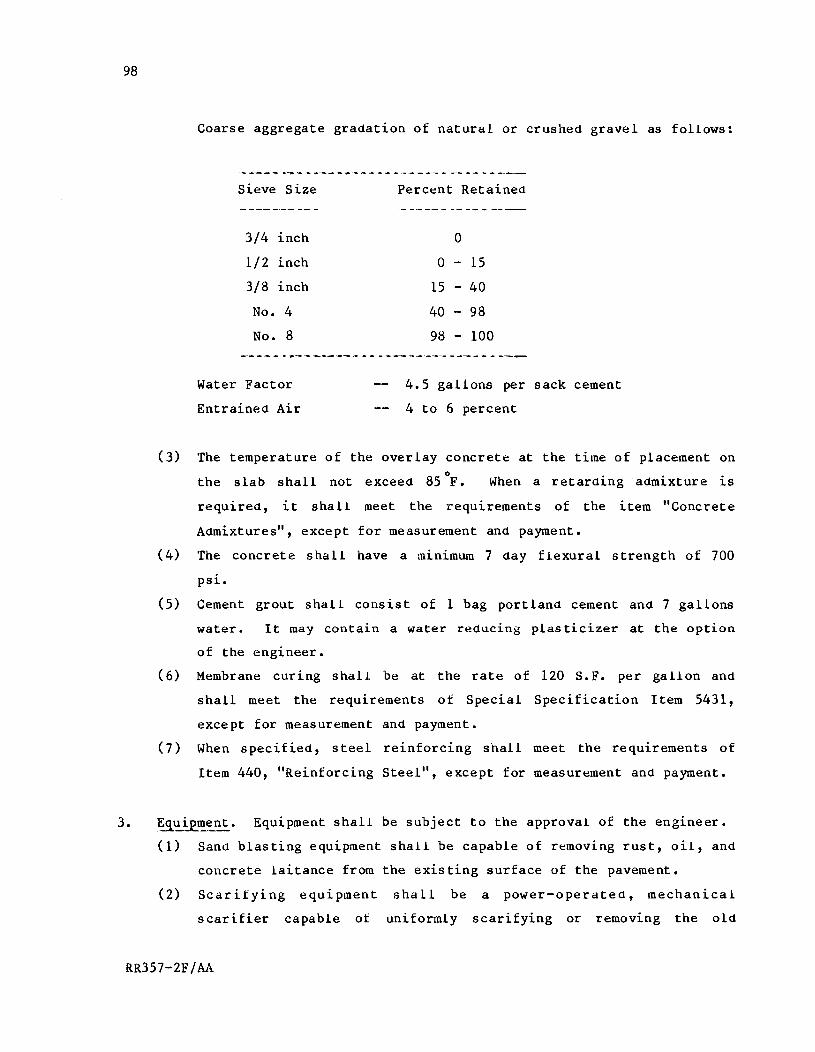
98
Coarse aggregate gradation of natural or crushed gravel as follows:
sieve Size
-- --- ---- - -
3/4 inch
1/2 inch
3/8 inch
No. 4
No. 8
Water Factor
Entrained Air
Percent Retained ------ .. _-----
0
0 - 15
15 - 40
40 - 98
98 - 100
4.5 gallons per sack cement
4 to 6 percent
(3) The temperature of the overlay concrete at the time of placement on
the slab shall not exceed 85 of. When a retarding admixture is
required, it shall meet the requirements of the item "Concrete
Admixtures", except for measurement and payment.
(4) The concrete shcall have a minimum 7 day flexural strength of 700
psi.
(5) Cement grout shall consist of 1 bag portland cement and 7 gallons
water. It may contain a water reducing plasticizer at the option
of the engineer.
(6) Membrane curing shall be at the rate of 120 S.F. per gallon and
shall meet the requirements of Special Specification Item 5431,
except for measurement and payment.
(7) When specified, steel reinforcing shall meet the requirements of
Item 440, "Reinforcing Steel", except for measurement and payment.
3.~~~~ent. Equipment shall be subject to the approval of the engineer.
(1) Sand blasting equipment shall be capable of removing rust, oil, and
concrete laitance from the exis ting surface of the pavement.
(2) Scarifying equipment shall be a power-operated, mechanical
scarifier capable of uniformly scarifying or removing the old
RR357-2F/AA
99
surface to the depths required in a satisfactory manner. Other
types of removal devices may be used if their operation is suitable
and if they can be demonstrated to the satisfaction of the
Engineer.
(3) Transit mixers shall be loaded no more than 80 percent
when fibers are to be added to the mix at the job site.
capacity
Enough
mixers shall be provided to permit the intended pour to be placed
without interruption.
(4) Placing and finishing equipment to be used shall be at the option
ot the contractor subject to the approval of the engineer.
4. Construction Method. The contractor shall furnish to the engineer, for
his approval, a work plan including equipment and manpower before work
1S started on the overlay.
The existing concrete pavement surface shall be scarified to the
depth shown in the plans, followed by sand blasting. Sand blas ting
shall be of such an extent as to remove all dirt, oil, and other
foreign material, as well as any laitance or loose concrete from
the surface and edges against which new concrete is to be placed.
The entire surface shall then be air blasted just prior to the
grouting - paving operation.
The prepared surface shall be dry to allow absorption of the
bonding grout. Bonding grout may be scrubbed or pressure sprayed at the
option of the contractor. Care shall be exercised to insure that all
parts receive a thorough, even coating and that no excess grout 1S
permitted to collect in pockets. The rate of progress in applying grout
shall be limited so that the grout does not become dry before it is
covered with new concrete.
During delays in surfacing operations, should the surface of the
grout indicate an extensive drying, additional grout shall be brushed on
the areas as directed by the engineer. In areas where the grout becomes
thoroughly dried, the grout shall be removed by sand blasting, or other
methods as approved by the engineer.
RRJ57-2F/AA
100
5.
When fibers are to be added to the m1X at the job site, fibers are
added in 66 lb. bags at the rate of 2 bags per minute. After all fibers
have been added, the batch should be mixed for another 2 minutes at 16
rpm pr10r to placement.
The slump to be used on the job shall be as specified by the
engineer from the results of trial batches. When this slump has been
established, all concrete shall be delivered with a consistency of +
1 inch from that designated.
Reinforcing steel type and placement will be as shown on the plans.
The concrete overlay shall receive a tine finish as shown on the
plans.
The concrete overlay shall cure for a period of four days.
The surface temperature shall be maintained above 40'F for the
curing period.
Measurement. Scarification as described herein and in the plans will be
measured by the square yard of "Scarify Concrete Surface (1/8 inch)."
6. Pal..~nt. Payment for "Scarify Concrete Surface (1/8 inch)" measured as
described above will be paid for at the unit price bid per square yard,
which price shall be full compensation for removing all material to the
depth shown, loading, hauling, unloading and disposing of all cuttings;
for all sand blasting and air blasting; and for all labor, tools,
equipment, manipulation, and incidentals necessary to complete the work.
Payment for the type of overlay placed as described above will be
paid for at the unit price per square yard of "Concrete Over lay", of the
depth specified, and with or without reinforcing steel, which price
shall be full compensation for placing grout on the existing concrete
slab; for furnishing, hauling, mixing, placing, finishing and curing of
the concrete overlay; for sawing and sealing of joints; for all labor,
tools, equipment and incidentals necessary to complete the work.
RR357-2F/AA

APPENDIX B
DYNAFLgCT DEFLECTION DATA ANALtSIS

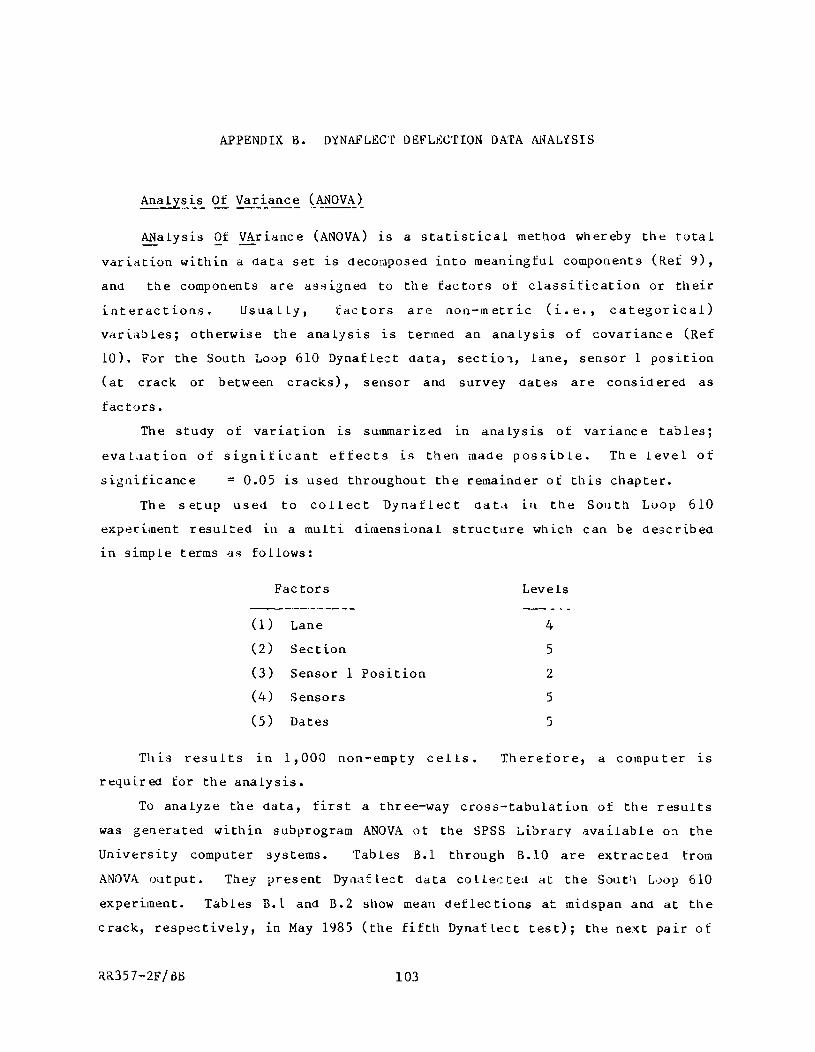
APPENDIX B. DYNAFLECT DEFLrXTION DATA ANAL'iSIS
ANalysis Of VAriance (ANOVA) ~s a statistical method whereby the t()tal
variation within a data set is decomposed into meaningfuL components (Ref 9),
and the components are assigned to the factors of classification or their
interactions. Usually, tactors are non-metric (i.e., categorical)
variables; otherwise the analysis is termed an anatysis of covariance (Ref
10). For the South Loop 610 Dynaflect data, sectio~, lane, sensor 1 position
(at crack or between cracks), sensor and survey dates are considered as
fac tors.
The study of variation ~s summarized tn analysis of var~ance tables;
eval,lation of significant effects is then made possible. The level of
significance = 0.05 is used throughout the remainder of this chapter.
The setup use<1 to collect Dynaflect dat,l U\ the South Loop 610
exper.iment resulted in a multi dimensional structure which can be described
in simple terms ~s follows:
Factors
---------(1) Lane
(2) Section
(3) Sensor 1 Position
(4) Sensors
(5 ) Dates
This results ~n 1,000 non-empty cells.
rt=quirea for the analysis.
Levels _-_0.
4
5
2
5
5
Therefore, a computer is
To analyze the data, first a three-way cross-tabulation of the results
was gel1erated within subprogram ANOVA of the SPSS Li~rary available 0:1 the
University computer systems. Tables B.1 through B.lO are extracted trom
ANOVA Oiltput. They IJresent Dynat leet data collected at the Sout:1 L.)op 610
experiment. Tables B.l and B.2 show mean deflections at midspan and at the
crack, respectively, in May 1985 (the fifth Dynaftect test); the next pair of
RR357-2F/Bl> 103
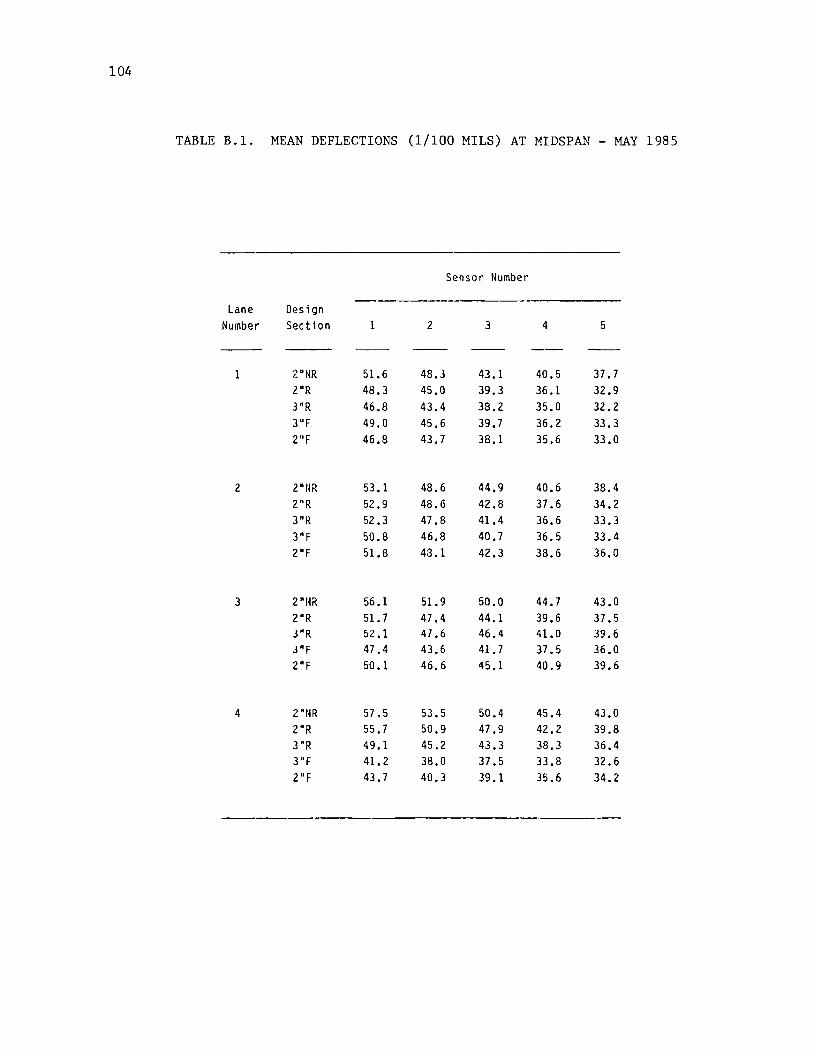
104
TABLE B.1. MEAN DEFLECTIONS (1/100 MILS) AT MIDSPAN - MAY 1985
Sensor Number
Lane Design Number Section 1 2 3 4 5
2"NR 51.6 48.3 43.1 40.5 37.7 l"R 48.3 45.0 39.3 36.1 32.9 3"R 46.8 43.4 38.2 35.0 32.2 3"F 49.0 45.6 39.7 36.2 33.3 2"F 46.8 43.7 38.1 35.6 33.0
2 2"NR 53.1 48.6 44.9 40.6 38.4 2"R 52.9 48.6 42.8 37.6 34.2 3"R 52.3 47.8 41.4 36.6 33.3 3"F 50.8 46.8 40.7 36.5 33.4 2"F 51.8 48.1 42.3 38.6 36.0
3 2"I~R 56.1 51.9 50.0 44.7 43.0 2"R 51. 7 47.4 44.1 39.6 37.5 3"R 52.1 47.6 46.4 41.0 39.6 3"F 47.4 43.6 41.7 37.5 36.0 2"F 50.1 46.6 45.1 40.9 39.6
4 2"NR 57.5 53.5 50.4 45.4 43.0 2"R 55.7 50.9 47.9 42.2 39.8 3"R 49.1 45.2 43.3 38.3 36.4 3"F 41.2 38.0 37.5 33.8 32.6 2"F 43.7 40.3 39.1 35.6 34.2
-------
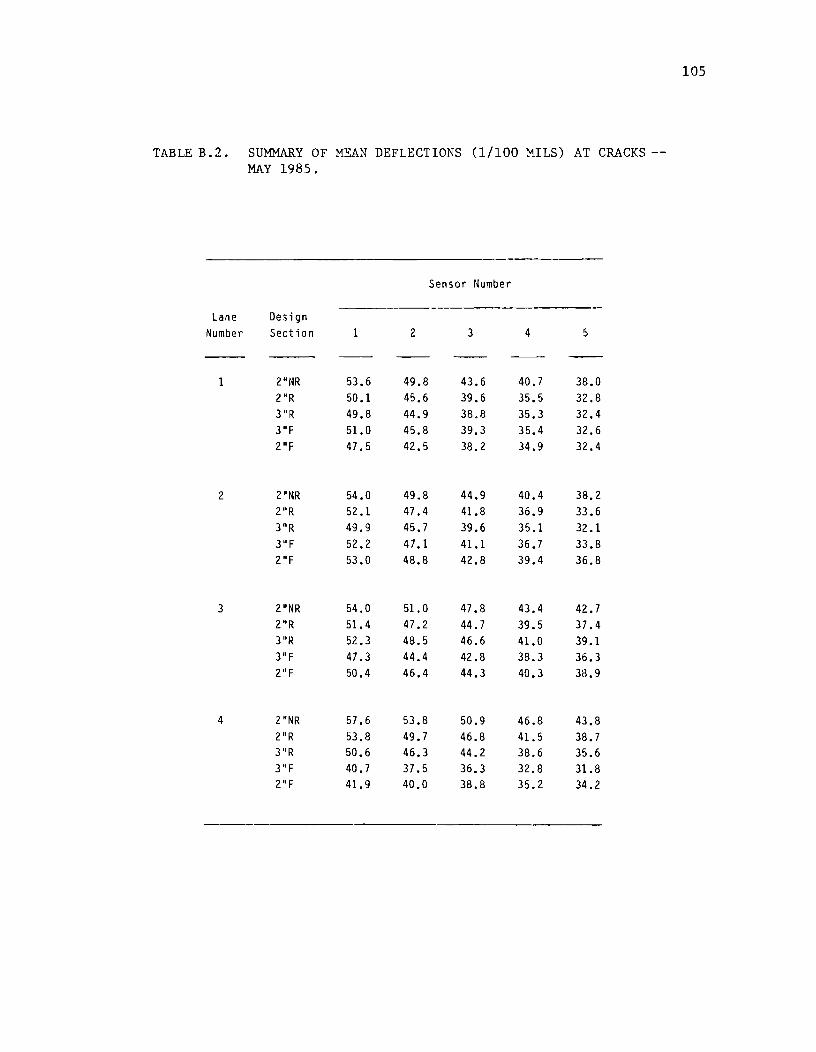
TABLE B. 2. SUMMARY OF MEAN DEFLECTIONS (1/100 MILS) AT CRACKS -MAY 1985.
Sensor Number
Lane Design Number Section 1 2 3 4 5
1 2"NR 53.6 49.8 43.6 40.7 38.0 2"R 50.1 45.6 39.6 35.5 32.8 3"R 49.8 44.9 38.8 35.3 32.4 3"F 51.0 45.8 39.3 35.4 32.6 2"F 47.5 42.5 38.2 34.9 32.4
2 2"NR 54.0 49.8 44.9 40.4 38.2 2"R 52.1 47.4 41.8 36.9 33.6 3"R 49.9 45.7 39.6 35.1 32.1 3"F 52.2 47.1 41.1 36.7 33.8 2"F 53.0 48.8 42.8 39.4 36.8
3 2"NR 54.0 51.0 47.8 43.4 42.7 2"R 51.4 47.2 44.7 39.5 37.4 3"R 52.3 48.5 46.6 41.0 39.1 3"F 47.3 44.4 42.8 38.3 36.3 2"F 50.4 46.4 44.3 40.3 38.9
4 ZUNR 57.6 53.8 50.9 46.8 43.8 2u R 53.8 49.7 46.8 41. 5 38.7 3u R 50.6 46.3 44.2 38.6 35.6 3"F 40.7 37.5 36.3 32.8 31.8 2"F 41.9 40.0 38.8 35.2 34.2
105
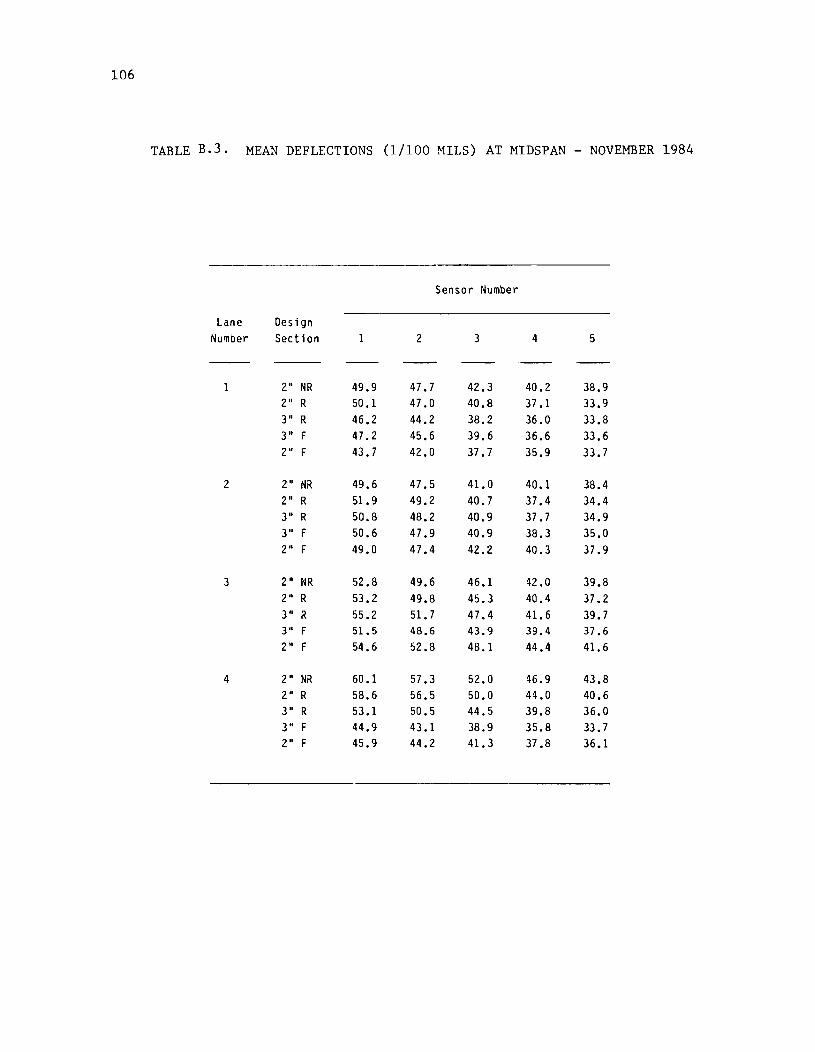
106
TABLE B.3. MEAN DEFLECTIONS (1/100 MILS) AT MIDSPAN - NOVEMBER 1984
Sensor Number
Lane Design Number Section 1 2 3 4 5
1 2" NR 49.9 47.7 42.3 40.2 38.9 2" R 50.1 47.0 40.8 37.1 33.9 3" R 46.2 44.2 38.2 36.0 33.8 3" F 47.2 45.6 39.6 36.6 33.6 2" F 43.7 42.0 37.7 35.9 33.7
2 2" NR 49.6 47.5 41.0 40.1 38.4 2" R 51.9 49.2 40.7 37.4 34.4 3" R 50.8 48.2 40.9 37.7 34.9 3" F 50.6 47.9 40.9 38.3 35.0 2" F 49.0 47.4 42.2 40.3 37.9
3 2" NR 52.8 49.6 46.1 42.0 39.8 2" R 53.2 49.8 45.3 40.4 37.2 3" R 55.2 51. 7 47.4 41. 6 39.7 3" F 51.5 48.6 43.9 39.4 37.6 2" F 54.6 52.8 48.1 44.4 41.6
4 2" NR 60.1 57.3 52.0 46.9 43.8 2" R 58.6 56.5 50.0 44.0 40.6 3" R 53.1 50.5 44.5 39.8 36.0 3" F 44.9 43.1 38.9 35.8 33.7 2" F 45.9 44.2 41.3 37.8 36.1
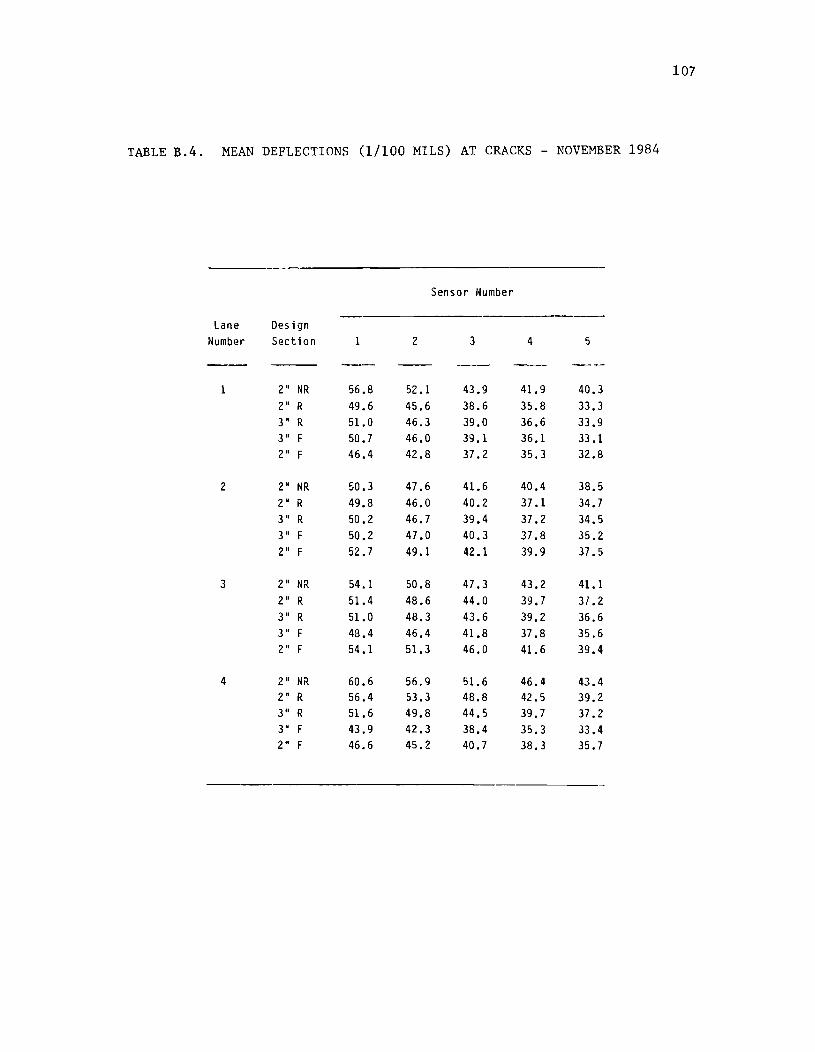
107
TABLE B.4. MEAN DEFLECTIONS U/100 MILS) AT CRACKS - NOVEMBER 1984
Sensor Number
Lane Design Number Section 1 2 3 4 5
--2" NR 56.8 52.1 43.9 41.9 40.3 2" R 49.6 45.6 38.6 35.8 33.3 3" R 51.0 46.3 39.0 36.6 33.9 3" F 50.7 46.0 39.1 36.1 33.1 2" F 46.4 42.8 37.2 35.3 32.8
2 2" NR 50.3 47.6 41.6 40.4 38.5 2" R 49.8 46.0 40.2 37.1 34.7 3" R 50.2 46.7 39.4 37.2 34.5 3" F 50.2 47.0 40.3 37.8 35.2 2" F 52.7 49.1 42.1 39.9 37.5
3 2" NR 54.1 50.8 47.3 43.2 41.1 2" R 51.4 48.6 44.0 39.7 31.2 3" R 51. 0 48.3 43.6 39.2 36.6 3" F 48.4 46.4 41.8 37.8 35.6 2 ., F 54.1 51.3 46.0 41.6 39.4
4 2" NR 60.6 56.9 5l.6 46.4 43.4 2" R 56.4 53.3 48.8 42.5 39.2 3" R 51. 6 49.8 44.5 39.7 37.2 3" F 43.9 42.3 38.4 35.3 33.4 2" F 46.6 45.2 40.7 38.3 35.7
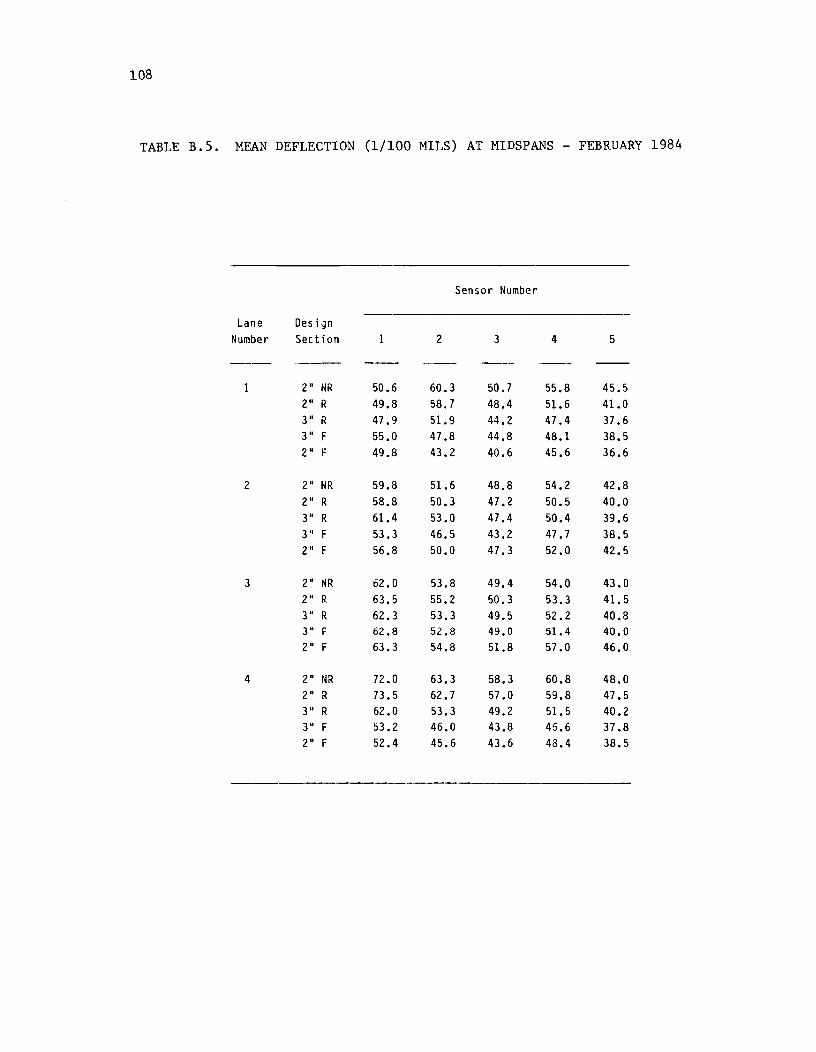
108
TABLE B.S. MEAN DEFLECTION (1/100 MILS) AT MIDSPANS - FEBRUARY 1984
Sensor Number
Lane Design Number Section 2 3 4 5
--
I 2" NR 50.6 60.3 50.7 55.8 45.5 2" R 49.8 58.7 48.4 51.6 41.0 3" R 47.9 51.9 44.2 47.4 37.6 3" F 55.0 47.8 44.8 48.1 38.5 2" F 49.8 43.2 40.6 45.6 36.6
2 2" NR 59.8 51.6 48.8 54.2 42.8 2" R 58.8 50.3 47.2 50.5 40.0 3" R 61.4 53.0 47.4 50.4 39.6 3" F 53.3 46.5 43.2 47.7 38.5 2" F 56.8 50.0 47.3 52.0 42.5
3 2" NR 62.0 53.8 49.4 54.0 43.0 2" R 63.5 55.2 50.3 53.3 41. 5 3" R 62.3 53.3 49.5 52.2 40.8 3" F 62.8 52.8 49.0 51.4 40.0 2" F 63.3 54.8 51.8 57.0 46.0
4 2" NR 72.0 63.3 58.3 60.8 48.0 2" R 73.5 62.7 57.0 59.8 47.5 3" R 62.0 53.3 49.2 51. 5 40.2 3" F 53.2 46.0 43.8 46.6 37.8 2" F 52.4 45.6 43.6 48.4 38.5
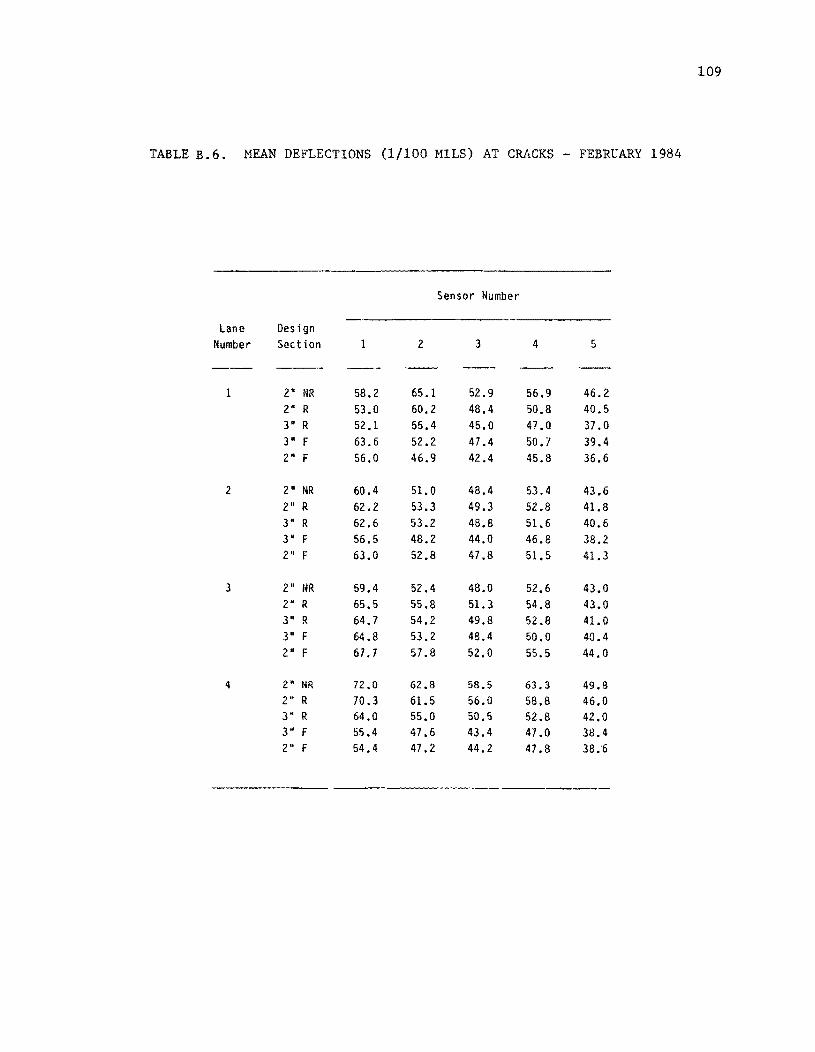
109
TABLE B.6. MEAN DEFLECTIONS (1/100 MILS) AT CRACKS - FEBRUARY 1984
Sensor Number
----Lane Design
Number Section 1 2 3 4 5
1 2" NR 58.2 65.1 52.9 56.9 46.2 2" R 53.0 60.2 48.4 50.8 40.5 3" R 52.1 55.4 45.0 47.0 37.0 3" F 63.6 52.2 47.4 50.7 39.4 2" F 56.0 46.9 42.4 45.8 36.6
2 2· NR 60.4 51.0 48.4 53.4 43.6 2" R 62.2 53.3 49.3 52.8 41.8 3" R 62.6 53.2 48.8 51.6 40.6 3" F 56.5 48.2 44.0 46.8 38.2 2" F 63.0 52.8 41.8 51.5 41.3
3 2" I~R 59.4 52.4 48.0 52.6 43.0 2" R 65.5 55.8 51.3 54.8 43.0 3" R 64.7 54.2 49.8 52.8 41.0 3" F 64.8 53.2 48.4 50.0 40.4 2° F 67.7 57.8 52.0 55.5 44.0
4 2" NR 72.0 62.8 58.5 63.3 49.8 2" R 70.3 61.5 56.0 58.8 46.0 3" R 64.0 55.0 50.5 52.8 42.0 3" F 55.4 47.6 43.4 47.0 38.4 2" F 54.4 47.2 44.2 47.8 38.6
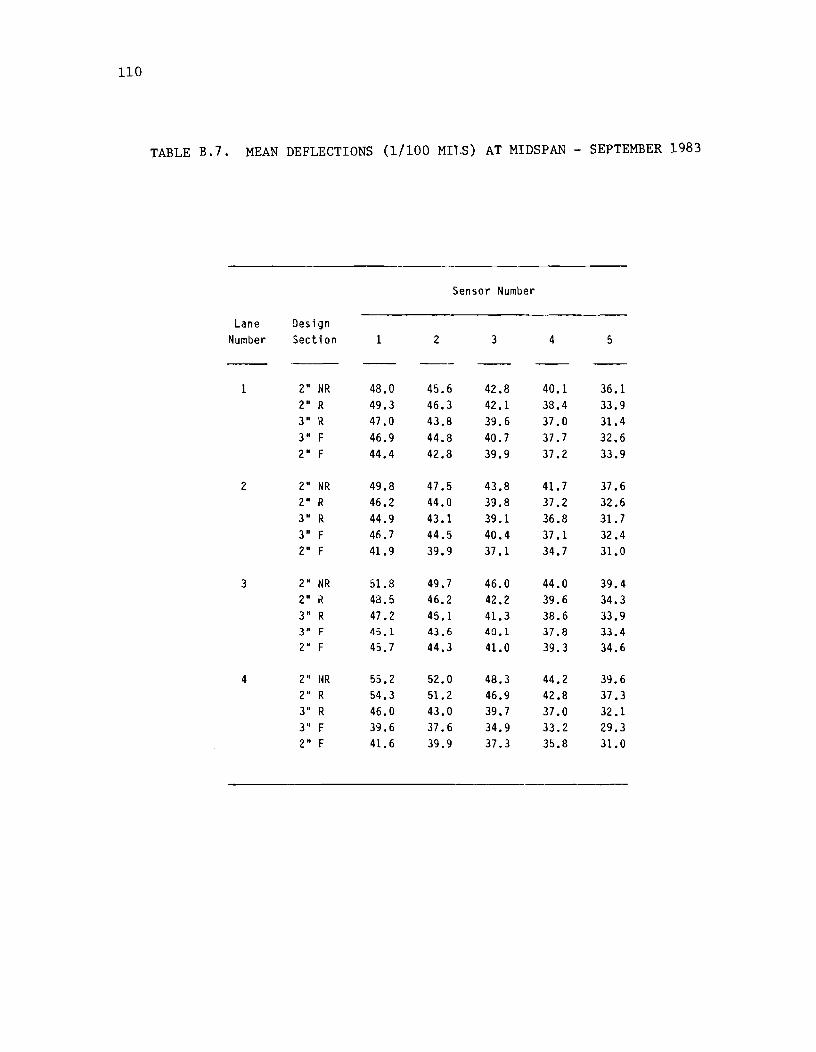
110
TABLE B.7. MEAN DEFLECTIONS (1/100 MILS) AT MIDSPAN - SEPTEMBER 1983
Sensor Number
Lane Design Number Section 1 2 3 4 5
1 2" NR 48.0 45.6 42.8 40.1 36.1 2" R 49.3 46.3 42.1 38.4 33.9 3" R 47.0 43.8 39.6 37.0 31.4 3" F 46.9 44.8 40.7 37.7 32.6 2" F 44.4 42.8 39.9 37.2 33.9
2 2" NR 49.8 47.5 43.8 41. 7 37.6 2" R 46.2 44.0 39.8 37.2 32.6 3" R 44.9 43.1 39.1 36.8 31.7 3" F 46.7 44.5 40.4 37.1 32.4 2" F 41.9 39.9 37.1 34.7 31.0
3 2" NR 51.8 49.7 46.0 44.0 39.4 2" R 48.5 46.2 42.2 39.6 34.3 3" R 47.2 45.1 41.3 38.6 33.9 3" F 45.1 43.6 40.1 37.8 33.4 2" F 45.7 44.3 41.0 39.3 34.6
4 2" NR 55.2 52.0 48.3 44.2 39.6 2" R 54.3 51. 2 46.9 42.8 37.3 3" R 46.0 43.0 39.7 37.0 32.1 3" F 39.6 37.6 34.9 33.2 29.3 2" F 41.6 39.9 37.3 35.8 31.0
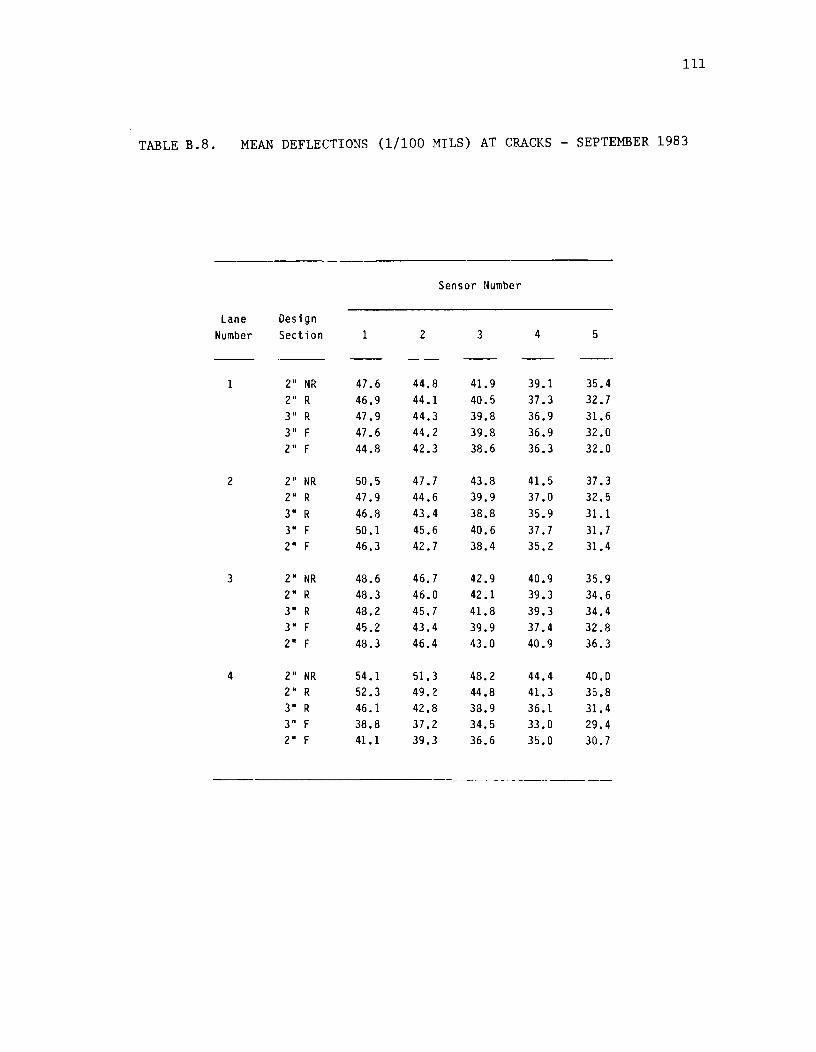
111
TABLE B.8. MEAN DEFLECTIONS (1/100 MILS) AT CRACKS - SEPTEMBER 1983
Sensor Number
Lane Design Number Section 1 2 3 4 5
1 2" NR 47.6 44.8 41.9 39.1 35.4 2" R 46.9 44.1 40.5 37.3 32.7 3" R 47.9 44.3 39.8 36.9 31.6 3" F 47.6 44.2 39.8 36.9 32.0 2" F 44.8 42.3 38.6 36.3 32.0
2 2" NR 50.5 47.7 43.8 41.5 37.3 2" R 47.9 44.6 39.9 37.0 32.5 3" R 46.8 43.4 38.8 35.9 31.1 3" F 50.1 45.6 40.6 37.7 31. 7 2" F 46.3 42.7 38.4 35.2 31.4
3 2" NR 48.6 46.7 42.9 40.9 35.9 2" R 48.3 46.0 42.1 39.3 34.6 3" R 48.2 45.7 41.8 39.3 34.4 3" F 45.2 43.4 39.9 37.4 32.8 2" F 48.3 46.4 43.0 40.9 36.3
4 2" NR 54.1 51. 3 48.2 44.4 40.0 2· R 52.3 49.2 44.8 41.3 35.8 3" R 46.1 42.8 38.9 36.1 31.4 3" F 38.8 37.2 34.5 33.0 29.4 2" F 41.1 39.3 36.6 35.0 30.7
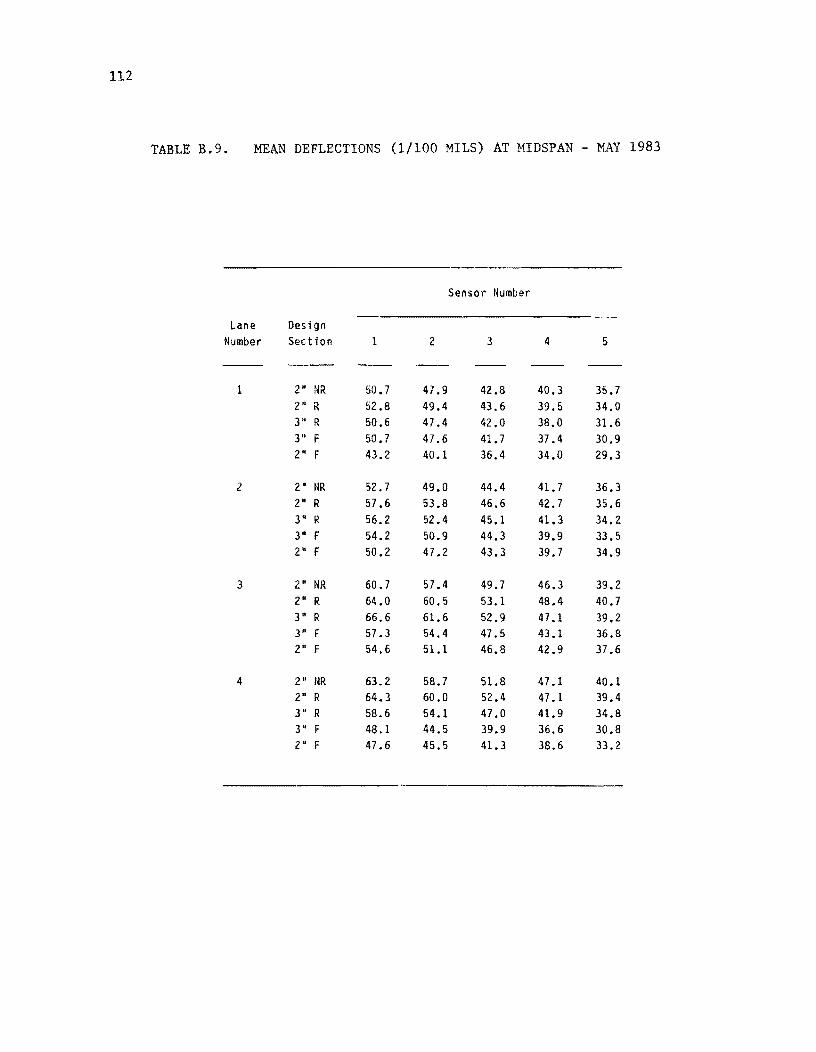
112
TABLE B.9. MEAN DEFLECTIONS (1/100 MILS) AT MIDSPAN - MAY 1983
Sensor Number
Lane Design Number Section 1 2 3 4 5
--1 2" r~R 50.7 47.9 42.8 40.3 35.7
2" R 52.8 49.4 43.6 39.5 34.0 3" R 50.6 47.4 42.0 38.0 31.6 3" F 50.7 47.6 41. 7 37.4 30.9 2" F 43.2 40.1 36.4 34.0 29.3
2 2" NR 52.7 49.0 44.4 41.7 36.3 2" R 57.6 53.8 46.6 42.7 35.6 3" R 56.2 52.4 45.1 41.3 34.2 3" F 54.2 50.9 44.3 39.9 33.5 2" F 50.2 47.2 43.3 39.7 34.9
3 2" NR 60.7 57.4 49.7 46.3 39.2 2" R 64.0 60.5 53.1 48.4 40.7 3" R 66.6 61.6 52.9 47.1 39.2 3" f 57.3 54.4 47.5 43.1 36.S 2" F 54.6 51.1 46.8 42.9 37.6
4 2" NR 63.2 58.7 51.8 47.1 40.1 2" R 64.3 60.0 52.4 47.1 39.4 3" R 58.6 54.1 47.0 41.9 34.8 3" F 48.1 44.5 39.9 36.6 30.8 2" F 47.6 45.5 41.3 38.6 33.2
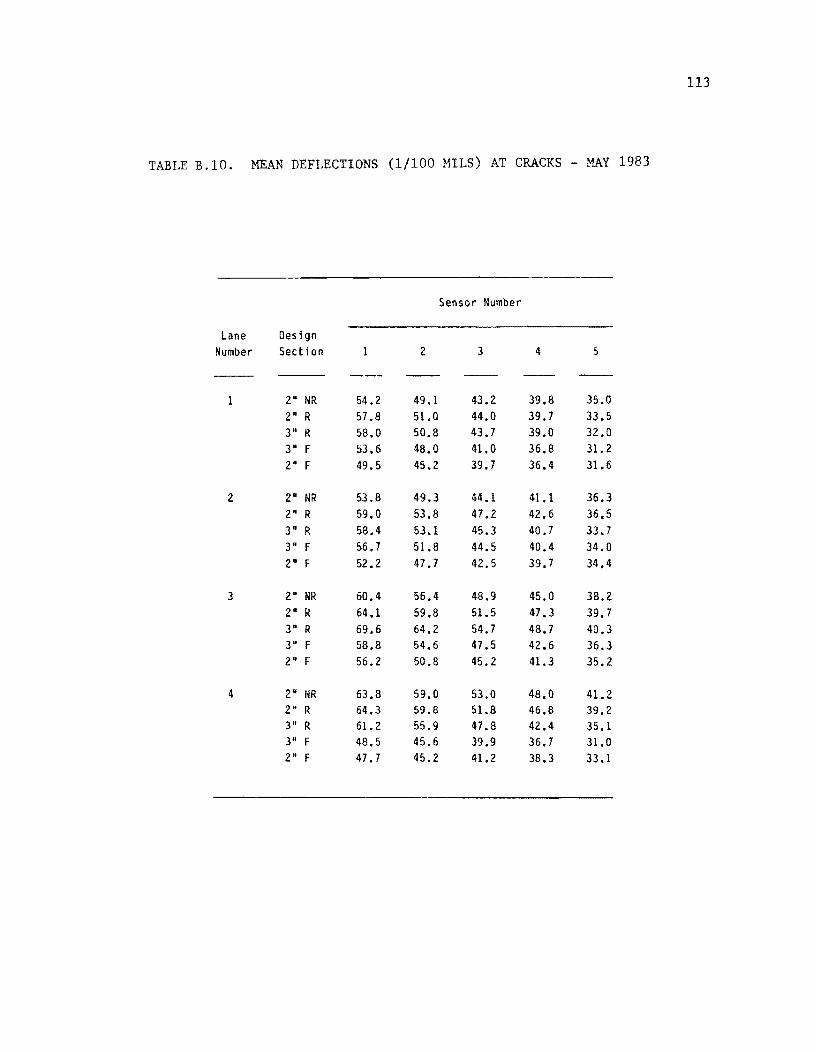
113
TABLE B.10. MEAN DEFLECTIONS (1/100 MILS) AT CRACKS - MAY 1983
Sensor Number
lane Design Number Section 2 3 4 5
1 2" NR 54.2 49.1 43.2 39,8 35.0 2" R 57.8 51.0 44.0 39.7 33.5 3" R 58.0 50.8 43.7 39.0 32.0 3" F 53.6 48.0 41.0 36.8 31. 2 2" F 49.5 45.2 39.7 36.4 31.6
2 2" NR 53.8 49.3 44.1 41.1 36.3 2" R 59.0 53.8 47.2 42.6 36.5 3" R 58.4 53.1 45.3 40.7 33.7 3" F 56.7 51.8 44.5 40.4 34.0 2" F 52.2 47.7 42.5 39.7 34.4
3 2" NR 60.4 56.4 48.9 45.0 38.2 2" R 64.1 59.8 51.5 47.3 39.7 3" R 69.6 64.2 54.7 48.7 40.3 3" F 58.8 54.6 47.5 42.6 36.3 2" F 56.2 50.8 45.2 41.3 35.2
4 2- NR 63.8 59.0 53.0 48.0 41.2 2" R 64,3 59.8 51.8 46.8 39.2 3" R 61. 2 55.9 47.8 42.4 35.1 3" F 48.5 45.6 39,9 36.7 31.0 2" F 47.7 45.2 41.2 38.3 33.1
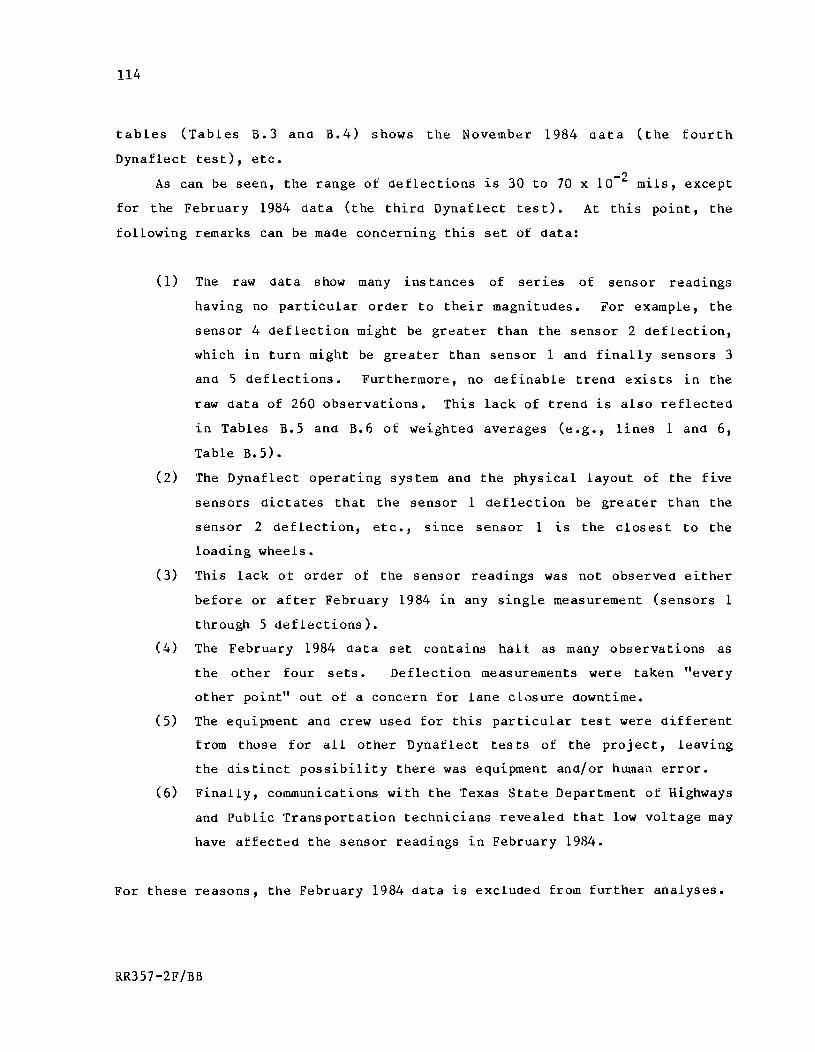
114
tables (Tables B.3 and B.4) shows the November 1984 data (the fourth
Dynaflect test), etc.
As can be seen, the range of deflections is 30 to 70 x 10-2 mils, except
for the February 1984 data (the third Dynaflect test). At this point, the
following remarks can be made concerning this set of data:
(1) The raw data show many ins tances of series of sensor readings
having no particular order to their magnitudes. For example, the
sensor 4 deflection might be greater than the sensor 2 deflection,
which in turn might be greater than sensor 1 and finally sensors 3
and 5 deflections. Furthermore, no definable trend exists in the
raw data of 260 observations. This lack of trend is also reflected
in Tables B.5 and B.6 of weighted averages (e.g., lines 1 and 6,
Table B.5).
(2) The Dynaflect operating system and the physical layout of the five
sensors dictates that the sensor 1 deflection be greater than the
sensor 2 deflection, etc., since sensor 1 is the closest to the
loading wheels.
(3) This lack of order of the sensor readings was not observed either
before or after February 1984 in any single measurement (sensors 1
through 5 deflections).
(4) The February 1984 data set contains halt as many observations as
the other four sets. Deflection measurements were taken lIevery
other pointll out of a concern for lane closure downtime.
(5) The equipment and crew used for this particular test were different
from those for all other Dynaflect tests of the project, leaving
the distinct possibility there was equipment and/or human error.
(6) Finally, communications with the Texas State Department of Highways
and Public Transportation technicians revealed that low voltage may
have affected the sensor readings in February 1984.
For these reasons, the February 1984 data is excluded from further analyses.
RR357-2F/BB
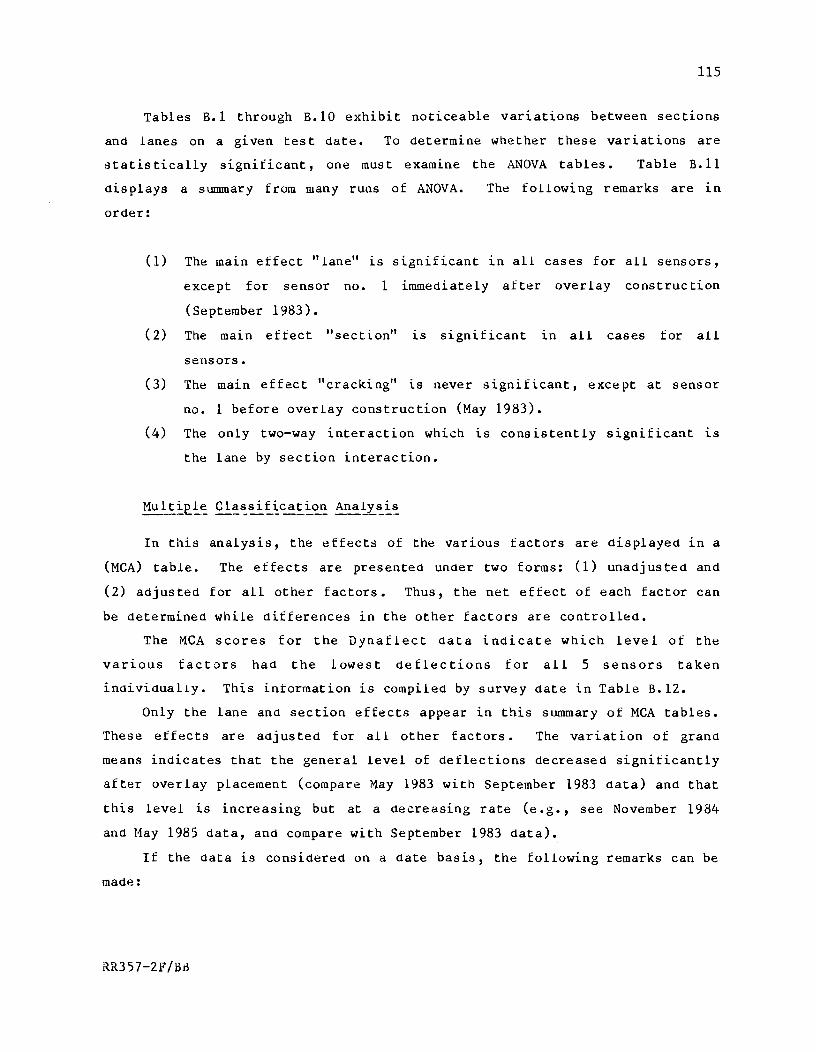
115
Tables B.1 through B.10 exhibit noticeable variations between sections
and lanes on a given tes t date. To determine whether these variations are
statis tically significant, one must examine the ANOVA tables. Table B.ll
displays a summary from many runs of ANOVA. The following remarks are in
order:
(1) The main effect" lane" is significant in all cases for all sensors,
except for sensor no. 1 immediately after overlay construction
(September 1983).
(2) The ma1n eftect "section" is significant in all cases for all
sensors.
(3) The main effect "cracking" is never significant, exce pt at sensor
no. 1 before overlay construction (May 1983).
(4) The only two-way interaction which is consistently significant 1S
the lane by section interaction.
In this analysis, the effects of the various factors are displayed in a
(MeA) table. The effects are presented under two forms: (1) unadjusted and
(2) adjusted for all other factors. Thus, the net effect of each factor can
be determined while differences in the other factors are controlled.
The MeA scores for the Dynaflect data indicate which level of the
various factors had the lowest deflections for all 5 sensors taken
inaividualiy. This information is compiled by survey date in Table B.12.
Only the lane and section effects appear in this summary of MeA tables.
These effects are adjusted for all other factors. The variat ion of grand
means indicates that the general level of deflections decreased significantly
after overlay placement (compare May 1983 with September 1983 data) and that
this level is increasing but at a decreasing rate (e.g., see November 1984
and May 1985 data, and compare with September 1983 data).
If the data is considered on a date basis, the following remarks can be
made:
RR357-2F/Brl
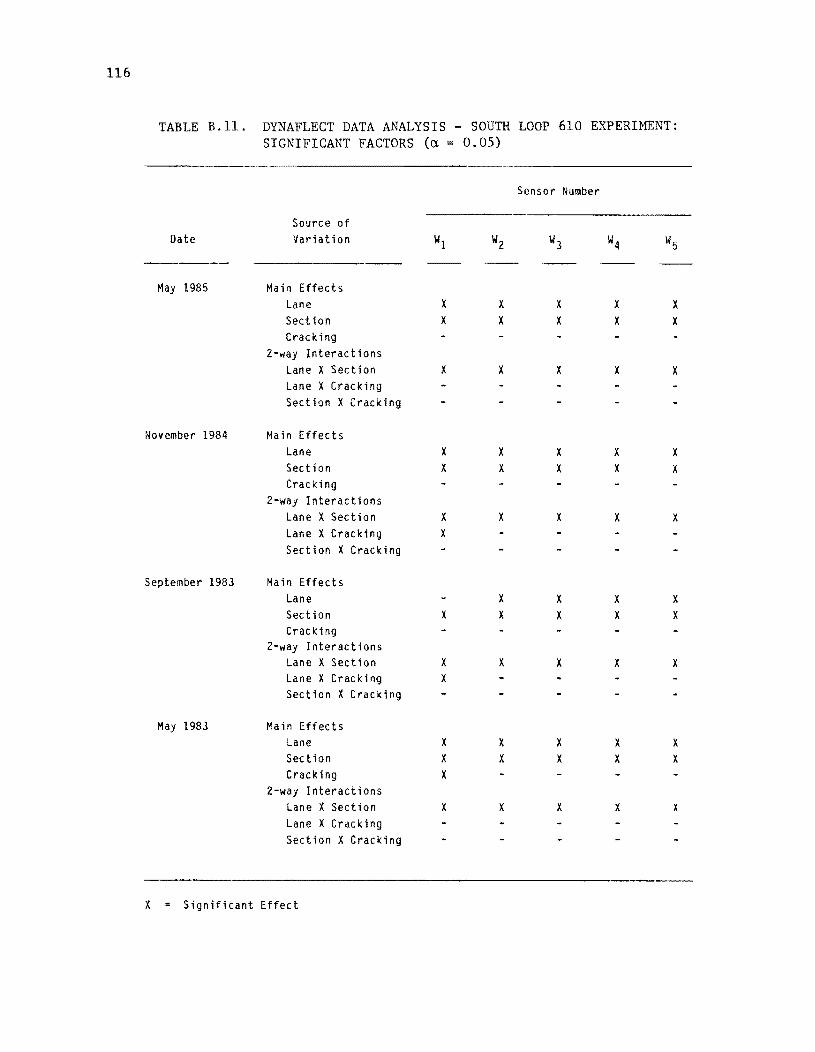
116
TABLE B.ll. DYNAFLECT DATA ANALYSIS - SOUTH LOOP 610 EXPERIMENT: SIGNIFICANT FACTORS (a = 0.05)
Sensor Number
Source of Date Variation WI W2 W3 W4 1~5
May 1985 Main Effects Lane X X X X X Section X X X X X Cracking
2~way Interactions Lane X Section X X X X X Lane X Cracking Section X Cracking
November 1984 Main Effects Lane X X X X X Section X X X X X Cracking
2-way Interactions Lane X Section X X X X X Lane X Cracking X
Section X Cracking
September 1983 Mairt Effects Lane X X X X Section X X X X X Cracking
2-way Interactions Lane X Section X X X X X Lane X Cracking X Section X Cracking
May 1983 Main Effects Lane X X X X )(
Section X X X X X Cracking X
2-way Interactions Lane X Section X X X X X
Lane X Cracking Section X Cracking
X Significant Effect
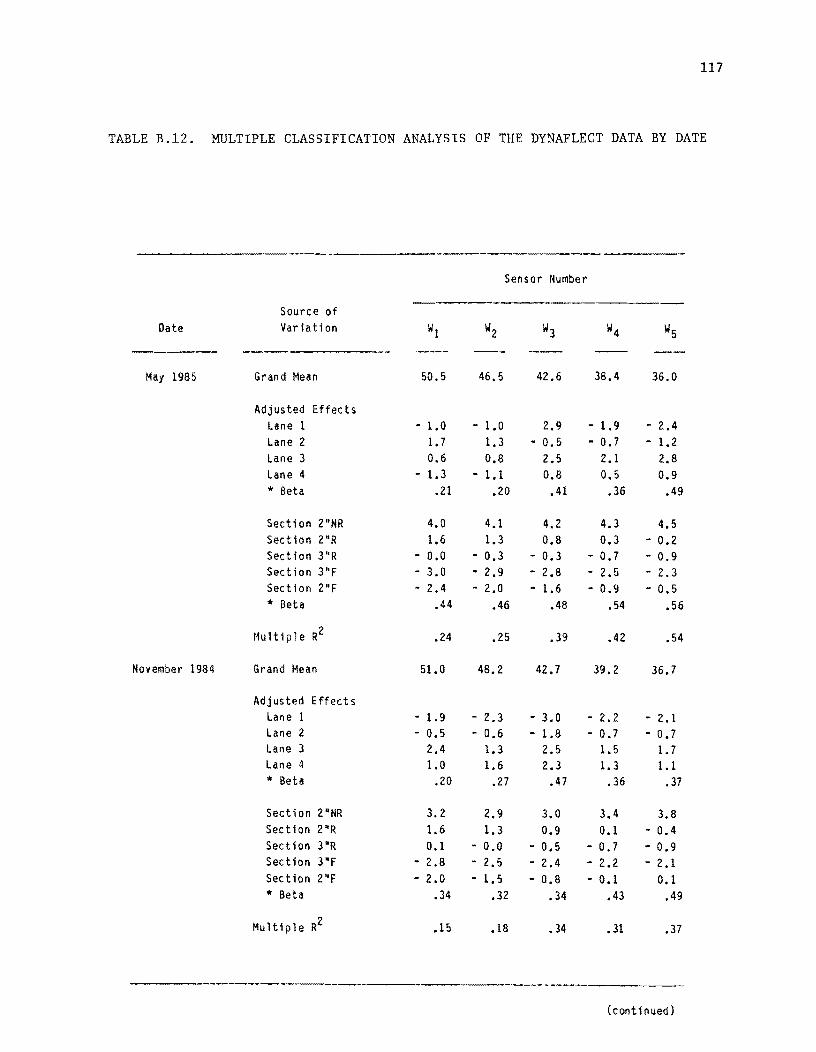
117
TABLE B.12. MULTIPLE CLASSIFICATION ANALYSIS OF THE DYNAFLECT DATA BY DATE
----Sensor Number
------ ----------Source of
Date Variation WI W2 W3 W4 W5
May 1985 Grand Mean 50.5 46.5 42.6 38.4 36.0
Adjusted Effects Lane I - 1.0 - 1.0 2.9 - 1.9 - 2.4 Lane 2 1.7 1.3 - 0.5 - 0.7 - 1.2 Lane 3 0.6 0.8 2.5 2,1 2,8 Lane 4 - 1.3 - 1.1 0,8 0.5 0.9 * Beta .21 .20 .41 ,36 .49
Section 2"NR 4.0 4.1 4.2 4.3 4,5 Section 2"R 1.6 1.3 0,8 0.3 - 0.2 Section 3"R - 0.0 - 0.3 - 0.3 - 0.7 - 0.9 Section 3"F - 3.0 - 2.9 - 2.8 - 2.5 - 2.3 Section 2"F - 2.4 - 2.0 - 1.6 - 0,9 - 0.5 * Beta .44 .46 .48 .54 .56
f~ultiple R2 ,24 .25 ,39 .42 .54
November 1984 Grand Mean 51.0 48.2 42.7 39.2 36.7
Adjusted Effects Lane 1 - 1. 9 - 2.3 - 3.0 - 2.2 - 2.1 Lane 2 - 0.5 - 0.6 - 1.8 - 0.7 - 0.7 Lane 3 2.4 1.3 2.5 1.5 1.7 Lane 4 1.0 1.6 2.3 1.3 1.1 * Beta .20 .27 .47 .36 .37
Section 2"NR 3.2 2.9 3.0 3.4 3.8 Section 2"R 1.6 1.3 0.9 0.1 - 0.4 Section 3"R 0.1 - 0 ,0 - 0.5 - 0.7 - 0.9 Section 3"F - 2.8 - 2.5 - 2.4 - 2.2 - 2.1 Section 2"F - 2.0 - 1.5 - 0.8 - 0.1 0.1 * Beta .34 .32 .34 .43 .49
Multiple R2 .15 .18 .34 .31 .37
(continued)
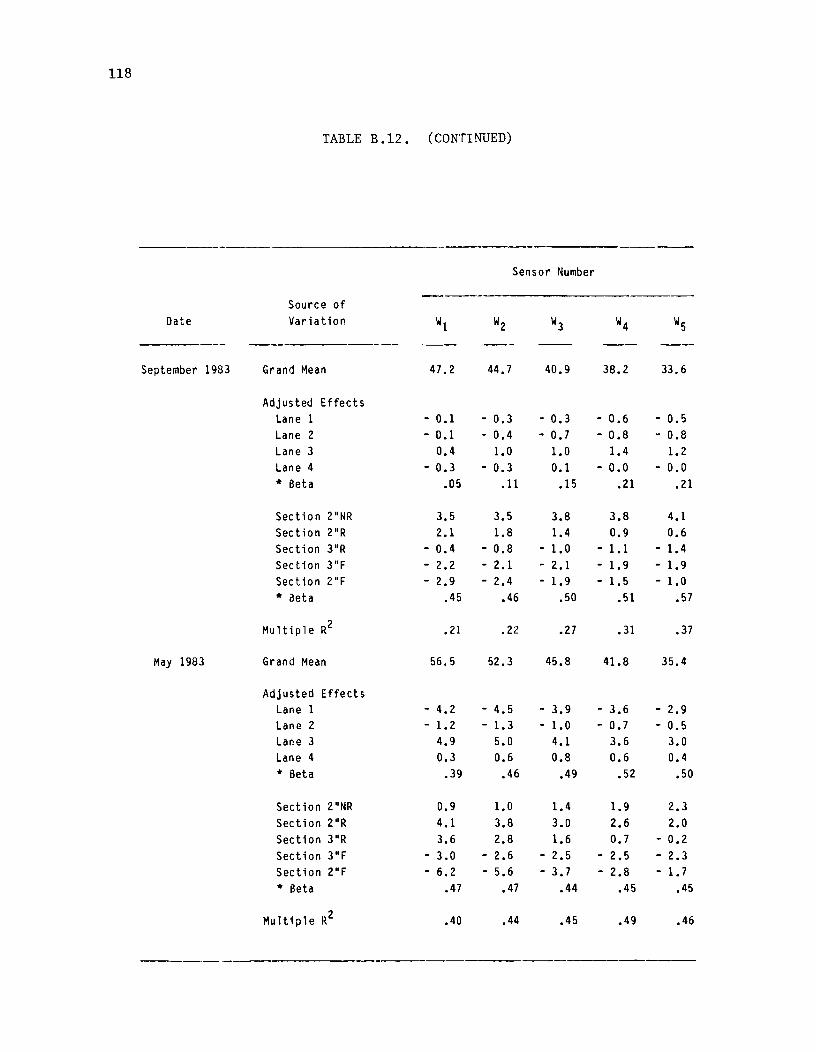
118
TABLE B.12. (CONTINUED)
Sensor Number
Source of Date Variation W1 W2 W3 W4 W5
September 1983 Grand Mean 47.2 44.7 40.9 38.2 33.6
Adjusted Effects Lane 1 - 0.1 - 0.3 - 0.3 - 0.6 - 0.5 Lane 2 - 0.1 - 0.4 - 0.7 - 0.8 - 0.8 Lane 3 0.4 1.0 1.0 1.4 1.2 Lane 4 - 0.3 - 0.3 0.1 - 0.0 - 0.0 * Beta .05 .11 .15 .21 .21
Section 2"NR 3.5 3.5 3.8 3.8 4.1 Section 2"R 2.1 1.8 1.4 0.9 0.6 Section 3"R - 0.4 - 0.8 - 1. 0 - 1.1 - 1.4 Section 3"F - 2.2 - 2.1 - 2.1 - 1.9 - 1.9 Section 2"F - 2.9 - 2.4 - 1.9 - 1.5 - 1.0 * ileta .45 .46 .50 .51 .57
Multiple R2 .21 .22 .27 .31 .37
May 1983 Grand Mean 56.5 52.3 45.8 41.8 35.4
Adjusted Effects Lane 1 - 4.2 - 4.5 - 3.9 - 3.6 - 2.9 Lane 2 - 1. 2 - 1.3 - 1.0 - 0.7 - 0.5 Lane 3 4.9 5.0 4.1 3.6 3.0 Lane 4 0.3 0.6 0.8 0.6 0.4 * Beta .39 .46 .49 .52 .50
Sect ion 2"NR 0.9 1.0 1.4 1.9 2.3 Section 2"R 4.1 3.8 3.0 2.6 2.0 Section 3"R 3.6 2.8 1.6 0.7 - 0.2 Section 3"F - 3.0 - 2.6 - 2.5 - 2.5 - 2.3 Section 2"F - 6.2 - 5.6 - 3.7 - 2.8 - 1. 7 * Beta .47 .47 .44 .45 .45
Multiple R2 .40 .44 .45 .49 .46
119
(1) In May 1985, section 311 F (Le., the 3-inch-thick fibrous concrete
section) exhibited the lowest deflections at all five sensors, and
section 211NR (i.e., the 2-inch-thick non reinforced section) the
highes t def lections. On the same tes ting date, the lane effect
varied at the different sensors.
(2) In November 1984, section 3"F again exhibited the lowest
deflections and section 2"NR the highest. On the same tes ting
date, lane 1, the innermost lane, exhibited the lowest deflections,
and lane 4, the outermost lane, the highest.
apply at all five sensors.
These inferences
(3) In September 1983, right after overlay placement, the significance
of section effects varied at the five sensors. The lane effects
were negligible and the significance also varied at all five
sensors.
(4) In May 1983, before overlay, the 2"F section had the lowest
deflection and the 2"R section had the highest deflection at all
but sensor 5 where the lowes twas 3"F and the highes t 2"NR. At
that time, lane 1 had the lowest deflection and lane 3 the highest.
These inferences on the lane factor are made for all five sensors.
In the MeA table, two descriptive statistics are used throughout: 8 and
mUltiple R2. The R2 represents that proportion of the total variation ~n the
deflection data which is explained by the lane or section factors. The R2
represents the combined (additive) proportion of the total variation
explained by all factors (lane, section, and cracking indicator).
As can be seen, multiple R2 ranges from 0.15 to 0.54; this ~s for real
life, raw data and suggests gOOd perfonnance of the analysis of variance
method for Dynaflect data analysis.
Dynaflect deflections were taken before and immediately after overlay
placement. This provides an opportunity to evaluate the immediate effect of
overlay placement on pavement deflections. Table 3.2 indicates that
RR357-2F/BB

120
virtually the same points were tested in May 1983 and September 1983.
Therefore, the difference in deflections, the before overlay minus that after
overlay, is analyzed using analysis of variance and the multiple
classification analysis. The results are summarized in Tables B.13 and B.14
respectively. From these tables, the following remarks can be made:
(1) Lan~ and section effects are significantly different at a = 0.05.
(2) Cracking is significant for sensor 1 and sensor 2.
(3) Lane by section interaction is significant at all five sensors.
(4) The weighted average deflection difference (i.e., grand mean l.n
Table B.14) decrease with radial distance from the loading wheels
(i.e., from sensor 1 to sensor 5).
(5) Section 3"R exhibits the highest reduction in deflection at all
sensors. The lowest reduction in deflection varied for the various
sensors.
(6) Lane 3 has the highest reduction l.n deflection and lane 1 the
lowest.
The R2 ranges from 0.25 to 0.40 in this analysis. To illustrate the
fluctuation of average deflection basins with survey date Figs B.1 through
B.4 were drawn in accordance with the cell means and the analysis of variance
results for the 3"R section where the highest reduction in deflection
occurreO. Thus, the lane, section and date effects are not confounded in
these graphs because they were all found to be significant. The four figures
are self explanatory. From the figures, it is apparent that the deflection
basins became much shallower (i.e., the structure became much stiffer) after
BCO placement (September 1983 data). This is especially noticeable at
sensors 1, 2, and 3 in all the figures. Sensor 5 deflections, reflective of
the subgrade properties, did not change significant ly over the two years of
observations. Finally, with successive survey dates, the deflections basins
are approaching their before construction condition.
RR3S7-2F/BB
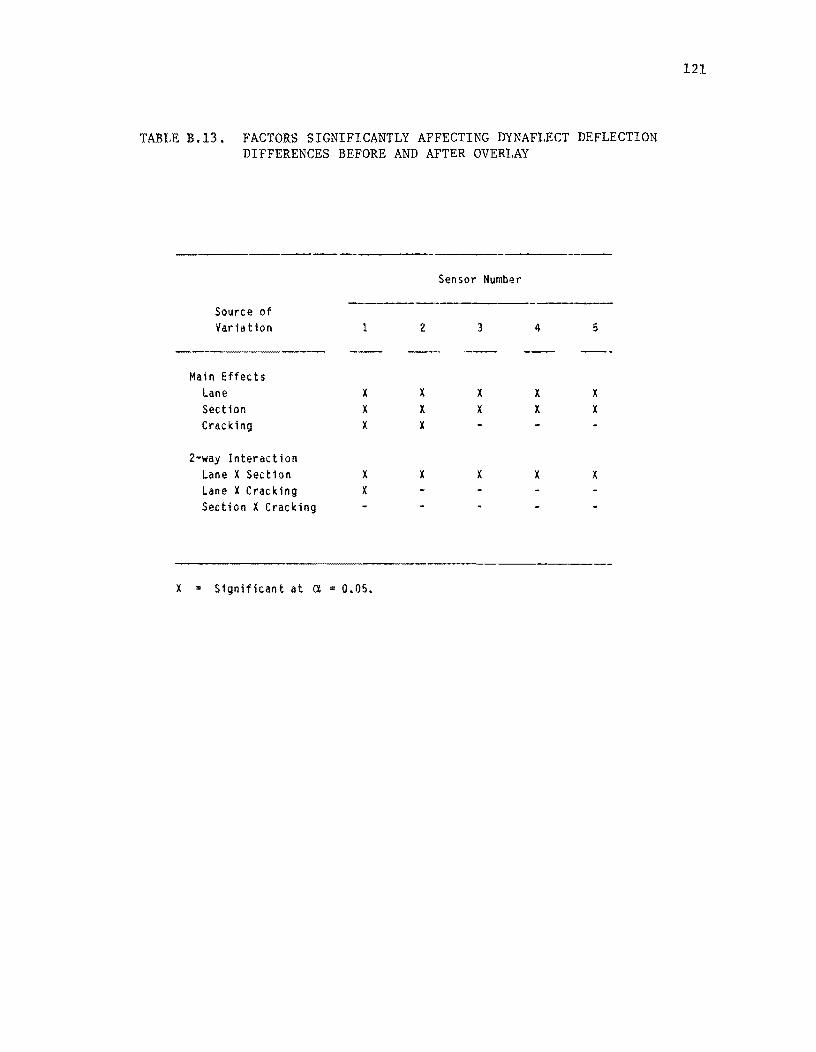
TABLE B.13. FACTORS SIGNIFICANTLY AFFECTING DYNAFLECT DEFLECTION DIFFERENCES BEFORE AND AFTER OVERLAY
---Sensor Number
---------.--Source of Variation 2 3 4 5
Main Effects Lane X X X X X Section X X X X X Cracking X X
2-way Interaction Lane X Section X X X X X Lane X Cracking X Section X Cracking
X :: Significant at a. = 0.05.
121
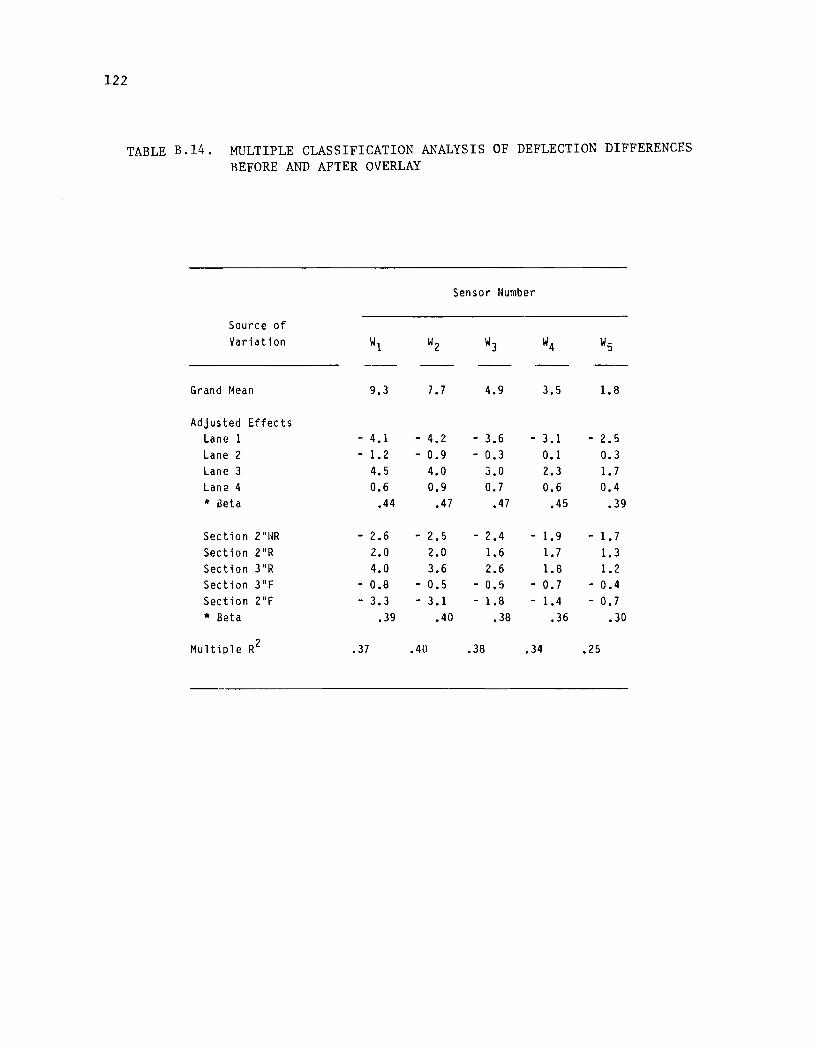
122
TABLE B.14. MULTIPLE CLASSIFICATION ANALYSIS OF DEFLECTION DIFFERENCES BEFORE AND AFTER OVERLAY
Sensor Number
Source of Variation W1 W2 W3 W4 W5
Grand Mean 9.3 7.7 4.9 3.5 1.8
Adjusted Effects Lane 1 - 4.1 - 4.2 - 3.6 - 3.1 - 2.5 Lane 2 - 1. 2 - 0.9 - 0.3 0.1 0.3 Lane 3 4.5 4.0 3.0 2.3 1.7 Lane 4 0.6 0.9 0.7 0.6 0.4 * Beta .44 .47 .47 .45 .39
Section 2"I~R - 2.6 - 2.5 - 2.4 - 1. 9 1.7 Section 2"R 2.0 2.0 1.6 1.7 1.3 Section 3"R 4.0 3.6 2.6 1.8 1.2 Section 3"F - 0.8 - 0.5 - 0.5 - 0.7 - 0.4 Section 2"F - 3.3 - 3.1 - 1.8 - 1.4 - 0.7 * Beta .39 .40 .38 .36 .30
Multiple R2 .37 .40 .38 .34 .25
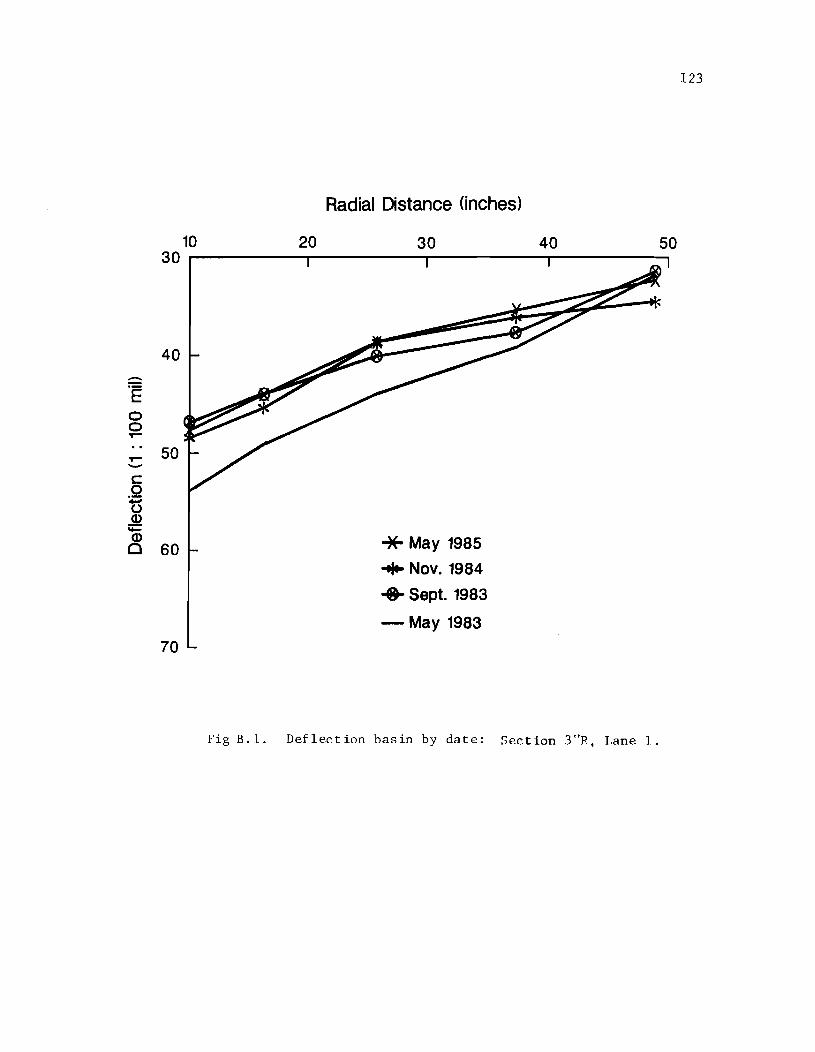
123
Radial Distance (inches)
10 20 30 40 50 30 ~--------,---------~----------.-------~
40
-"E 0 0 or-
or- 50 -c: 0 U Q) ~ Q) '* May 1985 £:) 60
... Nov. 1984
.. Sept. 1983
- May 1983
70
Fig B.lo Deflection basin by date: Section 3"R, Lane l.
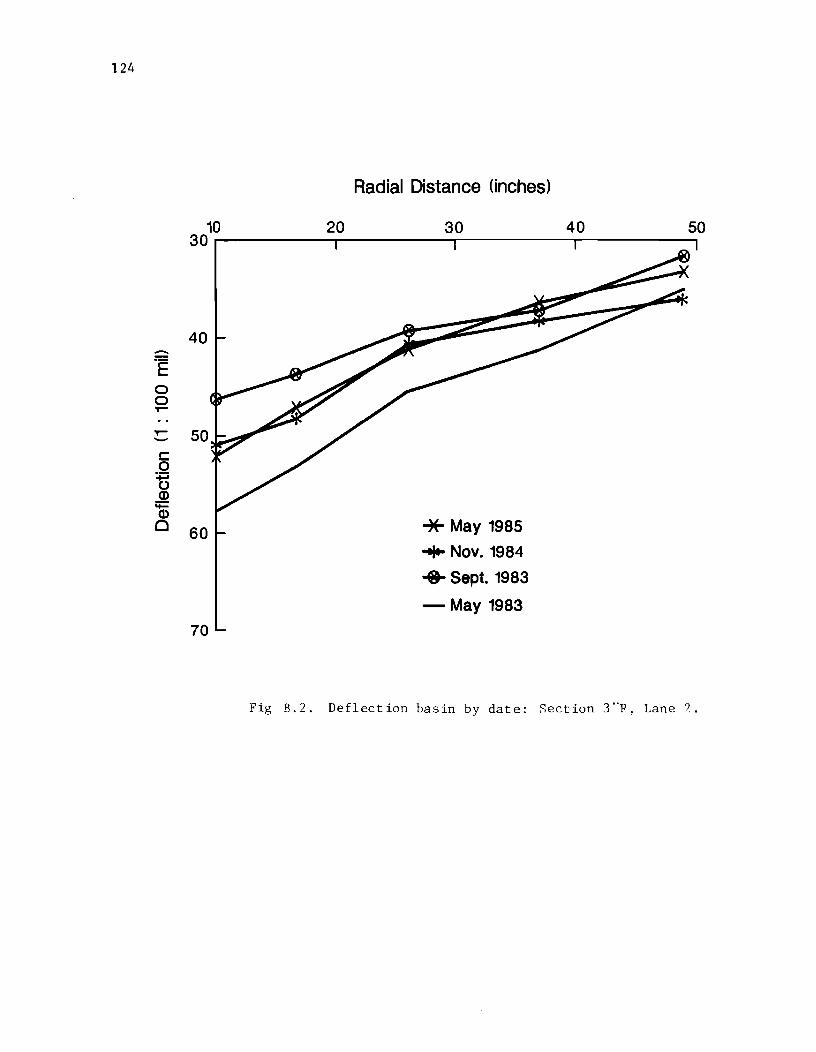
124
Radial Distance (inches)
10 20 30 40 50 30~--------~----------~-----------r----------~
40 -"E 0 0 T"""
T""" 50 -c:: 0 :g Q) ~ Q)
0 60 * May 1985
+ Nov. 1984
.. Sept. 1983
- May 1983
70
Fig B. 2. Deflect ion basin by date: Section 3 "R. Lane ?"
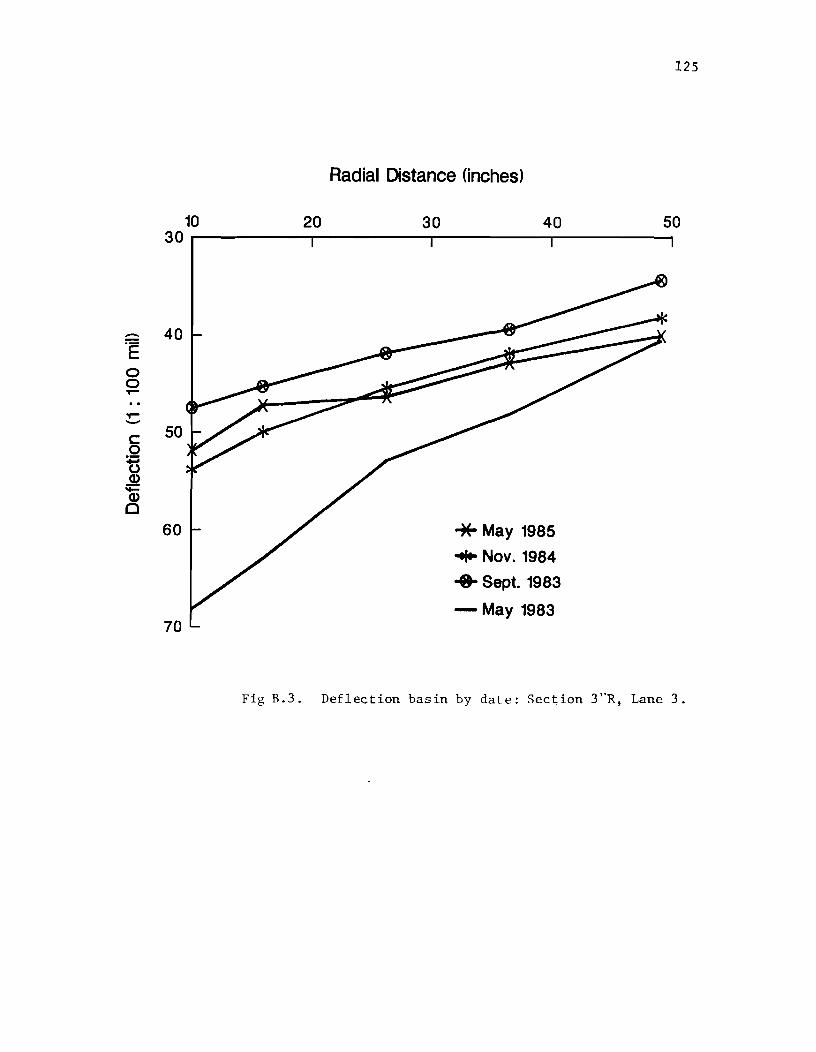
125
Radial Distance (inches)
10 20 30 40 50 30 ~--------~----------~----------~--------~
Fig E.3. Deflection basin by date: Section 3"R, Lane 3.
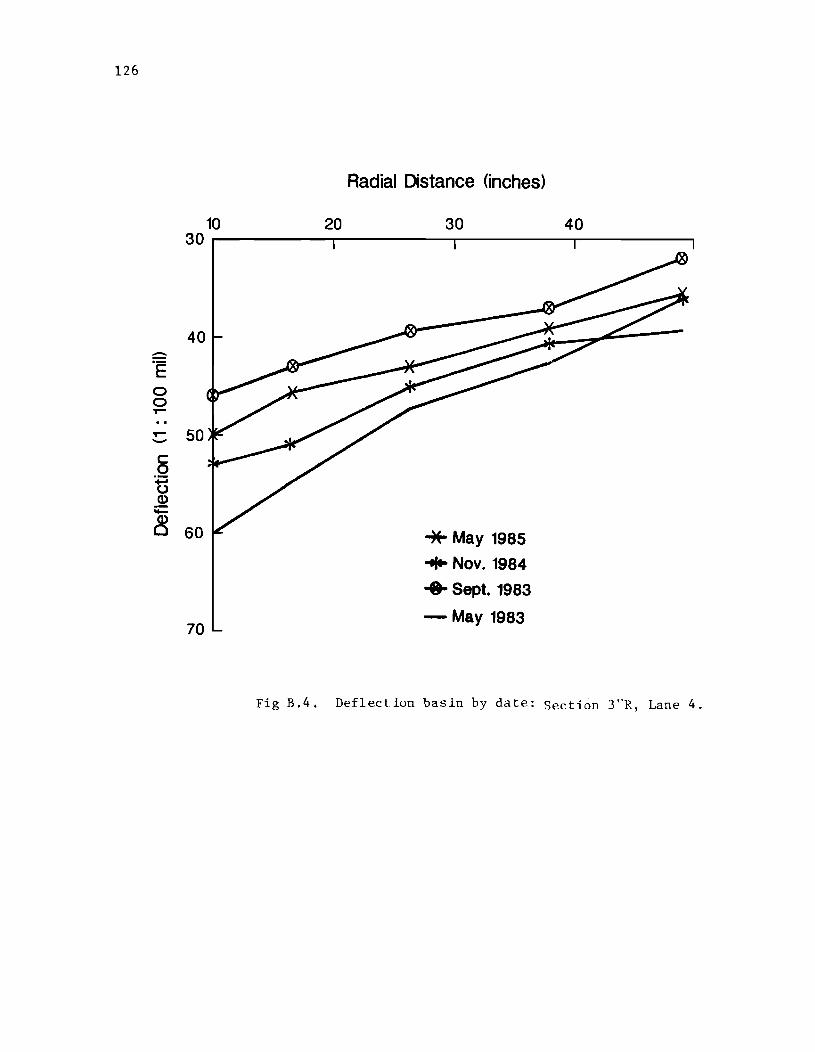
126
Radial Distance (inches)
10 20 30 40 30~--------~---------,----------~--------,
40 -'E 0 0 T"""
T""" 50 -c: .2 t5 (J)
OJ:
~ 60 "* May 1985
.. Nov. 1984
.. Sept. 1983
70 - May 1983
Fig B.4. Deflection basin by date: Section 3"R, Lane 4.
127
Multivariate ANalysis Qf VAriance (MANOVA) 1S used to complement the
univariate analysis of variance. In MANOVA, the information contained in the
deflection basin taken as a whole (i.e., sensor 1 through 5 readings) is used
to make inferences. The use of MANOVA at fords the stUdy of lane and section
contrasts (i.e., the comparison of mean deflections) for all five sensor
readings simultaneously. It may also be argued that the five sensor readings
on every test are correlated because of Dynaflect operational mode and
condition, and therefore that MANOVA is required in order to make appropriate
use of the total information collected (Ref 13). However, when the
inferences previously made vary for the five sensors, MAN OVA will provide
more definitive answers.
Sample input and output for subprogram MANOVA of the SPSS library are
presented in Fig B.S. The analysis starts by checking the homogeneity of
variance for the data set; this is required for the analysis to be valid.
The following were analyzed with MANOVA.
(1) Survey date effect (after overlay); whether or not, after the
initial significant reduction due to the various BCO designs, the
deflection basins were statistically different.
(2) Section effects by survey date; whether or not the results obtained
from the previous univariate analysis still hold when the
multivariate approach 1S used, and whether or not the inferences on
section effects can be made when these varied for the various
sensor readings.
(3) Immediate section effects nes ted in lane effects: whether or not
the immediate response of pavelilent after BCO exhibited a definite
and consistent trend within each lane (i.e., traffic level).
Table B.IS presents a summary of the multivariate Dynaflect data
analysis for the date effect. Four test statistics are used in subprogram
MANOVA of the SPSS library to make multivariate tests of significance:
RR3S7-2F/BB
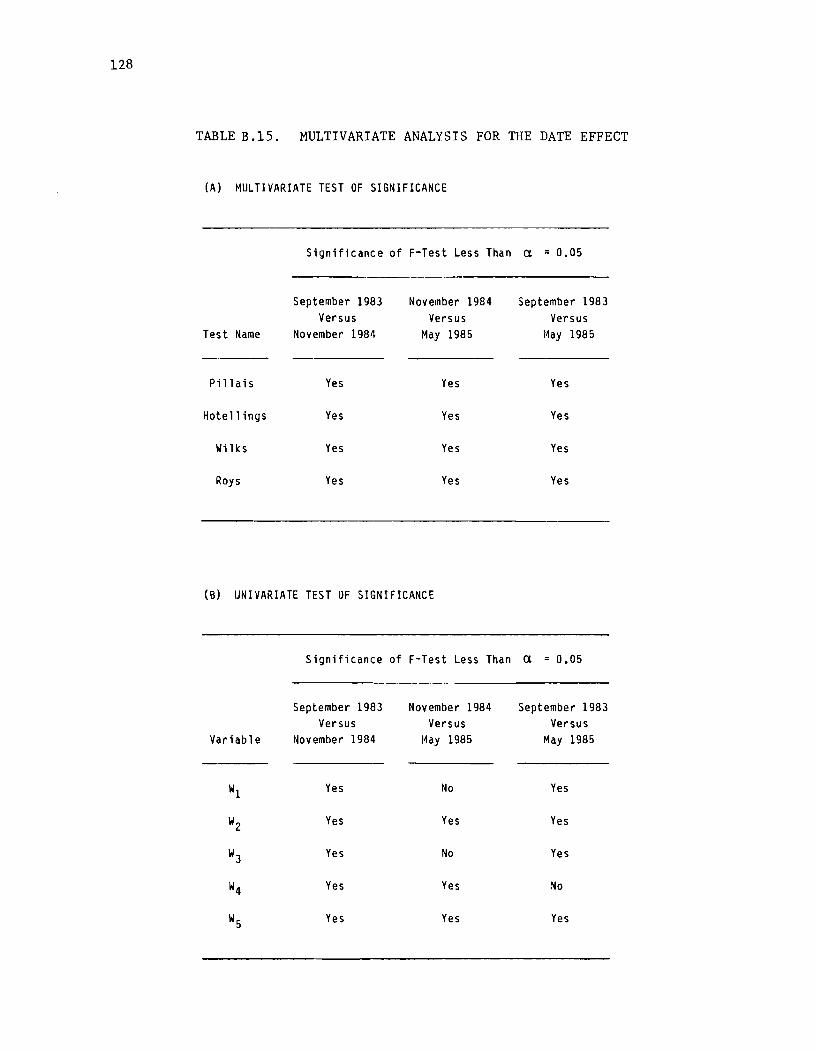
128
TABLE B.1S. MULTIVARIATE ANALYSIS FOR THE DATE EFFECT
(A) MULTIVARIATE TEST OF SIGNIFICANCE
Significance of F-Test Less Than (l = 0.05
September 1983 November 1984 September 1983 Versus Versus Versus
Test Name November 1984 May 1985 l~ay 1985
Pillais Yes Yes Yes
Hotellings Yes Yes Yes
Wi lies Yes Yes Yes
Roys Yes Yes Yes
(B) UNIVARIATE TEST UF SIGNIFICANCE
Significance of F-Test Less Than (l = 0.05
September 1983 November 1984 September 1983 Versus Versus Versus
Variable November 1984 May 1985 May 1985
WI Yes No Yes
Wz Yes Yes Yes
W3 Yes No Yes
W4 Yes Yes No
W5 Yes Yes Yes
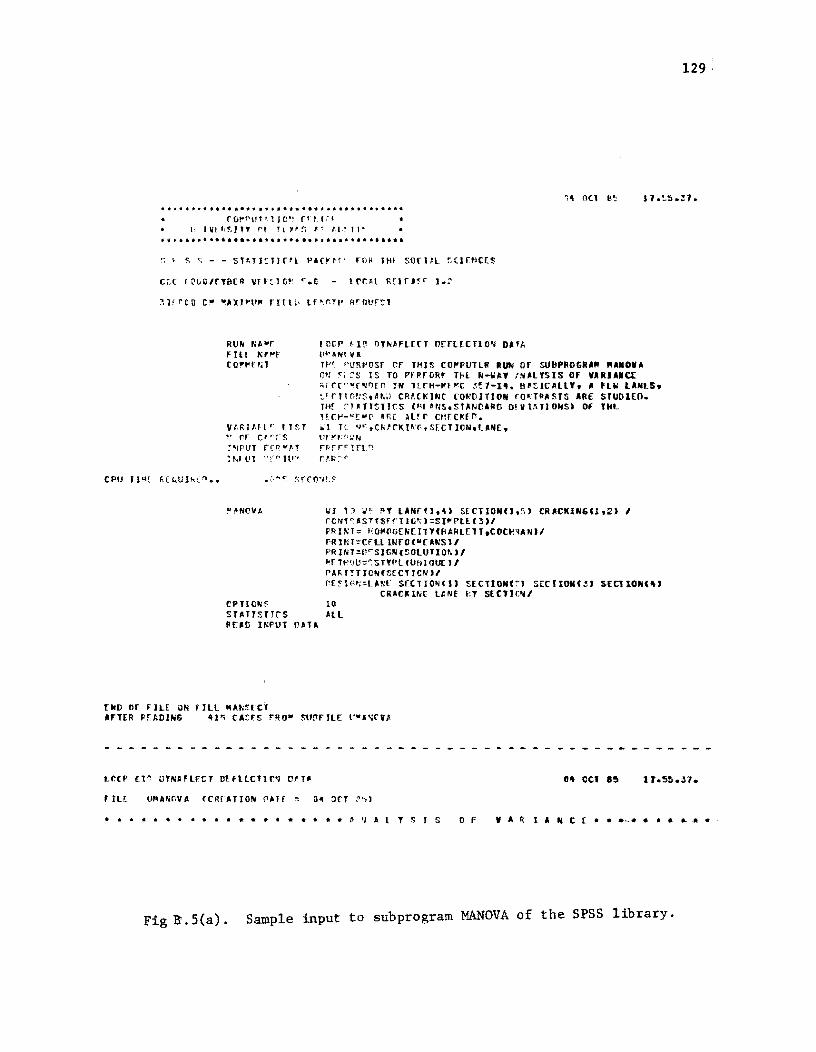
....... -.•.••.•....•.•..••.............. rO!"l"\n~' IO·~ f! t,f[J
" ) VI '<~,1 n' N H"!; " fl·~"· •• ~ •••••••••••••••••• * ••••••••••••••••••
:; , ~ <; - - str,T J~lJrrl PACI'H' FOil IHf SOCJf.L ~(JnltE.S
CPU fl~[ fiELUlhrn ••
RU'" Njl"r fIll P,;'''f co" .. r",
V(,RIMI ,. ll~l
/' rr U'c's :'jPLll [(P.",·r ~Ml'l "C"H'"
ID~r ~l~ nTNJfLEtT o[rLECTIO~ D." t"' •. N!"" H't" "LlRI'osr Cf THIS rOP'PUTlII RUti or SUflPIIOGRA'" "A"O"A C~I ~;;"5 IS TO PfRfORr THl N-WAY tN_lYSIS Of VARUIIC[ ;rcr-vr.Drn IN Tr[H-P'fl'C ~~1-14. 8,tlCAlLY. A FLW LANLS. :..' rT!rms.~";J CRlI(lONt COIWITION rOa:TPASTS AilE STUDIEO. Tltr ;HTTSTICS ("P/lS.STIWClRO D!ViIlTlONS) Of THL Tfcp--r"p IRE ~l!C C~[CKf".
~l Tl u~.t~'rKI~~,S[CTION.l.~£, II/n:r, ;IN f~rr~! ft!") rf.f:;~"
!"MICVA \/1 h1 \I'" !'IT LAN[fl.H S(CTIONlI,',) CRACKIN6U,:n I rONT~A5T{SrrT10~)=sI"PL[(5JI
PRIN1= HO~PGEH(ITY(BARl£TT.COC~qANJI PRtfl1-:CfLl Il11fO("(ANSlI PRINI~prSlGN(SOLUTIO~)1
"'r TWlO:::': STTf'[(Uf'1l QU[ ) I PA~f~TION(S(CTICN)1
ITl'lq:=U.~[ SfCHONU) S[CTlON(~) s;::CnOIl(;5J SECII0N('" CRACI( INC UNF r;Y S£CTlC>'( I
CPIICNl' 10 STATISTYCS All 1\£:,,0 IP,;PUT I'~ H
[ND or fiLE UN ftLl "A~SfCl ArTER PeliDING 41<; CAns ,RO" !:lI!1F'JLt: \''',':rV,!i
LCtP E.1 ~ OTNA fLfeT Dffl(CTJ C'J 0' r_ 114 eCI 8'!1
[IL[ U~ANnVA (eRrATION n~fr = G~ ~rT ~~l
129 '
.6 •••••••••••••••••• r.'JAlT~JS o r "ARl"NC(·.····.·.~ .. •
Fig B'. 5(a) . Sample input to subprogram MANOVA of the SPSS library.
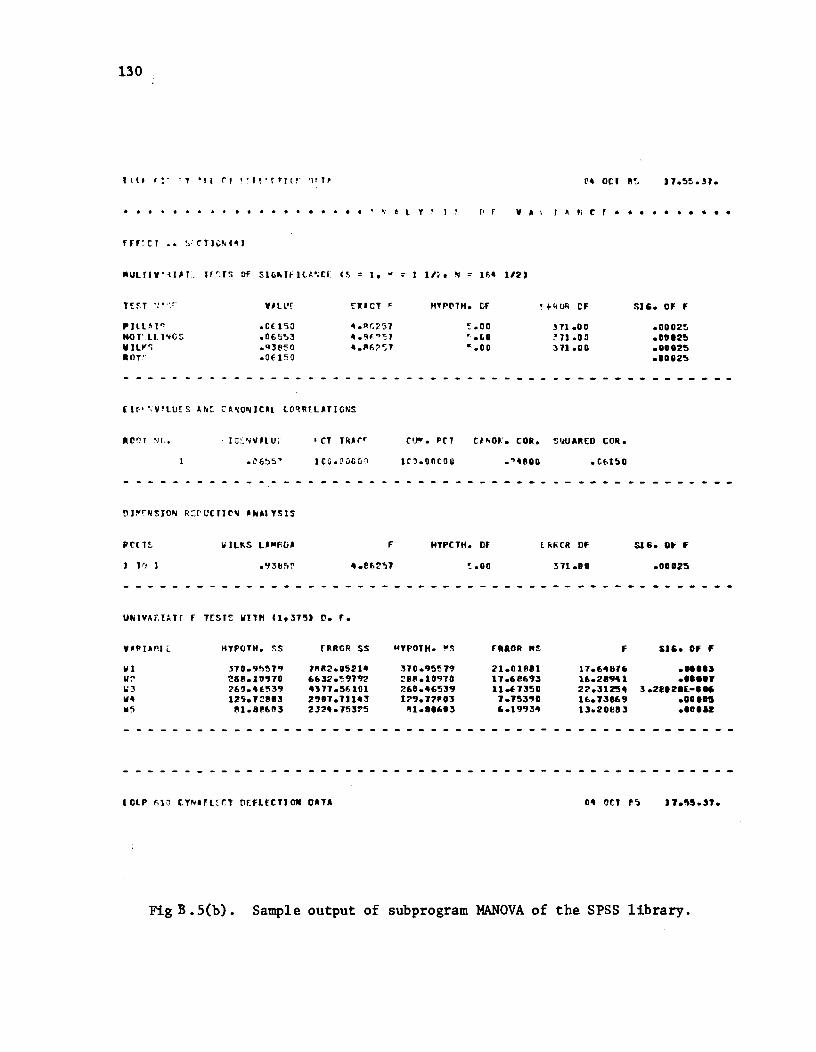
130
llll ':- "'fl rl !'I!'rrJ(T '1'1'
• • • • • • • • • • • • • • • • • • • • • .... a l T .- J ~ VA\J~.:cr· ••• • •••••
rrr'C1 •• :" CYlIi"(~'
TE~,T ':""-~ V#ll'[ rUeT ~ H'PClTH. CF • HOI< OF SUi. OF F
PILL ... " • C ( 150 4.~~251 ~.DD '11 .00 .0002~ "0 T'.lI. )'ICS .065':>3 _ .'If·"'S7 "' .L8 ! 71.00 .DII'2!l lillY" .q3e~O _."'6~~7 "'.00 3 71 .00 .110825 .Oye .OE 150 .0882!t
IIca, 'J( .• elJ'l'. PCl
H'.OOCOO .:>-880 • tbl5 0
IIC( 1~ WILliS lA"f;[;A F HYPCTH. OF l HeR DF Sl6. at' F
!..80 371.80 .00025
U~IYA~IATr F T[5T~ WIT~ (1,375' O. F.
V_PIARI ~ HYPOTH. S5 [!lROR SS "'POTH. ""I rRaOR ..~ F S15. OF F
WI HO.9!>57" 711112.0521" 370.95~7'] 21.01881 17."4816 ..... s II:' 288.10970 6632.~,)7'J2 2811.10,]70 17.6e693 16.28941 ..... y 1;:1 26~."(!l39 ...,n.56101 260.46539 lloETl5D 22'.31254 S .2et21l.-'"
.. -12'>.72813 2917.7U43 1:>,).7211103 1.153.,0 16.13069 .110."
115 "'1.8P6!l3 2J24.753:>5 111.1."13 6.1,],]34 13.208113 .,0.S2
- - - - - -- - - - - - - - --- - - - - - - - - -- - - - - - - - -- - - -
04 OCT ".,
Fig B .5(b). Sample output of subprogram MANOVA of the SPSS library.
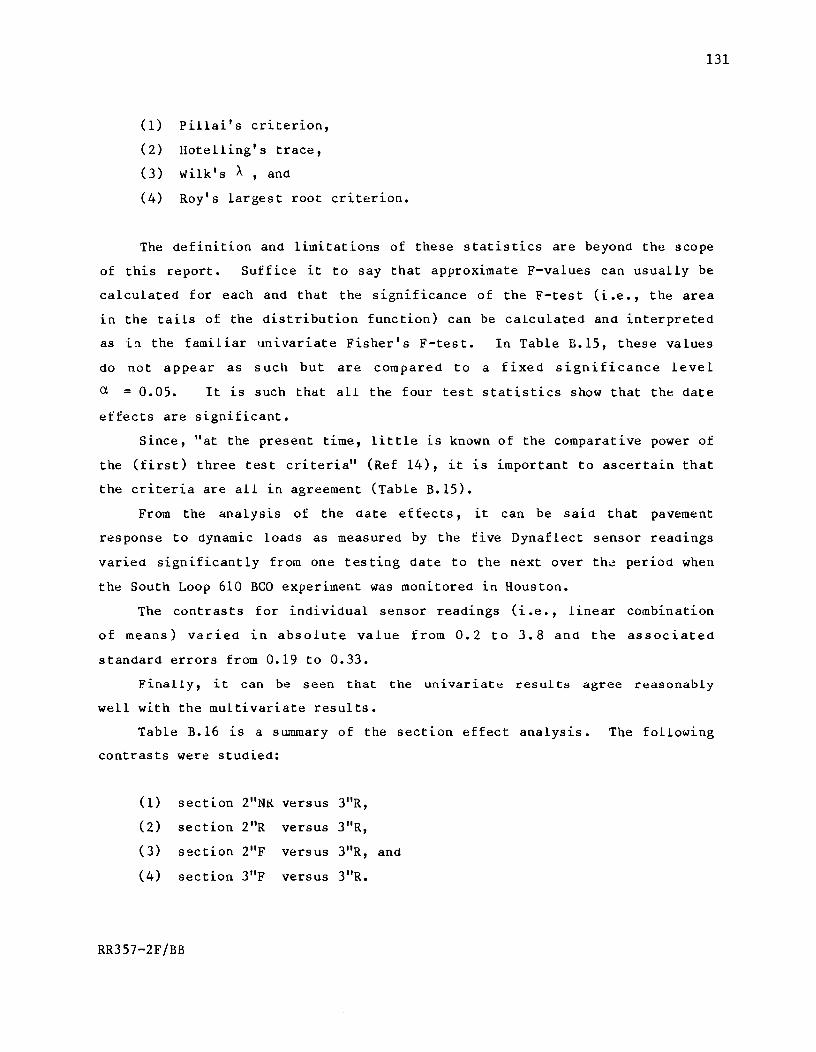
(1) Pillai's criterion,
(2) Hotelling's trace,
(3) wilk's A , and
(4) Roy's largest root criterion.
131
The definition and limitations of these statistics are beyond the scope
of this report. Suffice it to say that approximate F-values can usually be
calculated for each and that the significance of the F-test (i.e., the area
in the tails of the distribution function) can be calculated and interpreted
as in the familiar univariate Fisher's F-test. In Table E.Is, these values
dO not appear as such but are compared to a fixed significance level
ex = 0.05. It ~s such that all the four test statistics show that the date
effects are significant.
Since, "at the present time, little is known of the comparative power of
the (first) three test criteria" (Ref 14), it is important to ascertain that
the criteria are all in agreement (Table B.ls).
From the analysis of the date effects, it can be said that pavement
response to dynamic loads as measured by the five Dynaflect sensor readings
varied significantly from one testing date to the next over th~ period when
the South Loop 610 BCO experiment was monitored in Houston.
The contrasts for individual sensor readings (i.e., linear combination
of means) varied in absolute value from 0.2 to 3.8 and the associated
standard errors from 0.19 to 0.33.
FinalLy, it can be seen that the univariate results agree reasonably
well with the multivariate results.
Table B.16 is a summary of the section effect analysis. The following
contrasts were studied:
(1) section 2"NK versus 3"R,
(2) section 2"R versus 3 "R,
(3) section 2"F versus 3"R, and
(4) section 3"F versus 3"R.
RR3s7-2F/BB
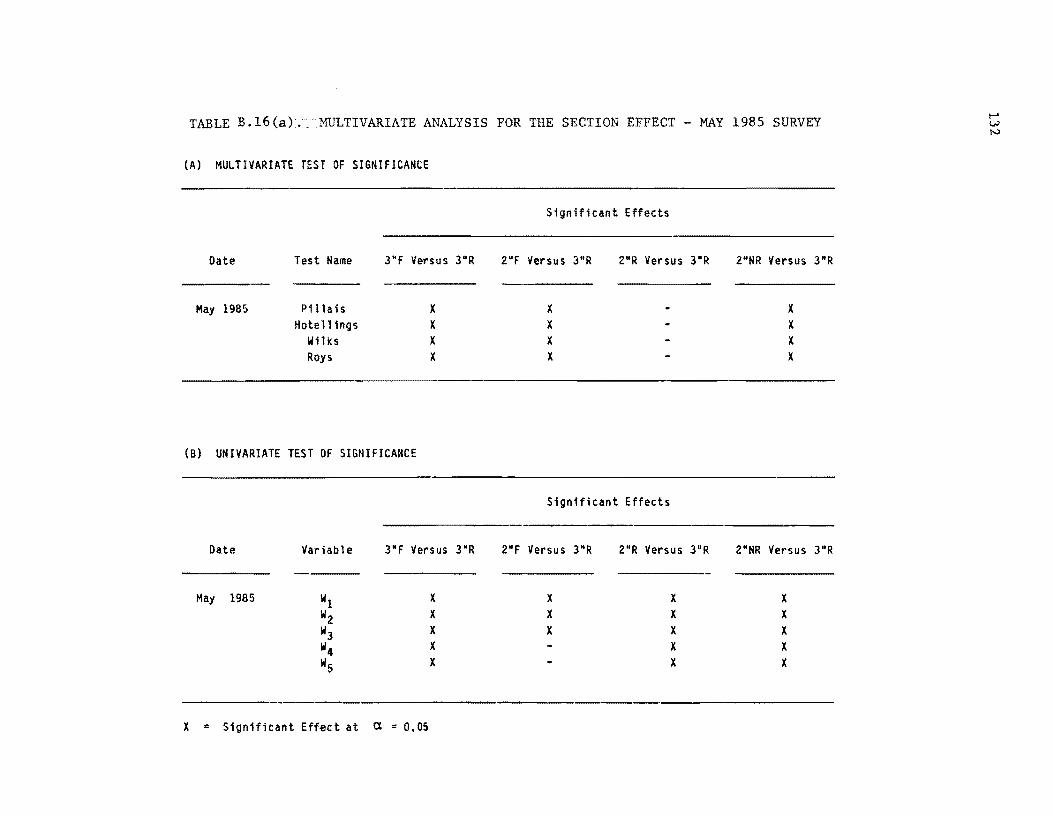
TABLE B.16(a).MULTIVARIATE ANALYSIS FOR THE SECTION EFFECT - MAY 1985 SURVEY
(A) MULTIVARIATE TEST OF SIGNIFICANCE
Date Test Name 3"F Versus 3"R
May 1985 Pi11ais Hotell 1ngs
Wilks Roys
(B) UNIVARIATE TEST OF SIGNIFICANCE
x X X X
Date Variable 3"F Versus 3"R
May 1985 WI Wz W3 W4 W5
X Significant Efft!ct at a .. O.OS
X X X X X
Significant Effects
ZMF Versus 3°R
X X X X
ZOR Versus 3°R
Significant Effects
Z"F Versus 3-R
X X X
Z"R Versus 3"R
X X X X X
Z"NR Versus 3"R
X X X X
Z"NR Versus 3°R
X X X X X
~ iJ.J t-J
TABLE B.16(b). MULTIVARIATE ANALYSIS FOR THE SECTION EFFECT - NOVEMBER 1984 SURVEY
(A) MULTIVARI~TE TEST OF SIGNIFICANCE
Date Test Name 3"F Versus 3"R
-----November 1984 Pillais X
Hotellings X Wil ks X Roys X
(8) UNIVARIATE TEST OF SIGNIFICANCE
Date
November 1984
Variable
WI W2 W3 W4 Ws
3"F Versus 3"R
X X X X X
---------------------------------X Significant Effect at a = 0.05
Significant Effects
2"F Versus 3"R
X X X X
2"R Versus 3"R
Significant Effects
2"F Versus 3"R 2"R Versus 3"R
X
X
X
2"NR Versus 3"R
X X X X
2"NR Versus 3"R
X X
X X X
... w w
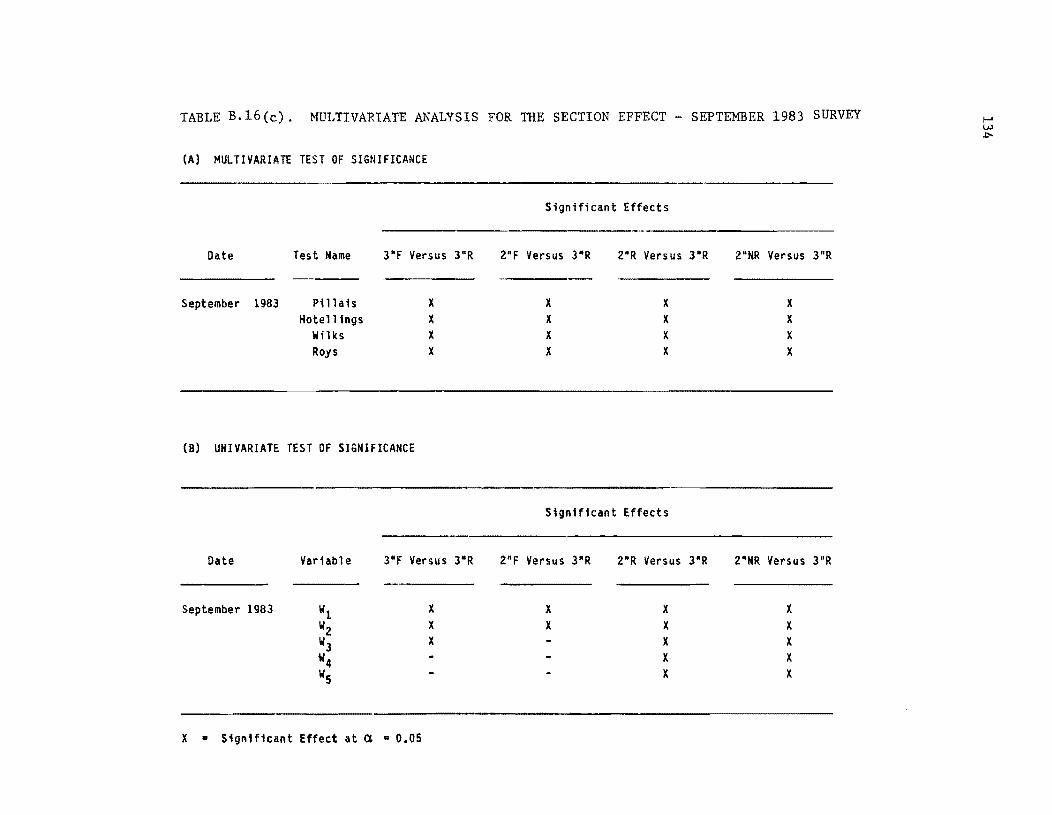
TABLE B.16(c). MULTIVARIATE ANALYSIS FOR THE SECTION EFFECT - SEPTEMBER 1983 SURVEY
(A) MULTIVARIATE TEST OF SIGNIFICANCE
Date Test Name 3"F Versus 3"R
September 1983 Pillais X Hotellings X
Wilks X Roys X
(8) UNIVARIATE TEST OF SIGNIFICANCE
Date Variable 3-F Versus 3-R
September 1983 W1 W2 WJ "4 Ws
X • Significant Effect at a • O.OS
X X X
Significant Effects
2"F Versus 3-R 2"R Versus 3"R
X X X X X X X X
Significant Effects
2"F Versus 3a R
X X
2"R Versus 3a R
X X X X X
2HMR Versus 3"R
X X X X
2"NR Versus 3"R
X X X X X
'"'" w .p..
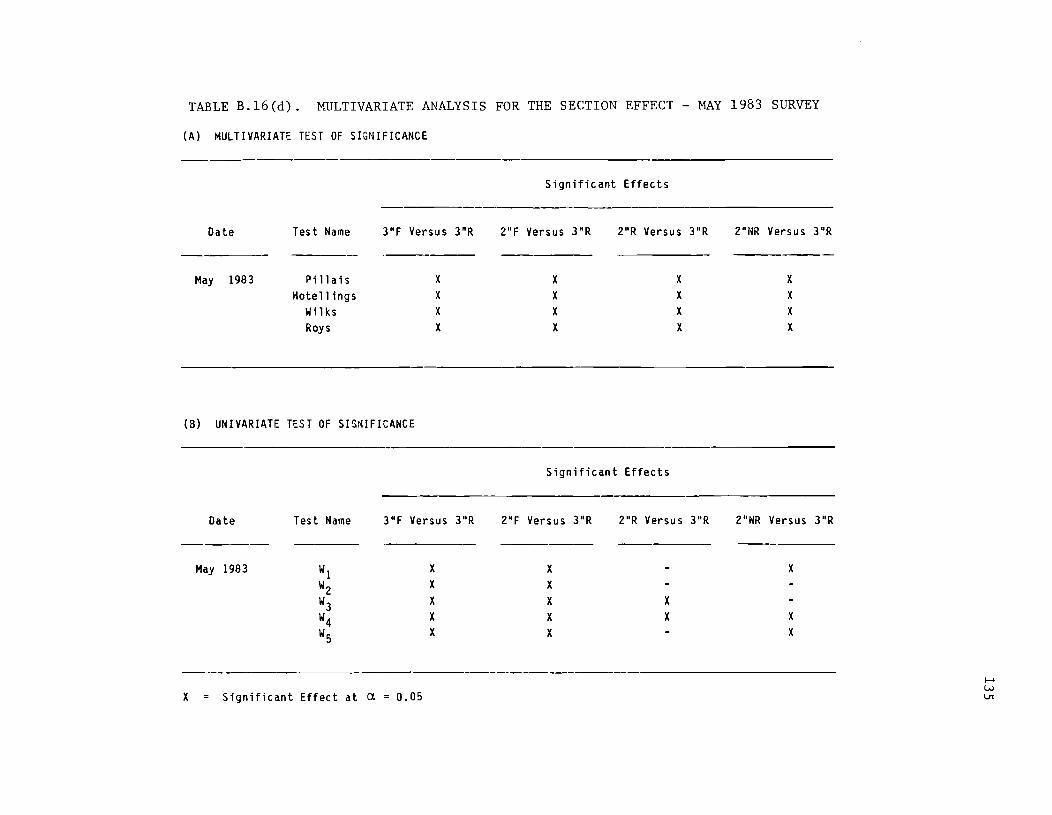
TABLE B.16(d). MULTIVARIATE ANALYSIS FOR THE SECTION EFFECT - MAY 1983 SURVEY
(A) MULTIVARIATE TEST OF SIGNIFICANCE
Date
May 1983
Test Name
Pi11ais Hotellings
Wi] ks
Roys
3"F Versus 3"R
.------
x X X X
(8) UNIVARIATE TEST OF SI5NIFICANCE
Date
May 1983
Test Name
W1 W2 W3 W4 W5
3"F Versus 3"R
X X X X X
Significant Effects
2"F Versus 3"R
X X X X
2"R Versus 3"R
X X X X
Significant Effects
2"F Versus 3"R 2"R Versus 3"R
X X X X X X X
---------------------------------.--------X Significant Effect at a. 0.05
2"I~R Versus 3"R
X X X X
2"NR Versus 3"R
X
X X
'""' W \J1
136
The reader may recall that the 3-inch steel-mat-reinforced section (i.e,
3"R) had the greatest reduction in deflection immediately after overlay. For
this reason, it is compared to all other sections for the four dates when
deflection data were collected.
From Table B.16, the following remarks can be made:
(1) The multivariate tests are all significant for the contrasts
studied except for the 2"R versus 3"R contrast in May 1985 and
November 1984. For these two data sets, it follows that if one
accounts for the random variation due to lane, cracking indicator
of the base eRep and lane by section interaction, then the 2"R
section exhibits statistically the same deflection characteristics
as the 3"R section; this inference can be made with 95 percent
confldence. All other sections have deflection characteristics
statistically different from the 3"R section.
(2) The univariate tests of significance obtained from MANOVA are
presented to indicate which sensor reading may have influenced the
mul tivariate resul ts. They are otherwise essentially the same as
was reported at the start of the study (i.e., univariate ANOVA).
Finally, the immediate effect of BeO placement is studied again from the
multivariate vantage point. Two main effects are examined corresponding to
the main factors of the experiment design: (1) materials and (2) overlay
thickness.
Specifically, the contrasts studied are as follows:
(1) 2"NR versus 2"R
1 (2) 2"NR versus 2"F
(3) 2"R versu~ 2"F material
(4) 3"R versus 3"10'
1 ( 5) 2"R versus 3"R
( 6) 2HF versus 3"F overlay thickness
RR357-2F/BB
137
Since, the univariate ANOVA had revealed a significant lane by section
interaction, the nested design feature of subprogram MANOVA is used to assess
the effects of the six contrasts above.
In esseuce, lane becomes the blocking variable: the variations between
lanes are not investigated as such but rather the variation within each lane.
This analysis is summarized in Table B.17. From Table B.l7, the
following remarks can be made:
(1) The 2"F and 3"F sections are statistically different ~n lane 3 and
lane 2 only.
(2) The 2"R and 3"R sections are statistically different in lane 3
only.
Recall ing that be fore over lay placement, (May 1983 data set)
lane 3 had the highest deflection at all 5 sensors (see Table B.12)
followed by lane 4, lane 2 and lane 1, it can be said that the
thickness effect as revealed by the two contrasts above is a
function of traffic level where lane number ~s a substitute
variable for traffic level. In other words, for a low level of
traftic loading, the thickness effect ~s negligible. As traffic
level increas es, thickness effect becomes significant; therefore,
there seems to be a threshold of traftic beyond which thickness of
overlay becomes important for the two materials used ~n the South
Loop 610 experiment, and the threshold is reached for the fiber
before the steel mat.
(3) The 3"R and the 3"F sections have significantly differt:nt
deflection basins in lane 3 only.
(4) The 2"R and the 2"F sections have significantly different
deflection basins in lane 3, lane 4, and lane 1.
(5) The 2"NR and the 2"F sections have significantly different
deflection basins in lane 3, lane 4, and lane 2.
(6) The 2"NR and the 2"R sections have significantly different
deflection basins in lant: 3 and lane 2.
RR357-2F/BB
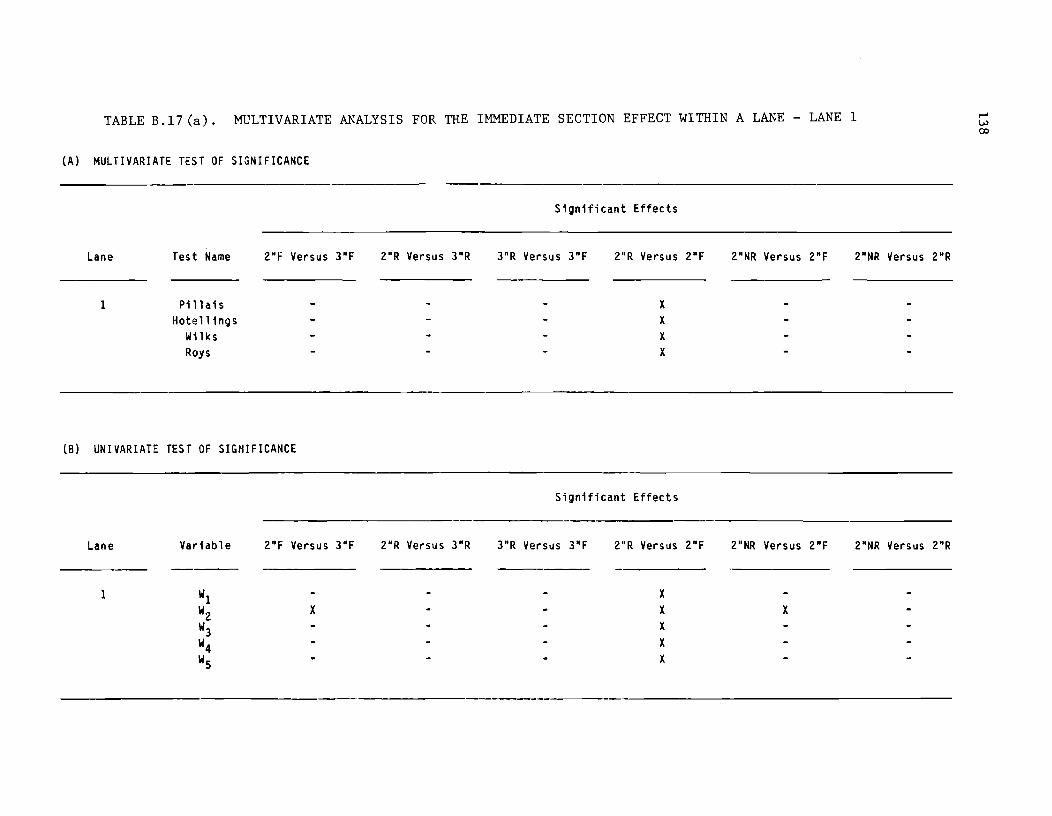
TABLE B.17 (a). MULTIVARIATE ANALYSIS FOR THE IMMEDIATE SECTION EFFECT WITHIN A LANE - LANE 1
(A) MULTIVARIATE TEST OF SIGNIFICANCE
Lane
I
Test Name
Pillais Hotellings
Wilks Roys
ZHF Versus 3"F
(B) UNIVARIATE TEST OF SIGNIFICANCE
Lane
I
Variable
WI Wz W3 W4 Ws
2"F Versus 3"F
X
Z"R Versus 3"R
2"R Versus 3"R
Significant Effects
3"R Versus 3"F Z"R Versus Z"F
x X X X
Significant Effects
3"R Versus 3"F 2"R Versus 2"F
X X X X X
Z"NR Versus 2"F 2"NR Versus 2"R
2"NR Versus 2"F 2"NR Versus 2"R
X
~ w 00
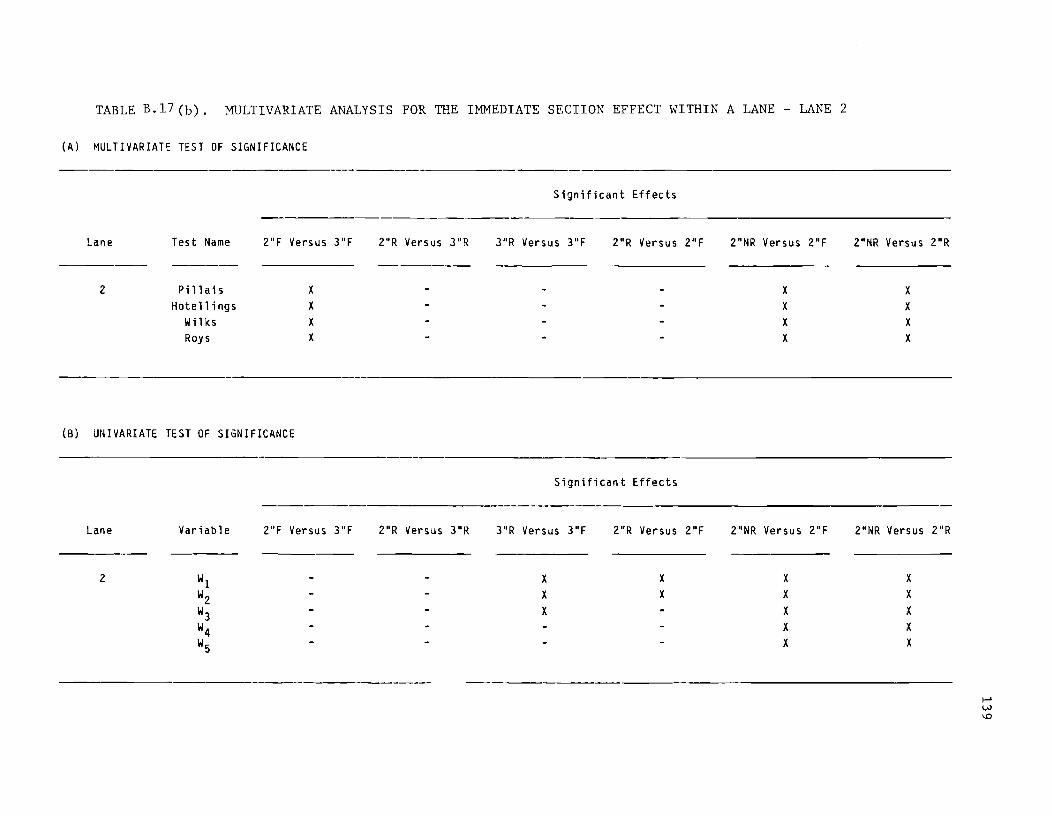
TABLE B.17(b). MULTIVARIATE ANALYSIS FOR THE IMMEDIATE SECTION EFFECT WITHIN A LANE - LANE 2
(A) MULTIVARIAT~ TEST OF SIGNIFICANCE
Lane
2
Test Name
Pillais Hotellings
Wil ks Roys
2"F Versus 3"F
x X X X
(B) UNIVARIATE TEST OF SIGNIFICANCE
Lane
2
Variable
Wl W2 W3 W4 Ws
2"F Versus 3"F
2"R Versus 3"R
2"R Versus 3"R
Significant Effects
3"R Versus 3"F 2"R Versus 2"F
Significant Effects
3"R Versus 3"F
X X
X
2"R Versus 2"F
X X
2"NR Versus 2"F
X X X X
2"NR Versus 2"F
X X
X X X
2"NR Versus 2"R
X X X X
2"NR Versus 2"R
X X
X X X
~ W \0
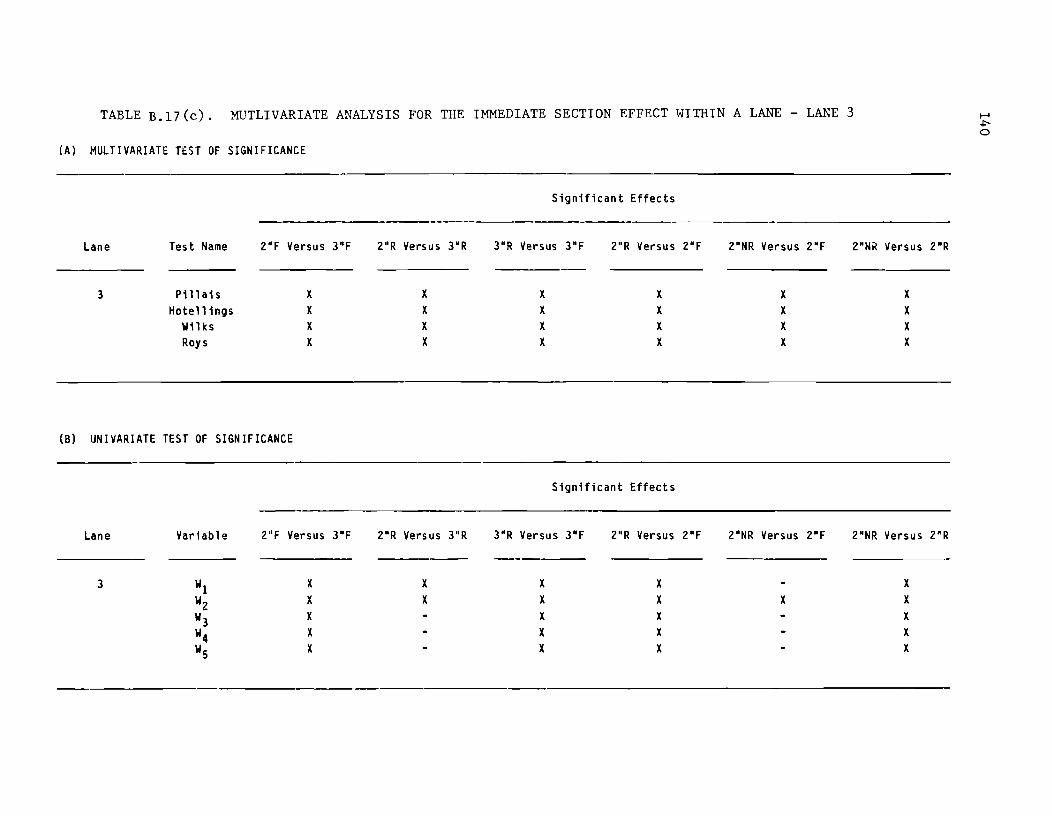
TABLE B.17(c). MUTLIVARIATE ANALYSIS FOR THE IMMEDIATE SECTION EFFECT WITHIN A LANE - LANE 3
(A) MULTIVARIATE TEST OF SIGNIFICANCE
Lane Test Name 2"F Versus 3"F
3 Pillais X Hotellings X
Willes X Roys X
(8) UNIVARIATE TEST OF SIGNIFICANCE
Lane
3
Variable
WI W2 W3 W4 W5
2"F Versus 3"F
X
X X X X
2"R Versus 3"R
X X X X
2"R Versus 3"R
X X
Significant Effects
-----3"R Versus 3"F 2"R Versus 2"F
X X X X X X X X
Significant Effects
3"R Versus 3"F
X X X X X
2"R Versus 2"F
X X X X X
2"NR Versus 2"F
X X X X
2"NR Versus 2"F
X
2"NR Versus 2"R
X X X X
2"NR Versus 2"R
X X X X X
I-' ~ o
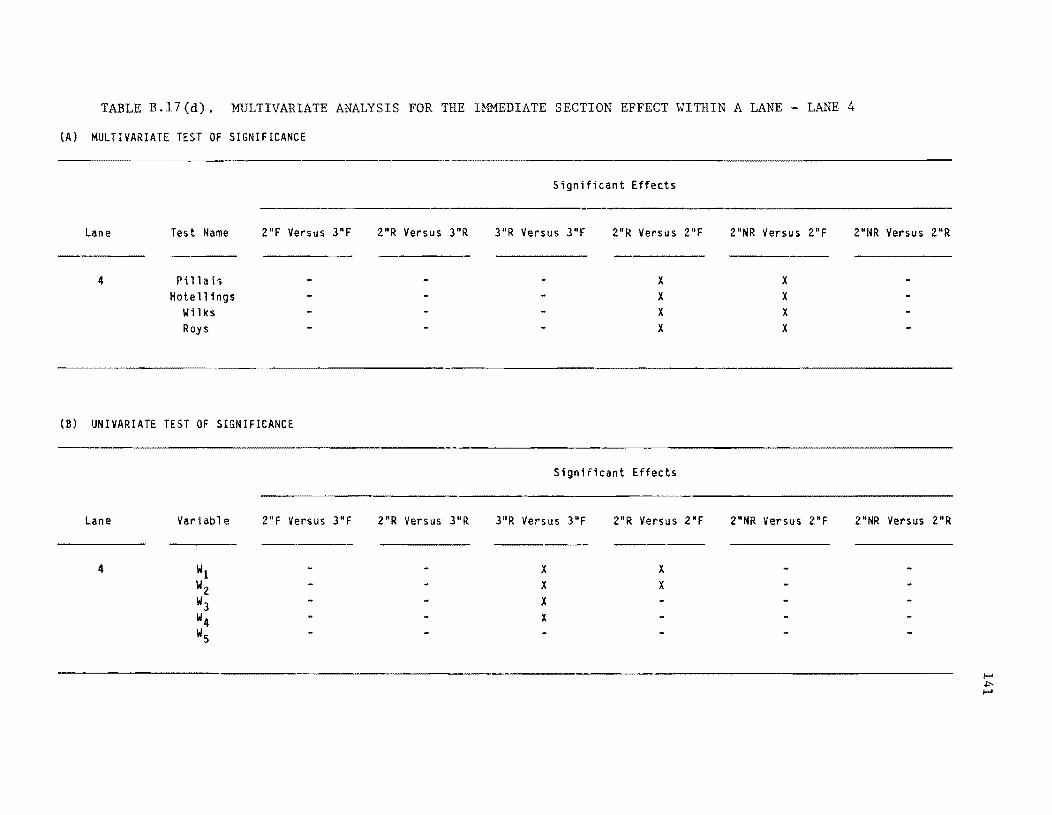
TABLE B.17(d). MULTIVARIATE ANALYSIS FOR THE IMMEDIATE SECTION EFFECT WITHIN A LANE - LANE 4
(A) MULTIVARIATE TEST OF SIGNIFICANCE
Lane
4
Test Name
Pillais Hotell ings
Wil ks Roys
----------,---""
Z"F Versus 3"F
(B) UNIVARIATE TEST OF SIGNIFICANCE
Lane
4
Variabl e
WI Wz W3 W4 Ws
Z"F Versus 3"F
Z"R Versus 3"R
Z"R Versus 3"R
Significant Effects
3"R Versus 3"F Z"R Versus Z"F
x X X X
Significant Effects
3"R Versus 3UF
X X
X X
Z"R Versus Z"F
X X
Z"NR Versus Z"F
X X X X
Z"NR Versus Z"F
Z"NR Versus Z"R
Z"NR Versus Z"R
I-' .... I-'

142
These r~sults reflect on the structural value of the two types of
materials investigated; results (3) and (4) indicate that for the low level
of overlay thickness (i.e., 2 inches) the fiber and steel mat material
performed significantly differently in their ability to reduce pavement
oeflection. At th~ high level of thickness (Le., 3 inches) the two
materials performed the same except when traffic level was high.
Results (5) and (6) indicate that for the low level of thickness, the
inclusion of fiber in the paving concrete resulted in a significant change in
the deflection basins whereas the inclusion of steel mats in the paving
concrete resulted in significant change only when the traffic level or
intensity had been high.
To sum it up, within the realm of the variables investigated, the most
structural benefit is obtained by using fibrous concrete in BCQ construction
when traffic Level and intensity are low and steel-mat-reinforced concrete
when traffic level and intensity are high.
RR357-2F/BB