an examination of the sales and use tax …ageconsearch.umn.edu/bitstream/157013/2/amanda imes...
TRANSCRIPT

AN EXAMINATION OF THE SALES AND USE TAX GAP BASED ON MINNESOTA AUDIT EXPERIENCE
A PLAN B PAPER
SUBMITTED TO THE FACULTY OF
UNIVERSITY OF MINNESOTA
BY
AMANDA J THOE IMES
IN PARTICULAR FULFILLMENT OF THE REQUIREMENTS
FOR THE DEGREE OF
MASTER OF SCIENCE
LAURA KALAMBOKIDIS
AUGUST 2013
The views expressed in this paper are those of the author and do not necessarily reflect the views of the Minnesota Department of Revenue. The estimates reported here are the author's and are not official estimates of Minnesota Department of Revenue. All questions regarding the estimates should be directed to the author.

ii
©Amanda J Thoe Imes 2013

CHAPTER 1. INTRODUCTION
iii
ACKNOWLEDGEMENTS
It is with immense gratitude that I acknowledge the support of my advisor, Dr. Laura Kalambokidis, Minnesota State Economist. Her guidance and expertise has encouraged me throughout the completion of this project.
This project would not have been possible without the support of Dr. Paul Wilson, Director of Tax Research at the Minnesota Department of Revenue. His knowledge of the Minnesota tax system and his countless insights into the relevance of the study have been instrumental in the completion and analysis of the findings.
Finally, I’d like to thank Dr. Tom Stinson and Dr. Judy Temple for serving on my advisory committee. Their careful editing and input in selecting the appropriate model for the data were greatly appreciated.

CHAPTER 1. INTRODUCTION
iv
ABSTRACT
This paper examines the size and composition of the sales and use tax gap in Minnesota. The first segment of this thesis estimates the gap primarily attributed to business-to-consumer sales using data on remote sales collected by the U.S. Census Bureau. Business-to-consumer sales are primarily sales to individuals, while business-to-business sales are primarily sales to firms. We find…The second segment of the paper examines unremitted sales and use tax, primarily attributed to business-to-business sales, using data from audits conducted by the Minnesota Department of Revenue. It is important to note that while e-commerce does play a significant role in the underreporting of use tax, the sales tax gap is largely comprised of noncompliance unrelated to e-commerce. While capturing lost tax revenue to e-commerce will significantly decrease the size of the use tax gap, a sales tax gap will persist.
We find that, after controlling for audit selection, the estimated sales tax gap to be between $263 million to $1,039 million dollars each year. The use tax gap is somewhere between $261.3 million dollars and $400.3 million dollars. We also find that find larger firms are more likely to be audited, but that they are more likely to yield a no-change assessment, indicating that compliance increases as firm size increases. However, the size of audit assessments increase as tax liability increases, which likely explains why audit rates increase as firm size increases. We also find that firms with out of state addresses are less likely to be audited but are more likely to be noncompliant. Finally, from our analysis of the predicted magnitude of noncompliance, we can conclude that, after controlling for firm size and audit selection, the industries most likely to yield high use tax audit assessments are firms in the Mining and Utilities and Finance & Insurance industries. Firms most likely to yield high sales tax audit assessments are firms in the Information industry. Finally, we examine ways Minnesota may implement new tax policy to mitigate further erosion of the sales tax base.

CHAPTER 1. INTRODUCTION
1
CONTENTS
List of Tables
List of Figures
1 Introduction…………………………………………………………………………...1
2 Minnesota Sales and Use Tax Gap Attributed to Remote Sales……………..…….12
2.1 Background…………………………………………………………….…….13
2.2 Preliminary Estimate of the Remote Sales and Use Tax Gap……………….14
3 The Sales and Use Tax Gap Estimated Using Minnesota Audit Experience….….19
3.1 Literature Review……………………………………………………………19
3.2 Theoretical Framework………………………………………...…………….21
3.3 Econometric Approach…………………………………………….………...24
3.3.1 The Probit Model…………………………………………………………..25
3.3.2 The Tobit Model……………………………………………………….…..27
3.3.3 Selection Correction Methods……………………………………………...30
3.4 Data………………………………………………………………………......33
3.5 Estimation Results……………………………………………....…………...40
3.6 Tax Gap Estimation………………………………………………………….56
4 Conclusions…………………………………………………………………...……….60
4.1 Limitations and Updating the Model………………………………………...62
4.2 Potential Practical Applications……………...………………………………63
Appendix………...……………………………………………………………………....65
References………...……………………………………………………………………..74

CHAPTER 1. INTRODUCTION
2
List of Tables
Table One: First-State Audit Selection Equation………………………….....……….…44
Table Two: Predictive Power……………………………………………………….…...45
Table Three A: Probit Estimates: Probability of Noncompliance for Audited Firms……………………………………………………………………………………..47
Table Three B: Probit Estimates: Probability of Noncompliance for Audited
Firms Controlling for Audit Selection Using the Heckman Sample Selection
Correction………………………………………………………………………………..49
Table Four A: Tobit Estimates: Probability of Noncompliance of Audited
Firms Controlling for Audit Selection using the Heckman Sample Selection
Correction.…………………………………………………………………………….…53
Table Four B: Tobit Estimates: Probability of Noncompliance of Audited
Firms Controlling for Audit Selection using Propensity Score
Weighting …….…………………………………………………………………….…...54
Table Four C: OLS: Audit Assessment Regression……………………………………...55
Appendix Table One: Minnesota Apportionment Ratios………………………………..65
Appendix Table Two: Remote Sales Tax Gap (Retail Only)…..………………………..68
Appendix Table Three: Description of Variables………………………………………..68
Appendix Table Four: Descriptive Statistics for Audited and Non-Audited Firms……………………………………………………………………………………..72
Appendix Table Five: Compliance Rate by Industry 2011…………………………………………………….………………………………..72

CHAPTER 1. INTRODUCTION
3
List of Figures
Figure 2.1: Retail Goods and Services in the United States....………………..…...…….12
Figure 2.2: Remote Sales Tax Gap (Before Accounting for B-2-B
Sales and De Minimis Exemption….……………………………………………..……...18
Figure 2.3: Remote Sales Tax Gap Before and After Adjusting for
the De Minimis Exemption…………………………………………………………...….18
Figure 3.1 Compliance Rate by NAICS Code……………………………….………….39
Figure 3.2 Compliance Rate by Firm Size……………………………………………….39
Figure 3.3 Sales and Use Tax Gap Estimation………………………………………..…59

CHAPTER 1. INTRODUCTION
4
Chapter 1
Introduction
The retail sales tax represents an important revenue stream for the state of
Minnesota, accounting for roughly one-third of the annual tax base in the state. The sales
tax has been studied extensively, including the incidence, administration and its
vulnerability to tax base erosion with the growth of internet commerce. However, firm
compliance with the state retail sales tax has not been studied in great detail, with the
exception of two notable studies, Murray (1995) and Alm, Blackwell and McKee (2004).
We extend this literature by examining firms’ sales and use tax compliance using a
unique data set for Minnesota. This data set allows us to examine first, the likelihood that
a firm will be selected for audit, and second, the firm characteristics correlated with
noncompliance. This paper will address evasion of two different, but related, taxes: sales
tax, under which sellers must remit tax on sales receipts, and use tax, under which
purchasers must remit tax on purchases.
Minnesota statute defines the sales tax base as the sale at retail of tangible
personal properties and some taxable services. Sale at retail requires that the purchaser is
the end user of the product. Minnesota’s use tax was created to capture lost tax revenue
on purchases not subject to sales tax, such as purchases made in other states, by mail or
online. Compliance with use tax has traditionally been quite poor as it puts the
requirement to record, declare, calculate and remit use tax on the consumer. It is also

CHAPTER 1. INTRODUCTION
5
difficult to enforce compliance or to detect noncompliance because of the nature of the
use tax. It is very easy for taxpayers to conceal purchases subject to use tax from taxing
authorities, making it difficult to detect noncompliance. The difficulty of enforcement of
use tax for e-commerce in particular has led to the false, yet widely accepted notion, that
online purchases are essentially tax free (Nehill, 2004). Many taxpayers are simply
unaware of the obligation to remit use tax. The Minnesota use tax rate is the same as the
sales tax rate which has been 6.875% since July 1, 2009; however municipalities may
impose an additional local sales tax in addition to the state rate.1
The sales and use tax gap is the difference between estimated revenue from
expected “full-compliance” tax collection and the actual revenue collected. The gap is
generated by current taxpayers who underreport and those businesses and households that
should file and remit tax, but do not. In recent history, the gap has grown with the
increased use of internet commerce.
Internet commerce, or e-commerce, has represented a growing portion of total
goods and services sold in the United States over the past decade. Goldman Sachs has
estimated that over the next 10 years e-commerce retail (business-to-consumer) will
continue to grow rapidly, five times faster than traditional retail at 15 percent per year
(Ballard and Lee, 2008; Goolsbee ,2000). This poses a problem for state taxing authorities,
as only businesses with a brick-and-mortar presence in the state are required to collect
and remit sales tax. This creates a price advantage for e-retailers over in-state vendors,
1 This paper does not examine the portion of the gap attributed to local sales tax.

CHAPTER 1. INTRODUCTION
6
which introduces a distortion into the market and results in an inefficient allocation of
resources. This price differential also raises questions of marketplace equity, as the
profitability and market share of Minnesota based businesses could be lower as a result.
States’ inability to enforce use tax compliance, or to force remote sellers from collecting
tax, has led to erosion of the traditional sales tax base because remote sales and services
represent a growing portion of economic activity. Businesses utilize the ease of the
internet to purchase office supplies, inputs, services and other transactions. The US
Census Bureau estimates that business-to-business transactions represent approximately
200 billion dollars in national sales. Business-to-business transactions made possible
through internet sales increased by more than 200 percent from 1998 to 2008, while total
business receipts grew only 50 percent over the same period (Strauss, 2012). Sales from
businesses to consumers follow a similar pattern. Business-to-business e-commerce has
grown from 11.4 percent of total activity in 1999 to 22.1 percent of total activity in 2008
while internet sales from businesses-to-consumers grew from less than 1 percent of total
activity to 22.1 percent over the same period (Strauss, 2012).
The lost revenue attributed to the difficulty to enforce use tax, or to force remote
sellers to collect and remit sales tax, has become a very important issue at the state level.
Many states have introduced alternative reporting regimes to increase use tax compliance
and capture lost revenue; however, the success of these programs has been very limited.
Some states have allowed individuals to report use tax liability on individual income tax
returns, eliminating the need for purchasers to file a separate use tax return. Ten states
provide for reporting both state and local tax on income tax returns; however, compliance

CHAPTER 1. INTRODUCTION
7
remains modest even in states that have made this allowance. The fraction of income tax
returns reporting use tax in 2009 was 9.8 percent in Maine, 7.9 percent in Vermont, and 5
percent in New York. Some states had much more modest compliance. In Rhode Island,
California and New Jersey, fewer than 0.3 percent of individual income tax returns
reported use tax liability (Manzi, 2012).2
In 2012, Minnesota Governor Mark Dayton and Ohio Governor John Kasich
proposed tax reforms that would tax business-to-business services, such as advertising,
accounting and legal services. The principles of tax reform generally include broadening
the base and lowering rates while maintaining simplicity and equity of the tax system.
Unfortunately it is very difficult to broaden the base of the sales tax in such a way that
does to include business-to-business transactions and services that will not distort
consumption behavior. For example, firms with in-house legal services and advertising
services would be able to avoid a tax on professional services, while smaller firms would
be subject to the tax for all external professional services, giving an advantage to
vertically integrated businesses.
Similarly, the erosion of the traditional sales tax base due to growth in e-
commerce has triggered states to consider various alternatives to the retail sales tax
entirely. One such alternative approach to the sales tax is the value added tax (VAT), a
tax on the value added to a product at each stage of its manufacture or distribution. It is
2 Manzi also reports that nine states provide tables with estimated use tax liabilities based on income and allow taxpayers to pay those amounts in lieu of their actual tax liability, except that use tax must still be paid on large purchases. She observes that, on average, more people report use tax liability in those states, partly offset by a slight reduction in average use tax paid by each reporting person.
CHAPTER 1. INTRODUCTION
8
similar to the sales tax in that the tax is ultimately passed on to the end consumer,
however a value added tax is collected and remitted each time a business in the supply
chain adds value to a product. The VAT has gained popularity over the more traditional
sales tax because it eliminates the necessity of the seller to determine whether or not the
buyer is an end consumer. Proponents of the VAT argue that it does not allow for the
evasion of sales tax through buying products through a business or purchasing products
as a false business, both of which are possible under sales tax reporting regimes. The
VAT is the most common form of tax on goods and services in the world; however, in the
United States only Michigan has used a form of the VAT known as the Single Business
Tax (SBT). Michigan repealed the SBT in 2006 and now uses the Michigan Business
Tax.
Another alternative to the sales tax is the Gross Receipts Tax (GRT); the structure
of the GRT is simple: a uniform rate on nearly all in-state transactions, including
services, goods and business-to-business transactions. Like the VAT, the primary
argument in favor of a GRT is that it can lower the costs of administration for the
taxation authorities and the costs of compliance for firms. A GRT also broadens the base,
allowing for rate reduction. Under a GRT, the tax rate can be lower than under a
traditional retail sales tax, as there are fewer opportunities for evasion and allows for a
broader base. However, seemingly simple at the surface, a GRT introduces many
complexities into the marketplace that make it less popular than a sales tax or a VAT.
Under a GRT, every item that passes between companies through the production
phase is taxed; as a result, goods produced with multiple phases of production, from raw

CHAPTER 1. INTRODUCTION
9
material to manufacturing, are taxed repeatedly through subsequent stages. This structure
results in punitively higher effective tax rates on complex products, produced in multiple
phases by multiple companies, than products with fewer production stages or that are
produced entirely in-house. This provides a powerful incentive for companies to absorb
suppliers and vertically integrate. A GRT also inherently favors goods imported from
states without a GRT, putting in-stage companies at a tax disadvantage to out-of-state
importers (Chamberlain and Fleenor, 2006).
In this paper we will examine the remote sales tax gap at length. Remote sales
include any sale involving a purchaser that has no physical contact with the seller’s
business location, an employee, or a representative of the seller. Remote sales include
some sales for which the seller is required to collect and remit sales tax. If the seller is in
the same state, the seller will have nexus. If the seller is from out of state but has nexus
with the buyer’s state, the seller is required to collect and remit sales tax. Nexus is created
when a non-resident seller creates a substantial, frequent and continuous physical
presence in a state. Physical presence may be exhibited in a number of ways, including
but not limited to: the presence of employees or agents conducting business in a state,
delivering products into a state using vehicles associated with you or your business,
having an office, store of warehouse located in a state, participating in trade shows within
a state, conducting bank business such as advertisement or purchasing insurance or
owning, renting or leasing property in the state. Remote sales include business-to-
business and business-to-consumer sales.

CHAPTER 1. INTRODUCTION
10
The remote sales tax gap is the sum of all sales and use taxes owed on remote
sales less any tax paid on those sales. The remote sales tax gap then, by definition, is the
sum of unreported use tax owed by businesses, and unreported use tax owed by
consumers, for remote sales. The remote sales tax gap is composed of two parts: i.) the
filer use tax gap, estimated based on Minnesota audit experience, to the extent the unpaid
use tax is from remote sales and ii.) the non-filer tax gap, or estimated use tax due on
remote retail sales, both e-commerce and mail-order, as well as sales of selective
services provided from remote locations. In this paper we will only estimate the filer use
tax gap, as the non-filer tax gap is beyond the scope of this project.
The first segment of this thesis will estimate the gap primarily attributed to
business-to-consumer sales, estimated using data on remote sales collected by the U.S.
Census Bureau. Business-to-consumer sales are primarily sales to individuals, while
business-to-business sales are primarily sales to firms. The second segment of the paper
will examine unremitted sales and use tax, primarily attributed to business-to-business
sales, using data from audits conducted by the Minnesota Department of Revenue. It is
important to note that while e-commerce does play a significant role in the
underreporting of use tax, the sales tax gap is largely comprised of noncompliance
unrelated to e-commerce. While capturing lost tax revenue to e-commerce will
significantly decrease the size of the use tax gap, a sales tax gap will persist. Finally, we
will examine ways Minnesota may implement new tax policy to mitigate further erosion
of the sales tax base.

CHAPTER 2. MINNESOTA SALES AND USE TAX GAP ATTRIBUTED TO REMOTE SALES
11
Chapter 2 Minnesota Sales and Use Tax Gap Attributed to Remote Sales
Failure to collect sales and use tax from online retailers presents a problem that is
fourfold. First, it inefficiently distorts consumer behavior by encouraging them to favor
online retailers over brick-and-mortar retailers. Second, it inefficiently distorts vendor
behavior by influencing where they should locate physical operations, like supply chain
infrastructure, by the desire to avoid having a nexus in sales tax states. Third, the sales
tax base has been significantly eroded; if an intervention is not taken to improve sales tax
compliance for online sales, lost sales tax revenues are unlikely to be recovered, and
could potentially further erode the traditional sales tax base. Internet retailing is growing
at the expense of traditional retailing, diminishing revenue states have historically relied
upon. Finally, failure to tax online sales may be regressive because individuals with
limited income may not have the means to shop online; therefore, wealthier individuals
can pay lower prices for the same goods online as those purchased by lower income
individuals through traditional retailers. Figure 2.1 illustrates that while overall sales of
retail goods and services have grown at a steady rate around 3%, e-commerce retail sales
have grown at a much more rapid rate.

CHAPTER 2. MINNESOTA SALES AND USE TAX GAP ATTRIBUTED TO REMOTE SALES
12
Figure 2.1 Data Calculated using figures from the U.S. Census Bureau
In 2009, the US Census Bureau altered the definitions to include additional services. 2.1 Background
The collection of tax on remote sales arises because states are unable to require
remote vendors to remit the tax given the nexus restrictions as a result of the Supreme
Court ruling in Quill Corp. v. North Dakota ex rel Heitkamp (504 U.S. 298, 317, 1992).
Online companies have been the beneficiaries of this ruling as it established the
requirement for “substantial nexus” as set forth in National Bellas Hess, Inc. v. Dep’t of
Revenue of Ill (386 U.S. 753, 1967), which stated that a company must have a physical
presence within a taxing jurisdiction before a state can require the collection of sales and
use taxes. As a result, online companies have an advantage over their brick-and-mortar
counterparts. Strauss (2012) conjectures that both profitability and market share are
$0
$20,000
$40,000
$60,000
$80,000
$100,000
$120,000
$140,000
$160,000
$0
$1,000,000
$2,000,000
$3,000,000
$4,000,000
$5,000,000
$6,000,000
$7,000,000
$8,000,000
2000
2001
2002
2003
2004
2005
2006
2007
2008
Figure 2.1 Retail Goods and Services in the United States (in Millions of Dollars)
Retail Total (left scale)
Total Services (rightscale)
Retail E-Commerce (leftscale)
Services E-Commerce(right scale)

CHAPTER 2. MINNESOTA SALES AND USE TAX GAP ATTRIBUTED TO REMOTE SALES
13
inherently lower for Minnesota businesses due to this price differential available to out-
of-state vendors without a physical presence in Minnesota.
2.2 Preliminary Estimate of Remote Sales and Use Tax Gap
To estimate the size of the total remote sales tax gap for business-to-consumer
sales, we use data from the U.S Census Bureau. Despite the growing significance of
internet sales, a sufficient data source to track the size of e-commerce by state does not
exist. Each year the U.S. Census Bureau estimates the volume of e-commerce for the
retail sector (NAICS 44-45), the wholesale sector (NAICS 42), the manufacturing sector
(NAICS 31-33) and selected services (NAICS 48-81).3 The Census Bureau’s e-stats are
the most representative national level estimate of e-commerce data available. We exclude
the manufacturing sector estimates from our calculations, because the manufacturing e-
commerce activity reported by the Census Bureau reflects the value of shipments, rather
than the value of sales, as in the cases of the retail and wholesale sectors. Our estimates
do include online sales by the manufacturing sector because the Census estimates for the
wholesale sector include the online sales of manufacturers’ sales branches and offices.
The most recent annual e-commerce report, for calendar year 2010, estimates the
volume of U.S. online retail sales for 2009 and 2010 at $145.26 billion $168.96 billion,
respectively. The use tax due on remote retail sales and sales of selected services is
estimated using the U.S. Census data for e-commerce and catalog sales. The Census
Bureau assumes that retail and service e-commerce is entirely business-to-consumer.
However; business-to-business sales represent a significant portion of e-commerce. To
capture unpaid sales and use tax for business-to-business sales, estimates are calculated 3 2010 E-Commerce Multi Sector report. U.S. Census Bureau, May 10, 2012, available at http://www.census.gov/econ/estats

CHAPTER 2. MINNESOTA SALES AND USE TAX GAP ATTRIBUTED TO REMOTE SALES
14
based on Minnesota audit experience from May 2008 through August 2012 and will be
estimated in the third chapter of this paper.
Federal data from the US Census Bureau database provides annual estimates of
(1) remote retail sales by type of product and (2) electronic sales of services by service
line. The percentage of e-commerce represented by Minnesota is assumed to be
proportional to Minnesota’s share of national sales by NAICS code. For example, we
assume that if Minnesotans buy 1.8% of all women’s clothing items sold in the U.S. from
brick-and-mortar stores, then they also buy 1.8% of all women’s clothing sold through
online retailers. The value of national e-commerce shipments (by 13 retail sectors and 19
service sectors) was then scaled to Minnesota and the state general sales tax rate was
applied. The Minnesota apportionment ratios can be found in Table I of the appendix.
Next, we exclude sales of exempt items. Sales of exempt items such as food,
drugs, medical appliances, and clothing are not subject to sales or use tax, and are not
included in our estimate. Some figures are scaled down by the estimated taxable
percentage in the base. For example, books and magazines are subject to sales tax, but the
exemption is rather narrow. Only textbooks and instructional materials required for a
course of study at a public or private school, college, university or trade school are
exempt. Additionally, subscriptions to magazines and journals are exempt, while sales of
single copies are taxable.
We calculate the taxes due by applying the Minnesota sales tax rate; the rate of
6.5% was applied for years 2000-2008. On July 1, 2009 the sales tax rate changed to
6.875% so an average of the two rates was used for 2009 and the new rate was used for

CHAPTER 2. MINNESOTA SALES AND USE TAX GAP ATTRIBUTED TO REMOTE SALES
15
2010.4 This is the state general sales tax rate. Our estimates do not account for local sales
tax rates that may apply.
We then find the difference between the taxes that are due and the taxes that were
actually paid. We do this by adjusting the gap for actual sales tax collections from
NAICS ‘4541’ (Electronic Shopping and Mail-Order Houses) reported in Minnesota.
Finally, we scale down the size of the gap to account for the de minimis use tax
exemption for individuals. Minnesota Statutes, Section 297A.67, Subd. 21, provides an
exemption for purchases that would otherwise be subject to use tax if they are made by an
individual for personal use, and the total purchases do not exceed $770. If total purchases
exceed $770, the full purchase amount is subject to tax. The $770 is an annual total, not
a per-item or per-order amount. 5 The de minimis exemption adjustment is an estimate
calculated by the Minnesota Department of Revenue in the Tax Expenditure Budget
Report.6 The figures used for the de minimis adjustment by year are included in Table 1
of the Appendix.
To calculate the percentage growth in e-commerce each year, we employ a series
of calculations. For years 2000 through 2010, we use the actual growth rate as calculated
by dividing the total e-commerce retail sales from the prior year by the total e-commerce
sales for the current year and subtracting one. For years 2010-2013, we use the projected
growth in sales tax revenue from the sales tax revenue forecast created by Minnesota
4 It should be noted that the higher the sales tax rate, the more incentive exists for consumers to favor online shopping over traditional retail shopping. MN has the seventeenth highest sales tax rate in the nation, although we are one of only five states with a sales tax clothing exemption. 5 There is no de minimis use tax exemption for businesses. 6Minnesota Department of Revenue, 2012. http://www.revenue.state.mn.us/research_stats/research_reports/2012/2012_tax_expenditure_links.pdf

CHAPTER 2. MINNESOTA SALES AND USE TAX GAP ATTRIBUTED TO REMOTE SALES
16
Management and Budget.7 We then multiply that rate by the expected growth rate in e-
commerce, which we set at 5 percent based on the estimates calculated by Ballard and Lee
(2008). For years 2014-2017, we assume an average growth rate of 3 percent for retail sales,
and an expected growth rate of 5 percent for e-commerce.
Figure 2.1 summarizes the annual growth rates for U.S. online retail sales since
2000. The compound annual growth rate from 2000 to 2010 was 24.1 percent, so our
estimates are conservative compared to past years. The sum of these two pieces yields a
preliminary remote use tax gap estimate. Figure 2.2 shows only the portion of the gap
attributed to the retail e-commerce sales tax gap. The business-to-business portion of this
gap based on Minnesota audit experience is not accounted for in this estimate.
Figure 2.2 illustrates that Minnesota could collect an additional $200 million in
tax revenue, should the requisite federal legislation pass; this assumes no small-seller
exemption and full compliance after 2017. This estimate is similar to the oft-cited
estimates of $149.6-253.3 million for years 2007-2012 produced by Bruce, Fox and Luna
(2009). One attractive option for the state of Minnesota would be to simply repeal the de
minimis use tax exemption for individuals. Manzi (2012) estimated that repealing the de
minimis exemption for individuals would increase full-compliance revenues by $10.55
million in calendar year 2011. Minnesota is one of only five states with an individual de
minimis use tax exemption.
7 For the complete report see the Minnesota Management and Budget Forecast 2012. http://www.mmb.state.mn.us/doc/fu/13/complete-feb13.pdf

CHAPTER 2. MINNESOTA SALES AND USE TAX GAP ATTRIBUTED TO REMOTE SALES
17
53.2 61.0 55.1 57.0 54.8 50.6 64.4 63.4 69.7 64.7 62.3 66.3 68.3 70.3 72.4 74.6 76.8 79.1 81.58.7 12.7 14.2 19.9 22.3 24.5
22.4 36.345.5
34.9 38.651.6 62.1 77.0
96.5119.7
140.4164.0
190.9
0
25
50
75
100
125
150
175
200
225
250
275
300Sa
les i
n M
illio
ns o
f Dol
lars
Figure 2.2: Remote Sales Tax Gap (Before Accounting for B-2-B Sales and De Minimus Exemption)
Mail order gap E-Commerce gap
$50$60$70$80$90
$100$110$120$130$140$150$160$170$180$190$200$210$220$230$240$250$260$270
1999
2000
2001
2002
2003
2004
2005
2006
2007
2008
2009
2010
2011
2012
2013
2014
2015
Tax
Gap
in M
illio
ns o
f Dol
lars
Figure 2.3 Remote Sales Tax Gap
Total Gap withoutaccounting for the DeMinimus Exemption
Total Gap accounting for DeMinimus Exemption

CHAPTER 3. THE SALES AND USE TAX GAP ESTIMATED USING MINNESOTA AUDIT EXPERIENCE
18
Chapter Three
The Sales and Use Tax Gap estimated Using Minnesota Audit Experience
3.1 Literature Review
A number of studies have sought to estimate the amount of revenue lost due to the
states’ difficulty collecting use taxes. Most notably, Bruce, Fox and Luna estimated the
nationwide revenue loss would reach $11.4 billion by 2012 (Bruce, Fox and Luna, 2009).
However, this figure may be an overestimate, as many business-to-business sales made
via the internet may be exempt from tax or for purchases on which tax has already been
paid.8
In 2000 the Minnesota Department of Revenue issued an estimate of the state
sales and use tax gap based on data arising from tax audits. The study was later updated,
and the two studies provide gap estimates for years 2000 and 2004. The methodology
used for both reports was the same. First, the population of audited firms was stratified by
firm size and industry. Then the average ratio of noncompliance by industry and firm size
was used to estimate total noncompliance. We seek to improve upon this method by
controlling for additional factors that may be correlated with compliance behavior, such
8 Both businesses and individual consumers are subject to use tax, although all business purchases should be exempt from sales tax, most states exempt only specific types of business purchases; see Noah Aldonas, ‘‘Nebraska: DOR Disputes E-Commerce Sales Tax Loss Estimates,’’ State Tax Notes, Aug. 27, 2012, p. 576, Doc 2012-17681, or 2012 STT 162-14.

CHAPTER 3. THE SALES AND USE TAX GAP ESTIMATED USING MINNESOTA AUDIT EXPERIENCE
19
as whether a firm is located in another state. Additionally, we attempt to control for audit
selection, as audit selection may not be random. It is possible the auditors have
information beyond firm-size and industry when selecting audits. The earlier method
assumes that all firms non-comply at the same rate as those selected for audit in the same
industry and firm size category. Additionally under this method of estimation, it is not
possible to control for variables that affect taxpayers’ reporting decisions, including
changes in tax laws and economic conditions.
The 2002 study yielded interesting results, and provides a foundation for this
study. The 2002 study estimated the filer use tax gap to be $135 million, the filer sales
tax gap to be $153 million and the non-filer gap to be $163 million, for a total gap of
$451 million in 2000. To put this in perspective, the total voluntary compliance for sales
tax in 2000 was $2.5 billion, while voluntary use tax compliance was $205 million. The
2008 update estimated the filer use tax gap to be $171 million, the filer sales tax gap to be
$200 million and the non-filer gap to be $149 million, for a total gap of $520 million in
2004 (American Economics Group 2002; Hoheisel, 2008). In 2004, sales tax revenue
represented nearly $4 billion in annual revenue, while use tax was approximately $271
million.
Murray (1995) investigated the determinants of audit selection and audit
productivity for the Tennessee sales tax using a methodology that controls for audit
selection, economic conditions, changes in tax laws and the compliance rate by firm size

CHAPTER 3. THE SALES AND USE TAX GAP ESTIMATED USING MINNESOTA AUDIT EXPERIENCE
20
and industry before estimating the gap. Murray (1995)uses a three-stage selection
procedure in which he first uses probit analysis to estimate the factors correlated with
audit selection. He then determines the likelihood of firm noncompliance in the second
stage. Finally, in the third stage, he uses linear regressions to estimate the level of
noncompliance, using controls for selectivity bias from the first two stages.
Alm, Blackwell and McKee (2004) employ a methodology very similar to
Murray (1995) to estimate audit selection rules and characteristics correlated with sales
tax noncompliance in New Mexico. In this approach, they use a two-stage estimation
procedure. In the first stage, again, they attempt to estimate factors correlated with audit
selection, also referred to as the audit-selection rules. In the second stage, they estimate
the rate of firm compliance for firms selected for audit in the first stage. To control for
any bias generated by including only the audited firms, they control for audit selection
using the Heckman sample selection procedure (Heckman, 1976, 1979).
3.2 Theoretical Framework
Sales tax compliance-tax enforcement is generally conceptualized as a strategic
game between the revenue authority and the taxpayer (Graetz, Reinganum and Wilde,
1986). Subject to the uncertainty of audit, taxpayers seek to minimize reported liabilities,
while revenue authorities select audits in order to maximize their return on investment9.
Murray (1995) applies this framework empirically to the individual income tax, and Alm, 9 This is only one objective of Revenue authorities; while return on investment is one component of audit selection, revenue authorities also seek to make sure taxpayers are paying their fair share, which might involve correcting firms that are overpaying and educating taxpayers to increase compliance rates .

CHAPTER 3. THE SALES AND USE TAX GAP ESTIMATED USING MINNESOTA AUDIT EXPERIENCE
21
Blackwell and McKee (2004) follow the same approach for sales tax compliance. Our
framework is similar.
In the sales and use tax compliance-enforcement framework there are two players,
the risk averse firm owner/manager who seeks to maximize the expected utility of profits,
and the auditor who seeks to select audits with the highest likely return on the state’s
investment in auditing resources.
Following the example of Murray (1995) and Alm, Blackwell and McKee (2004), we
first consider the behavior of the risk averse firm. We assume the owner/manager has
already chosen the levels of inputs and outputs necessary to maximize the firm’s profits.
The firm must then determine the fraction of total sales tax revenue collected that will not
be remitted to the taxing authority. The firm’s optimization can be determined by solving
for the fraction of sales tax revenue 휋 that the firm voluntarily remits to the taxing
authority.
(1) 휋 ∗ = 휋 (푡, 푓, 푝,푅,퐶,푍)
Where t represents the sales tax rate, f represents the penalty rate, p represents the
probability of audit, R represents the total revenue net-of-tax and C represents total
production costs. Z represents the vector of characteristics that might make a firm more
likely to be audited. For example, firms with multiple locations, an out-of-state address or
firms that chronically late file may be more susceptible to audit.

CHAPTER 3. THE SALES AND USE TAX GAP ESTIMATED USING MINNESOTA AUDIT EXPERIENCE
22
Second, we consider the behavior of the taxing authority. The taxing authority’s audit
selection approach will be a function of the characteristics they believe will yield the
greatest return. The Minnesota Department of Revenue has no formal audit selection
rules. This is perhaps to maintain taxpayer uncertainty regarding audits. Schotchmer and
Slemrod (1989) and Alm, Jackson and McKee (1992) show that taxpayer uncertainty
regarding audit selection policies can lead to greater compliance. The absence of
selection rules may also be intended to maintain an equitable proportion of audits across
industries and firms. Even without formal rules, however, it is possible that auditors do
not randomly select audits, but in fact look for certain firm characteristics or behaviors
that may make them more likely to be noncompliant.
This function leads the auditor to assign each potential audit some index of
퐴푢푑푖푡퐴푠푠푒푠푠푚푒푛푡∗, which reflects the auditor’s anticipated return on the audit based
upon a vector of firm characteristics. The taxing authority’s objective
function,퐴푢푑푖푡퐴푠푠푒푠푠푚푒푛푡∗, is then is a linear function of firm characteristics 푋and
Minnesota Department of Revenue budget resources ∅ . The error term 휀 is assumed to
be normally distributed with a mean of zero, reflecting the fact that the taxing authority
cannot determine audit productivity perfectly prior to audit.
(2) 퐴푢푑푖푡퐴푠푠푒푠푠푚푒푛푡∗ = 훽푋 + 훽∅ + 휀
Because we do not observe the audit selection rules, we must evaluate the
characteristics we do observe: those of audited firms. Audit selection can be viewed as a

CHAPTER 3. THE SALES AND USE TAX GAP ESTIMATED USING MINNESOTA AUDIT EXPERIENCE
23
probability of audit, where 푝∗ represents the probability that a firm will be selected
for audit based upon observable firm characteristics and department resources.
(3) 푝∗ = 푝 (퐴푢푑푖푡퐴푠푠푒푠푠푚푒푛푡∗)
This equation reflects the potential endogeneity of the audit selection process; the
probability of audit is not in fact, perfectly random, but instead depends upon certain
observable factors. To analyze the firm characteristics associated with compliance, we
must first control for the audit selection process. We do this two ways: first, we control
for audit selection using the Heckman (1979) correction for sample selection, the inverse
Mills ratio; second, we use propensity score weighting to control for audit selection.
3.3 Econometric Approach
Our econometric approach consists of a two-stage estimation procedure. In the
first stage, we estimate the likelihood of audit, pooling both audited and non-audited
firms. In the second stage, we estimate non-compliance in two ways. First, we estimate a
probit model to examine factors that predict whether firms are noncompliant or
compliant. Second, we estimate a Tobit model to evaluate the factors predicting the
magnitude of noncompliance. To correct for the endogeneity of audit selection, we
employ two alternative econometric approaches. First, we use the Heckman sample
selection correction. Second, we use propensity score weights to control for audit
selection. Using two alternative approaches to control for audit selection allows us to
compare the results of both second-stage regressions.

CHAPTER 3. THE SALES AND USE TAX GAP ESTIMATED USING MINNESOTA AUDIT EXPERIENCE
24
There are several advantages to this approach. The first stage investigates factors
that might make a firm more likely to be selected for audit; more importantly however,
the first stage estimation is necessary to generate unbiased estimates in the second stage
of the analysis. If the firms selected for audit were in fact selected based on certain firm
characteristics, these firms will differ from the firms not selected for audit and must be
isolated to discern the firm characteristics correlated with rates of noncompliance.
3.3.1 The Probit Model
The equation for the first-stage audit selection, equation (2), allows us to examine
whether certain firm characteristics or auditing resources have an impact on audit
selection. Although we do not yet observe 퐴푢푑푖푡퐴푠푠푒푠푠푚푒푛푡∗ for every firm, we do
observe firms that are audited (푝 = 1)and those who are not audited (푝 = 0),
which generates the indicator variable 퐴푢푑푖푡퐴푠푠푒푠푠푚푒푛푡 for each firm. Using equation
(3), we observe the following for audited firms:
(4) 퐴푢푑푖푡퐴푠푠푒푠푠푚푒푛푡 = 1푖푓퐴푢푑푖푡퐴푠푠푒푠푠푚푒푛푡∗ > 0, 0표푡ℎ푒푟푤푖푠푒
We estimate this equation by probit analysis, which estimates the probability that a firm
is audited as a linear function of firm characteristics 푋and Minnesota Department of
Revenue budget resources ∅ . This equation includes variables indicating industry, firm
size, firms located out-of-state and dummy variables indicating the year to correct for
variations in the budget of the Department of Revenue.

CHAPTER 3. THE SALES AND USE TAX GAP ESTIMATED USING MINNESOTA AUDIT EXPERIENCE
25
Second, we observe compliance of audited firms (푝 = 1). In this
regression the compliance rate is either 0 or 1, with some audits resulting in no change,
indicating full compliance, and some firms with audit assessments, indicating
noncompliance. We indicate no-change audits and refund audits with a 0, indicating full
compliance, and audit assessments with 1, indicating noncompliance. This regression
equation includes the same variables as first regression, but eliminates variables
associated with taxing authority resources such as the year variables and the out of state
indicator. This is based on the assumption that those variables are correlated with
auditing resources, but not necessarily with firm compliance.
The probit model allows us to evaluate the response probability of an event. This
relationship is represented in the following equation:
(5) 푃 푦 = 1⃒푥 = 푃(푦 = 1⃒푥 , 푥 . ., 푥 )
Where we use x to denote the full set of explanatory variables, in this case, x represents
firm characteristics.
Wooldridge (2009) shows that in the probit model, G represents the standard normal
distribution function, which is expressed as the integral:
(6) 퐺(푧) = Ф(푧)∫ Ф(푣)푑푣

CHAPTER 3. THE SALES AND USE TAX GAP ESTIMATED USING MINNESOTA AUDIT EXPERIENCE
26
where Ф(z) is the standard normal density. This choice of G ensures that (5) is strictly
between one and zero for all values of the parameter 푥 (Wooldridge, 2009). The probit
model can be derived from an underlying latent variable. Let 푦∗represent an unobserved,
or latent variable, determined by
(7) 푦∗ = 훽 + 푥훽 + 휀,
(8) 푦 = 1{푦∗ > 0},
where 푦∗takes the value of one if the event in brackets is true, and zero if otherwise. We
assume that the error term ε is independent of x and that ε is symmetrically distributed
about zero.
Because the independent variables are all binary, we must omit one variable from
firm size and one variable from industries to avoid multicollinearity. We omit De
Minimis industries from the industries included in the regression and firms with annual
tax liability less than or equal to zero from our firm size categories. As a result, we
interpret our coefficients as the rate the independent variable (x) relates to the dependent
variable (y) in relation to the omitted variable. We follow the same methodology for the
Tobit model.
3.3.2 The Tobit Model
Finally, we conduct the second-stage regression analysis for all audited firms
(푝 = 1). We estimate this equation using Tobit maximum likelihood estimation. Because

CHAPTER 3. THE SALES AND USE TAX GAP ESTIMATED USING MINNESOTA AUDIT EXPERIENCE
27
we have a significant number of observations with assessments equal to zero, a linear
model would likely lead to negative predictions for some observations (Wooldridge,
2009).
To overcome the nonlinear nature of this model, we rely on maximum likelihood
methods. The theory of maximum likelihood estimation for random samples implies that
the maximum likelihood estimation is consistent, asymptotically normal and
asymptotically efficient (Wooldridge, 2009). This equation again includes variables
indicating various firm characteristics; however the year binary variables and the out of
state binary variable are no longer included in the second-stage regressions. We exclude
these variables following the example of Alm, Blackwell and McKee (2004), based on
the assumption that these variables serve as a representation of Revenue resource
availability that affects the audit rate in the first-stage but not the compliance rate in the
second stage.
In summary, the Tobit model assumes the following relationship:
(9) 푦∗ = 훽 + 푥훽 + 푢, 푢 ⃓푥푁표푟푚푎푙(0,휎 )
(10) 푦 = 푚푎푥(0,푦∗),
where the observed y equals 푦∗ when 푦∗ ≥ 0 but equals 0 when 푦∗ < 0. Therefore, we
can see that the relationship between the expected value, E(y⃓x), of all observations is

CHAPTER 3. THE SALES AND USE TAX GAP ESTIMATED USING MINNESOTA AUDIT EXPERIENCE
28
dependent upon the expected value when above the limit, E(y⃓y > 0,푥), as well as the
probability of being over the limit (McDonald and Moffitt, 1980).
Wooldridge (2009) shows that
(11) E(y⃓x) = Ф ∗ E(y⃓y > 0, 푥)
Where Ф is the cumulative normal distribution, x is a vector of independent
variables (firm characteristics), β is a vector of unknown coefficients and
(12) E(y⃓y > 0,푥)=푥훽 + 휎휆( )
Where λ represents the inverse Mills ratio. Substituting equation (7) into equation (6) we
find the following:
(13) E(y⃓x)=Ф 푥훽 ∗ 휎휑(
Where Ф represents the cumulative distribution function and 휑represents the probability
distribution function, where both Ф and 휑 are evaluated at ( ).
There are two primary limitations associated with the Tobit model. First, the Tobit
model assumes that for each firm the probability of audit is the same. This decreases the
accuracy of the model; however, we do include λ, the inverse Mills ratio from the first-
stage regression to mitigate this problem. Second, the E(y⃓x)=is not a linear function of
푥 and β (Wooldridge, 2009).

CHAPTER 3. THE SALES AND USE TAX GAP ESTIMATED USING MINNESOTA AUDIT EXPERIENCE
29
3.3.3 Second-Stage Sample Selection Corrections
Auditors may know something about the firms selected for audit that we cannot
accurately control for in the regression, so we must control for this non-random selection
bias using statistical methods. We attempt to correct for the non-random audit selection
two ways: first, using Heckman’s selection correction (1979); second, using propensity
score weighting (Angrist and Pischke, 2008).
The Heckman Correction
Heckman (1976, 1979) proposed a solution for non-random sample selection.
Recall that we want to estimate the audit outcome equation of the following model:
(14) 푦 ∗ = 푥′ 훽 + 푢
(15) 푦 ∗ = 푥′ 훽 + 푢
Where the rate of non-compliance, 푦 ∗, is only observed for audited firms, where 푦 is
observed.
(16) 푦 = 푦 ∗푖푓푦 ∗ > 0
(17) 푦 = 0푖푓푦 ≤ 0.
Model (13) is estimated using a probit selection equation that describes the probability of
audit. Heckman (1979) proposed a two-step method to estimate likelihood. For the
CHAPTER 3. THE SALES AND USE TAX GAP ESTIMATED USING MINNESOTA AUDIT EXPERIENCE
30
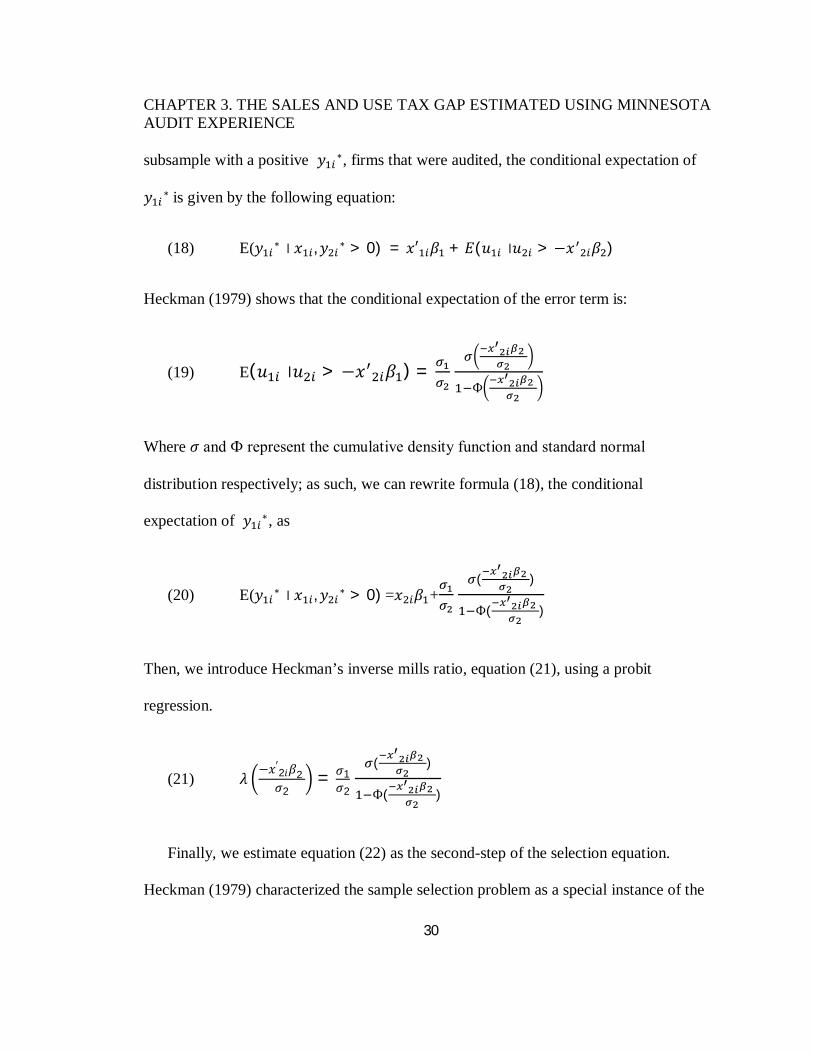
subsample with a positive 푦 ∗, firms that were audited, the conditional expectation of
푦 ∗is given by the following equation:
(18) E(푦 ∗⃓푥 , 푦 ∗ > 0) = 푥′ 훽 + 퐸(푢 ⃓푢 > −푥 훽 )
Heckman (1979) shows that the conditional expectation of the error term is:
(19) E(푢 ⃓푢 > −푥 훽 ) =
Ф
Where 휎 and Ф represent the cumulative density function and standard normal
distribution respectively; as such, we can rewrite formula (18), the conditional
expectation of 푦 ∗, as
(20) E(푦 ∗⃓푥 , 푦 ∗ > 0)=푥 훽 + ( )
Ф( )
Then, we introduce Heckman’s inverse mills ratio, equation (21), using a probit
regression.
(21) 휆 −푥′2푖훽2휎2
= 휎1휎2
( )
Ф( )
Finally, we estimate equation (22) as the second-step of the selection equation.
Heckman (1979) characterized the sample selection problem as a special instance of the

CHAPTER 3. THE SALES AND USE TAX GAP ESTIMATED USING MINNESOTA AUDIT EXPERIENCE
31
omitted variable problem, where λ represents the omitted variable if ordinary least
squares (OLS) regression were used when 푦 ∗ is greater than zero. As long as 푢 has a
normal distribution, and the error term is independent of λ, the two-step estimator is
consistent (Puhani 2002).
(22) 푦 = 푥′ 훽 + 휎1휎2
( )
Ф( )+ 휀
Heckman’s inverse Mills ratio has been criticized when used with small sample sets;
however, this method is consistent under large samples (Wooldridge 2009).
Propensity Score Weighting
Propensity score weighting provides an alternative approach to control for the
audit selection bias. The propensity score is the probability of treatment assignment
dependent upon conditional observed baseline characteristics. The propensity score exists
in both randomized experiments and observational studies. In randomized experiments
the propensity score is known and defined by the study design. In observational studies,
the propensity score is not known but can be estimated using the study data. The
propensity score is derived from the first-stage probit audit selection equation and
represents the predicted probability of treatment (audit selection) based upon the fitted
regression model (Austin 2012).

CHAPTER 3. THE SALES AND USE TAX GAP ESTIMATED USING MINNESOTA AUDIT EXPERIENCE
32
There are several methods for calculating propensity scores. For this project we
use the inverse probability of treatment weighting (IPTW) as the propensity score. This
approach uses the propensity score as a weight to create a sample in which the
distribution of baseline covariates is independent of treatment assignments. IPTW was
first proposed by Rosenbaum (1987). The propensity score weights are calculated by
taking the inverse of the probability that the observation was treated (audited) from the
first-stage probit equation. This method is sensitive to extreme values of the weights and
may be inaccurate for subjects with a very low or high probability of treatment; however,
only 8.2% of our observations had a predicted probability of audit below .05 or greater
than .95. These observations were set equal to .05 or .95 to mitigate the sensitivity of the
IPTW approach.
3.4 Data
We begin with a data set containing information from the returns voluntarily
remitted to the Department of Revenue at least once between the years 2006 and 2011.
This data consists of 730,572 monthly observations of Minnesota businesses who filed
Minnesota returns. This data set includes the sales and use tax voluntarily remitted to the
Department of Revenue for each month, address information and the type of business as
defined by the North American Industrial Classification System (NAICS) codes. The
original data set contains one observation for each filing made by a firm to the
Department of Revenue. Sales tax can be filed monthly, quarterly, semi-annually or

CHAPTER 3. THE SALES AND USE TAX GAP ESTIMATED USING MINNESOTA AUDIT EXPERIENCE
33
annually. Additionally, firms may submit amended returns. So some taxpayers may have
only a single annual observation, while others could have many observations each year,
depending upon their filing period and submissions of amended returns. To create a
uniform standard of the data, we divide the sales tax liability (including any additional
liability submitted on amended returns) by the number of months in the filing period.
This creates one observation for each month included in any period for which the firm
remitted sales tax or use tax.
The secondary data set, the audit data set, contains information regarding 20,082
audits. Of those, 83.4 % were registered taxpayers with the Department of Revenue and
the remaining audits were of non-filing firms, at any time for the period 2006-2011. Of
the firms audited, 13.7% were fully compliant, meaning the audit resulted in no change or
a net refund. We examined audits completed in the years 2008, 2009, 2010 and 2011.
Audits completed in 2008 often contain records from 2006 and 2007 as well, which
necessitates using return data for years 2006-2011. At the time the data was pulled, many
2011 audits were not yet complete and as such, only a limited number of audits are
available for 2011.
Our data set originally includes audit assessments for non-filing firms, or firms
that were not voluntarily remitting tax to the Department of Revenue at the time of audit.
We omit these observations from our data set, because we do not have enough
information about the firm characteristics of non-filing firms to accurately draw

CHAPTER 3. THE SALES AND USE TAX GAP ESTIMATED USING MINNESOTA AUDIT EXPERIENCE
34
conclusions regarding the compliance behavior of these firms. The Department of
Revenue collects approximately 6 to 10 million dollars in revenue from non-filing firms
each year. 10
The data available from the audit data set includes information regarding the sales
tax assessment, use tax assessment, net penalties, addresses and NAICS codes. The audit
data set originally contained one observation for each audit. Audit periods typically cover
three years; however, some audits may only cover one month. Again, we created a single
observation for each firm for each month of the audit period by dividing the audit
assessment by the number of months in the audit period. Unfortunately, this limits our
ability to observe whether a firm’s compliance behavior varies throughout the year.
Alm, Blackwell and McKee (2004) include control variables for the average
deductions reported, the age of the firm and the number of years in which the firm failed
to file a return. Unfortunately, this information is not available in our data set. Murray
(1995) also includes variables for the age of the firm and the average number of late
returns filed. He also accounts for the number of affiliated outlets with the firm, the
average hours spent on the audit and the number of auditors available to conduct audits.
Murray controls for the average gross sales reported over a period, as well as the
magnitude of variations in reported gross sales. Ideally, we would include the age of the
firm in future studies, as newer firms may be less compliant than their older counterparts.
10 This estimate is subject to change depending on the resources of the Department of Revenue.

CHAPTER 3. THE SALES AND USE TAX GAP ESTIMATED USING MINNESOTA AUDIT EXPERIENCE
35
Another ideal variable would be a discrete variable indicating the number of affiliated
outlets, as the number of audit leads may increase if leads are generated through the
detection of noncompliance in affiliated outlets.
We do include a discrete variable to indicate whether the firm is located out-of-
state, as it is likely auditors have different audit selection rules for out-of-state firms. We
also include several variables for industry, indicated by NAICS code, and firm size, based
on annual tax liability. Both Murray (1995) and Alm, Blackwell and McKee (2004)
include variables indicating firm size; however, only Alm, Blackwell and McKee include
information regarding the industry type. Our study includes a more detailed list of
industries, as well as income tiers indicating firm size indicated by dummy variables
rather than a continuous variable to indicate firm size based on average gross receipts.
The combined dataset matched each monthly observation from the audit data set
to the return dataset, yielding our pooled dataset. From the pooled dataset, we created
variables to represent the firm-size and industry of each firm in the dataset. Looking at
the raw data, we can observe audit rates without controlling for any of the factors that
may be correlated with audit selection. We observe that as firm sizes increase, the
likelihood of audit increases. Firms with liability greater than $500,000 are nearly four
times more likely to be audited than firms with liability of $1-1,000. Firms in the Mining
& Utilities, Information, Transportation & Warehousing and Construction face the

CHAPTER 3. THE SALES AND USE TAX GAP ESTIMATED USING MINNESOTA AUDIT EXPERIENCE
36
highest likelihood of audit. Firms in Retail Trade and Other Services face the lowest
audit rates.11
Variable definitions and descriptive statistics for both data sets, audited and
unaudited, are reported in Table 4 of the appendix. The compliance rate measure for
firms was calculated by taking the ratio of voluntary compliance of the taxpayer to the
“true” tax liability, or post-audit findings.12 Firms were considered “audited” if they
were audited at any time during calendar years 2006-2011.13 Noncompliance includes
both firms that purposefully avoided paying their full tax liability as well as firms that
underpaid their liability due to malfeasance, misfeasance or nonfeasance14. The audit data
does not include any indication of whether the taxpayer was purposely avoiding payment
of the tax, or whether the noncompliance was accidental, as is often the case with use tax.
The monthly voluntary compliance field is unique to each taxpayer for each
month the taxpayer filed a return. This amount is the actual tax paid to the Department of
Revenue. The monthly audit assessment field is also unique to each taxpayer for each
month of the audited period and reflects the amount of tax that was not remitted to the
Department of Revenue, but was deemed as a liability by the auditor. The compliance
rate was determined by taking the sum of audit assessments divided by the sum of total
11 We are prevented from releasing exact audit frequencies by a non-disclosure agreement with Minnesota Department of Revenue. 12 This compliance rate assumes the auditor is able to determine 100% of the firm’s noncompliant behavior. 13 The Department of Revenue asked us not to disclose actual audit rate information. 14 Malfeasance, misfeasance and nonfeasance are legal terms used to describe the type of behavior associated with noncompliance with the law. Malfeasance describes purposeful, even aggressive, behavior; misfeasance describes accidental noncompliance and nonfeasance describes total noncompliance.

CHAPTER 3. THE SALES AND USE TAX GAP ESTIMATED USING MINNESOTA AUDIT EXPERIENCE
37
compliance, voluntarily remitted revenue and assessments. We calculate monthly
voluntary compliance, monthly audit assessment and compliance rate for both sales tax
and use tax.
Figure 3.1 shows the average of Compliance Rate by NAICS code, estimated
from our audited firm data set. The average compliance rate across all firms was 71%,
with sales tax compliance averaging 89% compliance and use tax compliance at only
52%. Sales tax compliance ranges from highs of 98% compliance in the Mining &
Utilities industries and 96% in Finance & Insurance, to a low of 79% in the
Administration & Waste Industries. Use tax compliance ranges from a high of 98% in De
Minimis Industries to a low of 24% in Other Services. The industries included in De
Minimis include: Forestry, Hunting, Fishing, Agriculture Support, Unclassified,
Education and Healthcare.
Figure 3.2 shows the average of Compliance Rate by firm size. Both Figure 3.1
and 3.2 clearly illustrate the lower rates of use tax compliance than sales tax compliance
across industries and firms. Sales tax compliance rates increase as firm size increases;
the largest firms, firms with annual tax liability greater than $500,000 have the highest
use tax compliance rate of 80%. Use tax compliance appears quite poor in this chart, but
it is important to keep in mind that all outliers are included in this figure, and that only
audited firms are included in these calculations. Use tax by firm size ranges from a low of

CHAPTER 3. THE SALES AND USE TAX GAP ESTIMATED USING MINNESOTA AUDIT EXPERIENCE
38
13% among audited firms with tax liability of $1-$1,000 and a high of 30% among firms
with tax liability greater than $500,000.
0%10%20%30%40%50%60%70%80%90%
100%
De
Min
imus
Min
ing
& U
tiliti
esC
onst
ruct
ion
Man
ufac
turin
gW
hole
sale
Tra
deR
etai
l Tra
deTr
ansp
. &…
Info
rmat
ion
Fina
nce
&…
Rea
l Est
ate
&…
Prof
. &…
Adm
. & W
aste
…A
rts,…
Acc
omod
atio
ns…
Oth
er S
ervi
ces
Figure 3.1 Total Rate of Compliance by Industry for Audited Firms
Average rate of Sales TaxComplianceAverage rate of Use TaxCompliance
0%
20%
40%
60%
80%
100%
120%
AnnualTax
Liability1 to
1,000
AnnualTax
Liability1,001 to
to10,000
AnnualTax
Liability10,001
to30,000
AnnualTax
Liability30,001
to75,000
AnnualTax
Liability75,001
to200,000
AnnualTax
Liability200,001
to500,000
AnnualTax
Liability>
500,001
Figure 3.2 Total Rate of Compliance by Firm Size for Audited Firms
Total Rate of Sales TaxCompliance
Total Rate of Use TaxCompliance

CHAPTER 3. THE SALES AND USE TAX GAP ESTIMATED USING MINNESOTA AUDIT EXPERIENCE
39
3.5 Estimation Results
The first-stage audit selection equation estimates the factors that may affect the
likelihood of audit selection and combines the audited and non-audited firm samples for
years 2006-2011. This data set includes 748,400 observations, 39,878 of which were
audited at least once during the time period. Firms that were audited multiple times
during this period include one observation for each audit. The dependent variable is the
observed variable audit, equal to 1 if the firm is selected for audit and 0 otherwise.
Independent binary variables indicating the firm size, industry, year and whether the firm
was located outside the state. A detailed list of the binary variables used to indicate firm
size and industry can be found in Table 2 of the Appendix.
The estimation results for the first-stage model of sales tax audit selection are
presented in Table 4. Several explanatory variables have a statistically significant impact
on the likelihood of audit selection by the Department of Revenue, supporting the theory
that audit selection is not entirely random.
Table 4 provides the marginal effects from the first-stage equation for both the
probit and logit regressions. Only the probit results will be discussed in detail; however,
the logit results are similar in sign and magnitude to those of the probit regression.
Industries are compared to the baseline of firms categorized as De Minimis; similarly, the
baseline comparison for firm-size are firms that had liability less than or equal to zero.
This complicates our interpretation of marginal effects a bit, because rather than

CHAPTER 3. THE SALES AND USE TAX GAP ESTIMATED USING MINNESOTA AUDIT EXPERIENCE
40
comparing the marginal effects to the baseline comparison, we will compare the marginal
effects to the industry and firm size that are least likely to be audited. Similarly, the
results of these regressions are the results after controlling for firm characteristics
included in the model such as firm size and industry, as such, our probabilities will not
perfectly correlate to the frequencies when looking at the raw data and as described in
chapter 3.4.
The industries with the lowest probability of audit are firms in the following
industries: Other Services, Accommodations & Food Services, and Retail Trade. The
firms most likely to be selected for audit are firms in the Finance & Insurance industry,
firms in the Mining & Utilities industry and firms in the Construction industry. Firms in
the Finance & Insurance industry are most likely to be audited, with a predicted audit
rate 1.63 percentage points higher than De Minimis firms, and 4.6 percentage points
higher than the least likely to be audited industry, Other Services. Firms categorized as
Mining & Utilities are second most likely to be selected for audit, as these firms have a
1.14 percentage point higher rate of being audited than De Minimis firms and a 4.11
percentage point higher rate of being audited than the least likely industry.
These results also indicate that as tax liability increases, firms are more likely to
be selected for audit. Firms with annual tax liability of $1-$1,000 have a predicted
probability of being audited that is 24.27 percentage points lower than firms with tax
liability exceeding $500,000. Firms with zero liability are the least likely to be audited.
CHAPTER 3. THE SALES AND USE TAX GAP ESTIMATED USING MINNESOTA AUDIT EXPERIENCE
41
After controlling for industry and firm size, firms located out-of-state are less
likely to be audited than firms in state, these firms face a predicted audit rate 2.89
percentage points lower than their in-state counterparts, after controlling for firm size and
industry. Our results also show that the lowest likelihood of audit selection for the study
period occurred during 2006 and 2007, with audit rates being 0.63 percentage points
higher in 2008-2009 and 1.63 percentage points higher in 2008 and 2009. This may be
the result of increased resources allocated to the Department of Revenue; however,
neither of the year variables are statistically significant.
The selection power for both models is detailed in Table 5. We test the predictive
power of the model using a method proposed by Park and Capps (1997). Typically, if the
estimated probability is greater than .5 and the first alternative is selected (in this case,
the firm is audited), we assume the decision is correctly classified. Alternatively, if the
estimated probability is less than .5 and the second alternative is selected (the firm is not
audited), the decision is correctly classified. We seek maximum proportion of
classifications in our model. But in many cases, the appropriate cutoff may not be .5.
Rather, we select a cutoff proportional to the number of audited firms in our data set.
Using this approach, we accurately predict the outcome 83% of the time. The predictive
power of the model can be found in Table 2. The Chi-square statistic provides a
goodness-of fit measure; for the probit model the Chi-square statistic is 312, which is
quite strong. We also observe McFadden’s Likelihood Ratio of .056, which further
suggests the strength of the model. These results suggest that auditors do employ some

CHAPTER 3. THE SALES AND USE TAX GAP ESTIMATED USING MINNESOTA AUDIT EXPERIENCE
42
audit selection rules, with some industries and firm sizes facing a greater likelihood of
audit selection than others.
These results are not strictly comparable to those of Alm, Blackwell and McKee
(2004) or Murray (1995), as our data, variable definitions and specifications vary slightly
as discussed previously. We found that audit probability increased as firm size increased,
which is contrary to the findings of Murray (1995) who found that firms with greater
annual tax liability, and as such greater gross sales, had a lower probability of audit.
However, this finding is in line with those of Alm, Blackwell and McKee (2004) and may
be attributed to the fact that larger firms, ceteris paribus, have higher tax liabilities and as
such, may prove to be more productive targets. Larger firms also may have more
resources available to support noncompliant behavior such as legal resources and
accountants. Our findings show that firms located outside the state are less likely to be
audited than firms with in-state addresses, which is in line with the findings of
Murray(1995), as well as Alm, Blackwell and McKee (2004). This finding may be a
result of more resources located within the state.

CHAPTER 3. THE SALES AND USE TAX GAP ESTIMATED USING MINNESOTA AUDIT EXPERIENCE
43
TABLE 1 FIRST-STAGE AUDIT SELECTION EQUATION
Independent Variable Probit Marginal Effects
Logit Marginal Effects
Mining & Utilities 1.14% *** -0.20% *** Construction 0.94% *** 0.17% *** Manufacturing 0.10% *** -0.09% *** Wholesale Trade -0.11% *** -0.24% *** Retail Trade -2.19% *** -0.64% *** Transp. & Warehousing -1.12% *** -0.24% *** Information 0.39% ** -0.06% ** Finance & Insurance 1.63% *** 0.34% *** Real Estate & Leasing -1.39% *** -0.47% *** Prof. & Technical Services -0.40% *** -0.10% *** Adm. & Waste Management -1.43% *** -0.33% *** Arts, Entertainment & Recreation -1.45% *** -0.36% *** Accomodations & Food Services -2.20% *** -0.85% *** Other Services -2.97% *** -0.74% *** Annual Tax Liability 1 to 1,000 2.68% *** 0.69% *** Annual Tax Liability 1,000 to 10,000 7.01% *** 1.52% *** Annual Tax Liability 10,001 to 30,000 14.63% *** 1.90% *** Annual Tax Liability 30,001 to 75,000 19.44% *** 2.24% *** Annual Tax Liability 75,001 to 200,000
22.97% *** 2.53% ***
Annual Tax Liability 200,000 to 500,000
25.20% *** 2.85% ***
Annual Tax Liability > 500,001 26.95% *** 2.81% *** Outstate -2.89% -0.51% Year 2008-2009 0.63% 1.88% Year 2009-2010 1.60% -0.56% Number of Observations 730,572 ###### Log-likelihood 70366 14,650
Note: *** denotes statistical significance at the 99% confidence level for a two-tailed test; ** and * denote significance at the 95% and 90% levels. The coefficients shown in the table are percentage point differences in predicted audit rates.

CHAPTER 3. THE SALES AND USE TAX GAP ESTIMATED USING MINNESOTA AUDIT EXPERIENCE
44
Table 2 Predictive Power
PROBIT Predicted Outcome
Actual Outcome Not Selected Selected Total
Not Selected 594,235 398,214 708,522 Selected 7,828 14,222 22,050 Total 602,063 128,509 730,572 Percentage Correct 84% 64% 83%
LOGIT Predicted Outcome
Actual Outcome Not Selected Selected Total
Not Selected 310,308 398,214 708,522 Selected 3,043 19,007 22,050 Total 313,351 417,221 730,572 Percentage Correct 44% 86% 45%
In our second set of estimation results, we first examine the probability of
noncompliance for audited firms. Any firm with an audit assessment greater than zero is
considered noncompliant, whereas firms with an assessment of zero or a net refund are
considered compliant. Again, we use the probit model to determine the probability of
whether or not the audit yields an assessment. The dependent variable is a binary variable
equal to zero for no-change audits and refund audits, and 1 for audits with an assessment.
We run the equations separately for sales tax and use tax, to observe whether some firms
are more likely to non-comply with use tax than sales tax or vice-versa. We estimate this
model two ways: first, we run the probit model without controlling for audit selection

CHAPTER 3. THE SALES AND USE TAX GAP ESTIMATED USING MINNESOTA AUDIT EXPERIENCE
45
from the first regression; second, we run the probit model controlling for audit selection
in the first equation. The results of these regressions are reported in Tables 3a and 3b
respectively. This regression was run for audited firms with sales tax liability (16,525
firms), and firms with use tax liability (11,919 firms). This regression allows us to
compare the difference in sales and use tax compliance rates across industries.
First, we examine the marginal effects of audit outcomes with respect to use tax.
We observe that firms in the following industries are most compliant: Construction,
Professional & Technical Services and Finance & Insurance. Retail Trade firms are most
likely to be noncompliant, with marginal effects suggesting that have a predicted
probability that is .22 percentage point higher than that for De Minimis firms. Firms
located outside the state have a slightly higher rate of noncompliance than their in-state
counterparts; they have a .19 percentage point increase in the predicted probability rate.
Finally, we observe that firms are increasingly compliant as tax liability increases.
Next, we examine the marginal effects with respect to sales tax audit outcomes.
The firms most likely to be compliant with sales tax are firms in the following industries:
Retail Trade, Accommodations and Food Services, and Wholesale Trade. Firms in the
Finance & Insurance industry have the lowest compliance rate. With respect to firm
size, again we notice that the probability of having an assessment decreases as tax
liability increases, suggesting that larger firms are more compliant.

CHAPTER 3. THE SALES AND USE TAX GAP ESTIMATED USING MINNESOTA AUDIT EXPERIENCE
46
For both sales and use tax, firms located out-of-state are slightly more likely to be
noncompliant than firms located in-state; however this variable is only statistically
significant for firms with sales tax liability.
TABLE 3a PROBIT ESTIMATES: PROBABILITY OF NONCOMPLIANCE FOR AUDITED FIRMS
Independent Variable Probit Sales Tax Audit OutcomeMarginal Effects
Probit Use OutcomeMarginal Effects
Mining & Utilities 0.07 ***
(0.08)
Construction (0.05) ***
0.05
Manufacturing 0.09 * (0.04) *** Wholesale Trade 0.15 * (0.14) Retail Trade 0.16 0 (0.22) *** Transp. & Warehousing (0.07) **
* (0.08) ***
Information 0.10 ***
(0.10) ***
Finance & Insurance (0.28) 0 (0.03) *** Real Estate & Leasing 0.01 **
* (0.17) 0
Prof. & Technical Services 0.05 0 (0.03) Adm. & Waste Management 0.08 **
* (0.17) ***
Arts, Entertainment & Recreation 0.08 ***
(0.06) ***
Accomodations & Food Services 0.15 ***
(0.17) ***
Other Services 0.13 ***
(0.15) ***
Annual Tax Liability 1 to 1,000 0.45 ***
0.60 ***
Annual Tax Liability 1,000 to 10,000 0.63 ***
0.65 ***

CHAPTER 3. THE SALES AND USE TAX GAP ESTIMATED USING MINNESOTA AUDIT EXPERIENCE
47
Annual Tax Liability 10,001 to 30,000 0.64 ***
0.69 ***
Annual Tax Liability 30,001 to 75,000 0.69 ***
0.74 ***
Annual Tax Liability 75,001 to 200,000 0.65 ***
0.76 ***
Annual Tax Liability 200,000 to 500,000 0.65 ***
0.80 ***
Annual Tax Liability > 500,001 0.71 ***
0.83 ***
Outstate (0.19) ***
(0.25)
Number of Observations 16,525 11,919 Log-likelihood -10,188.56 -13,030
Note: *** denotes statistical significance at the 99% confidence level for a two-tailed test; ** and * denote significance at the 95% and 90% levels. The coefficients shown in the table are percentage point differences in predicted audit rates.
We run the probit equation again with the additional inverse Mills ratio variable
from the audit selection equation to control for audit selection. We observe that the
percentage point differences are smaller when we include the inverse Mills ratio.
However, the inverse Mills ratio is only statistically significant for use tax. The results
from this regression are very similar to those in the probit regression estimating
noncompliance behavior without controlling for audit selection. Again, we observe that
firms are generally more likely to be compliant as tax liability increases, and that out of
state firms are more likely to be noncompliant than their counterparts for both sales and
use tax. After controlling for audit selection, we find that the industries least likely to
yield an assessment for use tax include the following: Construction, Finance & Insurance
and Professional and Technical Services. The firms most likely to yield an audit
assessment for use tax are industries in the Retail Trade, Accommodations & Food

CHAPTER 3. THE SALES AND USE TAX GAP ESTIMATED USING MINNESOTA AUDIT EXPERIENCE
48
Services and Real Estate & Leasing. The firms most likely to be compliant with sales tax
are firms in the following industries: Accommodations and Food Services, Retail Trade
and Wholesale Trade. Firms in the Finance & Insurance industry have the lowest
compliance rate.
Although the inverse Mills ratio is only significant for use tax, it appears that
controlling for audit selection yields more consistent marginal effects. The coefficient on
the inverse Mills ratio is positive and significant, indicating that the unobservables
associated with audit selection are positively correlated with the unobservables associated
with the rate of compliance. Both models yield very low log-likelihood ratios, so both
models fit the data well.
TABLE 3b PROBIT ESTIMATES: PROBABILITY OF NONCOMPLIANCE CONTROLLING
FOR AUDIT SELECTION Independent Variable Probit Use Tax
Audit Outcome Marginal Effects
Probit Sales Tax Outcome Marginal
Effects Mining & Utilities
(0.04) **
0.03
Construction 0.04
*** (0.02)
***
Manufacturing (0.02)
*** 0.04
***
Wholesale Trade (0.09)
*** 0.07
***
Retail Trade (0.14)
*** 0.07
***
Transp. & Warehousing (0.05)
*** (0.03)
***
Information (0.06)
*** 0.05
***

CHAPTER 3. THE SALES AND USE TAX GAP ESTIMATED USING MINNESOTA AUDIT EXPERIENCE
49
Finance & Insurance (0.01)
(0.13)
***
Real Estate & Leasing (0.11)
*** 0.01
Prof. & Technical Services (0.02)
* 0.02
***
Adm. & Waste Management (0.11)
*** 0.04
***
Arts, Entertainment & Recreation (0.04)
*** 0.04
***
Accomodations & Food Services (0.12)
*** 0.07
***
Other Services (0.10)
*** 0.06
***
Annual Tax Liability 1 to 1,000 0.36
*** 0.20
***
Annual Tax Liability 1,000 to 10,000 0.40
*** 0.28
***
Annual Tax Liability 10,001 to 30,000 0.43
*** 0.28
***
Annual Tax Liability 30,001 to 75,000 0.47
*** 0.30
***
Annual Tax Liability 75,001 to 200,000 0.49
*** 0.28
***
Annual Tax Liability 200,000 to 500,000 0.53
*** 0.28
***
Annual Tax Liability > 500,001 0.54
*** 0.30
***
Outstate 0.00
-
Lambda (0.61)
*** 0.12
Number of Observations 16,525 11,919 Log-likelihood -10,184.95 -13,030 Note: *** denotes statistical significance at the 99% confidence level for a two-tailed test; ** and * denote significance at the 95% and 90% levels. The coefficients shown in the table are percentage point differences in predicted audit rates.
Finally, we observe the rate of non-compliance among firms that were audited. In
the second-stage regression, we estimate the noncompliance rates of audited firms. Using

CHAPTER 3. THE SALES AND USE TAX GAP ESTIMATED USING MINNESOTA AUDIT EXPERIENCE
50
a Tobit model, we regress firm characteristics against the monthly sales and use tax
assessments. We examine the coefficients from the Tobit regression as these coefficients
actually represent assessment values in dollar terms.
Let us first examine the results from second-stage regression using Heckman’s
inverse Mills ratio. As tax liability increases for both sales and use tax, the size of the
audit assessment increases. The firms with greatest monthly use tax audit assessments are
in Accommodations & Food Services, Mining & Utilities, and Other Services industries
with monthly assessments of $510, $468 and $456 respectively. Again, these assessment
figures are with respect to the omitted industries in the De Minimis category. The firms
with the greatest use tax assessments are in the following sectors: Construction,
Information and Wholesale Trade. These firms have monthly assessment rates of $238,
$87 and $34 respectively. The coefficient on the inverse Mills ratio is negative and
significant, indicating that the unobservables associated with audit selection are
negatively correlated with the unobservables associated with the rate of compliance.
Next, we examine the results from the second-stage regression using the IPTW
approach. Similar to the findings from the Heckman second-stage regression, we find that
as tax liability increases for both sales and use tax, the size of the audit assessment
increases. The firms with greatest monthly use tax audit assessments are in the Finance &
Insurance, Manufacturing and Mining and Utilities industries with monthly assessments
of $912, $416 and $407 respectively. The firms with the greatest sales tax assessments

CHAPTER 3. THE SALES AND USE TAX GAP ESTIMATED USING MINNESOTA AUDIT EXPERIENCE
51
are in the following sectors: Information, Mining & Utilities and Real Estate &
Insurance. These firms have assessment rates of $657, $172 and $106 respectively.
The regression results in tables 4a and 4b illustrate that as firm size increases,
their compliance rate increases. Our estimates from both the Heckman and IPTW
secondary regression suggest that the larger the scale of a firm’s operation as measured
by their annual tax liability, the greater the size of the assessment. So while many audits
of large firms may yield no assessment, those that do yield large assessments, which
likely explains the increased audit probability of larger firms.
Finally, for the sake of comparison, we regress firm characteristics on the sales
and use tax audit assessment value using OLS regression. The results of this regression
can be found in Table 4c. Again, we find that as tax liability increases for both sales and
use tax, the size of the audit assessment increases. The firms with greatest monthly use
tax audit assessments are in Mining and Utilities, Construction and Manufacturing
industries with assessments of $3,437, $1,012 and $922 respectively. The firms with the
greatest monthly sales tax assessments are in the following sectors: Information,
Administrative & Waste and Real Estate & Insurance. These firms have assessment rates
of $651, $93 and $88 respectively. However, the R-squared for both of these regressions
is extremely low, suggesting that this model is not a suitable fit for the data.

CHAPTER 3. THE SALES AND USE TAX GAP ESTIMATED USING MINNESOTA AUDIT EXPERIENCE
52
TABLE 4a TOBIT ESTIMATES: PROBABILITY OF NONCOMPLIANCE CONTROLLING
FOR AUDIT SELECTION USING THE HECKMAN SAMPLE SELECTION CORRECTION
Independent Variable Sales Tax Audit Outcome Coefficients
Use Tax Audit Outcome
Coefficients Intercept $ 12,582 *** $ 7,387 *** Mining & Utilities $ 468 *** $ (440) *** Construction $ (217) *** $ 238 *** Manufacturing $ 416 *** $ (407) *** Wholesale Trade $ (37) $ 34 Retail Trade $ 309 *** $ (344) *** Transp. & Warehousing $ 106 $ (113) Information $ (75) $ 87 Finance & Insurance $ 211 * $ (158) * Real Estate & Leasing $ 279 *** $ (301) *** Prof. & Technical Services $ 9 $ (10) Adm. & Waste Management $ 181 *** $ (192) *** Arts, Entertainment & Recreation $ (27) $ 15 Accomodations & Food Services $ 510 *** $ (571) *** Other Services $ 456 *** $ (480) *** Annual Tax Liability 1 to 1,000 $ 194 $ 184 Annual Tax Liability 1,000 to 10,000 $ 686 *** $ 670 *** Annual Tax Liability 10,001 to 30,000 $ 955 *** $ 954 *** Annual Tax Liability 30,001 to 75,000 $ 1,311 *** $ 1,336 *** Annual Tax Liability 75,001 to 200,000 $ 1,555 *** $ 1,623 *** Annual Tax Liability 200,000 to 500,000 $ 1,841 *** $ 2,001 *** Annual Tax Liability > 500,001 $ 151 ** $ 302 ** Lambda $
(15,988) *** $
(25,102) ***
Number of Observations 29,527 20,672 Log-likelihood (184,884.16) (179,662)
Note: *** denotes statistical significance at the 99% confidence level for a two-tailed test; ** and * denote significance at the 95% and 90% levels. The coefficients shown in the table are percentage point differences in predicted audit rates.

CHAPTER 3. THE SALES AND USE TAX GAP ESTIMATED USING MINNESOTA AUDIT EXPERIENCE
53
TABLE 4b TOBIT ESTIMATES: PROBABILITY OF NONCOMPLIANCE
CONTROLLING FOR AUDIT SELECTION USING PROPENSITY SCORE WEIGHTING
Independent Variable Use Tax Coefficients
Sales Tax Coefficients
Intercept $ 45 $ (55) Mining & Utilities $ 407 *** $ 172 *** Construction $ (3) $ (20) Manufacturing $ 416 *** $ (4) Wholesale Trade $ (359) *** $ (136) *** Retail Trade $ (380) *** $ 1 Transp. & Warehousing $ (135) $ (55) Information $ (183) *** $ 657 *** Finance & Insurance $ 912 *** $ (75) Real Estate & Leasing $ (240) *** $ 106 *** Prof. & Technical Services $ (86) *** $ 71 *** Adm. & Waste Management $ (156) *** $ 70 *** Arts, Entertainment & Recreation $ (387) *** $ (152) ** Accomodations & Food Services $ (463) *** $ 38 *** Other Services $ (241) *** $ 44 Annual Tax Liability 1 to 1,000 $ 18 ** $ 21 Annual Tax Liability 1,000 to 10,000 $ 100 *** $ 54 *** Annual Tax Liability 10,001 to 30,000 $ 253 *** $ 154 *** Annual Tax Liability 30,001 to 75,000 $ 332 *** $ 323 *** Annual Tax Liability 75,001 to 200,000
$ 526 *** $ 392 ***
Annual Tax Liability 200,000 to 500,000
$ 835 *** $ 668 ***
Annual Tax Liability > 500,001 $ 2,646 *** $ 2,044 *** Number of Observations 29,672 20,673 Log-likelihood (2,051,917) (2,164,648)
Note: *** denotes statistical significance at the 99% confidence level for a two-tailed test; ** and * denote significance at the 95% and 90% levels. The coefficients shown in the table are percentage point differences in predicted audit rates.

CHAPTER 3. THE SALES AND USE TAX GAP ESTIMATED USING MINNESOTA AUDIT EXPERIENCE
54
TABLE 4c OLS AUDIT ASSESSMENT REGRESSION
Independent Variable
Dependent Variable
OLS Sales Assessment
OLS Use Assessment
Intercept -53.18 *** 73.84 *** Mining & Utilities
-18.35 *** 3437.35 ***
Construction -11.45 ** 1012.39 Manufacturing 8.74 *** 922.97 *** Wholesale Trade -104.79 *** 706.17 ***
Retail Trade 7.93 *** 478.88 *** Transp. & Warehousing
20.96 *** 371.69 ***
Information 651.42 *** 314.97 *** Finance & Insurance
-49.38 271.35
Real Estate & Leasing
88.46 ** 94.31 ***
Prof. & Technical Services
55.53 *** 8.73 ***
Adm. & Waste Management
93.91 *** -0.73 ***
Arts, Entertainment & Recreation
-45.20 *** -70.52 ***
Accomodations & Food Services
-28.62 *** -73.90 ***
Other Services 34.02 -103.73 *** Annual Tax Liability 1 to 1,000
16.44 *** 122.76 ***
Annual Tax Liability 1,000 to 10,000
88.97 *** 129.61 ***
Annual Tax 283.29 206.58 ***
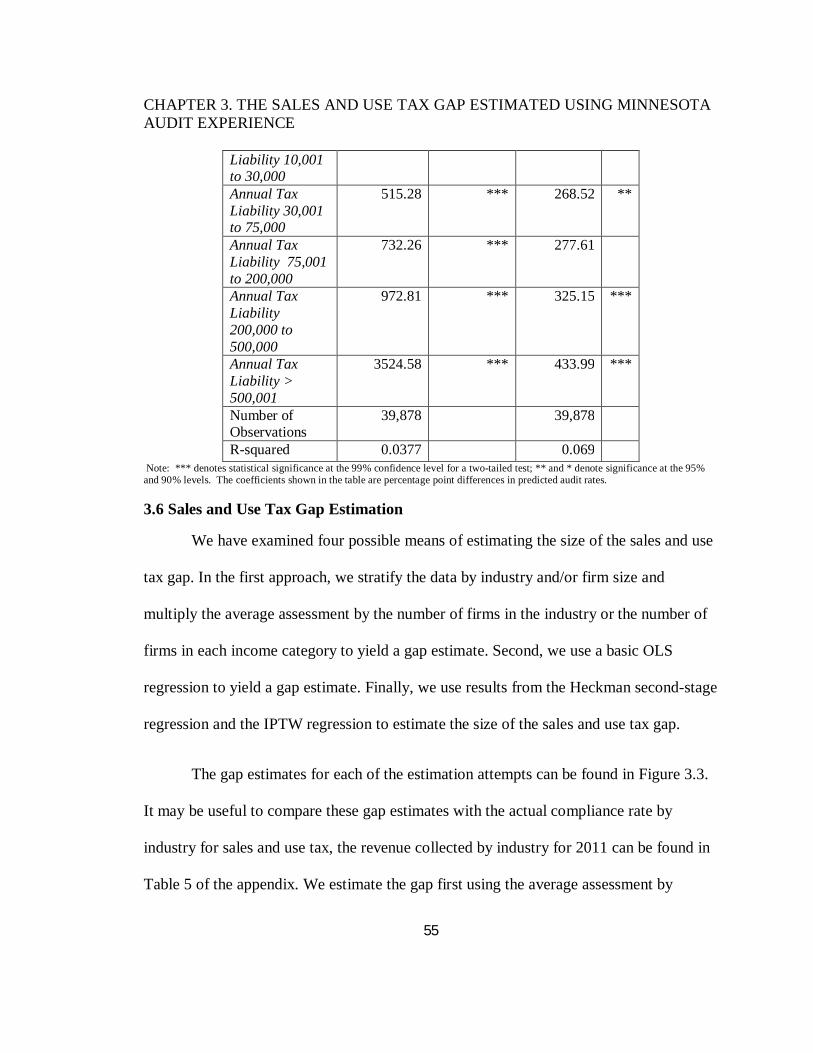
CHAPTER 3. THE SALES AND USE TAX GAP ESTIMATED USING MINNESOTA AUDIT EXPERIENCE
55
Liability 10,001 to 30,000 Annual Tax Liability 30,001 to 75,000
515.28 *** 268.52 **
Annual Tax Liability 75,001 to 200,000
732.26 *** 277.61
Annual Tax Liability 200,000 to 500,000
972.81 *** 325.15 ***
Annual Tax Liability > 500,001
3524.58 *** 433.99 ***
Number of Observations
39,878 39,878
R-squared 0.0377 0.069 Note: *** denotes statistical significance at the 99% confidence level for a two-tailed test; ** and * denote significance at the 95% and 90% levels. The coefficients shown in the table are percentage point differences in predicted audit rates.
3.6 Sales and Use Tax Gap Estimation
We have examined four possible means of estimating the size of the sales and use
tax gap. In the first approach, we stratify the data by industry and/or firm size and
multiply the average assessment by the number of firms in the industry or the number of
firms in each income category to yield a gap estimate. Second, we use a basic OLS
regression to yield a gap estimate. Finally, we use results from the Heckman second-stage
regression and the IPTW regression to estimate the size of the sales and use tax gap.
The gap estimates for each of the estimation attempts can be found in Figure 3.3.
It may be useful to compare these gap estimates with the actual compliance rate by
industry for sales and use tax, the revenue collected by industry for 2011 can be found in
Table 5 of the appendix. We estimate the gap first using the average assessment by

CHAPTER 3. THE SALES AND USE TAX GAP ESTIMATED USING MINNESOTA AUDIT EXPERIENCE
56
industry; this methodology yields a sales tax gap of $49 million and a use tax gap of $31
million. Similarly, we estimate the gap by multiplying the average assessment by firm
size by the number of firms in each category. This approach yields a sales tax gap of
$117 million and a use tax gap of $87 million.
The estimates from the regression results listed in Tables 4a, 4b and 4c allow us to
estimate the sales and use tax gap using a different methodology. We do this by first
multiplying the coefficients by 12, to convert the monthly estimate to an annual estimate.
Next, we multiply the coefficient by the number of firms in each industry or income
category that were actively filing with the Department of Revenue in 2010. As such, all
estimates reflect a gap estimate for 2010. Using the OLS regression results found in
Table 4c, this approach yields a sales tax gap of $979 million and a use tax gap of $293
million. We then use the results from the two-stage regression estimation using the IPTW
approach to control for audit selection (Table 4b), which yields a sales tax gap of $263
million and a use tax gap of $207 million. Finally, we use the results form the two-stage
regression estimation using the inverse Mills ratio to control for audit selection (Table
4a), which yields a sales tax gap of $1,039 million and a use tax gap of 154 million.
As Figure 3.3 illustrates, the OLS regression yields very different results than the
IPTW approach. This suggests that controlling for factors related to audit selection helps
us estimate a more accurate tax gap. Ideally, our results from the IPTW approach and the
Heckman selection correction approach would yield similar results. It is likely that the

CHAPTER 3. THE SALES AND USE TAX GAP ESTIMATED USING MINNESOTA AUDIT EXPERIENCE
57
Heckman selection correction approach is not the appropriate fit for this model. There are
two well-documented limitations to the Heckman approach. First, as with any estimated
regressor, the estimated variance-covariance matrix needs to be adjusted, which is
beyond the scope of this project. Second, the Heckman selection method is highly
sensitive to specification. The IPTW approach does not suffer these limitations, making it
the best model to estimate the sales and use tax gap in the future. While it is helpful in
providing an upper-bound to our gap estimation, the Heckman selection correction results
are likely an overestimate and should not be relied upon. Future research could explore
the sensitivity of the predicted tax revenue gaps to different specifications.
Our results suggest that the sales tax gap is somewhere between $263-$1,039
million each year and that use tax gap is somewhere between $154-293 million. We then
add these results to our findings from the remote sales tax gap due to e-commerce. The
projected e-commerce gap in 2010 was approximately 107.3. This increases the size of
the projected annual use tax gap to $261.3-$400.3 million. This puts the annual combined
sales and use tax gap for filers somewhere between $524.3 million and $1,439.3 million.
Ideally, the tax gap estimation process would also include the size of the total sales and
use tax gap for non-filers. The Department of Revenue collected $4.3 billion in sales tax
revenue and $338 million in use tax revenue in 2010; the projected gap estimates
illustrate that the sales tax gap represents a very minimal proportion of total sales tax
liability, whereas the use tax gap represents a very large share of total use tax liability.

CHAPTER 3. THE SALES AND USE TAX GAP ESTIMATED USING MINNESOTA AUDIT EXPERIENCE
58
$49 $117
$979
$263
$1,039
$31 $87
$293 $207 $154
MeanAssessment by
Industry
MeanAssessment by
Annual TaxLiabilityCategory
OLS Regression Second-StagePropensity Score
WeightingRegression
Second-StageHeckmanSelection
CorrectionRegression
Figure 3.3: Sales and Use Tax Gap Estimation
Sales Tax Gap Use Tax Gap

CHAPTER 4. CONCLUSIONS
59
Chapter 4
Conclusions
We observed the rapidly growing e-commerce sector and the role online shopping
is playing in Minnesota. In 1999, e-commerce represented approximately $8.7 million
dollars in lost revenue. As consumers shift from traditional retailers to online alternatives,
this number has rapidly increased in recent years and continues to climb each year. Using
the aggregate data from the U.S. Census Bureau, we estimate the Minnesota e-commerce
gap to represent an estimated $96.5 million dollars in lost revenue for 2013. We estimate
this figure will grow to $190.9 million by 2017. Similarly, we estimate the lost sales and
use tax revenue due to the mail order gap. While the mail order gap is not growing as
rapidly as e-commerce, these sales represent an estimated $72.4 million dollars in lost
revenue in 2013, with that figure growing to $81.5 by 2017.
It is likely that a combination of federal and state legislation will aim to recover
the use revenue lost to e-commerce in coming years. While this will significantly
decrease the size of the business-to-consumer gap, as well as the use tax gap for both
firms and individuals, a sales tax gap will persist. We estimate the business-to-business
sales and use tax gap using MN audit experience. After controlling for audit selection, we
estimate the sales tax gap to be between $263 million to $1,039 million dollars each year.
The use tax gap is somewhere between $261.3 million dollars and $400.3 million dollars.
We find larger firms are more likely to be audited, but that they are more likely to
yield a no-change assessment, indicating that compliance increases as firm size increases.
However, the size of audit assessments increase as tax liability increases, which likely

CHAPTER 4. CONCLUSIONS
60
explains why audit rates increase as firm size increases. We also find that firms with out
of state addresses are less likely to be audited but are more likely to be noncompliant. It is
possible that firms with non-state ownership may not have a thorough knowledge of sales
tax laws in Minnesota. It is also possible that Minnesota tax law complexity provides out
of state taxpayers with an increased opportunity to underreport. These findings are in line
with those of Murray (1995), and support the theory that the likelihood of auditing out of
state is correlated with auditing resources.
The industries with the lowest probability of audit are firms in the following
industries: Accommodations & Food Services, Other Services and Retail Trade. The
firms most likely to be selected for audit are firms in the Finance & Insurance industries
and firms in the Construction and Information industries.
From our secondary regression analyzing noncompliance of audited firms, we can
conclude that the industries most likely to be fully compliant with sales tax, or to yield a
no-change audit, are firms in the Accommodations and Food Services, Retail Trade and
Wholesale Trade Sectors, while the least compliant industries are firms in the Finance &
Insurance industry. With regard to use tax, we find that the firms least likely to yield an
assessment were firms in the Construction, Finance & Insurance and Professional &
Technical Services sectors. The firms most likely to yield an audit assessment for use tax
are industries in the Retail Trade, Administration & Waste and Accommodations & Food
Services sectors.

CHAPTER 4. CONCLUSIONS
61
Finally, from our analysis of the predicted magnitude of noncompliance, we can
conclude that, after controlling for firm size and audit selection, the industries most likely
to yield high use tax audit assessments are firms in the Mining and Utilities and Finance
& Insurance industries. Firms most likely to yield high sales tax audit assessments are
firms in the Information industry.
4.1 Limitations and Updating the Model
The greatest limitation we face in this study is in addressing the endogenous
nature of the relationship between auditors and audited firms. The auditors have
information about the likelihood a firm is noncompliant that we are unable to control for
in the model. While we attempted to mitigate the endogoneity through a two-stage
regression equation, our parameter estimates iusing the Heckman sample selection
correction (1979) may represent an overestimate of the sales and use tax gap. When
employing the Heckman correction, the estimated variance covariance matrix needs to be
adjusted to control for the inclusion of the estimated regressor. Future research could explore the
sensitivity of the predicted tax revenue gaps to different specifications.
Several variables could provide further insight in future research. If the data were
available, it would be interesting to analyze how firms with affiliates play the sales tax
compliance game. Things such as the age of the firm or variations in reporting might also
be helpful in discovering patterns in compliance behavior. It is important to note that
these results are specific to firms filing in the state of Minnesota and as such, it is
possible that other states may have contrary results. We should also note that auditors
may not fully uncover unreported tax liability. Additionally, because we had to convert

CHAPTER 4. CONCLUSIONS
62
much of the data to monthly data, we are unable to observe when firms are more likely to
be non-compliant.
There are many ways in which the model could be improved. We were unable to observe
and compare the compliance behavior of non-filing firms. Unfortunately, we were unable to
conduct this type of analysis because we did not have enough information from the audited
sample to reliably compare non-filers with filers at this time.
4.2 Potential Practical Applications
The erosion of the traditional sales tax base attributed to online sales is an issue
that has come to the forefront of tax policy decision making in recent years. Internet
retailing is growing at the expense of traditional retailing, diminishing revenue states
have historically relied upon. Because sales tax is enforced at the state and local level, it
is difficult to enforce collection of sales tax on purchases made out-of-state. The
increasing popularity of online sales has influenced consumer behavior, as it encourages
consumers to make purchases online rather than brick-and-mortar stores. Firm behavior is
also distorted, as failure to collect sales tax on online sales favors relocation of physical
operations to avoid nexus in sales tax states.
In addition to mitigating lost revenue due to e-commerce and mail-order sales, it
is in the best interest of Revenue authorities to best utilize the resources available to
increase compliance behavior within the state. Examining the types of firms most likely
to be noncompliant can improve the efficiency of allocation of auditing resources, both to
increase sales and use tax revenue, but also to improve taxpayer compliance and
education of their responsibility to collect and remit tax.

CHAPTER 4. CONCLUSIONS
63
In this paper we have illustrated the extremely low use tax compliance rates
present across firms and industries. While audit frequency may improve use tax
compliance, the use tax gap remains significant. Minnesota has a number of options to
increase use tax compliance. First, Minnesota could repeal the de minimis exemption and
place a use tax reporting line on the individual income tax return. This may increase
individual use tax compliance, but would not address firm noncompliance.
Minnesota could also provide a lookup table for taxpayers to use in estimating
liability. States with lookup tables tend to experience greater participation and overall
collections; Manzi (2012) speculates that Minnesota collections could reach $4.4. million
if a lookup table for use tax liability were included in income tax instructions.15
Another approach to capture use tax is taxing some services, including business-
to-business services. This approach is controversial, as it may introduce distortions
favoring firms that are vertically integrated over smaller firms with limited resources.
There has also been consideration of a national sales tax, that would replace existing state
and local sales taxes. However, this approach is highly controversial, and remains
unlikely. While it is unclear exactly how state and federal lawmakers will enforce the
taxation of online sales, it is highly likely a resolution will be reached in the near future.
Under the current sales and use tax system in Minnesota, audits may be most
effective if they are concentrated in service industries, as well as industries most likely to
participate in online sales such as retail trade. We can also conclude that firms with
greater tax liability are highly compliant; however, the small proportions of large firms
that are non-compliant represent substantial amounts of unreported revenue.
15 This estimate is based on experiences in states with lookup tables.

APPENDIX
64
APPENDIX
APPENDIX TABLE 1 MINNESOTA APPORTIONMENT RATIOS
(USED TO CALCULATE REMOTE SALES TAX GAP) NAICS Code
Selected
Industry
Description US Value of sales,
shipments, receipts,
revenue or business done
MN Value of sales,
shipments, receipts,
revenue or business
done
MN apportionm
ent ratio
441 Retail Trade Sales
Motor vehicle and parts dealers
891,036,746
13,764,244
1.54%
442 Furniture and home furnishings stores
108,220,081
1,933,796
1.79%
443 Electronics and appliance stores
109,014,992
2,053,591
1.88%
444 Building material and garden equipment and supplies dealers
318,320,271
6,658,264
2.09%
445 Food and beverage stores
539,207,574
8,418,647
1.56%
446 Health and personal care stores
234,026,783
3,444,707
1.47%
447 Gasoline stations 450,413,061
9,848,967
2.19%
448 Clothing and clothing accessories stores
215,647,177
2,970,993
1.38%
451 Sporting goods, hobby, book, and music stores
81,084,315
1,736,039
2.14%
452 General merchandise stores
577,098,195
10,564,370
1.83%
453 Miscellaneous store retailers
104,068,221
1,474,363
1.42%
454 Nonstore retailers 289,526,040
8,516,122
2.94%

APPENDIX
65
45411 Electronic shopping and mail-order houses
220,656,247
6,907,101
3.13%
48-49(102)
Selected
Service Industr
ies
Transportation and warehousing(102)
639,916,407
15,056,099
2.35%
481(101) Air transportation(101)
146,612,459
5,978,532
1.25%
483 Water transportation
36,056,934
91,675
0.25%
484 Truck transportation
221,737,480
5,367,790
2.42%
485 Transit and ground passenger transportation
26,464,611
379,121
1.26%
486 Pipeline transportation
25,717,767
440,165
1.71%
487 Scenic and sightseeing transportation
2,447,598
17,913
0.73%
488 Support activities for transportation
86,596,320
1,040,179
1.20%
492 Couriers and messengers
77,876,714
1,234,285
1.58%
493 Warehousing and storage
21,920,686
243,732
1.11%
51 Information 1,072,342,856
N
511 Publishing industries (except Internet)
282,223,524
6,394,899
2.27%
517 Telecommunications
480,031,235
N 1.71%
51811 Internet service providers
21,418,640
94,832
0.44%
52 Finance and insurance
3,711,218,495
3,069,624
2.00%
5223 Activities related to credit intermediation
70,286,514
1,577,611
2.24%
523x Selected finance7 5231 Securities and
commodity contracts
611,507,962
10,007,895
1.64%

APPENDIX
66
intermediation and brokerage
53 Real estate and rental and leasing
443,142,793
8,944,405
2.02%
54 Professional, scientific, and technical services
1,258,012,450
20,675,362
1.64%
5415 Computer systems design and related services
244,389,132
3,892,378
1.59%
56 Administrative and support and waste management and remediation services
623,762,145
9,979,512
1.60%
62 Health care and social assistance
1,668,276,808
33,997,419
2.04%
61 Educational Services
44,980,656
653,127
1.45%
71 Arts, entertainment, and recreation
189,416,942
2,923,638
1.54%
72 Accommodation and food services
613,795,732
10,423,660
1.70%
81 Other services (except public administration)
405,283,270
2,538,024
0.63%
811 Repair and maintenance
137,732,616
2,538,024
1.84%

APPENDIX
67
APPENDIX TABLE 2 REMOTE SALES TAX GAP (Retail Only)
Total Tax Liability Calculated using E-Stats
Less de minimis
Tax liability
Sales tax remitted by remote sellers
Use tax paid by individuals
Tax Gap
1999 78.09 4.20 73.89 16.20 0.12 57.57 2000 92.58 4.80 87.78 20.10 0.16 67.52 2001 89.67 5.40 84.27 21.70 0.16 62.41 2002 98.88 6.00 92.88 23.40 0.17 69.31 2003 100.79 6.40 94.39 23.50 0.18 94.21 2004 105.27 6.80 98.47 23.47 0.22 74.78 2005 123.60 7.25 116.35 29.76 0.24 86.35 2006 135.71 7.75 127.96 36.40 0.27 91.30 2007 156.62 8.35 148.27 35.80 0.34 112.13 2008 157.93 9.00 148.93 41.03 0.34 107.56 2009 158.17 9.70 148.47 57.95 0.38 90.14 2010 177.81 10.55 167.26 56.99 0.37 109.90
APPENDIX TABLE 3 DESCRIPTION OF VARIABLES
Variable Name
Description Source of Variable
Compliance Rate
The compliance rate of audited firms is calculated by dividing the voluntary compliance of the taxpayer by the "true" tax liability, or post-audit findings.
Original Return
Average Voluntary Compliance
Average monthly voluntary payment remitted to the Minnesota Department of Revenue.
Original Return
Normalized Voluntary Compliance
The log of the monthly sales and use tax voluntarily remitted to the Minnesota Deparment of Revenue.
Original Return
Month total Total number of months reported on one return by the taxpayer; the number of months reported on a return varies depending on whether or not the taxpayer files monthly, quarterly, semi-annually or annually.
Original Return
Audit Selection
Dummy variable equal to 1 if the firm was selected for audit between Jan 1, 2008 and August 15, 2012.
Audited Files
Audit Outcome
Dummy variable equal to 1 if the audit resulted in an assessment and 0 if the audit resulted in no change.
Audited Files
Average Monthly
Average monthly assessment, as determined by Department of Revenue Auditors.
Audited Files

APPENDIX
68
Assessment Normalized Assessment
The log of the monthly assessment, as determined by Department of Revenue auditors.
Audited Files
Accomodations & Food Services
Dummy variable equal to 1 if NAICS code falls within the range: 720000 – 722410
Found on both Original Return and Audit Files
Adm. & Waste Management
Dummy variable equal to 1 if NAICS code falls within the range: 560000-562998
Found on both Original Return and Audit Files
Arts, Entertainment & Recreation
Dummy variable equal to 1 if NAICS code falls within the range: 710000 – 713990
Found on both Original Return and Audit Files
Construction Dummy variable equal to 1 if NAICS code falls within the range: 236000 – 238990
Found on both Original Return and Audit Files
Finance & Insurance
Dummy variable equal to 1 if NAICS code falls within the range: 520000 – 525990
Found on both Original Return and Audit Files
Information Dummy variable equal to 1 if NAICS code falls within the range: 510000 – 519190
Found on both Original Return and Audit Files
Manufacturing
Dummy variable equal to 1 if NAICS code falls within the range: 311000 – 339999
Found on both Original Return and Audit Files
Mining & Utilities
Dummy variable equal to 1 if NAICS code falls within the range: 210000 – 213115
Found on both Original Return and Audit Files
Miscellaneous Dummy variable equal to 1 if NAICS code falls within the range: 810000 – 928120
Found on both Original

APPENDIX
69
Return and Audit Files
Other Services Dummy variable equal to 1 if NAICS code falls within the range: 540000-541990
Found on both Original Return and Audit Files
Prof. & Technical Services
Dummy variable equal to 1 if NAICS code falls within the range: 530000 – 533110
Found on both Original Return and Audit Files
Real Estate & Leasing
Dummy variable equal to 1 if NAICS code falls within the range: 441000 – 454390
Found on both Original Return and Audit Files
Retail Trade Dummy variable equal to 1 if NAICS code falls within the range: 481000 – 493190
Found on both Original Return and Audit Files
Transp. & Warehousing
Dummy variable equal to 1 if NAICS code falls within the range: 220000 – 221330
Found on both Original Return and Audit Files
Wholesale Trade
Dummy variable equal to 1 if NAICS code falls within the range: 420000 – 425120
Found on both Original Return and Audit Files
De Minimus & Unclassified
Dummy variable equal to 1 if NAICScode falls within the following ranges: 110000 – 115310; 550000 – 551114; 610000 – 611710 and 990000-999999 (This includes the following industries: Forestry, Fishing, Hunting and Agriculture Support; Management of Companies and Enterprises; Education; Health Care and Social Assistance and Unclassified)
Found on both Original Return and Audit Files
Annual Tax Liability Less than or equal to zero
Dummy variable indicating firm size. The annual tax liability is the amount voluntary reported on the return plus any additional audit assessments.
Found on both Original Return and Audit Files
Annual Tax Liability 1 to
Dummy variable indicating firm size. The annual tax liability is the amount voluntary reported on the return
Found on both

APPENDIX
70
1,000 plus any additional audit assessments. Original Return and Audit Files
Annual Tax Liability 1,000 to 10,000
Dummy variable indicating firm size. The annual tax liability is the amount voluntary reported on the return plus any additional audit assessments.
Found on both Original Return and Audit Files
Annual Tax Liability 10,001 to 75,000
Dummy variable indicating firm size. The annual tax liability is the amount voluntary reported on the return plus any additional audit assessments.
Found on both Original Return and Audit Files
Annual Tax Liability 75,000 to 200,000
Dummy variable indicating firm size. The annual tax liability is the amount voluntary reported on the return plus any additional audit assessments.
Found on both Original Return and Audit Files
Annual Tax Liability Greater than 200,001 to 500,000
Dummy variable indicating firm size. The annual tax liability is the amount voluntary reported on the return plus any additional audit assessments.
Found on both Original Return and Audit Files
Annual Tax Liability Greater than 500,000
Dummy variable indicating firm size. The annual tax liability is the amount voluntary reported on the return plus any additional audit assessments.
Found on both Original Return and Audit Files
Out of State
Indicates firms with out-of-state addresses. Original Return
Non-filer Indicates audited firms that were not filing with the Department of Minnesota for at least one month during the audited period.
Audited Files
Inverse Mills Ratio
Inverse Mills Ratio from the audit selection equation Stage One Audit Selection Estimation
Predicted Audit Rate
Fitted values from the audit compliance equation Stage Two Audit Compliance Estimation

APPENDIX
71
APPENDIX 4 DESCRIPTIVE STATISTICS FOR AUDITED AND NON-AUDITED
FIRMS Variable Overall Audited Firms
Mean Standard Deviation
Mean Standard Deviation
Monthly Assessment $ 403 $ 2,329
Monthly Sales Noncompliance $ 193 $ 1,459
Monthly Use Noncompliance $ 185 $ 1,627
Assessment Total $ 16,900 $ 115,150
Monthly Voluntary Compliance $ 2,986
$ 69,209
$ 13,426 $ 146,673
Out of State address 15% 9%
APPENDIX TABLE 5 COMPLIANCE RATE BY INDUSTRY 2011
Sales Tax Compliance 2011
Use Tax Compliance 2011
De Minimus $38,242,757 $12,317,431 Mining & Utilities $325,751,861 $46,966,712 Construction $39,134,384 $31,534,311 Manufacturing $276,919,375 $96,537,516 Wholesale Trade $376,416,968 $30,157,664 Retail Trade $1,774,697,756 $46,484,084 Transp. & Warehousing $25,299,315 $14,361,665 Information $419,116,784 $13,247,484 Finance & Insurance $11,185,023 $7,982,957 Real Estate & Leasing $120,706,287 $4,034,531 Prof. & Technical Services $88,642,052 $14,184,745 Adm. & Waste Management $110,532,082 $6,870,825 Arts, Entertainment & Recreation
$127,886,531 $1,912,796
Accomodations & Food Services
$640,928,662 $7,934,098
Other Services $151,265,314 $5,806,123

APPENDIX
72
Total $4,526,725,151 $340,332,942

73
REFERENCES
Alm, J., and C. Blackwell. McKee., M.(2004).“Audit selection and firm compliance with a Broad–based sales tax.”. National Tax Journal 57 (2 Part 1).
Alm, James, Calvin Blackwell, and Michael McKee. 2005. Audit selection and firm compliance with a broad-based sales tax. Andrew Young School of Policy Studies Research Paper Series(06-42).
Alm, James, Betty R. Jackson, and Michael McKee. 1992. Estimating the determinants of taxpayer compliance with experimental data. National Tax Journal 45 (1): 107-14.
Alm, James, Betty Jackson, and Michael McKee. 1992. Institutional uncertainty and taxpayer compliance. The American Economic Review 82 (4): 1018-26.
Alm, James, Michael McKee, and William Beck. 1990. Amazing grace: Tax amnesties and compliance. National Tax Journal 43 (1): 23-37.
American Economics Group, Inc., “Minnesota Sales and Use Tax Gap Project: final Report,” Prepared for Department of Revenue, State of Minnesota, November 19, 2002. http://www.revenue.state.mn.us/research_stats/research_reports/2--2/research_reports_content_taxgap_full_1102.pdf
Angrist, J., and S. Pischke (2008), Mostly Harmless Econometrics: An Empiricists’ Companion, Princeton University Press, Princeton, NJ.
Austin, Peter C. 2011. An introduction to propensity score methods for reducing the effects of confounding in observational studies. Multivariate Behavioral Research 46 (3): 399-424.
Blackston, M. 2008. Closing the online tax loophole: The popularity of e-commerce has refocused the need to simplify the sales tax. State Legislatures 34 : 24-5.
Bruce, Donald, and William F. Fox. 2004. State and local sales tax revenue losses from e-commerce: Estimates as of July 2004Center for Business and Economic Research.
Bruce, Donald, and William F. Fox. 2001. State and local sales tax revenue losses from e-commerce: Updated estimates Center for Business and Economic Research Knoxville, Tennessee.
Bruce, Donald, William F. Fox and LeAnn Luna. 2009. State and local sales tax revenue losses from e-commerce: Updated estimates. State Tax Notes.

74
Chamberlain, Andrew and Fleenor, Patrick. Tax Pyramiding: The Economic Consequences of Gross Receipts Taxes. State Tax Notes, Vol. 43, No. 7, February 19, 2007. Available at SSRN: http://ssrn.com/abstract=963557
Cornia, Gary C., David L. Sjoquist, and Lawrence C. Walters. 2004. Sales and use tax simplification and voluntary compliance. Public Budgeting & Finance 24 (1): 1-31.
Cullis, John, Philip Jones, and Antonio Savoia. 2012. Social norms and tax compliance: Framing the decision to pay tax. Journal of Socio-Economics 41 (2) (04): 159-68, http://search.ebscohost.com/login.aspx?direct=true&db=aph&AN=73285424&site=ehost-live.
d’Agostino, Ralph B. 1998. Tutorial in biostatistics: Propensity score methods for bias reduction in the comparison of a treatment to a non-randomized control group. Stat Med 17 (19): 2265-81.
Dhami, Sanjit, and Ali Al-Nowaihi. 2010. Optimal taxation in the presence of tax evasion: Expected utility versus prospect theory. Journal of Economic Behavior & Organization 75 (2) (08): 313-37, http://search.ebscohost.com/login.aspx?direct=true&db=aph&AN=51941435&site=ehost-live.
Ess, E. A. 2006. Internet taxation without physical representation: States seek solution to stop e-commerce sales tax shortfall. St. Louis LJ 50 : 893-1361.
Feehan, J. R. 2001. Surfing around the sales tax byte: The internet tax freedom act, sales tax jurisdiction and the role of congress. Alb.LJ Sci.& Tech. 12 : 619.
Gordon, M. R. 2010. Up the amazon without a paddle: Examining sales taxes, entity isolation, and the “Affiliate tax”. Ncjl & Tech. 11 : 299, 309.
Heckman, J.J. (1976) The Common Structure of Statistical Models of Truncation, Sample Selection and Limited Dependent Variables and a Simple Estimator for Such Models. Annals of Economic Social Measurement, 5, 4, 475-492.
Heckman, J. J. (1979) Sample Selection Bias as a Specification Error. Econometrica, 47, I, 53-161.
Hoheisel, Rod. “Minnesota Consumption Tax Model and Sales Tax Gap”, Presentation to the Federation of Tax Administrators Revenue Estimating and Tax Research
Conference (September 15, 2008) in Portland, Maine. http://www.taxadmin.org/fta/meet/08rev _est/papers/hoheisel2.pdf

75
Johnson, Cathleen, David Masclet, and Claude Montmarquette. 2008. The effect of perfect monitoring of matched income on sales tax compliance: An experimental investigation. CIRANO-Scientific Publications(2008s-17).
Lipatov, Vilen. 2012. Corporate tax evasion: The case for specialists. Journal of Economic Behavior & Organization 81 (1) (01): 185-206, http://search.ebscohost.com/login.aspx?direct=true&db=aph&AN=70034019&site=ehost-live.
Manzi, Nina. 2004. Use tax collection on income tax returns in other states Research Department, Minnesota House of Representatives.
McDonald, J.F. and Moffitt, R.A. (980). The uses of Tobit analysis. The review of economics and statistics, 62(2):318-321.
Mikesell, J. L. 1992. State sales tax policy in a changing economy: Balancing political and economic logic against revenue needs. Public Budgeting & Finance 12 (1): 83-91.
Mikesell, John. 2000. Remote vendors and American sales and use taxation: The balance between fixing the problem and fixing the tax. National Tax Journal 53 (4).
Minnesota Department of Revenue, 2012. http://www.revenue.state.mn.us/research_stats/research_reports/2012/2012_tax_expenditure_links.pdf
Minnesota Management and Budget Forecast 2012. http://www.mmb.state.mn.us/doc/fu/13/complete-feb13.pdf
Murray, Matthew N. 1995. Sales tax compliance and audit selection. National Tax Journal 48 : 515-30.
Nehill, S. P. 2004. Tax man cometh-an argument for the taxation of online purchases, the. CommLaw Conspectus 13 : 193.
Park, John L and Oral Capps Jr. Demand for Prepared Meals by U.S. Households. Am. J. Agr. Econ. (1997) 79(3): 814-824.
Puhani, Patrick A. 2002. The Heckman Correction for Sample Selection and its Critique. Journal of Economic Surveys, 14: 53-68.
Robicheaux, Robert. 2012. Estimates of Alabama losses due to E-commerce.
Sinha, Praveen. 2010. An econometric analysis of skewed productivity outcomes. Empirical Economics 38 (2): 347-60.

76
Stewart, James B. 2012. Tax me if you can. New Yorker 88 (5) (03/19): 46-53, http://search.ebscohost.com/login.aspx?direct=true&db=aph&AN=73360925&site=ehost-live.
Strauss, Robert P 2012. The Revenue Consequences of Not Collecting Use Taxes for Pennsylvania.
Sununu, J. E. 2002. Taxation of internet commerce, the. Harv.J.on Legis. 39 : 325.
Tullock, G. 1988. Rent seeking and tax reform. Contemporary Economic Policy 6 (4): 37-47. 1988. Rent seeking and tax reform. Contemporary Economic Policy 6 (4): 37-47.
US Census Bureau. 2004. American factfinder.
Vihanto, Martti. 2003. Tax evasion and the psychology of the social contract. Journal of Socio-Economics 32 (2) (05): 111, http://search.ebscohost.com/login.aspx?direct=true&db=aph&AN=9500291&site=ehost-live.
Wooldridge, J. (2009). Introductory Economics A Modern Approach, 4e. South- Western Cengage Learning. Wu, Roung-Shiunn, C. S. Ou, Hui-ying Lin, She-I Chang, and David C. Yen. 2012.
Using data mining technique to enhance tax evasion detection performance. Expert Systems with Applications 39 (10) (08): 8769-77, http://search.ebscohost.com/login.aspx?direct=true&db=aph&AN=73966158&site=ehost-live.