an ever less carbonated union? - foes.de
TRANSCRIPT

www.notre-europe.eu e-mail : [email protected]
Studies &
74Research
An ever less carbonated Union?Towards a better European taxation against
climate change
Eloi LAURENT and Jacques LE CACHEUXAn ever less carbonated Union?Towards a better European taxation against climate change
As Europe prepares to put sustainable development at the centre of its
growth strategy for the coming decade, it seems opportune to examine
the effectiveness of European action against climate change. The Euro-
pean Union has become the undisputed world leader on the issue, it is
true. But the Union’s environmental strategy still lacks coherence and
even credibility. The powerful economic instruments created by the EU
need to be reformed and completed if carbon is to be taxed more effec-
tively.
This study proposes just such a reform of Europe’s carbon taxation,
concerning both the emission permits market and Europe’s various car-
bon tax regimes. The authors survey the unhealthy trend of carbon emis-
sions in the EU and look closely at the instruments available to fight
climate change: emission permits market, regulation, and environmental
tax. It emerges that these tools, in their current form, are poorly suited to
the declared aims of the EU. On the basis of this observation, four scena-
rios for a new European carbon taxation are sketched out, each corres-
ponding to a different degree of political ambition.
Professor of Economics (CATT-Université de Pau et des Pays de l’Adour), Director of the Economics Research Department of OFCE. (Science Po Center for Economic Research).
Senior economist and scientific advisor at OFCE (Sciences-Po Center for econo-mic research) and a visiting scholar at Harvard Center for European Studies (CES).
Eloi LAURENT Jacques LE CACHEUX
competition, cooperation, solidarity

AN EVER LESS CARBONATED UNION?
TOWARDS A BETTER EUROPEAN TAXATION
AGAINST CLIMATE CHANGE
BY ELOI LAURENT AND JACQUES LE CACHEUX
74Studies &
Research

Notre Europe
Notre Europe is an independent think tank devoted to European integration. Under
the guidance of Jacques Delors, who created Notre Europe in 1996, the association
aims to “think a united Europe.”
Our ambition is to contribute to the current public debate by producing analyses
and pertinent policy proposals that strive for a closer union of the peoples of
Europe. We are equally devoted to promoting the active engagement of citizens
and civil society in the process of community construction and the creation of a
European public space.
In this vein, the staff of Notre Europe directs research projects; produces and
disseminates analyses in the form of short notes, studies, and articles; and organises
public debates and seminars. Its analyses and proposals are concentrated around
four themes:
• Visions of Europe: The community method, the enlargement and deepening of
the EU and the European project as a whole are a work in constant progress. Notre
Europe provides in-depth analysis and proposals that help find a path through the
multitude of Europe’s possible futures.
• European Democracy in Action: Democracy is an everyday priority. Notre Europe
believes that European integration is a matter for every citizen, actor of civil society
AN EVER LESS CARBONATED UNION? AN EVER LESS CARBONATED UNION?
ELOI LAURENT
Eloi Laurent is a senior economist and
scientific advisor at OFCE (Sciences-Po
Center for economic research) and a visiting
scholar at Harvard Center for European
Studies (CES). A former aide in the French
Parliament and for the French prime minister,
he has been a visiting scholar at NYU,
Columbia University, and at Harvard CES.
He teaches in the Master of public affairs
at Sciences-Po, in Stanford University, and
La Sorbonne. His most recent books are
«La Nouvelle Ecologie Politique» (with J-P.
Fitoussi, 2008) and «Report on the State of
the European Union-EU Governance in Crisis»
(forthcoming 2009). Dr. Laurent holds a
PhD in economics from Sciences Po (summa
cum laude) and a master’s degree from the
University Paris-Dauphine and graduated
summa cum laude from Sciences Po.
Jacques LE CACHEUX
Studied economics and political
science in Paris and has the Diploma of
the IEPP (Sciences Po) and the Maîtrise
d’économie of the University of Paris
I-Panthéon-Sorbonne. Took his Ph.D in
economics at the European University
Institute (Florence, Italy). Has been a
member of the INGENUE Team since the
launching of the project, in 1999. Has
been a member of various European
research projects and networks
financed by the EC Commission
(EUROMOD, MOCHO, EUROCAP,
CONNEX, CONSENT).
Jacques Le Cacheux is Professor of
Economics at the Université de Pau et
des Pays de l’Adour and Director of the
Economic Research Department of the
OFCE (Sciences Po Center for Economic
Research).
AN EVER LESS CARBONATED UNION?
74and level of authority within the Union. Notre Europe therefore seeks to identify and
promote ways of further democratising European governance.
• Cooperation, Competition, Solidarity: « Competition that stimulates, co-operation
that strengthens, and solidarity that unites ». This, in essence, is the European
contract as defined by Jacques Delors. True to this approach, Notre Europe explores
and promotes innovative solutions in the fields of economic, social and sustainable
development policy.
• Europe and World Governance: As an original model of governance in an increasingly
open world, the European Union has a role to play on the international scene and in
matters of world governance. Notre Europe seeks to help define this role.
Notre Europe aims for complete freedom of thought and works in the spirit of the public
good. It is for this reason that all of Notre Europe’s publications are available for free from
our website, in both French and English: www.notre-europe.eu. Its Presidents have been
successively, Jacques Delors (1996-2004), Pascal Lamy (2004-05), and Tommaso Padoa-
Schioppa (since November 2005).
AN EVER LESS CARBONATED UNION?
7474Studies &StudiesStudiesStudiesStudies &Studies & & & & &
747474ResearchResearchResearchResearchResearchResearchResearchResearchResearchResearch
Table of Contents
Introduction: 20 years later P. 1
I - The past and the future of an ambition P. 5
II - The state of GHG emissions in the European Union P. 11
III - The state of Europe’s strategy against climate change P. 17
3.1 The European carbon market P. 17
3.2 The regulatory policy P. 24
3.3 Environmental taxation P. 25
IV - The economics of carbon taxes P. 31
4.1 The theory P. 31
4.2 Advantages and disadvantages of different instruments of
intervention P. 33
4.3 In practice P. 37
V - Scenarios for a new European tax on carbon P. 47
5.1 Four scenarios P. 47
5.2 Use of revenues P. 53
VI - Considerations of political economy P. 57
6.1 The international political economy of carbon P. 57
6.2 The political economy of European energy P. 58
6.3 The political economy of European public opinion P. 63
Conclusion: debate is fine, but it is time to decide P. 67
References P. 69
AN EVER LESS CARBONATED UNION?
Studies &
74ResearchResearch
AN EVER LESS CARBONATED UNION? - 1
Introduction: 20 years later
« With the completion of the Internal Market, the European Community will be
the biggest economic/trading partner in the world with the potential to exercise
an important level of moral, economic and political influence and authority. As
such the Community owes it to both present and future generations to put its
own house in order and to provide both leadership and example to developed
and developing countries alike in relation to protection of the environment and
the sustainable use of natural resources ».
A Community Strategy to limit Carbon Dioxide emissions and to improve energy
efficiency, European Commission, 1991.
Nearly two decades have passed since the first meeting, in autumn 1990, of envi-
ronment and energy ministers where the subject was the stabilisation of carbon
dioxide emission in the European Community. Barely two years after the creation
of the IPCC (Intergovernmental Panel on Climate Change), Europe was gaining a
major head-start on the crucial question of climate change. Only a year later, on

2 - AN EVER LESS CARBONATED UNION? AN EVER LESS CARBONATED UNION? - 3
Studies &
74ResearchResearch
14 October 1991, the European Commission proposed creating an economic ins-
trument which might revolutionise European tax systems and induce a lasting
reduction in the carbon intensity of both production and consumption. This was
the European carbon tax.
Since then nearly 20 years have been lost, and this project is today more necessary
than ever. The European Union has become the incontestable leader in the world’s
fight against climate change, the only power able to push global negotiations
towards reasonable solutions. But Europe’s environmental strategy still lacks
cohesiveness and even credibility. The powerful economic instruments at the EU’s
disposal deserve to be made more coherent in order to bolster Europe’s compara-
tive ecological advantage.
This study will propose a reform of Europe’s tax regime for carbon – a reform both
of the European carbon permits market and of the individual carbon tax regimes –
in order to establish a “European carbon price” as close as possible to the scienti-
fic consensus.1 In choosing this new ambition, the EU would be working in its own
interest in three ways: in its geopolitical interest, assuming its historical responsi-
bility for climate change in the eyes of the emerging and developing world, and
guaranteeing its energy independence; in its economic interest, strengthening its
position as the least carbon-intensive developed economy in a world where “green
growth” will dominate the future; and in its democratic interest, helping to mitigate
the risk of extreme climatic events, which will be a critical danger to the Union’s
most vulnerable citizens. It would also be working, in an even more fundamental
sense, to open new horizons, with a new ideal which might help strengthen the
bonds – somewhat enfeebled – between member states.
The Union would also be revisiting its origins, since energy policy was a foundation
of political unity in Europe. The ECSC was an institutional laboratory for the future
Rome treaties; its aim was to place in common the raw materials of war in order to
make such war impossible. Today Europeans need to control their economic deve-
lopment to prevent its exhaustion, and to relaunch sustainable growth in living
standards. The development of coal production was at the heart of the ECSC; the
1 On this idea, see box 1
reduction of carbon consumption must now mobilise the European Union. This
study proposes to place carbon-tax reform at the heart of this ambition.
A clarification is in order. In the pages that follow we will not examine the validity of
European climate-change objectives (cf. infra). What concerns us here is the degree
to which objectives fit instruments in the EU as, too often, there is a damaging gap
between them.

4 - AN EVER LESS CARBONATED UNION? AN EVER LESS CARBONATED UNION? - 5
Studies &
74ResearchResearch
I - The past and the future of an ambition
How are we to understand that the European Community came so close to creating
a European tax on carbon in 1991 and that so little progress has been made since
then to take the step? It is firstly necessary to understand the genealogy of what
might be called the European carbon policy, before making our analysis of the
policy and formulating proposals to reform it.
As already mentioned, the story begins in 1991 with the European Commission’s
communication, “A community strategy to limit the emissions of carbon dioxide
and improve energy efficiency”. The proposal, whose details we will return to,
aimed to institute a hybrid community tax on energy and carbon (in equal measure).
The project was clarified by a communication of 30 June 1992 and submitted for
the consideration and approval of member states. It was initially rejected due to
opposition by the United Kingdom, which was not prepared at any cost to see the
Community get involved in national tax affairs2. It was rejected a second time in
1994 when the Commission proposed an amended version of the plan allowing
member states to determine their energy taxation together or separately, but with
2 In 1993 the Clinton administration also envisaged a tax on energy, and was obliged to abandon the plan under the pressure of energy and industrial lobbies.

6 - AN EVER LESS CARBONATED UNION? AN EVER LESS CARBONATED UNION? - 7
Studies &
74ResearchResearch
guidelines and common target values. A major difference with the two first projects
was the fact that this taxation was no longer conditional on equivalent efforts from
other OECD countries. The proposal also included the possibility of compensating
for the tax’s impact on competitiveness in energy-intensive sectors (the notion of
“carbon leakage” appeared around this time in European vocabulary).
The Commission’s plan was rejected a third time in 19973, even though the new
version proposed no more than coordination of energy tax regimes, using existing
dispositions for mineral oils (Directive on mineral oils 92/82/EEC), rather than
harmonisation of national measures (the plan mentioned the obligatory “flexibi-
lity” accorded to member states, a priority which needed to be compatible with
“common rules”). The directive included the following clauses:
Article 4
1. The levels of taxation which Member States shall apply to the energy
products listed in Article 2 may not be less than the minimum levels prescri-
bed in this Directive.
Article 5
1. Member States may apply differentiated rates of taxation according to
the use or quality of a product provided that they respect the minimum
levels of taxation set out in this Directive and that they are compatible with
Community law.
It was not until twelve years after the first text that a decidedly pale directive on
energy taxation was adopted in 2003. It is true that this directive widened the range
of energy products concerned by community law (to natural gas, coal and elec-
tricity), but it only proposed differentiated minimum tax rates on these products,
rather than the integrated taxation envisaged at the beginning of the 1990s. At
the end of this process, then, the only imperative that member states must follow
in the area of energy taxation is the following: establish minimum rates for the
products covered by the 2003 directive.
3 Proposal for a Council Directive restructuring the Community framework for the taxation of energy products COM/97/0030 final (97/C 139/07) COM(97) 30 final - 97/0111(CNS) http://eur-lex.europa.eu/LexUriServ/LexUriServ.do?uri=CELEX:51997PC0030:EN:HTML
And yet, in parallel to the first European efforts, four Nordic countries – of whom
only one was a member of the EU – were able to put in place a tax on carbon:
Finland and Sweden in 1990, Norway in 1991 and Denmark in 19924. A second
wave of green energy taxation would follow these first measures in the mid to
late 1990s, in the Netherlands (1996), Slovenia (1997), Germany (1998) and the
United Kingdom (2000).
Given these repeated failures and despite these national policies, Europe’s strategy
for fighting climate change has resolutely taken the path of a “Coasian solution”
to its emissions of greenhouse gases (GHGs) (see box 1). As centrepiece of this
strategy, the EU emission permits market was created in January 2005, in applica-
tion of the Kyoto Protocol (cf. infra). Renouncing the idea of a common regional tax
regime, Europeans have thus ended up adopting an economic instrument to which
they were initially opposed during international negotiations and which the United
States managed to impose as the central mechanism of the Kyoto Protocol.
This solution might appear to be the only practical one, allowing the problem
of unanimity in tax matters to be avoided. But such a strategy does not lack an
economic basis. Emission permits markets theoretically guarantee that a given
level of emissions will not be exceeded, in such as way that they are well calibra-
ted to become instruments of simulation models which function by thresholds (of
temperature, of concentration and of emissions). In addition, these markets are
particularly suited to centralised pollution patterns resulting from a small number
of controllable actors. Lastly, in terms of political economy the markets are better
accepted by business than a new tax.
Twenty years later, the legal and institutional problem which led the European
authorities to abandon a common ecological tax remains, even if new means exist
to surmount it (cf. infra). However, the economic logic behind the exclusive use
of emissions markets is today contested on four fronts: the types of pollution of
most concern – because most dynamic – are diffuse and therefore not covered by
the European carbon market; the market itself shows worrying signs of weakness
4 It is certainly possible to speak of a “Nordic model” of environmental tax reform (we will return to this in detail in the third part of the study with the Swedish experience). Its main characteristics are, firstly, to form part of a general reform of compulsory taxes, and, secondly, to be carried out by means of public involvement aiming at social consensus. On the question of the growth and governance strategy of “Nordic model” countries and in particular on the case of Swe-den, see for example Grejbine and Laurent (2008).
8 - AN EVER LESS CARBONATED UNION? AN EVER LESS CARBONATED UNION? - 9
Studies &
74ResearchResearch
and seems not at all to be reducing uncertainty; the problems associated with
“carbon compensation” in particular are reducing the market’s ecological efficien-
cy, already affected by the quasi-competitive derogations obtained by member
states; and the concessions made to business seem too large, posing the question
of “ecological equity”.
The European Commission itself (European Commission, 2007) seems ready
to rethink the effectiveness of Europe’s economic instruments against climate
change, including the tax tools. What is more, the Swedish presidency of the EU
(July-December 2009) was quick to highlight its wish to advance the debate on
European environmental taxation, and even explicitly evoked a “European carbon
tax”.
The position taken by this study is fully inscribed into the current European debate.
We do not aim for a gradual but total replacement of emissions markets by tax ins-
truments, which have their own flaws and gaps (see below). It is more important
both to “taxify” these markets to better assure their ecological effectiveness and
to complement them by tax instruments – which can be put in place according to
different scenarios. A European carbon tax system improved in this way – because
integrated and coherent – is the solution that is capable of reducing the carbon
intensities of our economies. Before imagining the practical details of this new
system, we first need to examine the current state of European emissions, in order
to understand why new instruments are needed.
BOX 1: SOCIAL OBJECTIVE AND ECONOMIC INSTRUMENTS IN THE FIGHT AGAINST CLIMATE CHANGE
FINANCIAL ANALYSIS OF ENVIRONMENTAL QUESTIONS IS BASED ON THE SIMPLE IDEA THAT THE PRICE SYSTEM UNDERVALUES THE UTILISATION OF NATURAL RESOURCES. IN ACTUAL FACT, THE SOCIAL COST OF THE CONSUMPTION OF THESE RESOURCES IS OFTEN SUPERIOR TO THE PRIVATE COST. IN THEORY THERE ARE THREE POSSIBLE CAUSES OF THIS UNDERVALUATION: POORLY DEFINED PROPERTY RIGHTS, POORLY UNDERSTOOD EXTERNALITIES, AND POORLY TARGETED PUBLIC SUBSIDIES. IT IS THEREFORE A QUESTION OF KNOWING HOW TO RECREATE THE “ECOLOGICAL TRUTH” OF PRICES WHERE THE GOODS DEPEND DIRECTLY OR INDIRECTLY ON THE USE OF NATURAL RESOURCES. IN THE CASE OF CLIMATE CHANGE, HOW CAN THE PRICE SYSTEM BE OBLIGED TO REFLECT THE SOCIAL COST OF THE INTENSIVE USE OF CARBON IN TODAY’S SOCIETY? THIS QUESTION RELATES TO TWO DIMENSIONS OF PUBLIC POLICY: THE ECOLOGICAL OBJECTIVE (THE “SOCIAL” PRICE WHICH MUST REFLECT THE “SOCIAL” COST OF CARBON AND BE DETERMINED BY THE PUBLIC AUTHORITY); AND THE INSTRUMENTS USED TO ACHIEVE THIS OBJECTIVE (REGULATION, EMISSION PERMITS MARKET OR ENVIRONMENTAL TAX).
THE NOTION OF A SOCIAL PRICE OF CARBON RESTS ON TWO IMPERATIVES. THE FIRST IS TO TAKE INTO ACCOUNT THE NEGATIVE EXTERNALITIES ATTACHED TO THE USE OF CARBON IN THE ECONOMY – EXTERNALITIES WHICH NEED TO BE “REPATRIATED” WITHIN THE PRICE SYSTEM, WHICH IMPLIES CALCULATING THEIR COST AND THEREBY, FOR EXAMPLE, FLEXIBLY ASSESSING CLIMATE CHANGE’S DAMAGE TO THE COMMUNITY. THE SECOND “SOCIAL” DIMENSION OF THE CARBON PRICE IS RELATED TO THE EFFECT OF THIS PRICE ON CONSUMERS AND PRODUCERS IN THE PRESENT AND FUTURE. THE CARBON PRICE IS THUS A “SIGNAL” SENT TO SOCIETY TO BRING IT TO REALISE THE REAL COST OF ITS ECONOMIC PRACTICES. DETERMINING EMPIRICALLY THE SOCIAL PRICE OF CARBON IS THEREFORE PARTICULARLY COMPLEX, AND IN PRACTICE DEPENDS ON DIFFERENT METHODS (SOCIAL COST, AGGREGATE OR MARGINAL; DAMAGE; COST OF EMISSIONS ALLOWANCE), ON A MULTITUDE OF PROJECTIONS (INCLUDING THAT OF FOSSIL ENERGY PRICES) AND ON CERTAIN CRITICAL CRITERIA – OF WHICH THE FIRST IS THE ENVIRONMENTAL OBJECTIVE SOUGHT (FOR EXAMPLE, A GIVEN MAXIMUM CONCENTRATION OF GREENHOUSE GAS IN THE ATMOSPHERE) AND THE RATE OF CONVERSION TO CURRENT VALUES (DEPENDENT IN PARTICULAR ON THE DEGREE OF INTERGENERATIONAL EQUITY, A NORMATIVE CHOICE FALLING TO THE CURRENT RESIDENTS OF THE PLANET).
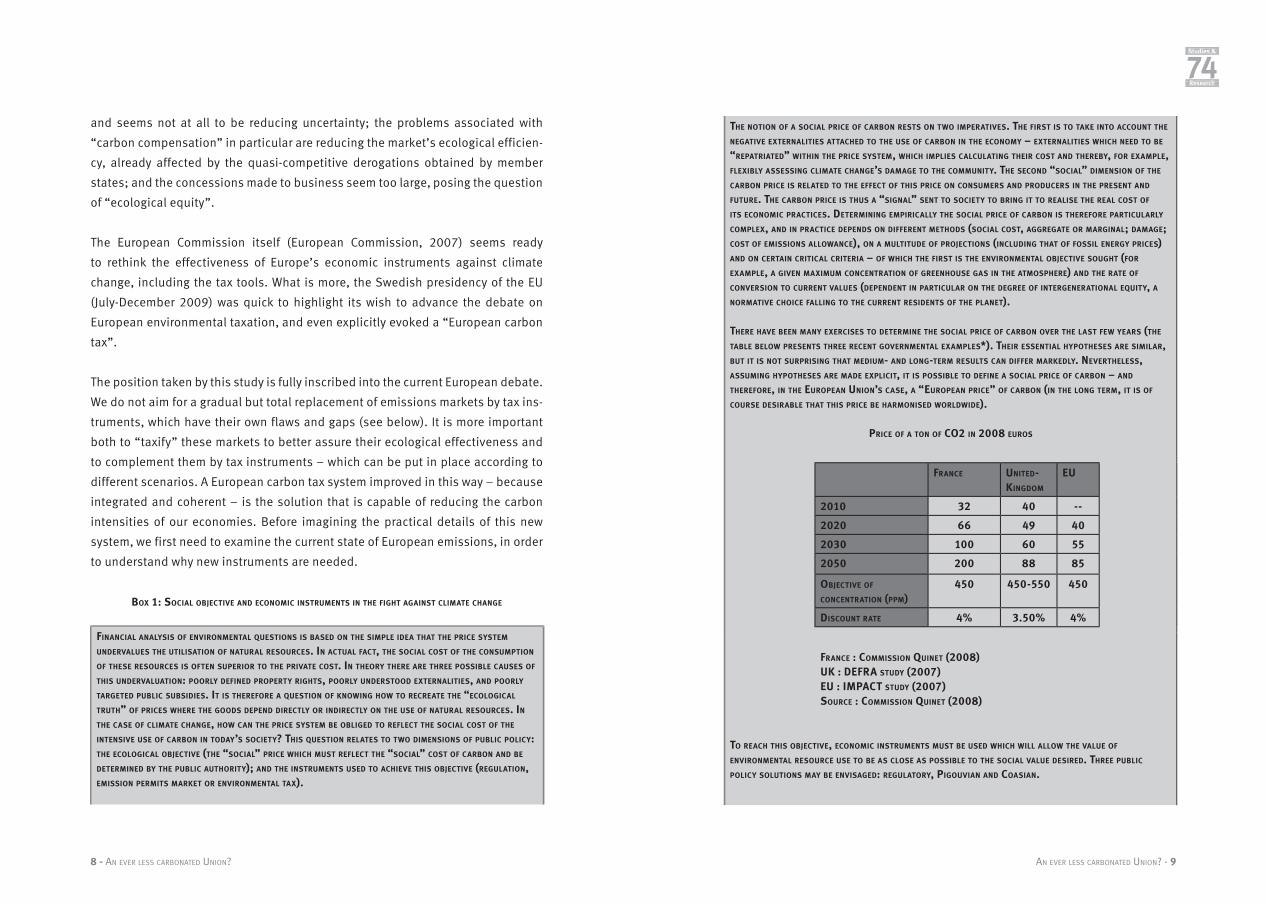
THERE HAVE BEEN MANY EXERCISES TO DETERMINE THE SOCIAL PRICE OF CARBON OVER THE LAST FEW YEARS (THE TABLE BELOW PRESENTS THREE RECENT GOVERNMENTAL EXAMPLES*). THEIR ESSENTIAL HYPOTHESES ARE SIMILAR, BUT IT IS NOT SURPRISING THAT MEDIUM- AND LONG-TERM RESULTS CAN DIFFER MARKEDLY. NEVERTHELESS, ASSUMING HYPOTHESES ARE MADE EXPLICIT, IT IS POSSIBLE TO DEFINE A SOCIAL PRICE OF CARBON – AND THEREFORE, IN THE EUROPEAN UNION’S CASE, A “EUROPEAN PRICE” OF CARBON (IN THE LONG TERM, IT IS OF COURSE DESIRABLE THAT THIS PRICE BE HARMONISED WORLDWIDE).
PRICE OF A TON OF CO2 IN 2008 EUROS
FRANCE UNITED-KINGDOM
EU
2010 32 40 --
2020 66 49 40
2030 100 60 55
2050 200 88 85
OBJECTIVE OF CONCENTRATION (PPM)
450 450-550 450
DISCOUNT RATE 4% 3.50% 4%
FRANCE : COM M ISSION QUINET (2008)UK : DEFRA STUDY (2007)EU : IMPACT STUDY (2007)SOURCE : COMMISSION QUINET (2008)
TO REACH THIS OBJECTIVE, ECONOMIC INSTRUMENTS MUST BE USED WHICH WILL ALLOW THE VALUE OF ENVIRONMENTAL RESOURCE USE TO BE AS CLOSE AS POSSIBLE TO THE SOCIAL VALUE DESIRED. THREE PUBLIC POLICY SOLUTIONS MAY BE ENVISAGED: REGULATORY, PIGOUVIAN AND COASIAN.
10 - AN EVER LESS CARBONATED UNION? AN EVER LESS CARBONATED UNION? - 11
Studies &
74ResearchResearch
THE REGULATORY SOLUTION, OR REGULATION POLICY (“COMMAND AND CONTROL”), CONSISTS OF IMPOSING ON PRODUCERS AND CONSUMERS COMPULSORY STANDARDS WHICH RESPECT ENVIRONMENTAL OBJECTIVES AS DEFINED BY THE PUBLIC AUTHORITY. THE “COASIAN SOLUTION” (INSPIRED BY AN ARTICLE BY RONALD COASE, 1960) RESTS ON THE IDEA THAT ONCE PROPERTY RIGHTS ARE CORRECTLY DEFINED AND DISTRIBUTED, THE MARKET CAN EFFICIENTLY REDUCE ENVIRONMENTAL EVILS SUCH AS GREENHOUSE GAS POLLUTION. THE ROLE OF THE STATE IS TO CREATE A “MARKET FOR RIGHTS TO POLLUTE”, WHOSE “CAP” IT DEFINES AND WHOSE FREE FUNCTIONING WILL RESULT IN A “TRADE” OF PERMITS BETWEEN COMPANIES – IN TURN DETERMINING THE SOCIAL PRICE OF CARBON. THE “PIGOUVIAN SOLUTION” (POSITED BY ARTHUR CECIL PIGOU, 1920) AIMS TO USE TAX TO MODIFY RELATIVE PRICES AND THEREBY INCITE ACTORS TO BETTER INTEGRATE ENVIRONMENTAL PRESERVATION INTO THEIR PLANS FOR CONSUMPTION AND PRODUCTION. THIS IMPLIES THE CREATION OF ENVIRONMENTAL “ECO-TAXES” WHICH, IN THE CASE OF CLIMATE CHANGE, TAKE THE FORM OF A CARBON TAX.
* FOR A WIDER SELECTION OF THE RESEARCH ON THIS SUBJECT, SEE IN PARTICULAR TOL (2002A ET 2002B), WHICH ALSO NOTES LARGE GAPS BETWEEN THE RECOMMENDED VALUES IN DIFFERENT STUDIES EXAMINED.
II - The state of GHG emissions in the European Union
The last full inventory of greenhouse gas emissions by signatories of Annex I of the
Kyoto Protocol leaves no doubt as to the European Union’s position as leader in the
fight against climate change. The 15 EU countries committed themselves to reducing
their emissions by 8% against the 1990 level by 2012; the reduction was 4.3% between
1990 and 2007. In the same period, the 27 EU countries together reduced emissions
by 9.4%. It is a better showing than Japan (+8.2% for a target of -6%), the United States
(+16,8% for a target of -7%), Canada (+26.2% instead of -6%) or Australia (+30%
instead of +8%). The EU-US comparison is particularly striking: provisional figures
show that American emissions grew by 1.4% between 2006 and 2007 while the EU 15
recorded a reduction of 1.5%. This indicates that the transatlantic gap since 1990 is
now passing 20 percentage points. The EU 15 emits 40% less greenhouse gas that the
United States, with a GDP 10% higher and a population 20% higher.
By the same token, detailed comparison of the change in emissions since 1990, both
by inhabitant and by wealth level (carbon intensity of growth) confirms the ecologi-
cal lead of the EU-15 states over other developed countries5.
5 See for example the data gathered in the 2007-08 edition of the United Nations Human Development Report, avai-lable at http://hdr.undp.org/en/reports/global/hdr2007-2008/
12 - AN EVER LESS CARBONATED UNION? AN EVER LESS CARBONATED UNION? - 13
Studies &
74ResearchResearch
The European strategy of sustainable growth, reflected by the course of sustai-
nable development chosen at the European Council of spring 2007 and confirmed
by the adoption of the “climate and energy package” in December 2008, is both
compatible with the scientific consensus and realistic. If the EU 15 achieves its
Kyoto target on time and then follows the calendar planned, it will almost meet the
developed-country targets of the International Panel on Climate Change (IPCC) for
2020 (of which the lowest variant aims for a reduction of 30% since 1990). With
redoubled effort, it may then achieve the IPCC’s target for 2050.
The EU is thus able to play a pivotal world role, since it is formed of developed
countries which are also low-carbon economies. These countries share the same
environmental concern and can make use of common institutions and a longstan-
ding culture of cooperation backed up by powerful economic instruments.
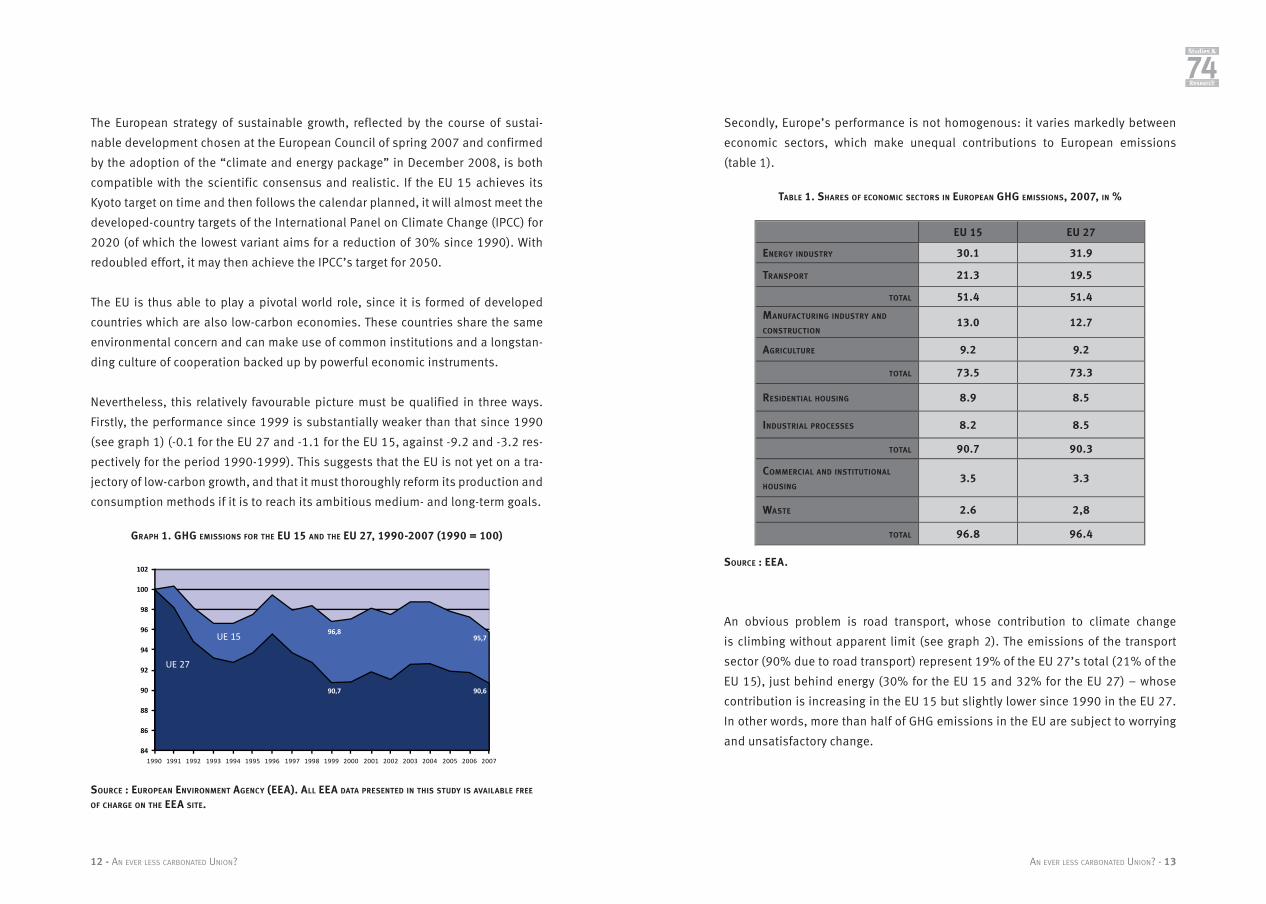
Nevertheless, this relatively favourable picture must be qualified in three ways.
Firstly, the performance since 1999 is substantially weaker than that since 1990
(see graph 1) (-0.1 for the EU 27 and -1.1 for the EU 15, against -9.2 and -3.2 res-
pectively for the period 1990-1999). This suggests that the EU is not yet on a tra-
jectory of low-carbon growth, and that it must thoroughly reform its production and
consumption methods if it is to reach its ambitious medium- and long-term goals.
GRAPH 1. GHG EMISSIONS FOR THE EU 15 AND THE EU 27, 1990-2007 (1990 = 100)
84
86
88
90
92
94
96
98
100
102
1990 1991 1992 1993 1994 1995 1996 1997 1998 1999 2000 2001 2002 2003 2004 2005 2006 2007
90,7
96,8
90,6
95,7
UE 27
UE 15
SOURCE : EUROPEAN ENVIRONMENT AGENCY (EEA). ALL EEA DATA PRESENTED IN THIS STUDY IS AVAILABLE FREE OF CHARGE ON THE EEA SITE.
Secondly, Europe’s performance is not homogenous: it varies markedly between
economic sectors, which make unequal contributions to European emissions
(table 1).
TABLE 1. SHARES OF ECONOMIC SECTORS IN EUROPEAN GHG EMISSIONS, 2007, IN %
EU 15 EU 27
ENERGY INDUSTRY 30.1 31.9
TRANSPORT 21.3 19.5
TOTAL 51.4 51.4
MANUFACTURING INDUSTRY AND CONSTRUCTION
13.0 12.7
AGRICULTURE 9.2 9.2
TOTAL 73.5 73.3
RESIDENTIAL HOUSING 8.9 8.5
INDUSTRIAL PROCESSES 8.2 8.5
TOTAL 90.7 90.3
COMMERCIAL AND INSTITUTIONAL HOUSING
3.5 3.3
WASTE 2.6 2,8
TOTAL 96.8 96.4
SOURCE : EEA.
An obvious problem is road transport, whose contribution to climate change
is climbing without apparent limit (see graph 2). The emissions of the transport
sector (90% due to road transport) represent 19% of the EU 27’s total (21% of the
EU 15), just behind energy (30% for the EU 15 and 32% for the EU 27) – whose
contribution is increasing in the EU 15 but slightly lower since 1990 in the EU 27.
In other words, more than half of GHG emissions in the EU are subject to worrying
and unsatisfactory change.

14 - AN EVER LESS CARBONATED UNION? AN EVER LESS CARBONATED UNION? - 15
Studies &
74ResearchResearch
GRAPH 2. GHG EMISSIONS BY SECTOR, CHANGE BETWEEN 1990 AND 2007, IN %
SO URCE : EEA.
Lastly, member states are not progressing at the same rate towards their Kyoto
objectives. This indicates a lack of cohesion in Europe’s environmental strategy –
whose success depends precisely on its overall coherence. It is not just a matter
of performance – which in itself is not a problem because the EU benefits from a
group agreement allowing it to apportion targets between members of the EU 15.
The problem is the distance between performances and objective. This suggests
that certain member states compensate others, because the overall performance
is good.
This implicit solidarity must be made explicit. A shared profile is in fact emerging,
but it concerns just the new member states which are not involved in the group
agreement.
Energy Industries
Waste
Manufacturing Industries and Construction
Residential housing
Commercial/Institutional housing
Agriculture
Industrial Processes
Transports
Road transportation
-40 -30 -20 -10 0 10 20 30
EU 15 EU 27
GRAPH 3. NATIONAL GHG EMISSIONS PERFORMANCE AND KYOTO TARGET*
Portugal
Belgium
Denmark
France
Germany
Greece
Ireland
Italy
Netherlands
Sweden
Luxembourg
UK
EU 15Czech Rep.
Hungary
Lithuania
Slovakia
Spain
FinlandAustria
EstoniaBulgaria
LatviaRomania
Poland
Slovenia
-60
-40
-20
0
20
40
60
GHG emissions, 1990-2007 Kyoto target
* CYPRUS AND MALTA DID NOT RATIFY THE KYOTO PROTOCOL.SOURCE : EEA.
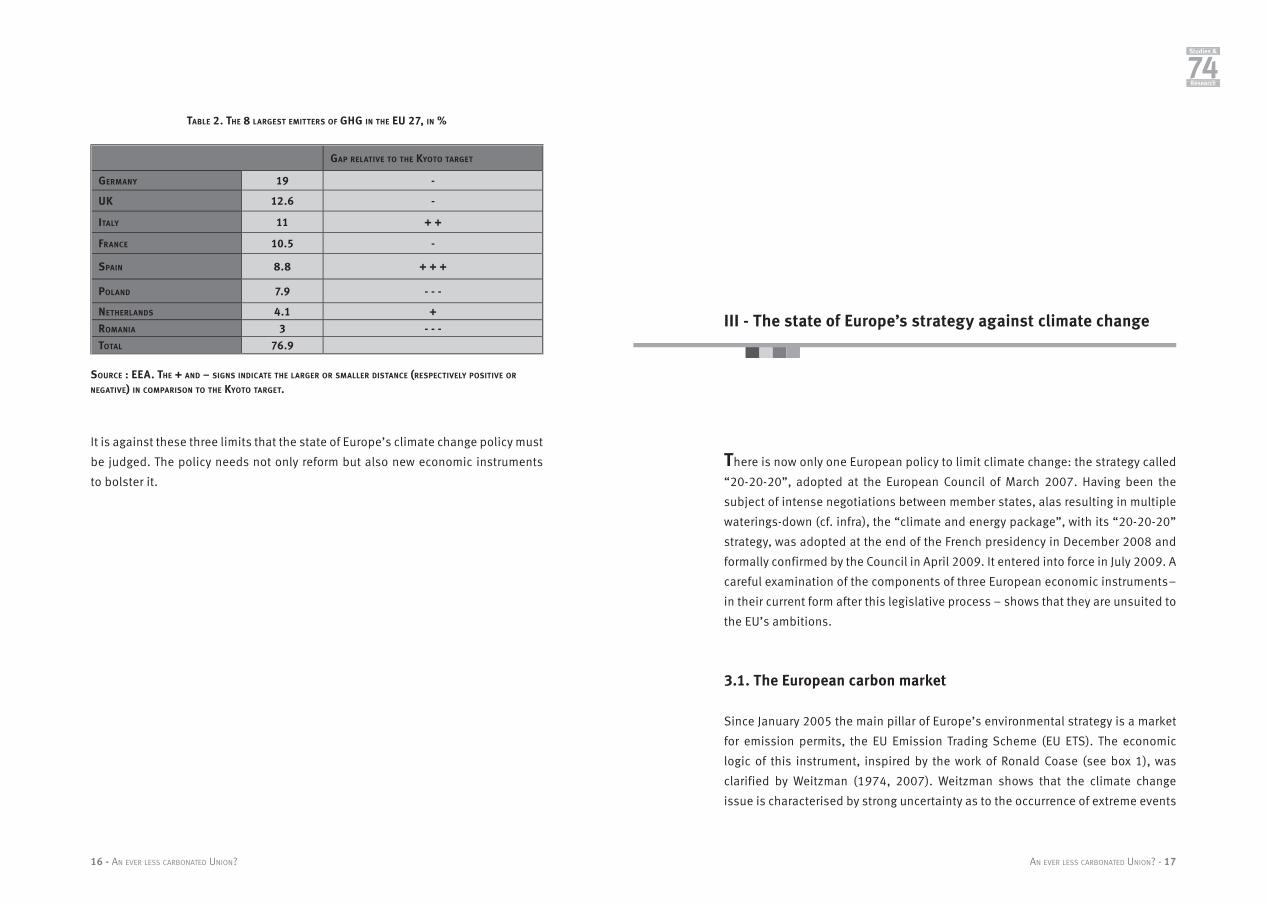
This divergence is a problem even when we consider the fact that EU GHG emissions
are concentrated in a small number of countries (just as at the international level):
eight countries of the EU 27 account for 77% of total emissions. But the perfor-
mances of these countries diverge (table 2).
16 - AN EVER LESS CARBONATED UNION? AN EVER LESS CARBONATED UNION? - 17
Studies &
74ResearchResearch
TABLE 2. THE 8 LARGEST EMITTERS OF GHG IN THE EU 27, IN %
GAP RELATIVE TO THE KYOTO TARGET
GERMANY 19 -
UK 12.6 -
ITALY 11 + +
FRANCE 10.5 -
SPAIN 8.8 + + +
POLAND 7.9 - - -
NETHERLANDS 4.1 +
ROMANIA 3 - - -
TOTAL 76.9
SOURCE : EEA. THE + AND – SIGNS INDICATE THE LARGER OR SMALLER DISTANCE (RESPECTIVELY POSITIVE OR NEGATIVE) IN COMPARISON TO THE KYOTO TARGET.
It is against these three limits that the state of Europe’s climate change policy must
be judged. The policy needs not only reform but also new economic instruments
to bolster it.
III - The state of Europe’s strategy against climate change
There is now only one European policy to limit climate change: the strategy called
“20-20-20”, adopted at the European Council of March 2007. Having been the
subject of intense negotiations between member states, alas resulting in multiple
waterings-down (cf. infra), the “climate and energy package”, with its “20-20-20”
strategy, was adopted at the end of the French presidency in December 2008 and
formally confirmed by the Council in April 2009. It entered into force in July 2009. A
careful examination of the components of three European economic instruments –
in their current form after this legislative process – shows that they are unsuited to
the EU’s ambitions.
3.1. The European carbon market
Since January 2005 the main pillar of Europe’s environmental strategy is a market
for emission permits, the EU Emission Trading Scheme (EU ETS). The economic
logic of this instrument, inspired by the work of Ronald Coase (see box 1), was
clarified by Weitzman (1974, 2007). Weitzman shows that the climate change
issue is characterised by strong uncertainty as to the occurrence of extreme events
18 - AN EVER LESS CARBONATED UNION? AN EVER LESS CARBONATED UNION? - 19
Studies &
74ResearchResearch
whose effects could be especially damaging. In this context, restricting quanti-
ties – by establishing an emissions ceiling which is reduced over time – appears
in theory to be a better option than acting on prices whose sensitivity is uncertain.
The growing importance of the European carbon market is impressive. With 3.09
billion tons exchanged in 2008, it represents 64% of the world carbon market and
94% of allocation markets6 (table 3). From 2007 to 2008, its development was also
spectacular (+66%).
TABLE 3. THE EUROPEAN SYSTEM FOR EXCHANGING EMISSION QUOTAS IN INTERNATIONAL COMPARISON.
2007 2008
VOLUME (MTCO2E)
VALUE
(MUS$)VOLUME
(MTCO2E)VALUE
(MUS$)
ETS (EU) 2 060 49 065 3 093 91 910
NEW SOUTH WALES (ETATS-UNIS) 25 224 31 183
CHICAGO CLIM. EXC. (ETATS-UNIS) 23 72 69 309
RGGI (ETATS-UNIS) NA NA 65 246
TOTAL ALLOCATIONS MARKETS 2 108 49 361 3 276 92 859
TOTAL CARBON MARKETS
(INLCUDING KYOTO MECHANISMS) 2 984 63 007 4 811 126 345
SOURCE : WORLD BANK, STATE AND TRENDS OF THE CARBON MARKET 2009.
In practice, however, the functioning of the European carbon market since its
creation suggests that there is a need to revise any ex ante optimism. The EU ETS
suffers from three serious functional problems which together cloud the price
signals that it is meant to send to producers and the economy in general – and
without ensuring that the emissions ceiling is respected.
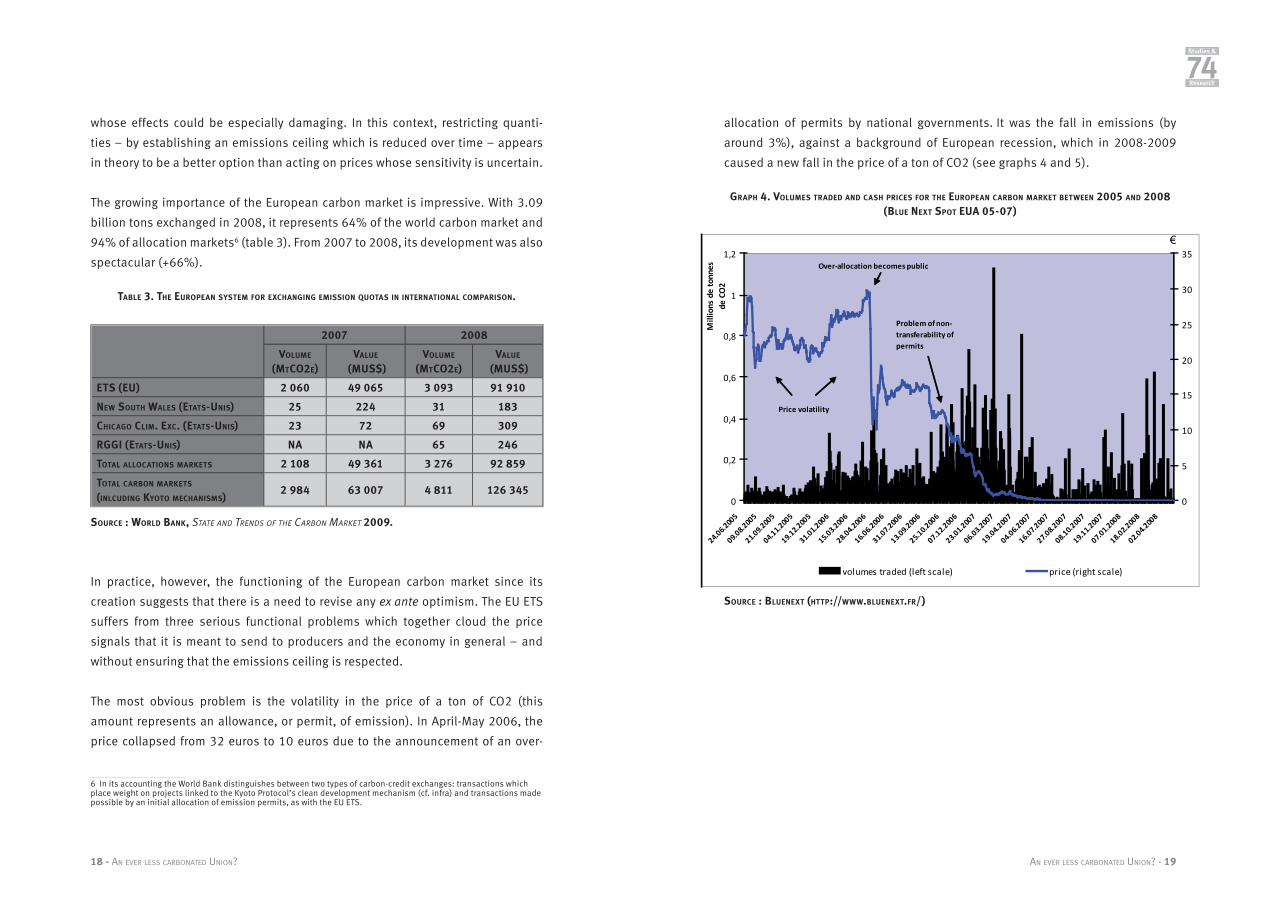
The most obvious problem is the volatility in the price of a ton of CO2 (this
amount represents an allowance, or permit, of emission). In April-May 2006, the
price collapsed from 32 euros to 10 euros due to the announcement of an over-
6 In its accounting the World Bank distinguishes between two types of carbon-credit exchanges: transactions which place weight on projects linked to the Kyoto Protocol’s clean development mechanism (cf. infra) and transactions made possible by an initial allocation of emission permits, as with the EU ETS.
allocation of permits by national governments. It was the fall in emissions (by
around 3%), against a background of European recession, which in 2008-2009
caused a new fall in the price of a ton of CO2 (see graphs 4 and 5).
GRAPH 4. VOLUMES TRADED AND CASH PRICES FOR THE EUROPEAN CARBON MARKET BETWEEN 2005 AND 2008(BLUE NEXT SPOT EUA 05-07)
0
0,2
0,4
0,6
0,8
1
1,2
24.06.2
005
09.08.2
005
21.09.2
005
04.11.2
005
19.12.2
005
31.01.2
006
15.03.2
006
28.04.2
006
16.06.2
006
31.07.2
006
13.09.2
006
25.10.2
006
07.12.2
006
23.01.2
007
06.03.2
007
19.04.2
007
04.06.2
007
16.07.2
007
27.08.2
007
08.10.2
007
19.11.2
007
07.01.2
008
18.02.2
008
02.04.2
008
Mill
ions
de
tonn
es
de C
O2
0
5
10
15
20
25
30
35
volumes traded (left scale) price (right scale)
Over-allocation becomes public
Problem of non-transferability of permits
Price volatility
€
SOURCE : BLUENEXT (HTTP://WWW.BLUENEXT.FR/)
20 - AN EVER LESS CARBONATED UNION? AN EVER LESS CARBONATED UNION? - 21
Studies &
74ResearchResearch
GRAPH 5. VOLUMES TRADED AND CASH PRICES FOR THE EUROPEAN CARBON MARKET
BETWEEN FEBRUARY 2008 AND MAY 2009 (BLUE NEXT SPOT EUA 08-12)
0
5
10
15
20
25
26.02.2
008
18.03.2
008
10.04.2
008
02.05.2
008
23.05.2
008
13.06.2
008
04.07.2
008
25.07.2
008
18.08.2
008
08.09.2
008
29.09.2
008
20.10.2
008
10.11.2
008
01.12.2
008
22.12.2
008
15.01.2
009
05.02.2
009
26.02.2
009
19.03.2
009
09.04.2
009
05.05.2
009
26.05.2
009
Mill
ions
de
tonn
es d
e CO
2
0
5
10
15
20
25
30
35
Collapse of Lehman Brothers, 15 September 2008
1st July 2008, peak at 28,73 euros, oil at 140$ per barel
16 February 2009, low point at 8,25 euros
€
SOURCE : BLUENEXT (HTTP://WWW.BLUENEXT.FR/)
The successive nature of the two phenomena is something of a paradox and
requires explanation. During phase I of the market’s operation, from 2005 to
2007, national governments systematically allocated too many emission permits
to companies by means of national allocation plans (NAPs); these allocations were
then drastically reduced under pressure from the European Commission, which
rejected numerous initial versions of the NAPs for the phase II (2008-2012). But
the world crisis pushed down emissions in 2008 so that the price collapsed once
again despite the reduction of allocations. There was thus “over-allocation” (2005-
2007) followed by “under-emission” (2008), each time with an unfavourable effect
on the price of a ton of CO2.
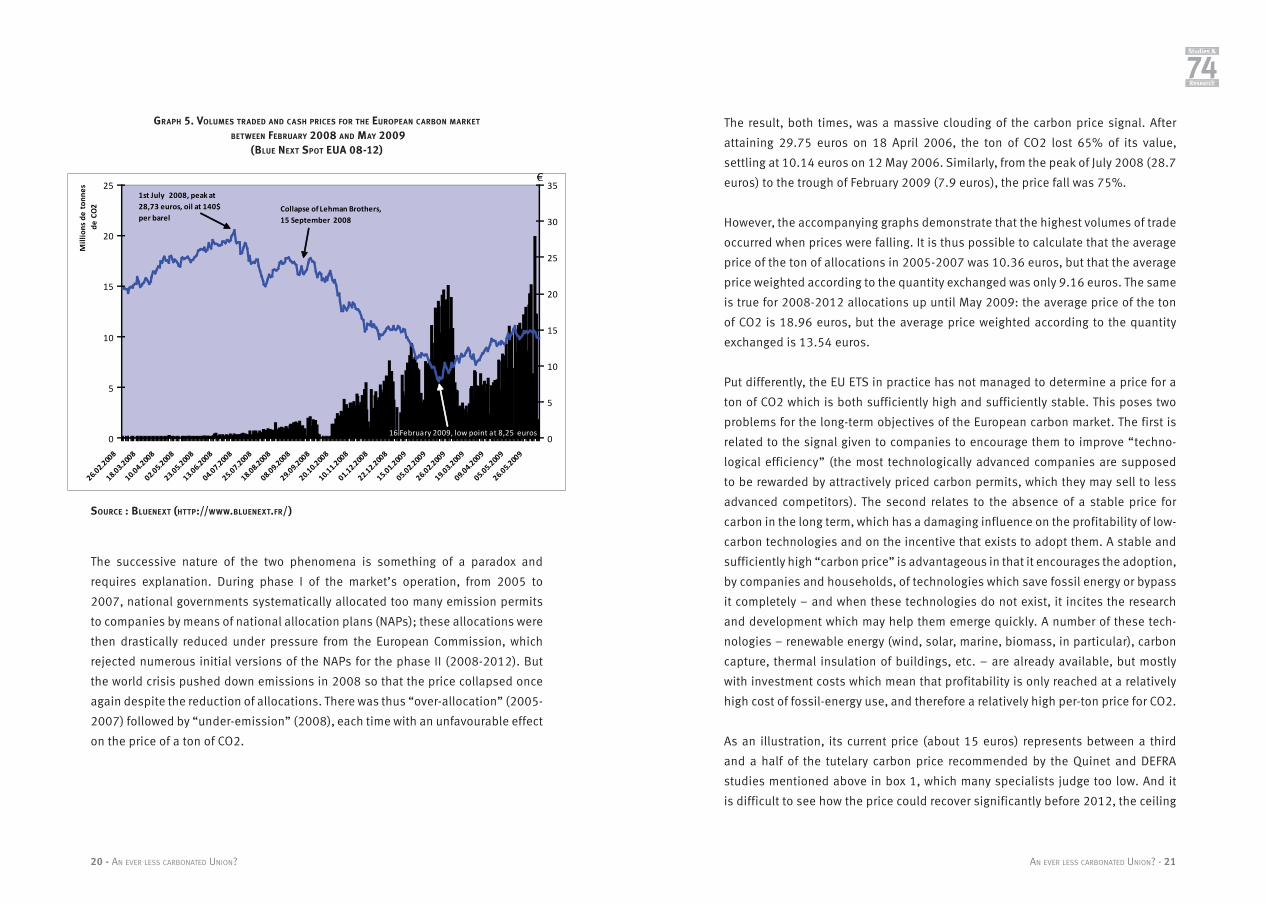
The result, both times, was a massive clouding of the carbon price signal. After
attaining 29.75 euros on 18 April 2006, the ton of CO2 lost 65% of its value,
settling at 10.14 euros on 12 May 2006. Similarly, from the peak of July 2008 (28.7
euros) to the trough of February 2009 (7.9 euros), the price fall was 75%.
However, the accompanying graphs demonstrate that the highest volumes of trade
occurred when prices were falling. It is thus possible to calculate that the average
price of the ton of allocations in 2005-2007 was 10.36 euros, but that the average
price weighted according to the quantity exchanged was only 9.16 euros. The same
is true for 2008-2012 allocations up until May 2009: the average price of the ton
of CO2 is 18.96 euros, but the average price weighted according to the quantity
exchanged is 13.54 euros.
Put differently, the EU ETS in practice has not managed to determine a price for a
ton of CO2 which is both sufficiently high and sufficiently stable. This poses two
problems for the long-term objectives of the European carbon market. The first is
related to the signal given to companies to encourage them to improve “techno-
logical efficiency” (the most technologically advanced companies are supposed
to be rewarded by attractively priced carbon permits, which they may sell to less
advanced competitors). The second relates to the absence of a stable price for
carbon in the long term, which has a damaging influence on the profitability of low-
carbon technologies and on the incentive that exists to adopt them. A stable and
sufficiently high “carbon price” is advantageous in that it encourages the adoption,
by companies and households, of technologies which save fossil energy or bypass
it completely – and when these technologies do not exist, it incites the research
and development which may help them emerge quickly. A number of these tech-
nologies – renewable energy (wind, solar, marine, biomass, in particular), carbon
capture, thermal insulation of buildings, etc. – are already available, but mostly
with investment costs which mean that profitability is only reached at a relatively
high cost of fossil-energy use, and therefore a relatively high per-ton price for CO2.
As an illustration, its current price (about 15 euros) represents between a third
and a half of the tutelary carbon price recommended by the Quinet and DEFRA
studies mentioned above in box 1, which many specialists judge too low. And it
is difficult to see how the price could recover significantly before 2012, the ceiling

22 - AN EVER LESS CARBONATED UNION? AN EVER LESS CARBONATED UNION? - 23
Studies &
74ResearchResearch
of state-distributed pollution permits having been fixed in 2007 by the European
Commission for the whole phase II of the market. This indicates that the European
carbon market will likely continue to function poorly for at least as long as the
economic crisis persists. To interpret the current malfunction of the EU ETS as
proof that it functions (emissions having been reduced due to the rise in fossil-fuel
prices in summer 2008) would appear optimistic.7
Lastly, due to pressure from Germany, Italy and Poland, the “climate and energy
package” introduced two additional weaknesses into the functioning of the EU ETS.
The first and most serious concerns the option given to member states of realising
50% of their emissions reductions before 2020 outside European territory, via the
Kyoto Protocol’s mechanisms for joint implementation and (above all) clean deve-
lopment (CDM), according to the principle of certified emission reductions (CERs)8.
This idea of carbon compensation between developed and developing countries
is theoretically compatible with the nature of climate as an international public
good, and with the fact that the cost of reducing emissions is less in developing
countries. But the available assessments of the CDM in practice show major points
of dysfunction, to the point that between one third and two thirds of projects do not
in fact result in genuine emissions reductions9.
The second special dispensation concerns the legal recognition of a risk of “carbon
leakage” (the risk of relocation by European industries subject to restrictive envi-
ronmental standards from which their competitors are exempt). The conditions to
be met in order to obtain free permits due to “carbon leakage” are particularly
flexible: if an industry can demonstrate that the purchase of its emission permits
is increasing its costs by more than 5% of its added value and that it is exposed
to non-European trade beyond 10%, it can obtain the free allowances. In practice,
this mechanism seems to allow whole sections of European industry to escape the
7 Commenting on the 3% reduction in GHG emissions between 2007 and 2008 in the EU ETS sectors, the European environment commissioner Stavros Dimas declared in May 2009: “The 3% reduction was partly the result of measures taken by companies to reduce their emissions in response to the high carbon price which prevailed until the start of the recession. This confirms that the EU has a trading system which works well, with a robust ceiling, a clear price signal and a liquid market, which helps us to reduce emissions in a cost-effective way.”8 The Kyoto Protocol sets out three “flexibility mechanisms” to allow signatory states to meet the restrictive targets ETS they are assigned. The first is the establishment of a market for emission permits, such as the EU ETS; the second is joint implementation, which allows carbon credits to be exchanged between Annex I states on the basis of projects allowing GHG emission reductions; the third, the “clean development mechanism”, makes use of the same principle but between states of Annex I and developing countries.9 On this subject, see in particular Wara and Victor, “A realistic policy on international carbon offsets”. Rep. PESD. Working Paper n° 74, Program on Energy and Sustainable Development, Stanford University, April 2008.
auctioning of permits, which in any case will only be introduced gradually (3% from
2008 to 2012, 20% in 2013, 70% in 2020 and 100% in 2027).
What can be concluded about the ecological effectiveness of the European carbon
market? Examining the most recent data made public by the European Commission,
we can measure that European emissions in sectors subject to the EU ETS in fact
increased between 2005 and 2007, by 2% (graph 6). However, they decreased
substantially from 2007 to 2008, by 3.2%. The cumulative fall is therefore 1.2%
since 2005, a rhythm clearly insufficient to achieve the target reduction of 21%
by 2020 in the sectors bound by the EU ETS (this objective assumes an annual
reduction of 1.75%).
GRAPH 6. EMISSIONS AND ALLOCATIONS ON THE EUROPEAN CARBON MARKET, 2005-2008
SOURCE : E EA.
The fundamental reason for the choice of an emissions market as a means of
reducing uncertainty therefore seems questionable. The European carbon market
must be taxified (cf. infra) to make it better able to guarantee that emissions will
fall in such a way that the 2°C temperature-increase threshold is not breached.
1,65
1,7
1,75
1,8
1,85
1,9
1,95
2
2,05
2,1
2,15
allocations emissions allocations emissions allocations emissions allocations emissions
Billi
ons
of t
ons
2005 2006 2007 2008
24 - AN EVER LESS CARBONATED UNION? AN EVER LESS CARBONATED UNION? - 25
Studies &
74ResearchResearch
But more than that must be done. The EU ETS in any case only covers about 40% of
European GHG emissions and its coverage is not planned to exceed half of the EU’s
emissions, even after the inclusion of the air transport sector in 2012. This clearly
raises the question of complementary economic instruments in the system. This is
all the more the case given that the emissions not covered by the EU ETS are the
diffuse ones (transport and housing). The sector of transport is where the develop-
ment of GHG emissions is the most worrying (cf. supra).
3.2. The regulatory policy
In the EU, regulatory policy is concentrated on the question of emissions
standards for light vehicles. This is the subject of regulation (EC) No 443/2009,
whose content has been diluted and implementation postponed. The regu-
lation was adopted in the framework of the “climate and energy package”10
and was bitterly contested – in particular by Germany, whose car makers are less
advanced in this matter than French and Italian ones. It is true that this new regu-
lation places the European Union in a favourable situation internationally, with
particular regard to the United States and also Japan (after the decision by the
Obama administration in 2009, the US will only reach current European standards
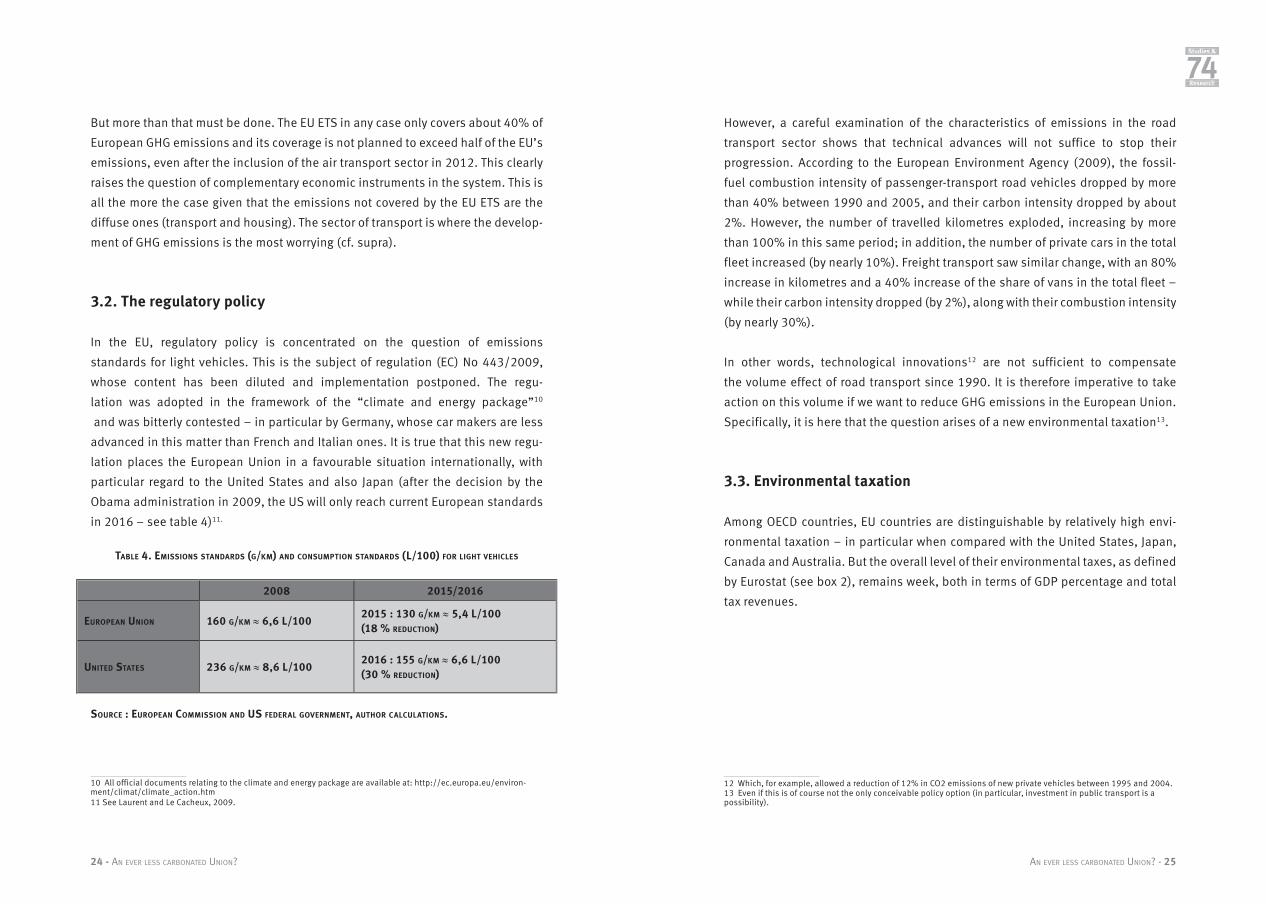
in 2016 – see table 4)11.
TABLE 4. EMISSIONS STANDARDS (G/KM) AND CONSUMPTION STANDARDS (L/100) FOR LIGHT VEHICLES
2008 2015/2016
EUROPEAN UNION 160 G/KM ≈ 6,6 L/1002015 : 130 G/KM ≈ 5,4 L/100(18 % REDUCTION)
UNITED STATES 236 G/KM ≈ 8,6 L/1002016 : 155 G/KM ≈ 6,6 L/100(30 % REDUCTION)
SOURCE : EUROPEAN COMMISSION AND US FEDERAL GOVERNMENT, AUTHOR CALCULATIONS.
10 All official documents relating to the climate and energy package are available at: http://ec.europa.eu/environ-ment/climat/climate_action.htm11 See Laurent and Le Cacheux, 2009.
However, a careful examination of the characteristics of emissions in the road
transport sector shows that technical advances will not suffice to stop their
progression. According to the European Environment Agency (2009), the fossil-
fuel combustion intensity of passenger-transport road vehicles dropped by more
than 40% between 1990 and 2005, and their carbon intensity dropped by about
2%. However, the number of travelled kilometres exploded, increasing by more
than 100% in this same period; in addition, the number of private cars in the total
fleet increased (by nearly 10%). Freight transport saw similar change, with an 80%
increase in kilometres and a 40% increase of the share of vans in the total fleet –
while their carbon intensity dropped (by 2%), along with their combustion intensity
(by nearly 30%).
In other words, technological innovations12 are not sufficient to compensate
the volume effect of road transport since 1990. It is therefore imperative to take
action on this volume if we want to reduce GHG emissions in the European Union.
Specifically, it is here that the question arises of a new environmental taxation13.
3.3. Environmental taxation
Among OECD countries, EU countries are distinguishable by relatively high envi-
ronmental taxation – in particular when compared with the United States, Japan,
Canada and Australia. But the overall level of their environmental taxes, as defined
by Eurostat (see box 2), remains week, both in terms of GDP percentage and total
tax revenues.
12 Which, for example, allowed a reduction of 12% in CO2 emissions of new private vehicles between 1995 and 2004.13 Even if this is of course not the only conceivable policy option (in particular, investment in public transport is a possibility).
26 - AN EVER LESS CARBONATED UNION? AN EVER LESS CARBONATED UNION? - 27
Studies &
74ResearchResearch
BOX 2: WHAT IS ENVIRONMENTAL TAXATION?
ENVIRONMENTAL TAXATION IS DEFINED AS THE TAXATION TARGETING GOODS AND SERVICES WHICH HAVE AN EFFECT ON THE ENVIRONMENT. FOR EUROSTAT, THESE ARE TAXES “WHOSE BASE IS FOUNDED ON ENVIRONMENTAL HARM”. THE TAX PROVISIONS CAN BE “POSITIVE” MEASURES AFFECTING PRICES AND HOUSEHOLD INCOMES, OR “NEGATIVE” MEASURES CAUSING INCREASED PRICES FOR GOODS AND SERVICES. THE OECD, IN ITS DEFINITION, EMPHASISES THE REAL AND POTENTIAL EFFECT OF A TAX ON THE ENVIRONMENT – THAT IS, THE EFFECT ON RELATIVE PRICES AND ON BEHAVIOUR.
ENVIRONMENTAL TAXATION CAN BE LOOSELY DEFINED IN TERMS OF THREE DISTINCT APPROACHES:• DECLARED INTENTION: ANY TAX MEASURE WHERE THE LEGISLATOR’S INTENTION IS TO IMPROVE THE
ENVIRONMENT. THIS AIM IS CLEARLY MENTIONED IN THE LAW;• BEHAVIOUR: ANY TAX MEASURE WHICH RESULTS IN AN ECONOMIC INCENTIVE ENCOURAGING IMPROVEMENT OF
THE ENVIRONMENT;• PRODUCT OR POLLUTANT TARGETED: ANY TAX MEASURE AIMED AT A PHYSICAL GOOD WHICH HAS A NEGATIVE
IMPACT ON THE ENVIRONMENT.
ENVIRONMENTAL TAX MEASURES CAN ALSO BE ANALYSED IN TERMS OF:• THE TAX NATURE OF THE MEASURE, DISTINGUISHING TAXES, FEES, EXEMPTIONS, TAX CREDITS, DIRECT
SUBSIDIES, ETC.;• THE LEVEL OF COVERAGE: TOWN, REGION, COUNTRY;• THE DESTINATION OF REVENUES (IN THE CASE OF TAXES): TO THE STATE BUDGET, TO SPECIAL ACCOUNTS, TO
PUBLIC OR PRIVATE BODIES, ETC.
SOURCE : CONSULTATION NATIONALE POUR LA CHARTE DE L’ENVIRONNEMENT, FRENCH MINISTRY FOR ECOLOGY AND SUSTAINABLE DEVELOPMENT, 2005.
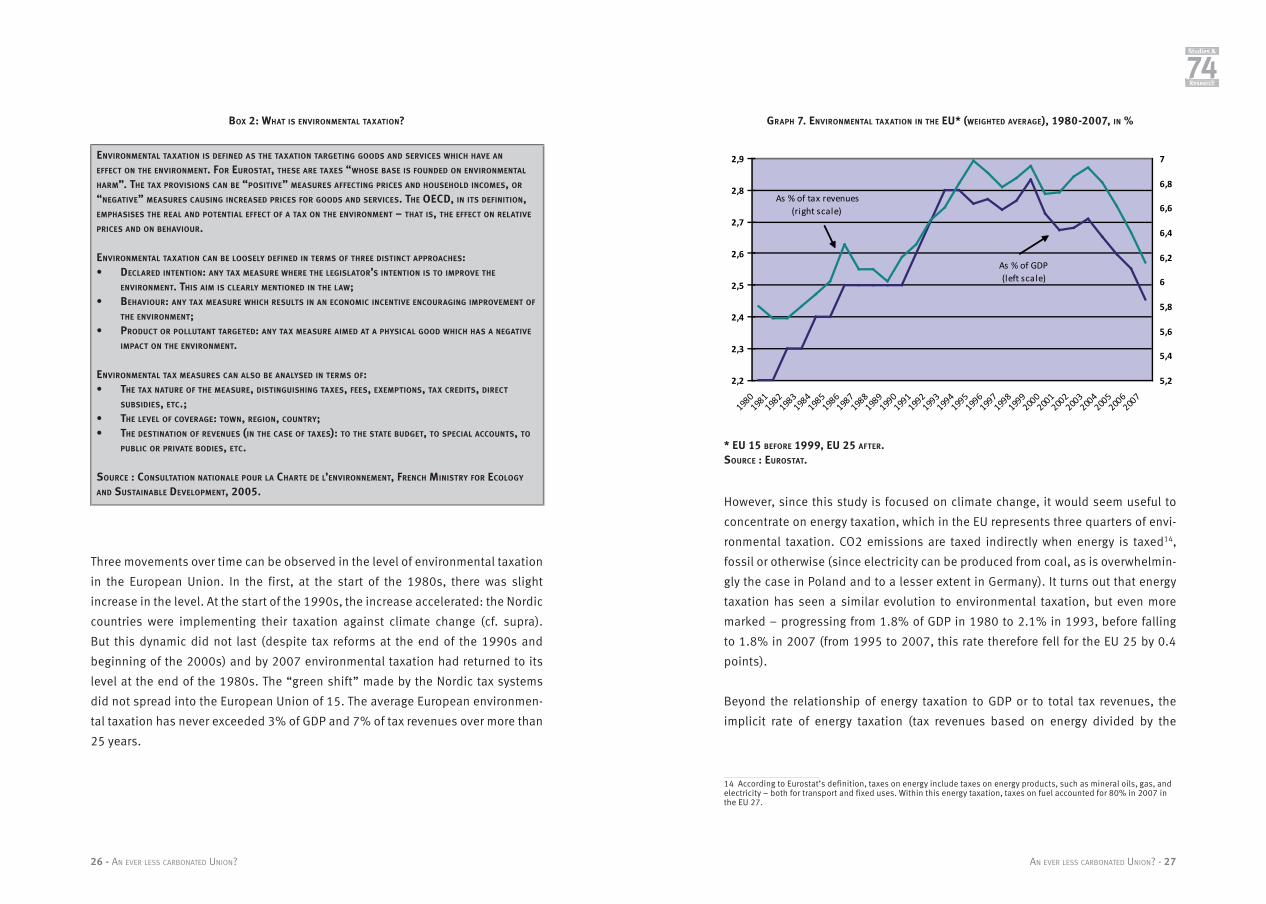
Three movements over time can be observed in the level of environmental taxation
in the European Union. In the first, at the start of the 1980s, there was slight
increase in the level. At the start of the 1990s, the increase accelerated: the Nordic
countries were implementing their taxation against climate change (cf. supra).
But this dynamic did not last (despite tax reforms at the end of the 1990s and
beginning of the 2000s) and by 2007 environmental taxation had returned to its
level at the end of the 1980s. The “green shift” made by the Nordic tax systems
did not spread into the European Union of 15. The average European environmen-
tal taxation has never exceeded 3% of GDP and 7% of tax revenues over more than
25 years.
GRAPH 7. ENVIRONMENTAL TAXATION IN THE EU* (WEIGHTED AVERAGE), 1980-2007, IN %
* EU 15 BEFORE 1999, EU 25 AFTER.SOURCE : EUROSTAT.
However, since this study is focused on climate change, it would seem useful to
concentrate on energy taxation, which in the EU represents three quarters of envi-
ronmental taxation. CO2 emissions are taxed indirectly when energy is taxed14,
fossil or otherwise (since electricity can be produced from coal, as is overwhelmin-
gly the case in Poland and to a lesser extent in Germany). It turns out that energy
taxation has seen a similar evolution to environmental taxation, but even more
marked – progressing from 1.8% of GDP in 1980 to 2.1% in 1993, before falling
to 1.8% in 2007 (from 1995 to 2007, this rate therefore fell for the EU 25 by 0.4
points).
Beyond the relationship of energy taxation to GDP or to total tax revenues, the
implicit rate of energy taxation (tax revenues based on energy divided by the
14 According to Eurostat’s definition, taxes on energy include taxes on energy products, such as mineral oils, gas, and electricity – both for transport and fixed uses. Within this energy taxation, taxes on fuel accounted for 80% in 2007 in the EU 27.
2,2
2,3
2,4
2,5
2,6
2,7
2,8
2,9
1980198
1198
2198
3198
4198
5198
6198
7198
8198
9199
0199
1199
2199
3199
4199
5199
6199
7199
8199
9200
0200
1200
2200
3200
4200
5200
6200
7
5,2
5,4
5,6
5,8
6
6,2
6,4
6,6
6,8
7
As % of GDP(left scale)
As % of tax revenues(right scale)
28 - AN EVER LESS CARBONATED UNION? AN EVER LESS CARBONATED UNION? - 29
Studies &
74ResearchResearch
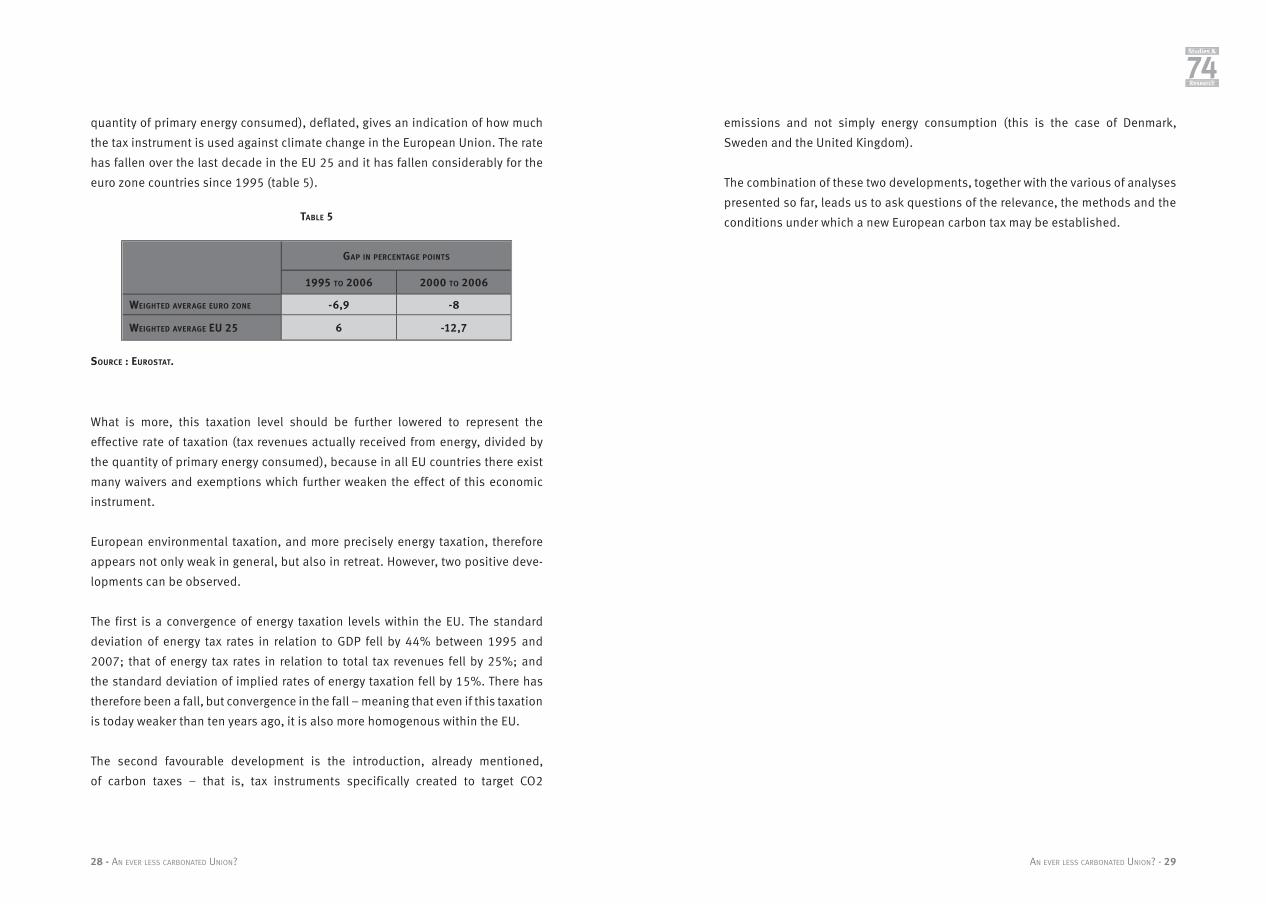
quantity of primary energy consumed), deflated, gives an indication of how much
the tax instrument is used against climate change in the European Union. The rate
has fallen over the last decade in the EU 25 and it has fallen considerably for the
euro zone countries since 1995 (table 5).
TABLE 5
GAP IN PERCENTAGE POINTS
1995 TO 2006 2000 TO 2006
WEIGHTED AVERAGE EURO ZONE -6,9 -8
WEIGHTED AVERAGE EU 25 6 -12,7
SOURCE : EUROSTAT.
What is more, this taxation level should be further lowered to represent the
effective rate of taxation (tax revenues actually received from energy, divided by
the quantity of primary energy consumed), because in all EU countries there exist
many waivers and exemptions which further weaken the effect of this economic
instrument.
European environmental taxation, and more precisely energy taxation, therefore
appears not only weak in general, but also in retreat. However, two positive deve-
lopments can be observed.
The first is a convergence of energy taxation levels within the EU. The standard
deviation of energy tax rates in relation to GDP fell by 44% between 1995 and
2007; that of energy tax rates in relation to total tax revenues fell by 25%; and
the standard deviation of implied rates of energy taxation fell by 15%. There has
therefore been a fall, but convergence in the fall – meaning that even if this taxation
is today weaker than ten years ago, it is also more homogenous within the EU.
The second favourable development is the introduction, already mentioned,
of carbon taxes – that is, tax instruments specifically created to target CO2
emissions and not simply energy consumption (this is the case of Denmark,
Sweden and the United Kingdom).
The combination of these two developments, together with the various of analyses
presented so far, leads us to ask questions of the relevance, the methods and the
conditions under which a new European carbon tax may be established.
30 - AN EVER LESS CARBONATED UNION? AN EVER LESS CARBONATED UNION? - 31
Studies &
74ResearchResearch
IV - The economics of carbon taxes
4.1. The theory
The economic theory of environmental taxation goes back to the work of Pigou
(1920)15, whose idea was to internalise external environmental damage by means
of taxation. With this objective, carbon taxation aims to integrate the “social cost”
of carbon (climate change, health, etc.) into the cost of the private use of fossil
energy. But in practice the costs are difficult to estimate and the optimal amount
for the tax therefore becomes uncertain. A more pragmatic approach is that of
Baumol and Oates (1971)16, which aims to determine an environmental objective
and to design an instrument to reach this objective.
The first purpose of carbon taxation is to dissuade, in the sense that it aims to dis-
courage use of fossil energy – the main source of GHG emissions – by intentional-
ly increasing the cost of this use. In the absence of any perfect market mechanism
which may determine a carbon price, the tax’s objective is to establish such a
price – by shifting onto the economic agents that emit carbon or whose consumed
products have “carbon content” (due to the process and energy used to produce,
stock and transport them, etc.) the economic costs that these emissions inflict
15 Pigou A. C. (1920), The Economics of Welfare, Macmillan, London.16 William J. Baumol & Wallace E. Oates, The Use of Standards and Prices for Protection of the Environment, 73 SWED. J. OF ECON. 42, 42–51 (1971)

32 - AN EVER LESS CARBONATED UNION? AN EVER LESS CARBONATED UNION? - 33
Studies &
74ResearchResearch
on the planet. According to Pigouvian terminology, it is therefore a question of
remedying a “market failure” - that is, the non-existence of a private market in which
a carbon price is established based on all of the consequences of its emission. This
is why, as Coase (1960) showed, the creation of private property rights – in this
case “rights to emit carbon” – and a market in which these rights may be traded
freely, could represent an alternative solution to the taxation of emissions. In both
cases, the objective is the establishment of a “carbon price” and, as our scenarios
indicate (cf. infra), the two solutions can be considered complementary, provided
that they are managed in a coherent way.
The introduction of a carbon tax, whatever its functional details, does not however
aim to “punish” consumers of fossil energies, or “hit their wallets”, or make them
feel guilty. A high price certainly has the effect of dissuading the use of the good
in question; but also sends the signal that it is convenient to favour, wherever
possible17, technologies which help to save a costly resource. In the case of carbon
tax, it is important to establish quickly and durably a “carbon price” sufficiently
high that it encourages the adoption, by companies and households, of technolo-
gies which save fossil energy or spare it completely, and encourages research and
development to help these technologies emerge when they do not yet exist. Many
of these technologies – renewable energy (wind, solar, marine, biomass in particu-
lar), carbon capture, thermal insulation of buildings, etc. – are already available,
but mostly with investment costs which mean that profitability is only reached at
a relatively high cost of fossil-energy use18. Others will appear after the financial
incentive becomes suitable and durable.
Why not then allow the markets to work unhindered? After all, without public inter-
vention the oil price reached nearly 150 dollars a barrel during summer 2008.
Sooner or later, with the renewed world growth that will come one day, it will
probably reach this price again and even exceed it – to the extent that the planet’s
oil resources dwindle and the exploitation costs of new discoveries rise. At the root
of the problem, the fossil energy market is too volatile to determine a reliable price
and to guarantee sufficient visibility to investors and households; in addition,
each rise in the oil price causes substitution towards other fossil fuels – in parti-
17 This is where the question arises of the value of consumption elasticity in relation to the price of energy (cf. infra).18 The Stern report provides the profitability thresholds for a number of these technologies. See Nicholas Stern, The Economics of Climate Change: The Stern Review, Cambridge University Press, 2007.
cular coal, whose emissions of GHGs (among other pollutants) are higher; lastly,
the rise in fossil energy prices risks being too late, whereas urgency demands
technological choices as soon as possible. The market imperfections and failures
must therefore be compensated by including in the private cost of fossil energy
the estimated cost of the climatic consequences of emissions. It is probably even
a good idea to set this additional cost at a somewhat high level, rather than to
announce that it will increase in the future (public decision-makers will be tempted
not to do this, just as it has not been done for most new tax charges). A low initial
figure risks being ineffective at triggering the needed reorientations, and anticipa-
tion of a future rise could incite producer countries to accelerate the extraction and
marketing of fossil energy resources, knowing that demand will fall in the future.19
The all-important reduction in emissions will then be delayed.
4.2. Advantages and disadvantages of different instruments of intervention
As theory suggests, several means of intervention may be envisaged. Their effec-
tiveness in terms of reducing GHG emissions, and their effects on the various
economic aspects of the problem (competitiveness of businesses, household pur-
chasing power, fairness, etc.) differ. In general authorities resort to a mixture of
various instruments, in a range of proportions.
Very often used, and favoured by both bureaucrats and to an extent public opinion,
the regulatory solution (technical standards on car emissions, industrial pollution,
product ingredients, etc.) has the advantage of being explicit and easy to unders-
tand: why not outlaw what is judged socially damaging? But there are numerous
disadvantages. Firstly in terms of inspection, which is difficult when there is a large
volume of users – this is why such tools generally target large industrial users,
or manufacturers of products subject to technical standards (car builders, for
example). In addition, the establishment of thresholds often gives rise to inter-
minable negotiation and therefore results in compromises which could be judged
insufficient (see the example of the REACH directive on chemicals). Lastly, from
19 This aspect of the problem, which concerns the supply of fossil energies, is analysed by Hans-Werner Sinn, Public Policies Against Global Warming, NBER Working Paper No. W13454, September 2007.

34 - AN EVER LESS CARBONATED UNION? AN EVER LESS CARBONATED UNION? - 35
Studies &
74ResearchResearch
the point of view of economic efficiency, technical standards have the flaw of not
taking account of the differences between individual economic agents – regarding
both costs and preferences. By nature they are uniform, or when they are adjusted
it is done technocratically and somewhat arbitrarily, thus suffering from the flaw of
all state planning.
Implementation of a Pigouvian tax, which rests on the principle of “polluter pays”,
is practised in many fields where the negative external effects are accepted. Acting
directly on the price of the item causing the social harm, the tax intentionally distorts
the structure of incentives – thereby violating the traditional principle of tax neu-
trality to influence the choices and behaviour of individual economic agents. From
an economic point of view, the advantage of this method is that it preserves the
decentralised nature of decisions, only “correcting” a “market failure”. But it has
disadvantages. Calibration is difficult, because of the difficulty of assessing the
“marginal social damage” caused by the activity at the source of the external effect
and because of the uncertainty over the amount of demand elasticity of the item
taxed – that is to say, the magnitude of the response by economic agents to a modi-
fication of the price signal. Its negative effects on purchasing power – unequally
and unjustly spread between taxpayers, as a result in particular of the varying size
of the parts of the household budget devoted to the consumption targeted by the
tax – are visible and generally provoke strong opposition, particularly among low-
income taxpayers. This situation also arouses suspicions that the real motive of
the tax is to raise funds, rather than to change behaviour.20 It should also be noted
that the tax can be levied either on fossil energy consumption21 – the source of
GHG emissions – or on the final consumption of goods and services, in which case
its calculation is founded on the total quantity of GHGs emitted during the process
of producing, transporting and distributing each of the goods and services taxed.
This method has never been implemented because it is considered technically
complex, but it has numerous theoretical advantages: it creates greater visibility
20 These arguments are well-known and regularly used in relation to the taxation of tobacco, fuels, etc. The unequal distribution of the negative impact on purchasing power is also characteristic of technical standards; but in this case it is less visible and less directly measurable, therefore less often criticised.21 “Classic” taxation of fuel could be considered as carbon taxation. In this case, it would be possible to raise the tax rather than to create a new one specifically aimed at GHG emissions. Two objections can be made about this solution: firstly, in practice fuel taxes are not calibrated in accordance with carbon emissions, and over time they have accumulated countless special dispensations (agriculture, fishing, road transport, domestic heating, etc.); secondly, “carbon” taxation should in time extend to cover all GHG emissions (methane, in particular), even if it rarely concerns these today.
for the consumer, distorts relative prices less, and takes into account the whole
“social cost” of each final act of consumption.22
The third method, called “cap and trade”, was invented more recently. The first full-
scale example was the market for permits to emit sulphur dioxide (SO2), created
in the United States in the 1970s. The method is favoured by many economists but
arouses suspicion in public opinion, which sees in it a licence granted to behave
in ways deemed socially harmful. The creation of emission permits, which are
none other than “rights to produce” – like all production quotas, but in this case
to produce harm – accompanied by an organised system for trade, allows public
authorities to combine a chosen total quantity which may be produced (defining
the total supply on the market – “cap” ) with the mechanism of the free market
(“trade”). Faced with demand from emitters, who are obliged to possess a suffi-
cient quota to cover their emissions – and therefore, if necessary, to procure them
from those willing to sell – the supply, initially established by the authorities,
determines a market price. The emitters may then choose to be sellers or buyers
according to the cost represented to each party by the effort to reduce emissions.
The mechanism’s decentralisation and the modulation of emissions reductions
that it encourages together constitute the main advantage in terms of economic
efficiency. But the “market price” resulting from this mechanism does not have
the exogenous and semi-incontestable status that is often assumed in debate.
Resulting from the interplay of a supply fixed exogenously by the authorities and
a demand which depends on available technologies and the level of productive
activity, the price may be directed in the medium term by the authorities; yet, as the
potential object of speculation and the creation of derivatives, like all raw-mate-
rial markets, the price may also fluctuate erratically in the short term, which can do
lasting damage to the incentives it is supposed to provide. In addition, an effective
implementation of such a mechanism assumes that it is possible to inspect actual
emissions, which in practice has led to it being limited to the most concentrated
and high-emission industries. Lastly, the permits are allocated without charge, but
their distribution between emitters is by definition arbitrary and subject to intense
22 This corresponds to the Carbon-Added Tax, proposed in Laurent & Le Cacheux (2009b), or to the carbon tax on final consumption, proposed by Jim Hansen in the United States in January 2009. Among other things, such a tax has the merit of affecting imports, which increases its effectiveness in terms of reducing emissions and reduces the problems of cost-competitiveness (cf. infra).

36 - AN EVER LESS CARBONATED UNION? AN EVER LESS CARBONATED UNION? - 37
Studies &
74ResearchResearch
lobbying – because it gives rise to rents which generate private gain, while securing
no revenues for states. The solution therefore consists of allocating permits after a
process of auction bids – but in this case there is strong pressure from producers
in favour of free permits.
In most cases the three methods described above are combined in varying pro-
portions, based on technical considerations (feasibility) and political choices (in
terms both of efficiency with regard to different economic sectors, and of the dis-
tribution of costs and rents). All three23 have similar effects on short-term produc-
tion costs and therefore on the competitiveness of the producers in the area in
question. This is the notorious problem of “carbon leakage”, capable of causing
certain businesses to disappear or relocate to countries free of such constraints.
Citing these damaging effects – real but of debatable importance beyond the short
term – many producers oppose the different mechanisms mentioned and often
obtain special dispensations (exemptions from certain regulations, tax exemptions
or reductions, distribution of free permits, etc.) which seriously harm the effecti-
veness of the mechanisms in terms of emissions. This is especially true given that
such dispensations are generally given to the most emissions-intensive opera-
tions. In the longer term, however, it seems that the constraints thus imposed are
an incentive to adopt lower-emitting technologies and to innovate, in such a way
that their effects on competitiveness are positive and often spectacular.24
To compensate for the negative short-term consequences of the above-described
mechanisms on the cost-competitiveness of domestic producers and the lack of
incentive for foreign producers to reduce their emissions, it is desirable to com-
plement them with a carbon levy at borders, which hits imports from countries
which do not impose such constraints on their producers. Such a levy – in principle
conforming to the rules of the World Trade Organisation (OMC) – is necessary to
ensure the that the mechanisms are effective in terms of reducing emissions, and
it heads off producers’ pressure for special-dispensation regimes (cf. infra).25
23 Except, in the case of regulations, if these are imposed on the products rather than the process.24 For a theoretical analysis which concludes thus, see the recent article by Acemoglu, Aghion, Burnstin and Hemous (2009). Using their conclusions we may cite the case of Denmark, currently European leader in wind turbine technology, or Germany, principal producer of numerous thermal-insulation materials and renewable-energy equipment. At the other end of the spectrum is the hard-hit American car industry, in part a victim of obsolete technological choices due to a long-standing lack of incentives to reduce GHG emissions.25 On this point, see the recent opinion of the WTO (box 3) and the analyses of Guesnerie (1998) and Godard (2006).
BOX 3. THE POSITION OF THE WTO ON CARBON TARIFFS
THE OBJECTIVE OF A BORDER TAX ADJUSTMENT IS TO LEVEL THE PLAYING FIELD BETWEEN TAXED DOMESTIC INDUSTRIES AND UNTAXED FOREIGN COMPETITION BY ENSURING THAT INTERNAL TAXES ON PRODUCTS ARE TRADE NEUTRAL. IN THE CONTEXT OF CLIMATE CHANGE, THE DEBATE HAS MAINLY FOCUSED ON TWO ASPECTS: THE EXTENT TO WHICH DOMESTIC CARBON/ENERGY TAXES (WHICH ARE IMPOSED ON INPUTS, SUCH AS ENERGY) ARE ELIGIBLE FOR BORDER TAX ADJUSTMENTS; AND THE EXTENT TO WHICH BTAS MAY BE LIMITED TO INPUTS WHICH ARE PHYSICALLY INCORPORATED INTO THE FINAL PRODUCTS. THE GENERAL APPROACH UNDER WTO RULES HAS BEEN TO ACKNOWLEDGE THAT SOME DEGREE OF TRADE RESTRICTION MAY BE NECESSARY TO ACHIEVE CERTAIN POLICY OBJECTIVES, AS LONG AS A NUMBER OF CAREFULLY CRAFTED CONDITIONS ARE RESPECTED. WTO CASE LAW HAS CONFIRMED THAT WTO RULES DO NOT TRUMP ENVIRONMENTAL REQUIREMENTS. IF, FOR INSTANCE, A BORDER MEASURE RELATED TO CLIMATE CHANGE WAS FOUND TO BE INCONSISTENT WITH ONE OF THE CORE PROVISIONS OF THE GATT, JUSTIFICATION MIGHT NONETHELESS BE SOUGHT UNDER THE GENERAL EXCEPTIONS TO THE GATT (I.E. ARTICLE XX), PROVIDED THAT TWO KEY CONDITIONS ARE MET. FIRST, THE MEASURE MUST FALL UNDER AT LEAST ONE OF THE GATT EXCEPTIONS, AND A CONNECTION MUST BE ESTABLISHED BETWEEN THE STATED GOAL OF THE CLIMATE CHANGE POLICY AND THE BORDER MEASURE AT ISSUE. IT SHOULD BE NOTED IN THIS REGARD THAT WTO MEMBERS’ AUTONOMY TO DETERMINE THEIR OWN ENVIRONMENTAL OBJECTIVES HAS BEEN REAFFIRMED BY THE WTO’S DISPUTE SETTLEMENT BODY ON A NUMBER OF OCCASIONS (FOR EXAMPLE, IN THE US - GASOLINE AND THE BRAZIL - RETREADED TYRES CASES). ALTHOUGH NO POLICIES AIMED AT CLIMATE CHANGE MITIGATION HAVE BEEN DISCUSSED IN THE DISPUTE SETTLEMENT SYSTEM OF THE WTO, IT HAS BEEN ARGUED THAT POLICIES AIMED AT REDUCING CO2 EMISSIONS COULD FALL UNDER THE GATT EXCEPTIONS, AS THEY ARE INTENDED TO PROTECT HUMAN BEINGS FROM THE NEGATIVE CONSEQUENCES OF CLIMATE CHANGE; AND TO CONSERVE NOT ONLY THE PLANET’S CLIMATE, BUT ALSO CERTAIN PLANT AND ANIMAL SPECIES THAT MAY DISAPPEAR AS A RESULT OF GLOBAL WARMING.
SECOND, THE MANNER IN WHICH THE MEASURE IN QUESTION WILL BE APPLIED IS IMPORTANT: IN PARTICULAR, THE MEASURE MUST NOT CONSTITUTE A “MEANS OF ARBITRARY OR UNJUSTIFIABLE DISCRIMINATION” OR A “DISGUISED RESTRICTION ON INTERNATIONAL TRADE”. GATT CASE LAW HAS SHOWN THAT THE IMPLEMENTATION OF A MEASURE IN A WAY THAT DOES NOT AMOUNT TO ARBITRARY OR UNJUSTIFIABLE DISCRIMINATION OR TO A DISGUISED RESTRICTION ON INTERNATIONAL TRADE HAS OFTEN BEEN THE MOST CHALLENGING ASPECT OF THE USE OF GATT EXCEPTIONS.
SOURCE : WTO/UNEP (2009).
4.3. In practice
The ideal carbon tax would therefore result in the establishment of a unique
carbon price by targeting the carbon (or CO2) content of all products or at least
fossil energies. In practice carbon taxes are imperfect, because they discriminate
among users and also because they are hybrid (carbon-energy) and their rate is
38 - AN EVER LESS CARBONATED UNION? AN EVER LESS CARBONATED UNION? - 39
Studies &
74ResearchResearch
thus determined neither by energy intensity nor by carbon intensity (or better still
GHG intensity). In addition, they suffer from numerous special dispensations.
In 2009, many European countries already have some experience of carbon tax,
but using extremely diverse methods (see table 6). Several other countries have
either recently introduced a carbon tax (France, on 1 January 2010) or plan to do
so soon (Japan, since the recent election). It seems however that only Sweden
has conducted a permanent and sufficiently coherent policy to have significant
results. Nonetheless, it is particularly difficult to assess empirically the effects of
the various mechanisms on changing emissions of carbon, since numerous other
modifications over the period can have their own effects on emissions.26
26 The figures appearing in the last column of the table must therefore be interpreted with the greatest prudence.

40 - AN EVER LESS CARBONATED UNION? AN EVER LESS CARBONATED UNION? - 41
Studies &
74ResearchResearch
TABLE6 : THE PRACTICE OF SEVERAL EUROPEAN COUNTRIES IN CARBON TAXATION27
COUNTRYYEAR OF
IMPLEMENTATIONLEVEL OF TAX (€ 2009/TON OF CO2)
TAX RATE IN RELATION TO GDP/INHABITANT (OCDE, 2007) IN %
FORM OF REDISTRIBUTION CHOSEN EXCEPTIONSRECORDED IMPACT ON GHG EMISSIONS (1990-2007)
UNITED KINGDOM – « CLIMATE CHANGE LEVY »
2001
GPL : 5.49OIL: 7.73
GAS :13.09
FIXED RATE IN £ SINCE 2001MIXED CARBON-ENERGY TAX
GAS : 0.050O : 0.030
GPL : 0.021
REDUCTION OF EMPLOYER SOCIAL CHARGES, SUBSIDIES TO ENVIRONMENTAL PROJECTS VIA
THE CARBON TRUST
- DOES NOT CONCERN HOUSEHOLDS. ONLY ON COAL, NATURAL GAS, GPL AND ELECTRICITY.- 80% UNDER CONDITIONS (OBJECTIVES OF
ENERGY EFFICIENCY)
- 17.4%
NETHERLANDS1990
12
COMBINATION OF TWO CARBON-ENERGY MIXED TAXES
0.036 INITIALLY REDUCTION OF INCOME TAX, THEN LOWERED EMPLOYER CHARGES
- 3.40€/T FOR SECTORS OF HIGH ENERGY INTENSITY
- 50% FOR NON-PROFIT ORGANISATIONS
- CONDITIONAL EXEMPTION FOR GAS AND ELECTRICITY FOR ELECTRICITY PRODUCTION
COVERAGE RATE FOR ALL EMISSIONS: 0.3
-2.1%
DENMARK1992
12.09
13.43 IN 1992(REDUCTION DUE TO PARALLEL
INTRODUCTION OF ENERGY TAX IN 2005)INCREASES BY 1.8%/YR UNTIL 2015
0.044
REDUCTION OF EMPLOYER SOCIAL CHARGES, FAMILY ALLOWANCES, REDUCED INCOME TAXES
ON LOW INCOMES,
20% OF REVENUE ALLOCATED TO PROGRAMMES TO IMPROVE ENERGY EFFICIENCY
1992: EXEMPTION FOR ALL BUSINESSES.
1993 TO 1995: -50% (OR MORE, UP TO -90% FOR ENERGY-INTENSIVE ACTIVITIES)
SINCE 1996: DISCRIMINATION ACCORDING TO USE (HEATING, LIGHTING, ETC.).
EXEMPTION FOR ELECTRICITY PRODUCTION
-3.5%
FINLAND1990
20
ONLY $1.45 IN 1990INCREASES FROM 2011
0.071MOSTLY REDUCED INCOME TAX (SINCE
1996). SINCE 2009, ABOLITION OF SOCIAL CONTRIBUTIONS BY EMPLOYERS, FINANCED BY
FUTURE RISE IN GREEN TAXES
- USE AS INDUSTRIAL MATERIAL
- FUEL FOR TRAINS, AIRCRAFT AND BOATS
- ELECTRICITY FOR GREENHOUSES
- NO TAX FOR ELECTRICITY PRODUCTION
- 50% FOR NATURAL GAS
+10.6%
NORWAY1991 34.4 0.062 SUPPORT FOR PROJECTS OF RESEARCH AND
DEVELOPMENT, ALLOWANCES FOR HOUSEHOLDS
EXEMPTIONS FOR HEAVY INDUSTRY, FISHING, AIR AND MARITIME TRANSPORT
COVERAGE FOR ALL EMISSIONS: 0.64
+18.7%
(BETWEEN 1990 AND 1999)
SWEDEN1991
108
100 IN 200743 IN 1991
(INDEXED FOR INFLATION)
0.40REDUCTION OF INCOME TAX, EXTENSION OF
VAT BASE, LOWERING OF SOCIAL CHARGES ON EMPLOYERS SINCE 2001, R&D
ORIGINALLY NO ALLOWANCE FOR INDUSTRY, BUT ALL GREEN TAXES CAPPED AT 1.2% OF SALES. SINCE 1997, LIMITED TO 0.8% FOR CERTAIN
ACTIVITIES
-9.1%
27 Extract of the study by Ombeline Gras (2009), L’introduction d’une taxe carbone et ses effets sur la compétitivité en France, internship report, OFCE, September 2009.

42 - AN EVER LESS CARBONATED UNION? AN EVER LESS CARBONATED UNION? - 43
Studies &
74ResearchResearch
SOURCES : • EN ATTENDANT LA TAXE CARBONE... ENJEUX ET OUTILS DE LA RÉDUCTION DES ÉMISSIONS DE CO2, REPORT BY
FABIENNE KELLER, ON BEHALF OF THE FINANCE COMMISSION, N° 543 (2008-2009) - 8 JULY 2009, • THE REALITY OF CARBON TAXES IN THE 21ST CENTURY, A JOINT PROJECT OF THE ENVIRONMENTAL TAX POLICY
INSTITUTE AND THE VERMONT JOURNAL OF ENVIRONMENTAL LAW VERMONT LAW SCHOOL, JANUARY 2009, • FMI, WORLD ECONOMIC OUTLOOK DATABASE, APRIL 2009, • EUROPEAN ENVIRONMENT AGENCY, ANNUAL REPORT OF THE EUROPEAN COMMUNITY ON GREENHOUSE GASES,
INVENTORY REPORT 1990-2007 AND 2009
The OECD (2006a) nonetheless shows that the environmental effectiveness of the
ecological taxes implemented since the start of the 1990s is high: “There is no
doubt that many taxes contribute to improving the environment. Their increase
results in a rise in prices which causes a reduction in demand for products harmful
to the environment. The consumption of fuel has thus fallen significantly in recent
years, following the rise in the price of crude and taxes on fuel.” Similarly, the com-
parative study by Agnolucci (2004) provides interesting means of assessing the
various national mechanisms in place.
The national studies that are available confirm the OECD’s judgement in the Nordic
countries and also in countries which have introduced carbon and/or energy taxes
more recently. Studies by the German federal agency, conducted to measure the
impact of reforms carried out between 1999 and 2003, show that energy consump-
tion has fallen and that CO2 emissions might have been reduced by 2% to 3%.
The study by Cambridge Econometrics (2005) on the British case also shows a 2%
reduction in CO2 emissions attributable to the tax measure called the “Climate
Change Levy”.
In addition, the available studies indicate that the elasticities of different energy
demands in relation to their prices are moderate in the short term, but quite high
in the long term (table 7).
TABLE 7. ELASTICITIES IN THE CONSUMPTION OF OIL PRODUCTS
NATURE OF DATA USED SHORT TERM LONG TERM
INTERNATIONAL COMPARISONAVERAGE: –0.26
(FROM 0 TO –1.36)AVERAGE: – 0.58
(FROM 0 TO –2.72)
TIME-BASED SERIES AVERAGE: –0.27 AVERAGE: – 0.71
TRANSVERSAL SECTION AVERAGE: –0.28 AVERAGE: –0.84
SOURCE : OECD (2006B).
The short-term effect can be illustrated using a recent example. The episode of
summer 2008 in France (graph 8) demonstrates well that short-term constraints
are strong (elasticities are weak) for motorists, but that the development of

44 - AN EVER LESS CARBONATED UNION? AN EVER LESS CARBONATED UNION? - 45
Studies &
74ResearchResearch
alternatives will loosen these constraints (elasticities rise over time, due to the
substitutions and technological changes which come with new equipment, invest-
ments and durable goods). Thus, the French did not reduce their diesel consump-
tion in July 2008 in comparison to July 2007, although its price had substantially
increased (going on holiday requires using one’s car). However, consumption fell
sharply in August (when the car is less necessary), which suggests that, when they
can, consumers reduce their consumption as an effect of a higher price.
GRAPH 8. PRICE (IN EUROS / LITRE) AND CONSUMPTION IN VOLUME OF DIESEL (THOUSANDS OF TONS)
2 200
2 300
2 400
2 500
2 600
2 700
2 800
2 900
3 000
3 100
janv-06
févr
-06
mars-
06
avr-06
mai-0
6
juin-06
juil-06
août-06
sept-0
6
oct-06
nov-06
déc-06
janv-07
févr
-07
mars-
07
avr-07
mai-0
7
juin-07
juil-07
août-07
sept-0
7
oct-07
nov-07
déc-07
janv-08
févr
-08
mars-
08
avr-08
mai-0
8
juin-08
juil-08
août-08
sept-0
8
oct-08
nov-08
déc-08
0,9
1,0
1,1
1,2
1,3
1,4
1,5
SOURCE : MINISTÈRE DE L’INDUSTRIE ET UFIP. JULY IN YELLOW, AUGUST IN ORANGE.
But the effect on supply is also a means of measuring the effectiveness of carbon
taxation. By contrast, there is the effect of the French Taxe intérieure sur les produits
pétroliers (TIPP), which taxes diesel less than petrol (see table 8), and has had the
effect of significantly encouraging the use of diesel vehicles in France (graph 9). In
general, and in all countries, it appears that the car types and changes thereof are
very sensitive to the structure of taxation on fuel.
TABLE 8. PRICE DIFFERENCE BETWEEN PETROL AND DIESEL IN FRANCE, IN EUROS/L, 29 MAY 2009
SSP 95 DIESEL DIFFERENCE
GROSS 0.293 0.293
TIPP 0.606 0.428 0.178
VAT ON PRODUCT BEFORE TAX 0.083 0.076
FIXED VAT ON TIPP 0.1190 0.084 0.0350
ADDED VALUE OF REFINING 0.046 0.014
ADDED VALUE OF DISTRIBUTION 0.087 0.08
DIFFERENCE LINKED TO TIPP 0.213
TOTAL 1.234 0.975 0.259
SOURCE : UFIP.
GRAPH 9. CHANGING NUMBER OF VEHICLES IN FRANCE, 1978-2007, IN MILLIONS
0
5
10
15
20
25
1978
1979
1980
1981
1982
1983
1984
1985
1986
1987
1988
1989
1990
1991
1992
1993
1994
1995
1996
1997
1998
1999
2000
2001
2002
2003
2004
2005
2006
2007
petrol vehicles
diesel vehicles
SOURCE : UFIP.

46 - AN EVER LESS CARBONATED UNION? AN EVER LESS CARBONATED UNION? - 47
Studies &
74ResearchResearch
V - Scenarios for a new European tax on carbon
The diversity of potentially usable tools, and existing national experience, suggest
the possibility of advancing in different directions.
5.1. Four scenarios
Four scenarios can be imagined for a new European carbon tax system, each cor-
responding to a level of political ambition – and therefore to a level of results to be
expected in terms of reducing GHG emissions. There will also be different effects
on the distribution of costs between countries and between economic actors, and
different impacts in terms of economic efficiency.
Scenario 1 (basic): “Taxify”This first scenario consists simply of “taxifying” the EU ETS, and exempting com-
pletely all the sectors involved from all energy or carbon taxes that member states
might impose (as already in the case in several countries, and recently announced
48 - AN EVER LESS CARBONATED UNION? AN EVER LESS CARBONATED UNION? - 49
Studies &
74ResearchResearch
by the French government). In this scenario, the basic logic of the European cli-
mate-change strategy is not modified. No new tax tool is introduced, but there is an
effort to optimise existing tools. By taxifying the EU ETS, we internalise the external
costs of carbon emissions for the sectors concerned, but, as compensation, we
exempt them totally from any increased energy or carbon taxation motivated by
climate change.
“Taxify” means both strengthening the obligation and making it more predictable,
in order for the EU ETS to have effects comparable to a tax. Several non-exclu-
sive measures to taxify the EU ETS may be envisaged. The first, which is by far the
most desirable from the perspective of efficiency, consists of creating a floor price.
Respect for this price would be assured by a mechanism of public intervention on
the market (perhaps using the European budget) to remove excess supply in case
of an excessive drop in price – following a procedure similar to the market support
used in the past for certain agricultural products, with destruction of the excess.28
The second mechanism consists of auctioning the permits at a faster pace starting
with phase III of the market (2013). Lastly, it would probably be useful to reduce
considerably the exemptions for “carbon leakage” and, given their poor perfor-
mance, to further limit the possibilities of carbon compensation.
This solution has the advantage of being highly feasible. But it does not affect a
part (around 40%) of Europe’s GHG problem, and therefore risks being insufficient
to tackle climate change effectively.
Scenario 2: “Climatic conversion”The second scenario complements scenario 1 by establishing a tax on sectors not
covered by the EU ETS. It is based on a proposal made by the European Commission
(2007) to make a “climatic conversion” of existing taxation by using the hybrid
energy-climate model of 1991-1992. The idea is to depart from the minimum rates
of the 2003 directive on excise duties applicable to fossil fuels, by distinguishing
between an “energy” component and a “climate” component. The fuels would be
28 The establishment of a minimum price, or a price tunnel, for carbon has been discussed by several authors, recently including Tirole (2009). According to the argument developed here, there is little reason to impose a price ceiling.
taxed uniformly according to their energy content and in a differentiated fashion
according to their carbon intensity.
This solution, feasible and much more ambitious than the previous one, would
nonetheless remain within the outlines chosen at the end of the 1990s and
beginning of the 2000s, aiming to create minimum rates in the European Union –
which does not settle the question of the optimal rate of taxation, and therefore of
the single price of carbon. Combined with scenario 1, it would however have the
merit of instituting a “minimum carbon price”, thereby ensuring better coherence
and visibility for the EU’s climate strategy – and avoiding the risks of “carbon
dumping”.
Scenario 3: The “European green shift”In this scenario, the “taxified” EU ETS of scenario 1 would be complemented by
a genuine European energy-carbon tax on “dispersed sectors” (transport and
housing). From this point of view, the European proposition of 1991, amended in
1992, has numerous attractive features. Firstly, it is a hybrid system (energy and
carbon)29, a structure which still today seems the most likely to be effective, given
Europe’s political economy (cf. infra).
The Swedish example is also particularly interesting in this scenario, for four
reasons.
• The Swedes (like the Slovenes, and unlike the British) converted their tax
regime for energy (where the first elements go back to the 1920s) in order
to adapt it to the climate-change question, in the early 1990s. A European
carbon tax was be created out of nothing, but rather existing taxes were be
converted to make them compatible with the climate-change challenge, and
then brought together to make them coherent.
• The Swedes opted for a hybrid energy/CO2 system, by instituting a gradual
increase of the CO2 component, which is today greater than the energy
29 The carbon component (50%) was fixed at 2.81 ECU per ton of CO2 and the energy component, which excluded renewable energies (50% of the total), at 0.21 ECU per gigajoule. The total amount was therefore equal to 17.75 ECU per ton, or $3 for a barrel of oil. The idea was to increase, each year from 1993 to 2000, the amount by $1 in order to reach $10 a barrel in 2000 – this being the ultimate objective, which was supposed to allow a stabilisation of EU CO2 emissions.
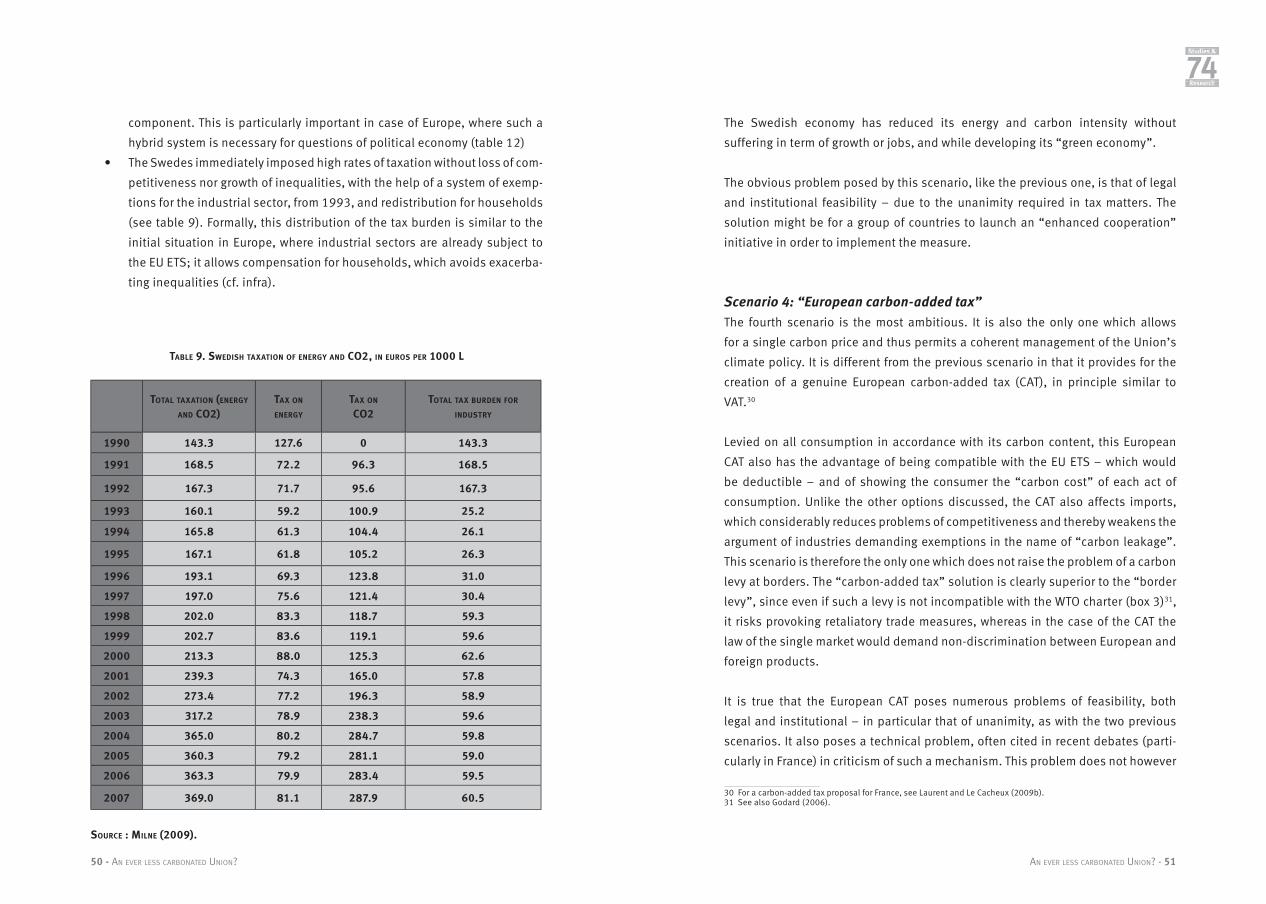
50 - AN EVER LESS CARBONATED UNION? AN EVER LESS CARBONATED UNION? - 51
Studies &
74ResearchResearch
component. This is particularly important in case of Europe, where such a
hybrid system is necessary for questions of political economy (table 12)
• The Swedes immediately imposed high rates of taxation without loss of com-
petitiveness nor growth of inequalities, with the help of a system of exemp-
tions for the industrial sector, from 1993, and redistribution for households
(see table 9). Formally, this distribution of the tax burden is similar to the
initial situation in Europe, where industrial sectors are already subject to
the EU ETS; it allows compensation for households, which avoids exacerba-
ting inequalities (cf. infra).
TABLE 9. SWEDISH TAXATION OF ENERGY AND CO2, IN EUROS PER 1000 L
TOTAL TAXATION (ENERGY AND CO2)
TAX ON ENERGY
TAX ON
CO2 TOTAL TAX BURDEN FOR
INDUSTRY
1990 143.3 127.6 0 143.3
1991 168.5 72.2 96.3 168.5
1992 167.3 71.7 95.6 167.3
1993 160.1 59.2 100.9 25.2
1994 165.8 61.3 104.4 26.1
1995 167.1 61.8 105.2 26.3
1996 193.1 69.3 123.8 31.0
1997 197.0 75.6 121.4 30.4
1998 202.0 83.3 118.7 59.3
1999 202.7 83.6 119.1 59.6
2000 213.3 88.0 125.3 62.6
2001 239.3 74.3 165.0 57.8
2002 273.4 77.2 196.3 58.9
2003 317.2 78.9 238.3 59.6
2004 365.0 80.2 284.7 59.8
2005 360.3 79.2 281.1 59.0
2006 363.3 79.9 283.4 59.5
2007 369.0 81.1 287.9 60.5
SOURCE : MILNE (2009).
The Swedish economy has reduced its energy and carbon intensity without
suffering in term of growth or jobs, and while developing its “green economy”.
The obvious problem posed by this scenario, like the previous one, is that of legal
and institutional feasibility – due to the unanimity required in tax matters. The
solution might be for a group of countries to launch an “enhanced cooperation”
initiative in order to implement the measure.
Scenario 4: “European carbon-added tax”The fourth scenario is the most ambitious. It is also the only one which allows
for a single carbon price and thus permits a coherent management of the Union’s
climate policy. It is different from the previous scenario in that it provides for the
creation of a genuine European carbon-added tax (CAT), in principle similar to
VAT.30
Levied on all consumption in accordance with its carbon content, this European
CAT also has the advantage of being compatible with the EU ETS – which would
be deductible – and of showing the consumer the “carbon cost” of each act of
consumption. Unlike the other options discussed, the CAT also affects imports,
which considerably reduces problems of competitiveness and thereby weakens the
argument of industries demanding exemptions in the name of “carbon leakage”.
This scenario is therefore the only one which does not raise the problem of a carbon
levy at borders. The “carbon-added tax” solution is clearly superior to the “border
levy”, since even if such a levy is not incompatible with the WTO charter (box 3)31,
it risks provoking retaliatory trade measures, whereas in the case of the CAT the
law of the single market would demand non-discrimination between European and
foreign products.
It is true that the European CAT poses numerous problems of feasibility, both
legal and institutional – in particular that of unanimity, as with the two previous
scenarios. It also poses a technical problem, often cited in recent debates (parti-
cularly in France) in criticism of such a mechanism. This problem does not however
30 For a carbon-added tax proposal for France, see Laurent and Le Cacheux (2009b).31 See also Godard (2006).

52 - AN EVER LESS CARBONATED UNION? AN EVER LESS CARBONATED UNION? - 53
Studies &
74ResearchResearch
seem insurmountable, to the extent that an increasing number of businesses
make “carbon reports” on which the European CAT could be based. Determining
the “added carbon” made by companies involved in the production-transport-dis-
tribution sphere assumes that the companies do a sort of “carbon bookkeeping”,
which the “carbon report” technique allows for. As with existing national carbon
taxes, it would then suffice to impose on each company an amount per tonne of
“added carbon”. The end consumer would thereby pay, on each purchase made, an
amount corresponding to the total carbon emitted during production, treatment,
transport, storage, etc., of the product purchased. He or she would thus be directly
exposed to the “carbon cost” of his or her consumption.32
These different scenarios differ according to three criteria: their ecological effec-
tiveness, their technical feasibility and their institutional feasibility. The following
table summarises these features and suggests that the scenario of “climatic
conversion” is able to garner the widest support.
TABLE 10. FEATURES OF THE DIFFERENT SCENARIOS ENVISAGED
ECOLOGICAL EFFECTIVENESS
TECHNICAL FEASIBILITY
INSTITUTIONAL (LEGAL/POLITICAL) FEASIBILITY
SCENARIO 1 : TAXIFY -- + + +
SCENARIO 2 : CLIMATIC CONVERSION
+ + + +
SCENARIO 3 : « EUROPEAN GREEN SHIFT »
+ - --
SCENARIO 4 : ECAT + + -- --
32 The “Emission factors guide” (Ademe, http://www2.ademe.fr/) provides an interesting illustration of such carbon accounting. There is also the practice of carbon labelling, which certain large retail chains are starting to implement (for example, Casino in France, Tesco in the UK). It is true that such a carbon-added tax should be put into practice in a prag-matic manner, just as French VAT was, given that many small businesses do not practice real bookkeeping. It is also true that determining the carbon content of imports assumes a level of traceability that will probably not be immediately feasible; but it is possible to apply average coefficients.
5.2. Use of revenues
Whatever the characteristics of the carbon taxation, the choice of how to use the
revenues is crucial – both for the tax’s political acceptability and from the point
of view of effectiveness against climate change, and also perhaps for its role in
increasing the Union’s energy independence. It is well known that taxes based
(directly or indirectly) on energy consumption have a regressive effect: low-income
households spend more of their budget on energy, and so carbon taxation will tend
to weigh more heavily on them. Such a regressive effect is particularly easy to com-
pensate given that the carbon tax does not aim to increase tax revenues – it is
rather destined to be redistributed. But the possible choices of destination are
numerous and have important consequences for the effectiveness of the policy.
Certain governments have been able to take measures to reduce and even compen-
sate for the effects, generally socially regressive, of the implementation of environ-
mental taxes (in particular, Germany with the 1999 tax reform and Sweden with its
reform of 2001). There is a question over what type of compensation best allows
a maximal effectiveness of climate taxation. In this regard, direct compensation
measures (rebates, tax credits, financial transfers) are preferable to measures of
exemption or tax reduction. Yet, according to the OECD (2007), in practice govern-
ments are often far from this integrated social-ecological approach: “In certain
cases, considerations of redistribution are not at all taken into account, or else
only at a late stage in the process of designing the policy, meaning a less coherent
treatment. The result can be strong opposition and ineffective environmental
measures, hence higher costs for society than is necessary.”
In the European context, the question of how to use the revenues is further compli-
cated by the debate surrounding the reform (universally desired) of the European
budget and the possible introduction of a new “own resource” – which could be
the revenues from the auction of EU ETS permits, a carbon levy at EU borders or
even all or part of the European CAT33. Such an allocation of funds would produce
33 The “European carbon tax” is one of the options for new own resources discussed in the study by Begg, Enderlein, Le Cacheux and Mrak (2008) on reform of the financing of the European budget. But it must also be remembered that in spring 2008 the European Council declared itself in favour of returning to member-state budgets the revenues from auc-tions of emission permits, when such auctions are organised.
54 - AN EVER LESS CARBONATED UNION? AN EVER LESS CARBONATED UNION? - 55
Studies &
74ResearchResearch
resources necessary to finance the carbon-conversion assistance promised to
developing countries. At around 15 billion euros per year at a minimum, according
to recent European Commission figures, there is little chance that this aid will
be financed from national budgets (given the present state of European public
finances) and the current size of the European budget does not suffice. Similarly,
the European budget could potentially assume an important share of the EU’s
spending on “energy and climate conversion”, in particular where such spending
has a quality of “European public goods” – research and development, infrastruc-
ture of transport or energy distribution, etc. This would add a supplementary justi-
fication to the choice to direct these revenues to the Union’s budget.
As with the methods of taxation, there exist several possible options for the allo-
cation of revenues. Three principal ones are mentioned here. It is perfectly concei-
vable to combine the options: most of the countries with experience in carbon
taxation have done so.
Scenario 1: “Double dividend”Talked about for as long as European ecological taxes have been studied34, the
solution capable of generating a “double dividend” – that is, a reduction in GHG
emissions and a positive effect on growth and jobs – is particularly attractive
from the point of view of business competitiveness. In this scenario, carbon-tax
revenues would be used to reduce charges on labour. The increased tax on busi-
nesses’ energy consumption or sales would thereby be compensated with lighter
labour costs. The option is particularly attractive in a context of high unemploy-
ment and, according to available assessments35, generally results in increased
growth and a weak impact, if any, on average prices.
Scenario 2: “Direct redistribution”Carbon levies – whatever their exact features – have a generally negative impact
on household purchasing power, so it can be tempting to redistribute revenues to
34 See in particular the study by Pierce and Smith (1991) and the survey by Chiroleu-Assouline (2000).35 See in particular the recent assessment made for the French economy by Combet, Ghersi and Hourcade (2009). However, it must be noted that the conclusions of such assessments are somewhat unreliable and particularly depend-ent on their underlying hypotheses and the choice of numeric values. Precise analyses at the level of the European economy would be useful.
households as compensation. This is the “green cheque” idea, promoted in France
by Nicolas Hulot and included, in the form of a tax credit, in the French version of
carbon tax introduced in autumn 200936 . In various forms, it is also the solution
chosen by most countries which have already experimented with carbon taxation.
Direct redistribution to households has another important advantage in terms of
political economy – it makes clear that the objective of the new tax is not to procure
additional revenues for European public bodies, a suspicion always present in the
minds of tax-wary citizens. In addition, such a solution makes possible the precise
targeting of redistribution, which can be calibrated by socio-economic criteria.
In terms of disadvantages, it generates less growth and employment than the
previous scenario, and it neglects direct compensation for the higher production
costs of businesses. Neither does it assist the carbon conversion of households,
and it therefore risks having poor efficiency in terms of climate change.
Scenario 3: “European budget”If the aim is to maximise the impact of the new carbon tax in rapidly reducing GHG
emissions, the most efficient solution is probably to use all or some of the tax
revenues to finance spending which assists the climatic conversion of Europe’s
economy – concerning both producers and consumers. In this scenario, public
spending on research and development (in particular from the European budget)
could naturally be targeted, but it would also be possible to finance European
low-carbon transport infrastructure, energy distribution networks, etc. Also in this
rubric, programmes of energy conversion for housing would enable – as in the
previous scenario – the targeting of the poorest households; the resulting lower
energy consumption would represent a permanent compensation for the lower pur-
chasing power caused by the carbon tax.37 Lastly, revenues could help finance inter-
national aid for climatic conversion, promised to developing countries in exchange
for their far-reaching commitments to control emissions (in the framework of the
Copenhagen climate conference of December 2009). The financing of adaptation
in developing countries – which will bear 80% of the consequences of climate
36 Note that in his proposal for a “general tax on carbon” in the US (January 2009) Jim Hansen also suggested return-ing to households the totality of revenues in the form of a fixed payment.37 In this scenario, it is also possible to imagine a specific agricultural policy aiming to assist the “climatic conversion” of European agriculture. It should be remembered that agricultural GHG emissions, which include methane as well as carbon dioxide, are sizeable and pose a problem specific to this sector: efficiency of the climate policy demands that all emissions be taxed, but the cost for the sector would then be very high.
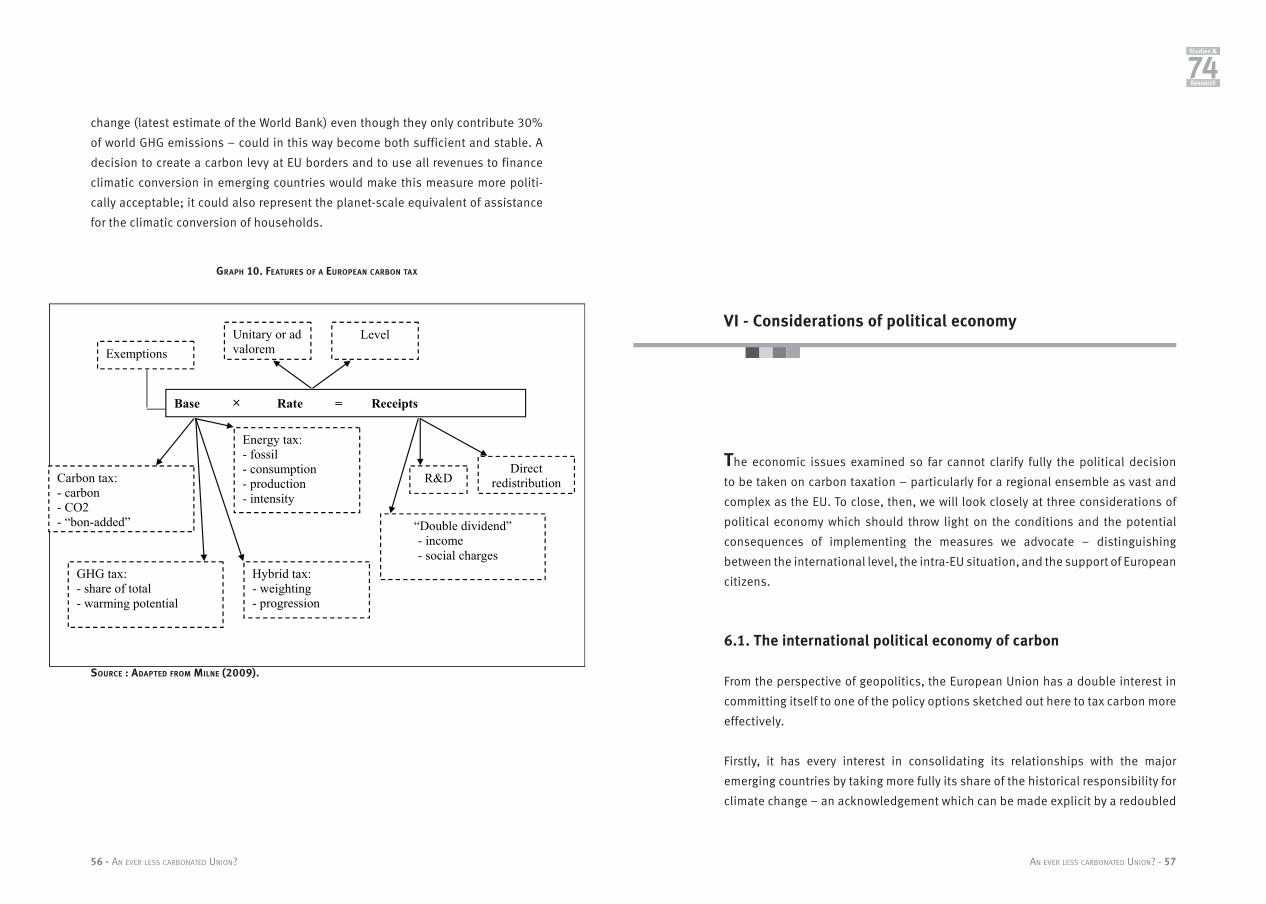
56 - AN EVER LESS CARBONATED UNION? AN EVER LESS CARBONATED UNION? - 57
Studies &
74ResearchResearch
change (latest estimate of the World Bank) even though they only contribute 30%
of world GHG emissions – could in this way become both sufficient and stable. A
decision to create a carbon levy at EU borders and to use all revenues to finance
climatic conversion in emerging countries would make this measure more politi-
cally acceptable; it could also represent the planet-scale equivalent of assistance
for the climatic conversion of households.
GRAPH 10. FEATURES OF A EUROPEAN CARBON TAX
Base × Rate = Receipts
Carbon tax: - carbon - CO2 - “bon-added”
GHG tax: - share of total - warming potential
Energy tax: - fossil - consumption - production - intensity
Hybrid tax: - weighting - progression
Direct redistribution R&D
“Double dividend” - income - social charges
Exemptions Level Unitary or ad
valorem
SOURCE : ADAPTED FROM MILNE (2009).
VI - Considerations of political economy
The economic issues examined so far cannot clarify fully the political decision
to be taken on carbon taxation – particularly for a regional ensemble as vast and
complex as the EU. To close, then, we will look closely at three considerations of
political economy which should throw light on the conditions and the potential
consequences of implementing the measures we advocate – distinguishing
between the international level, the intra-EU situation, and the support of European
citizens.
6.1. The international political economy of carbon
From the perspective of geopolitics, the European Union has a double interest in
committing itself to one of the policy options sketched out here to tax carbon more
effectively.
Firstly, it has every interest in consolidating its relationships with the major
emerging countries by taking more fully its share of the historical responsibility for
climate change – an acknowledgement which can be made explicit by a redoubled

58 - AN EVER LESS CARBONATED UNION? AN EVER LESS CARBONATED UNION? - 59
Studies &
74ResearchResearch
effort to tax GHG emissions efficiently. The context of this commitment – negotia-
tions for the Copenhagen summit and beyond – give the EU a pivotal role on the
world stage. With more commitment to reducing its own GHG emissions, the EU
could unblock the international climate negotiations. Europe’s objectives are by
far the most ambitious yet placed on the table by developed countries, but they still
lack credibility, given the flaws in the economic instruments used to achieve them
– flaws that the climate-energy package has only partially dealt with (cf. supra).
At the same time, it will be easier to obtain an international accord that resembles
the IPCC’s recommendations if there is an effective means of pressure to persuade
emerging countries to commit themselves to sustainable development. Carbon
tax is one such means, and it does not necessitate discriminatory customs adjust-
ments at the border if all products are taxed. The question of climate change must
become the priority area in which the EU exercises its power to set standards.
6.2. The political economy of European energy
The other obvious geopolitical issue is the EU’s energy security, which today
suffers from the massive dependence on imported fossil energy, above all Russian.
In its “European action plan for security and energy solidarity”, presented in
November 2008, the European Commission made progress in acknowledging this
major challenge for the EU, but there is a mountain to climb. The total volume of
imports as a share of primary-energy consumption is not only considerable (54.2%
in 2005) but it is increasing (by 4 points since 2000). Russia alone provided 18% of
the EU’s primary energy, up 5 points since 2000. In total, in 2005, 40% of European
CO2 emissions from coal and 90% of emissions from oil products were derived
from foreign supplies. There is thus a link between carbon taxation, de-carbonated
growth and energy security which must serve as the foundation for a new European
approach to the energy issue.
Of course, major obstacles obstruct the paths of the scenarios we propose. The
most important is the diversity of Europe’s energy mixes (see graph 12).
GRAPH 12. ENERGY MIXES IN THE EU 27, IN % OF CONSUMPTION OF PRIMARY ENERGY, 2005
0%
10%
20%
30%
40%
50%
60%
70%
80%
90%
100%
EU 27EU 15
Estonia
Slovakia
Czech
Rep.
Poland
Bulgaria
Romania
Hungary
SwedenLa
tvia
Finland
Lithuania
France
Slovenia UK
Germany
Belgium
Netherla
nds
Austria
Denmark
Italy
spain
Ireland
Greece
Portugal
Luxem
bourg
Cyprus
Malta
Coal and lignite Oil Gas Nuclear Renewables
SOURCE : EEA.
The way forward is to find the most efficient and fair key to distributing effort in
order to determine a possible level of taxation of energy and carbon.
It should be noted that targets for reductions of GHG emissions outside the EU
ETS have already been calculated and negotiated, and that these must therefore
represent the starting point for any new discussion. Nonetheless, it remains
possible to examine targets other than these – ones focused on the evolution of
GHG emissions and the European economics production structures.
A first possible key for distribution would be the responsibility of individual
member states in GHG emissions, which can be judged in two ways: by the share of
the total EU emissions, and by emissions per inhabitant (table 11).

60 - AN EVER LESS CARBONATED UNION? AN EVER LESS CARBONATED UNION? - 61
Studies &
74ResearchResearch
TABLE 11. MEMBER STATES AND GHG EMISSIONS IN 2007
SOURCE : EEA.
EMISSIONS PER INHABITANT, IN MG TONS CO2 E
SHARE OF COUNTRY IN TOTAL GHG OF EU 27
LUXEMBOURG27.1 0.3
ESTONIA 16.4 0.4
IRELAND 16.0 1.4
FINLAND 14.8 1.6
CZECH REPUBLIC 14.7 3.0
CYPRUS 13.0 0.2
NETHERLANDS 12.7 4.1
BELGIUM 12.4 2.6
DENMARK 12.2 1.3
GREECE 11.8 2.6
GERMANY 11.6 19.0
AUSTRIA 10.6 1.7
UK 10.5 12.6
POLAND 10.5 7.9
SLOVENIA 10.3 0.4
SPAIN 9.9 8.8
BULGARIA 9.9 1.5
ITALY 9.3 11.0
SLOVAKIA 8.7 0.9
FRANCE 8.4 10.5
PORTUGAL 7.7 1.6
HUNGARY 7.5 1.5
MALTA 7.4 0.1
LITHUANIA 7.3 0.5
SWEDEN 7.2 1.3
ROMANIA 7.1 3.0
LATVIA 5.3 0.2
In view of a hybrid carbon-energy taxation it would probably be necessary to
combine this first indicator with two other criteria: energy intensity and carbon
intensity. Respectively, these measures – per unit of GDP – the quantity of energy
used and the carbon emitted. Here it is useful to distinguish between the EU 15
and the new member states, given the gaps in development. As an illustration,
Table 12 is an equal-share weighting of energy and carbon intensity.
TABLE 12. ENERGY AND CARBON INTENSITY OF STATES IN 2005
CARBON INTENSITY (RATIO OF TONS OF CO2 AND 1000S OF
US $ AT 2000 PPP)
ENERGY INTENSITY (1000 TOE PER BILLION EUROS IN
PPP)
HYBRID INDICATOR, EQUAL WEIGHTING
AUSTRIA 0.33 150 75
BELGIUM 0.51 203 102
CYPRUS 0.53 209 105
DENMARK 0.32 105 53
FINLAND 0.37 230 115
FRANCE 0.24 177 89
GERMANY 0.39 162 81
GREECE 0.42 613 307
IRELAND 0.31 112 56
ITALY 0.34 152 76
LUXEMBOURG 0.45 184 92
MALTA 0.56 222 111
NETHERLANDS 0.54 183 92
PORTUGAL 0.35 210 105
SPAIN 0.38 194 97
SWEDEN 0.22 175 88
UK 0.32 131 66
AVERAGE 0.39 201 101
HUNGARY 0.39 434 217
POLAND 0.63 435 218
SLOVAKIA 0.52 702 351
SLOVENIA 0.42 296 148
LATVIA 0.32 375 188

62 - AN EVER LESS CARBONATED UNION? AN EVER LESS CARBONATED UNION? - 63
Studies &
74ResearchResearch
LITHUANIA 0.37 479 240
ESTONIA 0.95 200 101
BULGARIA 0.84 1110 555
CZECH REPUBLIC 0.63 609 305
ROMANIA 0.54 734 367
AVERAGE 0.56 537 269
SOURCE : EIA AND EEA.
Lastly, it is important to know the current rate of implied taxation of the CO2 content
of fossil energy. To do this, we exclude from energy revenues those which are
based on electricity production from renewable or nuclear power, and we divide
this amount by CO2 emissions.
TABLE 13. EFFECTIVE TAX RATE (IN EUROS PER TON OF CO2) IN 2004
TAX RATE ON FOSSIL FUELS
DENMARK 66
SWEDEN 64
ITALY 63
FRANCE 63
AUSTRIA 63
LUXEMBOURG 62
UK 61
PORTUGAL 53
IRELAND 43
GERMANY 42
SPAIN 35
BELGIUM 33
NETHERLANDS 29
GREECE 17
AVERAGE 50
SOURCE : ADEME.
6.3. The political economy of European public opinion
What do we know about the opinions of citizens on the climate change question,
and about their willingness to pay more for energy as part of the fight against
climate change? Eurobarometer38 tells us about the level of concern among citizens
over climate change, and it appears particularly high.
The latest Eurobarometer findings on “attitudes of Europeans concerning the
environment” shows that environmental protection is judged “very important”
by 64% of citizens questioned (96% judge it “very” or “somewhat” important).
Moreover, Europeans now consider that environmental policy should be made at
EU level (67%) rather than national level (21%). 82% of them say that harmonised
European environment legislation is necessary, and nearly 80% would accept that
the EU spends more on environmental protection even if this means less spending
in other areas. Among environmental topics, climate change is the number-one
concern, cited by 57%.
According to the survey on “Attitudes of Europeans towards climate change”, 62%
of European citizens consider that “global warming / climate change” is the most
serious problem confronting the world (the second highest figure, just behind
“poverty, lack of food and drinking water”). The survey confirms numerous other
studies on this question.
More unusually, the survey also asks about the cost of fighting climate change.
44% of Europeans declare themselves willing to pay between 1% and 30% more
for green energy, whereas 30% are not prepared to pay more. The citizens most
willing to pay more reside in Denmark, Greece, Slovenia and the Netherlands.
Romanians, Germans and British are the least inclined to spend more. In terms of
the exact amount that citizens would be prepared to spend in addition, on average,
we note that Danes, Swedes and Bulgarians seem to be the most generous, and
Portuguese, Spanish and Austrians the least.
38 « Europeans attitudes towards climate change », Eurobameter September 2008 and « Attitudes of Europen citizens towards environment », Eurobameter March 2008.

64 - AN EVER LESS CARBONATED UNION? AN EVER LESS CARBONATED UNION? - 65
Studies &
74ResearchResearch
TABLE 14. EUROPEAN HOUSEHOLDS’ WILLINGNESS TO PAY
Personally, how much would you be willing to pay for energy produced from sources which emit
less greenhouse gas, in order to fight climate change? How much more, on average, as a percen-
tage, would you be willing to pay?
WILLING TO PAY MORE NOT WILLINGAVERAGE EXTRA SPENDING CONSENTED TO, AS % INCREASE
EL 71% 16% 11.1
NL 68% 19% 13.1
SI 68% 16% 11.5
SE 68% 15% 18.7
BE 64% 25% 10.8
FI 59% 25% 13.8
CY 58% 14% 15.2
AT 57% 21% 9.7
SK 49% 17% 12.4
PL 48% 22% 12.6
HU 47% 24% 12.2
EE 44% 27% 13.7
LU 44% 22% 12.3
DE 42% 42% 10.5
FR 42% 38% 12
LT 42% 32% 12.9
CZ 42% 24% 12.2
IT 41% 16% 11.9
ES 40% 23% 8.3
IE 39% 19% 14.6
UK 36% 41% 13.3
LV 31% 38% 14.8
RO 29% 49% 16.6
MT 27% 36% 14.8
BG 27% 33% 18.2
PT 26% 32% 7.2
CY (TCC) 46% 13% 31
TR 63% 37% 12.9
HR 61% 20% 14
MK 45% 18% 16.4
SOURCE : EUROBAROMETER.

66 - AN EVER LESS CARBONATED UNION? AN EVER LESS CARBONATED UNION? - 67
Studies &
74ResearchResearch
Conclusion: debate is fine, but it is time to decide
The aim of this study was not (as we have reiterated already) to assess the effecti-
veness of Europe’s strategy on climate change – that is, the strategy’s relevance to
this unprecedented challenge to our societies. We have sought, rather, to measure
the efficiency of the strategy – in other words, the relationship between declared
ambitions and mobilised means.
This exercise seems timely to us because in 2009-2010 the EU is winding up the
period begun in 2000 at the Lisbon Council and preparing to make sustainable
development the centrepiece of its new growth strategy for the coming decade.
The European environmental strategy must not turn out in 2020 like the Lisbon
Strategy in 2010 – victim of a persistent gap between declarations and results. As
we have tried to show, this is a question not only of the European Union’s interest
but also of the global public interest.
At the conclusion of this study, we perceive three certainties. The first is that in
spite of the considerable progress made, the tangible reality of a low-carbon
European economy will only come about if carbon taxation is thoroughly reformed.
The second certainty is that this reform is anything but obvious: numerous options
exist and only a wide-ranging democratic debate will allow a choice between their
68 - AN EVER LESS CARBONATED UNION? AN EVER LESS CARBONATED UNION? - 69
Studies &
74ResearchResearch
References
Acemoglu, D., Aghion, P., Bursztyn, L, Hemous, D (2009). «The Environment and Directed
Technical Change», NBER Working Paper No.15451, October 2009
Agnolucci, P (2004), Ex-post evaluations of CO2-based taxes: a survey, Londres: Tyndall
Centre for Climate Change Research Working Paper
Begg, I.; Enderlein, H., Le Cacheux, J and Mrak (2008) Financing of the European Union
budget, study for the European Commission, Directorate-General for Budget.
Cambridge Econometrics (2005), Modelling the Initial Effects of the Climate Change
Levy. Report submitted to HM Customs and Excise by Cambridge Econometrics,
Department of Applied Economics, University of Cambridge and the Policy Studies
Institute.
Chiroleu-Assouline (2001) Le double dividende : les approches théoriques, Revue
française d’économie, vol.16, n°2, 119-147.
Coase, R. H. (1960) « The Problem of Social Cost», Journal of Law and Economics, Vol.
3. (Oct., 1960), pp. 1-44.
Combet, E., Hersi, F, Hourcade, J-C (2009), «Carbon tax and equity: A sheer matter of
policy design», IOP Conference Series: Earth and Environmental Science, Volume 6,
Issue 10
Commission Quinet (2009), Le valeur tutélaire du carbone: rapport de la Commission
présidé par Alain Quinet, Paris: Centre d’Analyse Stratégique, num 16 2009.
respective merits. The third certainty is that this debate will be long, complex and
difficult. It must be begun without delay. The European Union cannot allow another
twenty years to be lost in the struggle against climate change. In autumn 2009
both the Swedish presidency of the Union and the European Commission have
announced initiatives for a new European carbon tax. Will they finally be put into
effect?

70 - AN EVER LESS CARBONATED UNION? AN EVER LESS CARBONATED UNION? - 71
Studies &
74ResearchResearch
Conseil Européen de Bruxelles (2007), Conclusions de la Présidence, 9 March 2007.
DEFRA (Department for Environment, Food and Rural Affairs) (2007), The Social Cost
of Carbon and the Shadow Price of Carbon: What they are and How to Use them in
Economic Appraisal in the UK, Economics Group of DEFRA, December
European Commission (1991), A Community Strategy to Limit Carbon Dioxide Emissions
and to Improve Energy Efficiency, SEC(91) 1744 final, 14 Oct.
European Commission (1992), Proposal for a Council Directive Introducing a Tax on
Carbon Dioxide Emissions and Energy, COM (92) 226, 30 June.
European Commission (2007), Green Paper on Market-based Instruments for
Environment and Related Policy Purposes, COM (2007) 140, 28 March.
European Environment Agency (2005), Market-based Instruments for Environmental
Policy in Europe, Copenhage: European Environment Agency.
European Environment Agency (2009), Transport at a crossroads-TERM 2008: indicators
tracking transport and environment in the European Union, Copenhague : European
Environment Agency
Godard, O. (2007) Unilateral European Post-Kyoto climate policy and economic
adjustment at EU borders, Paris: École polytechnique
Gras, O. (2009) L’introduction d’une taxe carbone et ses effets sur la compétitivité e
France, Mémoire de stage, OFCE, Miméo, September.
Grejbine, A. et Laurent, E., (2008) : « La méthode suédoise : la cohésion sociale au défi
de l’adaptation », CERI studies, September 2008.
Guesnerie (2003) Kyoto et l’économie de l’effet de serre, CAE report, n°39, Conseil
d’analyse économique, La Documentation française, 14 January.
Hansen, James E (2009) «Carbon Tax & 100% dividend vs Tax and Trade», testimony to
Committee of Ways and Means, US House of Representatives, February 2009.
IMPACT, Handbook on Estimation of External Cost in Transport Sector (produced within
the study : Internalisation Measures and Policies for All external Cost of Transport
(2007). Authors: Maibach M., Schreyer C., Sutter D. (INFRAS) ; Van Essen H. P., Boon B.
H., Smokers R., Schroten (CE Delft) ; Doll C. (Fraunhofer Gesellschaft – ISI) ; Pawlowska
B., Bak M. (University of Gdansk), DELFT, December 2007.
Milne, Janet E. (ed.), (2009) The Reality Of Carbon Taxes In The 21st Century, Vermont
Law School’s Environmental Tax Policy Institute, 2009.
Laurent, E and Le Cacheux, J (2009a), Le grand bluff: l’Union Européenne et les États-
Unis à six mois de Copenhague, Lettre de l’OFCE num 310, 15 June 2009
Laurent, E and Le Cacheux, J (2009b), Taxe carbone: TCA contre CO2, Lettre de l’OFCE
num 311, 6 July 2009
OECD, (2006a) : The Social Dimension of Environmental Policy (Policy Brief),
Organisation for Economic Co-operation and Development, June 2006.
OECD, (2006b) : L’économie politique des taxes liées à l’environnement, Organisation
for Economic Co-operation and Development, .
Pearce, D. (1991),»The Role of Carbon Taxes in Adjusting to Global Warming», The
Economic Journal 101, 938-48.
Pearson, M. and S. Smith (1991) The European carbon tax. An assessment of the
European Commission’s proposal, IFS Studies, December.
Pigou, A.C. (1920), The Economics of Welfare, Macmillan and Co., Ltd., London.
Tirole (2009) Politique climatique : une nouvelle architecture international, CAE report,
n°87, Conseil d’analyse économique, La Documentation française, 19 October.
Tol, R.S.J. (2002a), «Estimates of the Damage Costs of Climate Change - Part 1:
Benchmark Estimates», Environmental and Resource Economics, 21, (1), 47-73.
Tol, R.S.J. (2002b), «Estimates of the Damage Costs of Climate Change - Part II: Dynamic
Estimates», Environmental and Resource Economics, 21, (2), 135-160.
WTO/UNEP (2009), Commerce et changement climatique, WTO report/PNUE
Weitzman, M.L. (1974), « Prices vs. Quantities», Review of Economic Studies, 41, (4),
477- 491.
Weitzman, M.L. (2009), «On Modeling and Interpreting the Economics of Catastrophic
Climate Change», The Review of Economics and Statistics, Vol XCI, February 2009 n°1.

72 - AN EVER LESS CARBONATED UNION? AN EVER LESS CARBONATED UNION?
Studies &
74ResearchResearch
Previously Published Studies
Italian entrepreneurs’ rush towards Romania. Circulations, asymmetries, narra-
tions - Aziliz Gouez and Lynda Dematteo (August 2009).
Democracy in the EU and the Role of the European Parliament - Federal Trust, Institut
für Europäische Politik, Centro Studi sul Federalismo, Istituto Affari Internazionali,
Notre Europe (March 2009).
Health: A vital issue for Europe - Sébastien Guigner (December 2008).
The Czech EU Presidency: background and priorities - Petr Drulák (December 2008).
Social experimentation in Europe: towards a more complete and effective range of the
EU action for Social Innovation - Marjorie Jouen (November 2008).
UE-ASEAN: two to tango? - David Camroux (June 2008).
CAP Reform beyond 2013: An idea for a longer view - Jean-Christophe Bureau and
Louis-Pascal Mahé (May 2008).
The political economy of regional integration in southern Africa – Mills Soko (December
2007).
What Future Framework for Agriculture after 2013? - Jean-Christophe Bureau, Nadège
Chambon, Pierre Lepetit, Pierre Rainelli. With the Contributions of François Bonnieux,
Sylvie Bonny, Nadège Chambon, Pierre Dupraz, Isabelle Garzon, Aziliz Gouez, Michiel
Keyser, sophie Méritet, Karine Latouche and Josef Schmidhuber (December 2007).
AN EVER LESS CARBONATED UNION?
68
AN EVER LESS CARBONATED UNION?
6868Studies &StudiesStudiesStudiesStudies &Studies & & & & &
74ResearchResearchResearchResearchResearchResearchResearchResearchResearchResearch
Power to the People: Promoting Investment in Community-Owned and Micro-Scale
Distributed Electricity Generation at the EU Level - Stephen Boucher, Columbia
University Workshop (May 2007). Funding the EU Budget with a Genuine Own Resource:
The Case for a European Tax - Jacques Le Cacheux (May 2007).
Wine and Europe: the Metamorphoses of a Land of Choice – Aziliz Gouez and Boris
Petric (March 2007).
Germany and Europe: New Deal or Déjà vu? – Ulrike Guérot (December 2006)
Regional Economic Integration in South America - Alvaro Artigas (November 2006)
The Impact of Television Media on the French Referendum Campaign in 2005 - Jacques
Gerstlé (November 2006).
Plan B: How to Rescue the European Constitution? - Andrew Duff (October 2006).
A transition Presidency? An Inside View of Finland’s - Second Presidency of the EU -
Teija Tiilikainen (July 2006).
The Vision of Europe in the New Member States – Notre Europe asked different
Personalities of the New Member States to give their Vision of Europe in 2020 - Gaëtane
Ricard-Nihoul, Paul Damm and Morgan Larhant (July 2006).
Sense and Flexibility – Striking a Balance between Sovereignty and Harmonisation in
the Implementation of the EU ETS - Stephen Boucher, University of Columbia Workshop
on EU ETS (May 2006).
The Question of European Identity - Aziliz Gouez, Marjorie Jouen and Nadège Chambon
(January 2006).
Report on East Asian Integration: Opportunities and Obstacles for Enhanced Economic
Cooperation - Co-ordinated by Heribert Dieter, With Contributions from Jean-Christophe
Defraigne, Heribert Dieter, Richard Higgott and Pascal Lamy (January 2006).
An Honest Broker in Difficult Times: Austria’s Presidency of the EU - Sonja Puntscher-
Riekmann, Isabella Eiselt and Monika Mokre (December 2005).
The European Constitution and Deliberation: the Example of Deliberative Focus Groups
ahead of the French Referendum of 29 May 2005 - Henri Monceau (November 2005).
The French “no” vote on May 29, 2005: Understand, Act - Gaëtane Ricard-Nihoul
(October 2005).
Defining a new European Social Contract - Marjorie Jouen and Catherine Palpant
(September 2005).
The best laid plans: Britain’s Presidency of the Council of European Union - Anand
Menon and Paul Riseborough (June 2005).
European Budget: the Poisonous Budget Rebate Debate - Jacques Le Cacheux (June
2005).
Analysis of European Elections (June 2004) - Céline Belot and Bruno Cautrès (June
2005).
Why they wanted Europe: A Call of 12 french Pionners of European integration - Jean-
Louis Arnaud (May 2005).
Ratification and Revision of the Constitutional Treaty - Henri Oberdorff (May 2005).
Luxembourg at the Helm: Experience, Determination and Self Denial - Mario Hirsch
(December 2004).
A Driving Force Despite Everything: Franco-German Relations and the Enlarged European
Union - Martin Koopmann (November 2004).
Europe and its Think Tanks: a Promise to be Fulfilled - Stephen Boucher, Benjamin
Hobbs, Juliette Ebelé, Charlotte Laigle, Michele Poletto, Diego Cattaneo and Radoslaw
Wegrzyn (October 2004).
A View from Outside: the Franco-German Couple as seen by their Partners - Matt
Browne, Carlos Closa, Soren Dosenrode, Franciszek Draus, Philippe de Schoutheete
and Jeremy Shapiro (April 2004).
Leading from Behind: Britain and the European Constitutional Treaty - Anand Menon
(January 2004).
US Attitudes towards Europe: a Shift of Paradigms? - Timo Behr (November 2003).
Giving Euro-Mediterranean Cooperation a breath of fresh air - Bénédicte Suzan (October
2003).
Italy and Europe 2003 Presidency - Roberto Di Quirico (July 2003).
European Attitudes towards Transatlantic relations 2000-2003: an Analytical Survey -
Anand Menon and Jonathan Lipkin (June 2003).
Large and Small Member States in the European Union: Reinventing the Balance -
Paul Magnette and Kalypso Nicolaïdis (May 2003).
Enlargement and Investment in Central and Eastern Europe - Bérénice Picciotto (May
2003).
The Institutional Architecture of the European Union: a third Franco-German way? -
Renaud Dehousse, Andreas Maurer, Jean Nestor, Jean-Louis Quermonne and Joachim
Schild (April 2003).
A New Mechanism of Enhanced Co-operation for the Enlarged Union - Eric Philippart
(March 2003).

AN EVER LESS CARBONATED UNION? AN EVER LESS CARBONATED UNION?
Studies &
74ResearchResearch
Greece, the European Union and 2003 Presidency - George Pagoulatos (December
2002).
The Question of the European Government - Jean-Louis Quermonne (November 2002).
The European Council - Philippe de Schoutheete and Helen Wallace (September 2002).
Multilevel Government in three Eastern and Central European Candidates Countries:
Hungary, Poland and Czech Republic (1990-2001) - Michal Illner (June 2002).
The Domestic Basis of Spanish European Policy and the 2002 Presidency - Carlos Closa
(December 2001).
The Convention of a Charter of Fundamental Rights: a Method for the Future? - Florence
Deloche Gaudez (December 2001).
The Federal Approach to the European Union or the Quest for an Unprecedented
European Federalism - Dusan Sidjanski (July 2001).
The Belgian Presidency 2001 - Lieven de Winter and Huri Türsan (June 2001).
The European Debate in Sweden - Olof Petersson (December 2000).
An enlargement Unlike the others ... Study of the Specific Features of the Candidate
Countries of Central and Eastern Europe - Franciszek Draus (November 2000).
The French and Europe: the State of the European Debate at the Beginning of the French
presidency - Jean Louis Arnaud (July 2000).
Portugal 2000: the European way - Alvaro de Vasconcelos (January 2000).
The Finnish Debate on the European Union - Esa Stenberg (August1999).
The American Federal Reserve System: Functioning and Accountability - Axel Krause
(April 1999).
Making EMU work - partnership Notre Europe and Centro European Ricerche (March
1999).
The Intellectual Debate in Britain on the European Union - Stephen George (October
1998).
Britain and the new European agenda - Centre for European Reform, Lionel Barber (April
1998).
Social Europe, History and Current State of Play - Jean-Louis Arnaud (July 1997).
Reinforced Cooperation: Placebo rather than Panacea - Françoise de la Serre and Helen
Wallace (September 1997).
The Growth Deficit and Unemployment: the Cost of Non-Cooperation - Pierre-Alain Muet
(April 1997).
All our publications are available for free from our Website: www.notre-europe.eu
Legal Mentions
With the support of the European Commission : support to active entities at European level in the field of active
European citizenship.
Neither the European Commission nor Notre Europe are to be held responsible for the manner in which the
information in this text may be used. This may be reproduced if the source is cited.
Dépôt legal
© Notre Europe December 2009