an ecosystem service approach to …...an ecosystem service approach to landscape design and...
TRANSCRIPT

AN ECOSYSTEM SERVICE
APPROACH TO
LANDSCAPE DESIGN
AND MANAGEMENT
Developed by Cardno, John Deere, Syngenta, and the World Resources Institute
Suzanne Ozment, Doug MacNair, Steve Bartell, Barbara Wyse, Rush Childs, Sabina Sheik

Designed and managed landscapes in the U.S.
• 40 million acres of managed turfgrass
• Largest irrigated crop
• 3rd largest overall crop
• Largest land cover in the Chesapeake
• Landscaping $40 billion annual industry

Sustainability efforts influencing landscaping
Building codes
• US Green Building Council
• American National Standards Institute (ANSI)
Regulations and restrictions
• EPA WaterSense Program
• State and municipal watering restrictions
• EPA Guidance on Land Management in the Chesapeake Bay
Non-government sustainability initiatives
• Environmental Institute for Golf
• Sustainable Sites Initiative
• Field to Market: Keystone Alliance for Sustainable Agriculture
• etc

Current sustainability measures focus on inputs
Park Residental lawn Golf course
Water use
Plant protectant
Fertilizer
*Illustrative

An ecosystem services approach
Recreation and aesthetic values
Water purification
Air quality regulation
Local climate control
Soil and water retention

An ecosystem services approach can measure
landscape performance
Water quality
Carbon
Air quality
Net
sin
k N
et
so
urc
e
*Illustrative

Components of a Useful Framework
Comprehensive • Unites environmental, social, and economic values
• On-site and landscape-level
• Looks at the distribution of costs and benefits across stakeholders
Policy relevant • Based on sound science and economics
• Outcomes-focused
• Uses metrics and data that are defensible and easily obtainable
Useful for benchmarking and communications • Metrics are sensitive to change
• Life cycle
• Site-specific

The Ecosystem Service Framework for
Landscape Design and Management
Step 1: Identify
potentially affected
ecosystem services
1.a. Identify the key ecosystem services potentially affected by
landscape management.
1.b. Where possible, specify the cause and effect relationships
among management practices and key ecosystem services.
Step 2: Quantify
ecosystem services
2.a. Choose metrics and methods of quantification.
2.b. Quantify the flow of ecosystem services on the landscape.
Step 3: Value benefits
of ecosystem services
3.a. Classify each priority ecosystem service as providing value to
private resource owners and/or to the broader public to avoid
double counting or omission of benefits.
3.b. Use economic valuation methods that meet appropriate
validity criteria.

Applying the framework to residential
lawns and golf courses

Water quality
Photo Courtesy of Flickr: @scottie32
Metric: Pounds of
nutrients added or
removed from water
runoff
Value: Avoided cost of
implementing
conventional water
treatment measures,
measured in dollars per
pound of nutrients
removed
From the literature:
Avoided costs of
phosphorus removal
may vary from $4 to
$505 per pound

Air quality
Photo Courtesy of Flickr: @Leanne Surfleet
Metric: Tons of
particulate matter (PM)
added or removed from
the atmosphere annually
Value: Percentage
increase of property
value per ton of
particulate matter (PM)
removed
From the literature:
Reducing one ton of PM
is approximately $237
per house
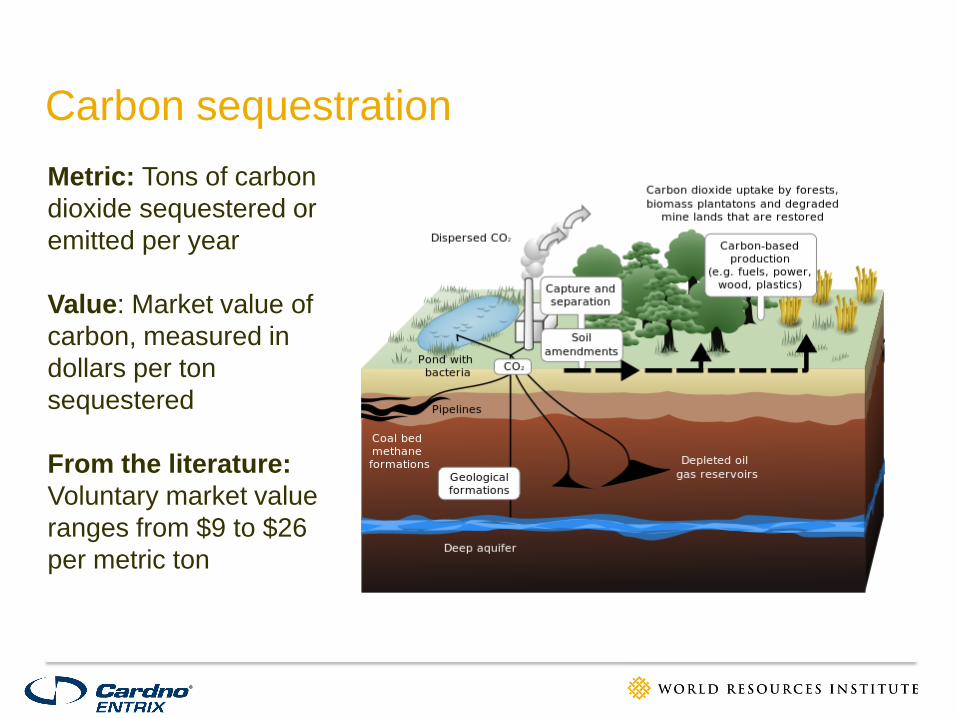
Carbon sequestration
Metric: Tons of carbon
dioxide sequestered or
emitted per year
Value: Market value of
carbon, measured in
dollars per ton
sequestered
From the literature:
Voluntary market value
ranges from $9 to $26
per metric ton

Local climate control
Photo Courtesy of Flickr: @elihpxe8
Metric: Avoided kilowatt
hours of air conditioning
per year
Value: Avoided kilowatt
hours of air conditioning
per year
From the literature:
Shade trees can reduce
air conditioning costs by
7-40%

Water retention
Photo Courtesy of Flickr: @IRRI Images
Metric: Gallons of water
runoff stored or
generated per year
Value: Avoided costs of
implementing
stormwater
management practices,
measured in dollars per
gallon retained
From the literature:
On-lot bioretention areas
cost 15% to 40% less
compared to
conventional stormwater
management costs for
17 municipalities

Soil retention
Photo Courtesy of Flickr: @andrewpaulcarr
Metric: Tons of soil
conserved or
released per year
Valuation: Avoided
cost of replacing
topsoil, measured in
dollars per cubic
yard
From the literature:
Topsoil costs $10-25
per cubic yard
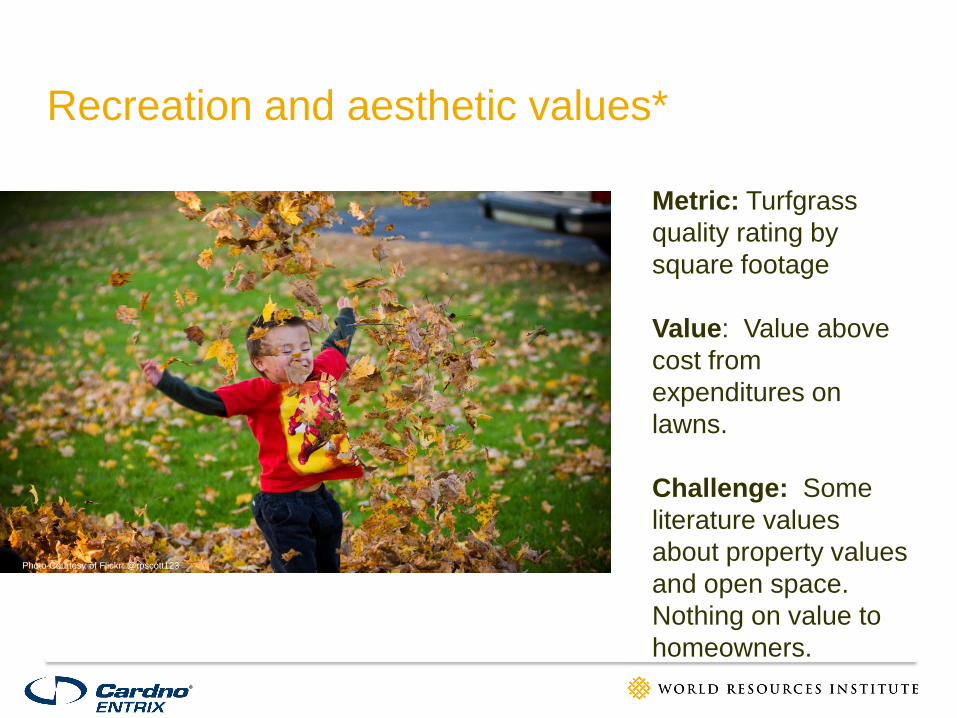
Recreation and aesthetic values*
Photo Courtesy of Flickr: @rpscott123
Metric: Turfgrass
quality rating by
square footage
Value: Value above
cost from
expenditures on
lawns.
Challenge: Some
literature values
about property values
and open space.
Nothing on value to
homeowners.

Step 1: Identify
potentially affected
ecosystem services
Step 2: Quantify
ecosystem
services
Step 3: Value net benefits of ecosystem
service flows
Service Metric Possible valuation
measure
Value to
landowner
Value to
broader
public
Water quality Pounds of nutrients
added or removed from
water runoff
Avoided cost of implementing
conventional water treatment
infrastructure
x
Air quality
Tons of particulate
matter (PM) added or
removed from the
atmosphere
Percentage increase of property
value per household per ton of
particulate matter (PM) removed
from the air
x
Carbon
sequestration
Tons of carbon dioxide
sequestered or emitted
Market value of carbon, measured
in dollars per ton sequestered in a
carbon market
x
Local climate
control
Avoided kilowatt hours
of air conditioning
Avoided energy costs, measured
in dollars per kilowatt-hours
avoided
x x
Water retention Gallons of water runoff
stored or generated per
year
Avoided costs of implementing
conventional stormwater
management practices
x x
Soil retention Tons of soil conserved
or released Avoided cost of replacing topsoil x
Recreation and
aesthetic benefits
Turfgrass quality rating
by square footage
Percentage increase of property
value per additional square
footage of landscaping
x

Relevance to decision making
Strengthening the Business Case for Improved Environmental
Management
• Identifying cost-effective opportunities to achieve
environmental outcomes
• Identifying new revenue streams for landowners
• Improving marketability
Calculating Net-benefits
• And performance-based sustainability metrics
Managing Tradeoffs among Ecosystem Services
• And optimize the provision of valuable ecosystem services

Methodological challenges
• Linking management practices to ecosystem services
provision
• Identifying metrics that hold cross-cutting relevance for
ecological, social, and economic values
• Selecting objective, quantifiable metrics
• Using average versus marginal (per-unit) values
• Normalizing values
• Site specificity

The Ecosystem Services Framework
for Landscape Design and Management
Step 1: Identify
potentially affected
ecosystem services
1.a. Identify the key ecosystem services potentially affected by
landscape management.
1.b. Where possible, specify the cause and effect relationships
among management practices and key ecosystem services.
Step 2: Quantify
ecosystem services
2.a. Choose metrics and methods of quantification by drawing on
environmental models, tools, and peer-reviewed studies.
2.b. Quantify the flow of ecosystem services on the landscape.
Step 3: Value benefits
of ecosystem services
3.a. Classify each priority ecosystem service as providing value to
private resource owners and/or to the broader public to avoid
double counting or omission of benefits.
3.b. Use strategic economic valuation methods that meet
appropriate validity.

Approach to Quantifying & Valuation of Ecosystem Services

Review of Ecosystem Services
The following classifications and descriptions of
ecosystem services were reviewed:
– Ecosystem Services Review (WRI 2008)
– Millennium Ecosystem Assessment (MEA 2005)
– Daily 1997; Daily et al. 2000
– deGroot et al. 2002
– Costanza et al. 2008, Costanza 1997
– Limburg et al. 2002
– National Academy of Science 2005
– Helliwell 1969
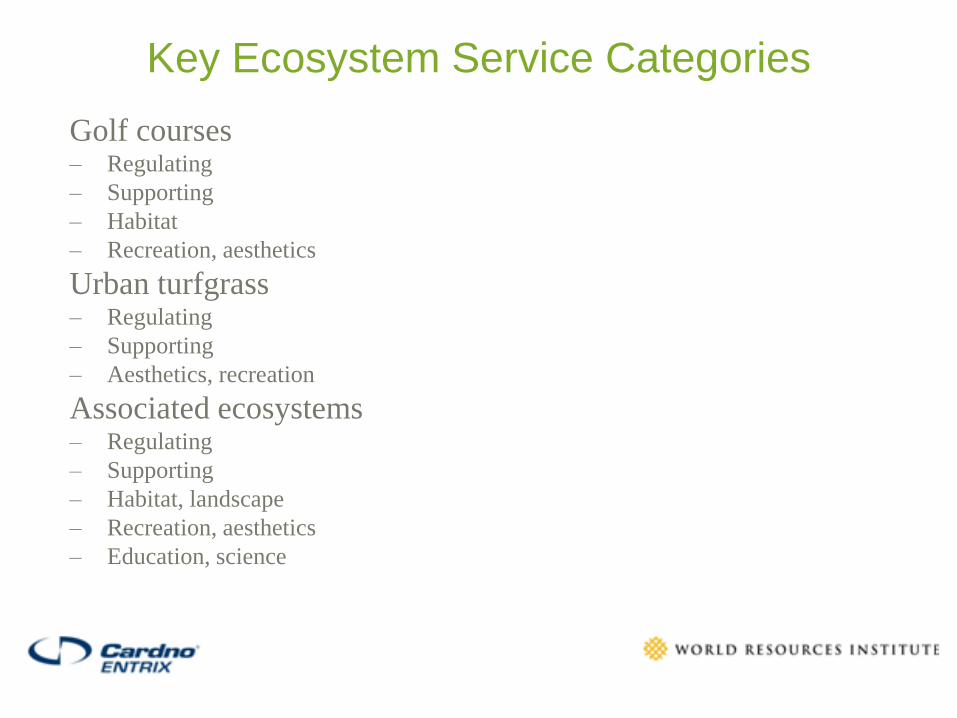
Key Ecosystem Service Categories
Golf courses – Regulating
– Supporting
– Habitat
– Recreation, aesthetics
Urban turfgrass – Regulating
– Supporting
– Aesthetics, recreation
Associated ecosystems – Regulating
– Supporting
– Habitat, landscape
– Recreation, aesthetics
– Education, science

Golf Ecosystem Services – Conceptual Model

Ecosystem Service
Golf
Importance
Rank
Feasibility,
Data
Availability
Rank
Brief description of algorithm for
quantifying ecosystem service
Units
Reference
Supporting
Primary production High High Product of annual net primary productivity
(metric tons C/acre) and total area (acres) for
each land-use type, summed over all land-
use types.
Metric tons
C/y
White et al.
1997;
Landsberg and
Waring 1997;
Gray and
Schlesinger
1981; Zirkle
2010; Peters
2009
Secondary production Medium Medium Product of annual secondary productivity
(metric tons C/acre) and total area (acres) for
each land-use type, summed over all land-
use types. Alternatively, 10% of annual net
primary productivity
Metric tons
C/y
Odum 1971
Nutrient cycling Medium Medium Nutrient cycling efficiency index: ratio of
amount cycled to total nutrients flowing
through the system.
unitless Patten et al.
1976
Decomposition Medum High Product of annual decomposition (metric tons
C/acre) and total area (acres) for each land-
use type, summed over all land-use types.
Metric tons
C/y
Kauer et al.
2009; Kop and
Guillard 2004
Estimating Ecosystem Services

Ecosystem
Service
Golf
Importance
Rank
Feasibility,
Data
Availability
Rank
Brief description of algorithm for quantifying
ecosystem service
Units
Reference
Regulating
Air quality Medium High O2 produced = 2.67 [(Σgolf land-use area . net C
sequestration rate) + (ΣAE land-use area . net C
sequestration rate)]
Metric
tons/y
Nowak et al.
2007;
Nowak and
Greenfield
2008-2010
Reports
Air quality Medium High Pollutant removed = (Σgolf land-use area . pollutant
removal rate) + (ΣAE land-use area . pollutant
removal rate)
Pollutants: CO, ozone, NO2, SO2
Metric
tons/y
Nowak et al.
2007;
Nowak and
Greenfield
2008-2010
Reports
Local climate Medium Medium Annual savings (cooling) in electricity converted to
equivalent reduction in CO2 emissions.
Examine CityGreen, LUMPS, and DOE-2 models
Metric tons
C/y
Water
storage,
supply
High High Water holding capacity based on site-specific soil
data and water budget. HYDRUS-2D model for
water storage on greens.
Regional/local characterization of supply.
Million
gals, (L)/y;
% of total
water
needs
Carrow and
Waltz 1985;
McCoy and
McCoy 2009
Water Quality High High Pesticide loadings from runoff calculated using
TurfPQ model.
Examine USEPA WASP, EXAMS, CADDIS; and
USGS LOADEST models
N, P, and K loadings based on empirical runoff
rates.
Consideration to grey water and water with higher
salinity.
Consideration to treatment reduction levels (load
and concentration), dissolved oxygen levels (DO)
and impacts to aquatic life (macroinvertebrates).
Metric
tons/y
Haith 2001;
Kelling and
Petersen
1975
Water runoff High High Apply the curve number equations (i.e., TR-55
model) from the TurfPQ model and local soil
conditions to estimate annual runoff from turfgrass.
Examine USEPA SWMM
Million
gals, (L)/y
Haith 2001;
Kramer et al.
2009
Soil retention,
erosion
control
High Medium Percentage of annual total suspended solids
removal determined empirically for ponds,
wetlands, and buffer strips
Eamine USGS LOADEST model
Metric
tons/y
NJDEP 2004
Estimating Ecosystem Services


Urban Ecosystem Services – Conceptual Model
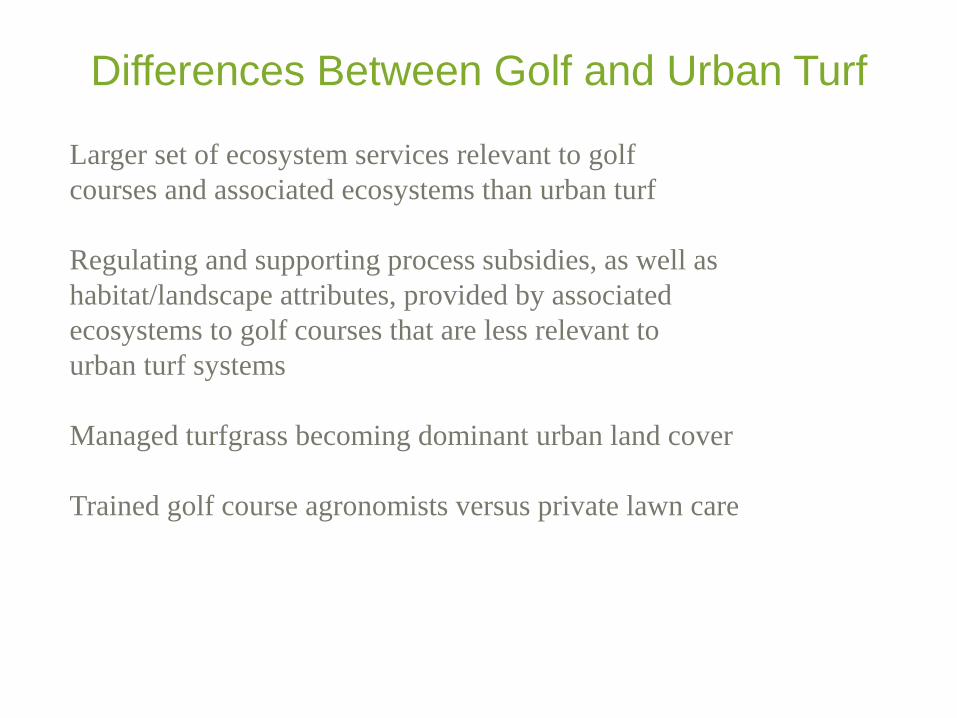
Differences Between Golf and Urban Turf
Larger set of ecosystem services relevant to golf
courses and associated ecosystems than urban turf
Regulating and supporting process subsidies, as well as
habitat/landscape attributes, provided by associated
ecosystems to golf courses that are less relevant to
urban turf systems
Managed turfgrass becoming dominant urban land cover
Trained golf course agronomists versus private lawn care
Next steps
• Real-world application and case studies
• Broader industry consortium of partners to
develop the work further
• Valuation of recreation and aesthetic values

Lessons Learned

Thank you
