an ecosystem approach to fisheries...
TRANSCRIPT

Aquaculture amp Fisheries Group Wageningen University
2112011
1
Paul van ZwietenFisheries Data Collection and AnalysisMonday 7 November
An ecosystem approach to fisheries information
Devising indicators of fisheries resources
Introduction
My background Small scale fisheries information needs for fisheries
management in datapoor situations
Papua New Guinea Southern Africa freshwaters
Coastal fisheries Indonesia Thailand Vietnambull Red River Delta Nam Dinh province
bull RESCOPAR Ca Mau province East Kalimantan
Lake Victoriabull Impacts eutrophication and fisheries on Nile Perch stocks
BestTuna projectbull With WWF ndash in search of mechanisms to better manage tuna stocks in Coral Triangle area
bull Market based mechanisms
Aquaculture amp Fisheries Group Wageningen University
2112011
2
Today ndash sermon and system analysis
Introduction Approach to management
Focus on information needs for decision making
Information understood by all involved in managementbull Role of fisheries scientist
A system approach Indicators
Tuesday Thursday
Tuesday is a trendy day
Trends and information value of indicators
Trends and causation ndash stock assessment with paper and pencil
Trends and own data ndash catch and effort
Thursday is an assessment day
Models introduction and two biomass dynamic models ndashcatch and effort
Indicatorsbull Three simple indicators
bull Stock assessment with indictors based on catch and effort
Aquaculture amp Fisheries Group Wageningen University
2112011
3
Part 1 Sermon
Management cycle Quantified objective
eg Y=50 kg ha1 yr 1
Evaluation
eg Y too low overfishing
Management measure
eg 30 reduction in number of boats
Information
monitoring catches
eg Y=30 kg ha1 yr 1
Feedback
Userstakeholder preferences
Biological potentials and constraints
Resource use problem
Aquaculture amp Fisheries Group Wageningen University
2112011
4
Participation
Writing history together
Users and information needs changing role of
science in evaluations
Aquaculture amp Fisheries Group Wageningen University
2112011
5
Perceptions on stock sizes of researchers and fishers
1970 1975 1980 1985 1990 1995 2000 20050
20000
40000
60000
80000
100000
Exp
loita
ble
stoc
k (to
nnes
)
sole
Catch ratesStock size
Photo Van Densen
More inclusive stakeholder involvement the information
challenge
Fishers Managers
Greens TradersSupermarkets general
public
DataInformationKnowledge
Role of science
Measurement Historical data Sensitivity Theoretical basis
B F important
Responsiveness to action
Costs
Total pressure (C f F) important
Related to quality notions of good practice
Selectivity important (q) - labels
Experts
Related to experience spaces
Catch efficiency (Cf q) important
Aquaculture amp Fisheries Group Wageningen University
2112011
6
Management cycle Quantified objective
eg Y=50 kgha1 yr 1
Evaluation
eg Y too low overfishing
Management measure
eg 30 reduction in number of boats
Information
monitoring catches
eg Y=30 kgha1 yr 1
Feedback
Userstakeholder preferences
Biological potentials and constraints
Resource use problemFrom values hellip
hellipto techniqueshellip
hellipto valueshellip
Role of fisheries biologist experience for all
Knowledge
Information
Data
Structuring
Experience learning
Evaluation sensemaking
Aquaculture amp Fisheries Group Wageningen University
2112011
7
Evaluative capacity ndash social learning
Writing history together Fishers managers others
Management objectives ndash information needs
Production planning ldquoFeed the peoplerdquo
Fisheries Management ldquoSet levels of resource usagerdquo
Nature conservation ldquoRetain the integrity of naturerdquo
bull Biological
bull Social and economic
Aquaculture amp Fisheries Group Wageningen University
2112011
8
Only 2 biological questions in fisheries management
How much = Fishing pressure
bull Effort (f )
bull Catch (C)
How = Fishing pattern
bull Catchability (q )
bull Selectivity (s )
How much
How
Why fisheries (stock) assessements
Optimising catches ndash how much
Long term sustainability
Given variable stock sizes
Sharing arrangements catches ndash how much how
Between fishers
Between countries (eg migratory stocks shared seas and lakes)
Assessing sustainability of fisheries ndash how
Total pressure
Selectivity of catches size communities incl fish birds mammals
bull Tracking and tracing
bull Labelling
Habitats
Aquaculture amp Fisheries Group Wageningen University
2112011
9
Focus management and environmentalists on human impact and
control Fishers refer to natural influences Dispute
Catch
Effort
Nature
Fishing community
Researcher
Size
Objective measure
Total effort
Total catch MSY
Main objective to ensure optimalsustainable harvest
Main measure control of fishing effort
Aquaculture amp Fisheries Group Wageningen University
2112011
10
Control of targeted sizes
Bio
mas
s
Length (Age)
Selectivity curve small hook
Selectivity curve large hook
Available biomass Available
biomass
Control of pressure reference level (MSY)
Cat
ch (
= Y
ield
)
Fishing pressure
Overexploited
Maximum Sustainable Yield
Aquaculture amp Fisheries Group Wageningen University
2112011
11
Fisheries management options
Input controls Ban of fishing techniques (q) Maximummin mesh size (q) Change in gear construction (q) Days at sea (f)
Reduce number of gears (f)
Closed areas (f)
Closed seasons (f)
Protection habitats (fq)
B
C F = fq
Output controls (C)
Total allowable catch (TAC)
Individual Transferable Quota (ITQ)
Target specific specieslengths
C = FB
That is all Any available or
conceivable regulation can be reduced to the two terms C and F with goals defined on B
All are through regulating fishing effort
BMSY SSBmin SSBpa Cf MSY
M
R
G
Biomass
F=fq
Nt
t
R
t
tage
Wt
t
Ft
tc
C
Statistical
CEDRS
trends assessment
adaptation
Analytical
Experimental
Research
CEDRS
assessment
predictions
f
q
+ sd
HolisticBlack box approach
Analytical approach
Fisheries science ndash information evaluation
Aquaculture amp Fisheries Group Wageningen University
2112011
12
Data needed for assessment general
Basic data from the fishery
CatchperUnit Effort (tonnes numbers)
Effort (numbers)
Length (cm)
Basic research data
Migration (tagging)
Spawning (recruitment maturity stages areas)
Age
Natural Mortality
Trade offs in multispecies communities ndash no free lunch
MMSY =
Target LimitStay clear off
Aquaculture amp Fisheries Group Wageningen University
2112011
13
Goals data collection needs linkages
Production planning trade Catch Input ndash labor vessels No link
Fisheries management Catch and effort linked By commercial species
Conservation Catch and effort linked Selectivity All species Habitats ecosystems
Increase in
- Resolution
- Linked data
- Costs
Ecosystem based management
Ecosystem based management What is that
Change in information base Fisheries Science = heavy investment in population dynamics Ecosystem = interaction between organisms with each other
and the physical environment New questions arise on habitats and nontarget organisms
Not clear how the fisheries ldquohowrdquo and ldquohow muchrdquo questions can be dealt with Focus on more generic measures as MPArsquos (keeping a bank)
Focus on clarity of information for all involved what info is needed
Aquaculture amp Fisheries Group Wageningen University
2112011
14
Biomass
Models ndash Indicators references and the long view
Fishing mortality = CB
Recruitment
Growth
Natural mortality
Indicator approaches ndash system stakeholder
Size of fish
Biomas s
Fishing
Nutrients
Pressure
Driver
State
Size of fish
Biomas s
Fishing
Nutrients
Pressure
Driver
State
Aquaculture amp Fisheries Group Wageningen University
2112011
15
Indicator approaches ndash system stakeholder
Size of fish
B
io
ma
s s
Fishing
Nutrients
Pressure
Driver
State
Size of fish
B
io
ma
s s
Fishing
Nutrients
Pressure
Driver
State
Fishers Managers
Greens TradersSupermarkets general
public
DataInformationKnowledge
Role of science
Part 2 a system approach
Aquaculture amp Fisheries Group Wageningen University
2112011
16
Goal
Apply a systems approach to fishery information ndashdevising indicators System
bull Understand the role of environment and fishing as sources of population regulation (mortality)
Species Stocksbull Understand that different species have different resilience to fishing
Selectivity ndash Catch and effortbull Understand consequences of (un)selective fishing on fish communities
bull Understand the characteristics of small scale fisheries
bull Understand the potential (and drive) to stabilise catches
Africa diversity of freshwater and marine systemsFreshwaters bull Rivers Nile Orange Congo Zambezi etc
bull River floodplains Niger Congo Zambezi Kafue Pongolo etc
bull Exorheic swamps Sudd Bangweulu Kamulondo Cuvette Centrale Luapula Shire Malagarasi Lukanga
bull Endorheic wetlands and lakes
Chad Okavango Chilwa Rukwa
bull Man made riverine lakes
Kariba Cabora-Bassa Volta Nasser Kainji
bull Shallow lakes open drainage
George Edward Kyoga Malombe Mweru
bull Large deep lakes Tanganyika Victoria Malawi Turkana etc Marine systems bull Upwelling areas Coastal East and Souther Africa
Mauretania Namibia bull Estuaries River mouths bull Tidal flats Banc drsquoAacuterguin bull Continental flats banks Coastal Mozambique Sofala bank bull Coral reefs Red Sea Coastal Islands Tanzania Kenya bull Seemounts bull Open ocean
Aquaculture amp Fisheries Group Wageningen University
2112011
17
Two important indicators
Catch
Effort
Fopt
C = fqB
Relation productivity amp number of fishermen
y = 30xR2 = 082
y = 26 xR2 = 08157
0
5
10
15
20
25
30
35
40
45
50
0 2 4 6 8 10 12 14 16
Density (fisherskm^2)
Cat
ch (
tKm
^2y
ear)
Malombe
Chilwa
MweruChiuta
Albert
Itezhi-tezhi
Edward
Bangweulu
Tanganyika
Nasser amp Kariba
Turkana Kivu
Malawi
Victoria 19702
Victoria 1990 Victoria 20024
Volta Kainji
Average annual catch rate for African fishers = 3 tonyear irrespective of system
Aquaculture amp Fisheries Group Wageningen University
2112011
18
Information needs towards indicators
Systems differ
in productivity
In variability in productivity
in species communities
in effort dynamics
Contextualising fishing patterns and outcome
Scaled indicators
Systems approach ndash sources catch variability
Physical forcing drivers Rainfall water level nutrient pulsing
Climate el Niňo cycles nutrient upwelling
Landuse runoff rainfall nutrient loading siltation habitat change
Ecological spatial heterogeneity
Fish communities species attributes
Exploitation fishery characteristics
(Co)management structure organisation goals
Aquaculture amp Fisheries Group Wageningen University
2112011
19
System approach ndash a theory
Physical environment
Ecosystems
Fish communities
Fishing techniques
Fisheries management
Economics
Administration
Env
ironm
ent
Ecosystem drivers ndash pulsed stable
Physical environment
Ecosystems
Fish communities
Fishing techniques
Fisheries management
Economics
Administration
Env
ironm
ent
Aquaculture amp Fisheries Group Wageningen University
2112011
20
Okavango ndash highly pulsed system
Fluctuating environment Unpredictable
Mortality = density independent high often catastrophic
Population = variable in time less than carrying capacity
Freshwater Lake MalawiVictoria ndash constant system
Stable environment predictable
Mortality density dependent low constant
Population size constant in time around carrying capacity
Aquaculture amp Fisheries Group Wageningen University
2112011
21
Marine Red River Estuary Variable Predictable
What are the dominant life history strategies
What are the dominant life history strategies
Marine Komodo Coral Reefs Highly Stable Predictable
Aquaculture amp Fisheries Group Wageningen University
2112011
22
Drivers ndash waterlevels ndash nutrient pulsing
Scale of variation
Time Process
decadal community
annual stocks
seasonal year class
Monthly industrial catch rate clupeids lake Tanganyika
1955 1960 1965 1970 1975 1980 1985 1990 1995
Year
0
1
2
3
4
5
6
7
8
x 1000 kgvessel
small
Drivers ndash wind stress ndash nutrient upwelling
decadal annual seasonal variation
Aquaculture amp Fisheries Group Wageningen University
2112011
23
Drivers ndash weather patterns ndash nutrient upwelling
Normal pattern
Effect=1-2 years signal clear Yes
El Nino pattern
Drivers Eutrophication Lake Victoria eutrophication through increase nutrient loading related to landuse
Aquaculture amp Fisheries Group Wageningen University
2112011
24
Assignment 1 Drivers Your situation
What type of system
stable ndash pulsed
What drivers are important climate wind waterlevel droughts upwelling eutrophication land
use change
What indicators needed for assessment
What datainformation is needed to monitor longterm developments
Who haswhere is this information available
Fish communities
Physical environment
Ecosystems
Fish communities
Fishing techniques
Fisheries management
Economics
Administration
Env
ironm
ent
Aquaculture amp Fisheries Group Wageningen University
2112011
25
A Lindeman pyramid illustrating
a fish community
Size
Biomass
The biomass-size distribution important indicators in both single species and community studies
A fish community
Fish communities ndash size biomass trophic groups
Size of individual fish
Competition
Predation
Detrivores Herbivores Zooplanktivores etc
Piscivores
Aquaculture amp Fisheries Group Wageningen University
2112011
26
Tilapia ndash Oreochromis mossmbicus detrivore
Small Clupeidae zooplanktivores
Lake Tanganyika
bull Limnothrissa miodon 17 cm (top)
bull Stolothrissa tanganicae 10 cm
Lake Mweru
bullMicrothrissa moeruensis 6cm
Aquaculture amp Fisheries Group Wageningen University
2112011
27
Small zooplankton ndash from eutrophic Tjeukemeer
Nile Perch from Lake Victoria Piscivore
Aquaculture amp Fisheries Group Wageningen University
2112011
28
Haplochromis Species From Nile Perch Stomachs
Lake Mweru ndash a fish community
Length (cm)
MolluscInsect
Cyprinidae (5)Cichlidae (3)Mormyridae (5)Bagridae (2)Mochokidae (3)TylochromisOreochromisClariidae (2)Serranochromis (2)HydrocynusSchilbeidae (2)AlestesOthers (50)
Molluscivore
MicrophytovorePiscivore
5 10 15 20 25 30 35 40 45 50 55 60 65 70 75 80 850
25
50
75
100
125
150
175
200
1970 - 1972
Aquaculture amp Fisheries Group Wageningen University
2112011
29
Size
Biomass
Multispecies fisheries Mweru ndash all sizes and trophic
levelshellip
hellip and all levels are fished
Assignment 2 Fish communities my situation
How many different species are there in the fishery
Which are most important
What biomass (large ndash medium small)
What maximum sizes (large ndash medium ndash small)
What trophic levels (piscivores herbivores benthivores)
What spaces (pelagic demersal migratory)
Draw the most important species into a biomass size spectrum
order them by maximum size trophic level and space (pelagics on top demersal on the bottom)
Aquaculture amp Fisheries Group Wageningen University
2112011
30
Physical environment
Ecosystems
Fish communities
Fishing techniques
Fisheries management
Economics
Administration
Env
ironm
ent
Fish species ndash resilience to fishing
Change in Fish Communities Fishing Environment
Size of individual fish
Competition
Predation
Detrivores Herbivores Zooplanktivores etc
Piscivores
Fishing pressure
Aquaculture amp Fisheries Group Wageningen University
2112011
31
Catch development in a multispecies fishery
Catch
Fishing effort
Fishing down process ndash example Oueme river
Succession of species
black disappeared lt1965
hatched seriously reduced
peak yields around 10000 ton in rsquo50rsquo60ies
Why are some species less resilient to fishing
Aquaculture amp Fisheries Group Wageningen University
2112011
32
time
N
Population growth
Logistic population growth dNdt=r0N(1NK)
K carrying capacity (Nmax)
r0 steepness of the increase
Life history strategies r and Kselected species
rselected species small shortlived high reproductive rates (sardines)
Rapid growth and development Early maturation many offspring with low survival rates Population size below carrying capacity Minimal parental careoffspring Use unpredictable or unstable habitats Abundance varies greatly in time and space Generalists limited niche or trophic specialisation Resources rarely limiting (no competition) Wide dispersal good colonisers rapid response to disturbance Selection for productivity
Anchovy Max age 3-4 years
r=43 Population doubling time lt15 months
Aquaculture amp Fisheries Group Wageningen University
2112011
33
Life history strategies r and Kselected species
Kselected species large longlived lower reproductive rates (sharks rays)
Slow growth long life span Fewer offspring with higher survival rates Population size operate near carrying capacity (K) Use more predictable or stable habitats Parental care is common Abundance stable over time Specialists efficient users of a particular environment (niche
specialist) Resources often become limiting competition Poor colonizers of new or empty habitats (no dispersal) Selection for efficiency (competitive ability)
Hammerhead sharkMax age 14 years
r=08 PDT = 45 ndash 14 years
Not the complete story fish are more plastichellip
Aquaculture amp Fisheries Group Wageningen University
2112011
34
Three basic life history strategiesGrowth
(population)
SurvivalFecundity
Opportunist strategist small shortliving early maturing fish asymp rselected
Periodic strategist high fecundity longer lifespan
Equilibrium strategist medium size some parental care few but larger offspring asymp Kselected
Winemiller and Rose 1992
King and McFarlane 2003
Intermediate strategist
Opportunistic strategist
Early maturing fish frequent reproduction extended spawning period rapid larval growth high population turnover rate (PB = Z = r) eg mosquito fish Marginal habitats (eg like terrestrialaquatic ecotone)
More common in tropical freshwaters
Rarely exploited (small size) otherwise no management needed but to protect founder populations
Aquaculture amp Fisheries Group Wageningen University
2112011
35
Equilibrium strategist
Large adult body size parental care behaviour
Tropical (stable) fresh waters coral reefs (K)
Density dependent processes and resource limitation
Management maintenance of a productive environment and a healthy adult stocks
Periodic strategist
Maximises age specific fecundity at the expense of juvenile survivorship
If favorable conditions for immatures = periodic synchronous reproduction in phase with periodicity of large numbers
of small offspring
Weak stock recruitment relationships
Management maintain a critical density of adults stocks Protect spawning season andor habitat
Aquaculture amp Fisheries Group Wageningen University
2112011
36
Fishbase species resilience to fishing pressure life
history
Three categories of species resilience to fishing Very lowlow ndash medium ndash high
Based on lifehistory characteristics reproduction feeding and spatial behavior
Through the effects of survival fecundity and growth
trophic position
migratory behaviour
See FishBase wwwfishbaseorg
Lake Mweru ndash Mormyrops anguilloides
Resilience Low
Minimum population doubling time = generation time 8 years
Life span 24 years
Max length 150 cm
Lengthage2at2maturity 65 cm 5 years
Trophic level 36
Migratory no
Intermediateperiodic
Aquaculture amp Fisheries Group Wageningen University
2112011
37
Lake Mweru Hydrocynus vittatus
Resilience Mediumlow
Generation time 3 years
Life span 11 years
Max length 105 cm FL
Lengthage2at2maturity 42 cm 2years
Trophic level 44
Migratory yes spawning migrations
Periodic
Lake Mweru Oreochromis mweruensis
Lake Mweru
Resilience High
Minimum population doubling time lt 15 months
Life span 11 years
Max length 40 cm
Lengthage2at2maturity 15 cm 1year
Trophic level 20
Migratory no
Intermediate opportunistc
Aquaculture amp Fisheries Group Wageningen University
2112011
38
Lake Mweru Microthrissa moeruensis
bull Z = PB ~ 5 ndash 7
Resilience High
Generation time 6 months
Life span 25 years
Max length 5 cm
Lengthage2at2first maturity 3 cm04 year
Trophic level 20 ndash 30
Migratory no
Lake MweruOpportunistic
Assignment 3 Resilience to fishing my situation
Use main species in the fishery in assignment 2 (choose at least three) What is their productivityresilience to fishing
What characteristics are used to assess thisbull Size longevity reproduction feeding spatial behaviour
What is the turnover time (PB = Z = r)
Use Fishbase to find out these characteristics What indicators
What datainformation is needed Who haswhere is this information available
Aquaculture amp Fisheries Group Wageningen University
2112011
39
Fishing pressure fish communities and system stability
Physical environment
Ecosystems
Fish communities
Fishing techniques
Fisheries management
Economics
Administration
Env
ironm
ent
Change in Fish Communities Fishing Environment
Size of individual fish
Competition
Predation
Detrivores Herbivores Zooplanktivores etc
Piscivores
Fishing pressure
Aquaculture amp Fisheries Group Wageningen University
2112011
40
Change in Fish Communities Fishing Environment
Piscivores
Size of individual fish
Competition
Predation
Detrivores Herbivores Zooplanktivores etc
Fishing pressure
driving force
Drivers climate wind waterlevel droughts upwelling eutrophication
Fish Communities ndash population regulation
Constant systems
Pulsed systems
Population regulation
nonselective catastrophic mortality
(environmentdominant)
selective mortality (predation competitiondominant)
environment determines prevailing mortality pattern
Aquaculture amp Fisheries Group Wageningen University
2112011
41
Most ecological processes and life history traits can be related to the prevailing mortality pattern
Life history and natural selection
0
20
40
60
80
100
0 1 2 3 4 5 6 7 8
Relative age (years)
Abu
ndan
ce (
N)
but large fish have more eggs
50 cm = 1 mill eggs 100 cm = 16 mill eggs
Age at 50 maturity
Young fish are supposed to die only a fraction will spawn
Aquaculture amp Fisheries Group Wageningen University
2112011
42
Fishing mortality
Age (years)
Inst
anta
neou
s ra
te o
f m
orta
lity
Predation mortality
From ICES (1997)
is almost exactly oppositeSelectivity predation versus fishing
Management promotes harvesting patterns that is opposite to what most fish stock are naturally adapted to
effort
Age and size structure changesunder selective fishing to younger and smaller individuals
A sign of fishing hellip
Aquaculture amp Fisheries Group Wageningen University
2112011
43
Median age-at-maturation of Northeast Arctic cod (Joslashrgensen 1990 Jorgensen et al 2007 Science Conover et al )
and this is what happens
Fishery induced evolution (nr species)
Maturity lower age (6)
Maturity lower size (7)
Reduced growth (6)
Increase fecundity (3)
Loss genetic div (3)
Leading to lower yields
Small
Random
Large
Increased mortality on
Mean individual weight at age after 4 generations
Evidence Size selection (Growth)
= genetic changes
After Conover and Munch 2002Atlantic silverside Menidia menidia max age=2 years R= PDT lt15 months r=58
Aquaculture amp Fisheries Group Wageningen University
2112011
44
Effect of sizeselective fishing (Yield)
Trends in average total weight harvested across multiple generations of size-selective exploitation
Mortality on
Size selective fishing with large mesh sizes on adults We are deliberately pushing stocks to genetically
stable smaller sizes
Small
Random
Large
The rK selection principle the effects of selective
fishing
Age (size)
Abu
ndan
ce (L
og N
)
Slope = total mortality rate Z = r
Increased juvenile mortality= K-selection
Increased adult mortality= r-selection
r-selection Unstable environment abiotic mortality ndash non-predictive non-selectiveK-selection Stable environment biotic mortality (predation) ndash predictive size selective
Aquaculture amp Fisheries Group Wageningen University
2112011
45
Abundance size spectra
Abu
ndan
ce
Size
The distribution of abundance by size follows regular patterns
slope steepens when large fish removed
phytoplankton
zooplankton
small fish
big fish
Year
1976 1978 1980 1982 1984 1986 1988 1990 1992 1994
Slo
pe
-10
-9
-8
-7
-6
-5
Rice amp Gislason (1996)
Trends in size-spectrum slopes of the North Sea
Fishing effects on community sizestructure
Aquaculture amp Fisheries Group Wageningen University
2112011
46
Question
How do you fish a multispecies community
Selective ndash Targeting large sizes with single gears
Unselective ndash Targeting all sizes with many gears
Multispecies community
How should it be harvested
What should be minimum mesh-size
Aquaculture amp Fisheries Group Wageningen University
2112011
47
Selective fishing will change the slope
Biomasssize distributions
Example from lake Kariba Zambiawhere fishers are using illegal smallmeshed nets
The system remains unchanged except everything is less
Kolding et al 2003
Parallel slopes only intercept lower
Aquaculture amp Fisheries Group Wageningen University
2112011
48
2
3
4
5
Tro
phic
leve
l
Pauly et al (1998)
Fishing down the food web
Example from Lake Volta Ghana
The whole fish community is targeted highly pulsed system
highly dynamic fishery (spatial temporal movements fishermen)
27 fishing methods
25 kgday
74 species utilized
All trophic levels utilized by combining gears with specific trophic profiles 1 2 3 4 5Trophic level
Gears in the fishery ( species sample size)
Van Zwieten et al 2008
Aquaculture amp Fisheries Group Wageningen University
2112011
49
Is nonselective fishing bad
There is no empirical evidence
On the contrary we know that selective fishing is bad but we still advocate it
But how do we impose gear mesh and size restrictions in a multispecies fishery
The optimum fishing pattern is un-selective How much
How
Is fishing down the food web bad
Where is the highest production
Sohellip what is the best fishing pattern
What if we fish everything
A non-selective harvesting pattern is ecosystem conserving
The system remains intact but everything is less
This means fishing down the food-web
Aquaculture amp Fisheries Group Wageningen University
2112011
50
Indicators ndash biomass size distribution
Size of individual fish
Biomass Unexploited Population = Blt40
Maximum length = Lmax10
Fishing pressure
Mean length exploited population = L5
Biomass Exploited Population = Bgt40
Mean length total= Lmean
Intercept = Iasd
Assignment 4 Fishing down my situation
Characterise your fishery Single species single gear ndash multigear
Specific target species ndash all species are targeted (multispecies)
Specific size ndash all sizes (quantify)
Is there a shift from large specimen to small
Is there a shift from large species ndash to small Is there a shift in trophic level
What information is needed What indicators
Where to get this information
Aquaculture amp Fisheries Group Wageningen University
2112011
51
Dynamics of fishing ndash stabilise catch variability
Physical environment
Ecosystems
Fish communities
Fishing techniques
Fisheries management
Economics
Administration
Env
ironm
ent
Diversity in methods ndash small units adaptive
Hook and line fisherman
Lake Jaba Nigeria
Trap fishermen
Lake Mweru Zambia
Aquaculture amp Fisheries Group Wageningen University
2112011
52
Labor intensive beach seining on demersals
Small fish common Chilimira seine small pelagics
Aquaculture amp Fisheries Group Wageningen University
2112011
53
Innovative Nkacha seine small demersals
Unevenly distributed ndash important gears lake Mweru
Aquaculture amp Fisheries Group Wageningen University
2112011
54
Highly mobile ndash movement fishermen Lake Malawi
movement one fisherman in 6 months
SE Arm of Lake Malawi
Characteristics of smallscale fisheries
Small units simple processing small scale trading
Methods diverse innovative labor intensive
Opportunistic adaptive
Large subsistence element (small fish)
Unevenly distributed highly mobile
Aquaculture amp Fisheries Group Wageningen University
2112011
55
Fishing mortality (F)
number of units
efficiency
Effort (f)
Catchability (q)Fishing mortality (F)
More of the same
Decreasing numbers = management
Better methods = Increasing efficiency
=development
So while we both lsquomanagersquo and lsquodeveloprsquo the fishing mortality stays the same
Uh
Tradeoffs Economic efficiency vs employment
opportunities
0
20
40
60
80
100
120
140
160
180
1945 1950 1955 1960 1965 1970 1975 1980 1985 1990 1995 2000 2005
Fish
erm
en (
1000
)
Cat
ch p
er
fishe
rman
(to
ns)
0
500000
1000000
1500000
2000000
2500000
3000000
3500000
4000000
Qua
ntity
(to
ns)
Quantity (tons) Fishermen (1000) Catch (tons) per fisherman
Total catch numbers of fishers amp catch per fisherman in the Norwegian fishery 1945-2005
Effort (f) decreases while CpUE increases because catchability (q = efficiency) increases
Aquaculture amp Fisheries Group Wageningen University
2112011
56
Assignment 5 Dynamics fishery ndash my situation
How has fishing effort developed over time In terms of numbers (fishermen boats)
In terms of gears bull Types
bull Active ndash passive methods
In terms of spatial distribution
In terms of trophic levels
What informationdata needed What indicators
Who haswhere is this information
Goal
Apply a systems approach to fishery information ndashdevise indicators System
bull Understand the role of environment and fishing as sources of population regulation (mortality)
Species Stocksbull Understand that different species have different resilience to fishing
bull Understand r K principle
Selectivity ndash Catch and effortbull Discuss the consequences of selective and unselective fishing on fish
communities
bull Understand the characteristics of small scale fisheries
Aquaculture amp Fisheries Group Wageningen University
2112011
57
Summary All species and systems ndash important sets of
indicators
Effort (numbers types)
Species (composition in catch)
Catch (by species total)
Catch per unit Effort (~relative biomass)
Length (in catch at maturity)
Drivers (as explanatory factor)
copy Wageningen UR
End hellipbeginning
Aquaculture amp Fisheries Group Wageningen University
2112011
58
Summary environment species resilience management Life history strategy Opportunistic Periodic Equilibrium Environment Temporally stochastic
with small-scale patches
Seasonal with large-scale patches
Stable with fine-scaled spatial variation
Demographic trade-off 1 age at maturity 2 fecundity 3 juvenile survivorship
low low low
high high low
high low high
Demographic character Maximise (re)colonising capability of habitats over small spatial scales
Maximise age-specific fecundity spreading of reproductive effort over many years andor large areas
Maximise juvenile survivorship in resource limited density-dependent environments
Life history traits - size - age at maturity - size at maturity - clutch size - egg size - larvalYOY growth - reproductive season - parental care
Small Early Small Small Small Rapid Long No
Large Delayed Mediumlarge Large Small Rapid Short No
Smallmedium Delayed Medium Small Large Slow Long Yes
- Maintain critical minimum spawning biomass
- Maintain appropriate age structure (including large specimen)
- Maintenance of adult stock
Primary management objectives
- Protection against large scale or chronic perturbations that eliminate key refugia in space and time
- Spatial refuges directed at adult stock (including spawning habitats and migration routes)
- Maintain integrity of adult habitat
Environment
Demographic trade-offs
Life history traits
Management objectives

Aquaculture amp Fisheries Group Wageningen University
2112011
2
Today ndash sermon and system analysis
Introduction Approach to management
Focus on information needs for decision making
Information understood by all involved in managementbull Role of fisheries scientist
A system approach Indicators
Tuesday Thursday
Tuesday is a trendy day
Trends and information value of indicators
Trends and causation ndash stock assessment with paper and pencil
Trends and own data ndash catch and effort
Thursday is an assessment day
Models introduction and two biomass dynamic models ndashcatch and effort
Indicatorsbull Three simple indicators
bull Stock assessment with indictors based on catch and effort
Aquaculture amp Fisheries Group Wageningen University
2112011
3
Part 1 Sermon
Management cycle Quantified objective
eg Y=50 kg ha1 yr 1
Evaluation
eg Y too low overfishing
Management measure
eg 30 reduction in number of boats
Information
monitoring catches
eg Y=30 kg ha1 yr 1
Feedback
Userstakeholder preferences
Biological potentials and constraints
Resource use problem
Aquaculture amp Fisheries Group Wageningen University
2112011
4
Participation
Writing history together
Users and information needs changing role of
science in evaluations
Aquaculture amp Fisheries Group Wageningen University
2112011
5
Perceptions on stock sizes of researchers and fishers
1970 1975 1980 1985 1990 1995 2000 20050
20000
40000
60000
80000
100000
Exp
loita
ble
stoc
k (to
nnes
)
sole
Catch ratesStock size
Photo Van Densen
More inclusive stakeholder involvement the information
challenge
Fishers Managers
Greens TradersSupermarkets general
public
DataInformationKnowledge
Role of science
Measurement Historical data Sensitivity Theoretical basis
B F important
Responsiveness to action
Costs
Total pressure (C f F) important
Related to quality notions of good practice
Selectivity important (q) - labels
Experts
Related to experience spaces
Catch efficiency (Cf q) important
Aquaculture amp Fisheries Group Wageningen University
2112011
6
Management cycle Quantified objective
eg Y=50 kgha1 yr 1
Evaluation
eg Y too low overfishing
Management measure
eg 30 reduction in number of boats
Information
monitoring catches
eg Y=30 kgha1 yr 1
Feedback
Userstakeholder preferences
Biological potentials and constraints
Resource use problemFrom values hellip
hellipto techniqueshellip
hellipto valueshellip
Role of fisheries biologist experience for all
Knowledge
Information
Data
Structuring
Experience learning
Evaluation sensemaking
Aquaculture amp Fisheries Group Wageningen University
2112011
7
Evaluative capacity ndash social learning
Writing history together Fishers managers others
Management objectives ndash information needs
Production planning ldquoFeed the peoplerdquo
Fisheries Management ldquoSet levels of resource usagerdquo
Nature conservation ldquoRetain the integrity of naturerdquo
bull Biological
bull Social and economic
Aquaculture amp Fisheries Group Wageningen University
2112011
8
Only 2 biological questions in fisheries management
How much = Fishing pressure
bull Effort (f )
bull Catch (C)
How = Fishing pattern
bull Catchability (q )
bull Selectivity (s )
How much
How
Why fisheries (stock) assessements
Optimising catches ndash how much
Long term sustainability
Given variable stock sizes
Sharing arrangements catches ndash how much how
Between fishers
Between countries (eg migratory stocks shared seas and lakes)
Assessing sustainability of fisheries ndash how
Total pressure
Selectivity of catches size communities incl fish birds mammals
bull Tracking and tracing
bull Labelling
Habitats
Aquaculture amp Fisheries Group Wageningen University
2112011
9
Focus management and environmentalists on human impact and
control Fishers refer to natural influences Dispute
Catch
Effort
Nature
Fishing community
Researcher
Size
Objective measure
Total effort
Total catch MSY
Main objective to ensure optimalsustainable harvest
Main measure control of fishing effort
Aquaculture amp Fisheries Group Wageningen University
2112011
10
Control of targeted sizes
Bio
mas
s
Length (Age)
Selectivity curve small hook
Selectivity curve large hook
Available biomass Available
biomass
Control of pressure reference level (MSY)
Cat
ch (
= Y
ield
)
Fishing pressure
Overexploited
Maximum Sustainable Yield
Aquaculture amp Fisheries Group Wageningen University
2112011
11
Fisheries management options
Input controls Ban of fishing techniques (q) Maximummin mesh size (q) Change in gear construction (q) Days at sea (f)
Reduce number of gears (f)
Closed areas (f)
Closed seasons (f)
Protection habitats (fq)
B
C F = fq
Output controls (C)
Total allowable catch (TAC)
Individual Transferable Quota (ITQ)
Target specific specieslengths
C = FB
That is all Any available or
conceivable regulation can be reduced to the two terms C and F with goals defined on B
All are through regulating fishing effort
BMSY SSBmin SSBpa Cf MSY
M
R
G
Biomass
F=fq
Nt
t
R
t
tage
Wt
t
Ft
tc
C
Statistical
CEDRS
trends assessment
adaptation
Analytical
Experimental
Research
CEDRS
assessment
predictions
f
q
+ sd
HolisticBlack box approach
Analytical approach
Fisheries science ndash information evaluation
Aquaculture amp Fisheries Group Wageningen University
2112011
12
Data needed for assessment general
Basic data from the fishery
CatchperUnit Effort (tonnes numbers)
Effort (numbers)
Length (cm)
Basic research data
Migration (tagging)
Spawning (recruitment maturity stages areas)
Age
Natural Mortality
Trade offs in multispecies communities ndash no free lunch
MMSY =
Target LimitStay clear off
Aquaculture amp Fisheries Group Wageningen University
2112011
13
Goals data collection needs linkages
Production planning trade Catch Input ndash labor vessels No link
Fisheries management Catch and effort linked By commercial species
Conservation Catch and effort linked Selectivity All species Habitats ecosystems
Increase in
- Resolution
- Linked data
- Costs
Ecosystem based management
Ecosystem based management What is that
Change in information base Fisheries Science = heavy investment in population dynamics Ecosystem = interaction between organisms with each other
and the physical environment New questions arise on habitats and nontarget organisms
Not clear how the fisheries ldquohowrdquo and ldquohow muchrdquo questions can be dealt with Focus on more generic measures as MPArsquos (keeping a bank)
Focus on clarity of information for all involved what info is needed
Aquaculture amp Fisheries Group Wageningen University
2112011
14
Biomass
Models ndash Indicators references and the long view
Fishing mortality = CB
Recruitment
Growth
Natural mortality
Indicator approaches ndash system stakeholder
Size of fish
Biomas s
Fishing
Nutrients
Pressure
Driver
State
Size of fish
Biomas s
Fishing
Nutrients
Pressure
Driver
State
Aquaculture amp Fisheries Group Wageningen University
2112011
15
Indicator approaches ndash system stakeholder
Size of fish
B
io
ma
s s
Fishing
Nutrients
Pressure
Driver
State
Size of fish
B
io
ma
s s
Fishing
Nutrients
Pressure
Driver
State
Fishers Managers
Greens TradersSupermarkets general
public
DataInformationKnowledge
Role of science
Part 2 a system approach
Aquaculture amp Fisheries Group Wageningen University
2112011
16
Goal
Apply a systems approach to fishery information ndashdevising indicators System
bull Understand the role of environment and fishing as sources of population regulation (mortality)
Species Stocksbull Understand that different species have different resilience to fishing
Selectivity ndash Catch and effortbull Understand consequences of (un)selective fishing on fish communities
bull Understand the characteristics of small scale fisheries
bull Understand the potential (and drive) to stabilise catches
Africa diversity of freshwater and marine systemsFreshwaters bull Rivers Nile Orange Congo Zambezi etc
bull River floodplains Niger Congo Zambezi Kafue Pongolo etc
bull Exorheic swamps Sudd Bangweulu Kamulondo Cuvette Centrale Luapula Shire Malagarasi Lukanga
bull Endorheic wetlands and lakes
Chad Okavango Chilwa Rukwa
bull Man made riverine lakes
Kariba Cabora-Bassa Volta Nasser Kainji
bull Shallow lakes open drainage
George Edward Kyoga Malombe Mweru
bull Large deep lakes Tanganyika Victoria Malawi Turkana etc Marine systems bull Upwelling areas Coastal East and Souther Africa
Mauretania Namibia bull Estuaries River mouths bull Tidal flats Banc drsquoAacuterguin bull Continental flats banks Coastal Mozambique Sofala bank bull Coral reefs Red Sea Coastal Islands Tanzania Kenya bull Seemounts bull Open ocean
Aquaculture amp Fisheries Group Wageningen University
2112011
17
Two important indicators
Catch
Effort
Fopt
C = fqB
Relation productivity amp number of fishermen
y = 30xR2 = 082
y = 26 xR2 = 08157
0
5
10
15
20
25
30
35
40
45
50
0 2 4 6 8 10 12 14 16
Density (fisherskm^2)
Cat
ch (
tKm
^2y
ear)
Malombe
Chilwa
MweruChiuta
Albert
Itezhi-tezhi
Edward
Bangweulu
Tanganyika
Nasser amp Kariba
Turkana Kivu
Malawi
Victoria 19702
Victoria 1990 Victoria 20024
Volta Kainji
Average annual catch rate for African fishers = 3 tonyear irrespective of system
Aquaculture amp Fisheries Group Wageningen University
2112011
18
Information needs towards indicators
Systems differ
in productivity
In variability in productivity
in species communities
in effort dynamics
Contextualising fishing patterns and outcome
Scaled indicators
Systems approach ndash sources catch variability
Physical forcing drivers Rainfall water level nutrient pulsing
Climate el Niňo cycles nutrient upwelling
Landuse runoff rainfall nutrient loading siltation habitat change
Ecological spatial heterogeneity
Fish communities species attributes
Exploitation fishery characteristics
(Co)management structure organisation goals
Aquaculture amp Fisheries Group Wageningen University
2112011
19
System approach ndash a theory
Physical environment
Ecosystems
Fish communities
Fishing techniques
Fisheries management
Economics
Administration
Env
ironm
ent
Ecosystem drivers ndash pulsed stable
Physical environment
Ecosystems
Fish communities
Fishing techniques
Fisheries management
Economics
Administration
Env
ironm
ent
Aquaculture amp Fisheries Group Wageningen University
2112011
20
Okavango ndash highly pulsed system
Fluctuating environment Unpredictable
Mortality = density independent high often catastrophic
Population = variable in time less than carrying capacity
Freshwater Lake MalawiVictoria ndash constant system
Stable environment predictable
Mortality density dependent low constant
Population size constant in time around carrying capacity
Aquaculture amp Fisheries Group Wageningen University
2112011
21
Marine Red River Estuary Variable Predictable
What are the dominant life history strategies
What are the dominant life history strategies
Marine Komodo Coral Reefs Highly Stable Predictable
Aquaculture amp Fisheries Group Wageningen University
2112011
22
Drivers ndash waterlevels ndash nutrient pulsing
Scale of variation
Time Process
decadal community
annual stocks
seasonal year class
Monthly industrial catch rate clupeids lake Tanganyika
1955 1960 1965 1970 1975 1980 1985 1990 1995
Year
0
1
2
3
4
5
6
7
8
x 1000 kgvessel
small
Drivers ndash wind stress ndash nutrient upwelling
decadal annual seasonal variation
Aquaculture amp Fisheries Group Wageningen University
2112011
23
Drivers ndash weather patterns ndash nutrient upwelling
Normal pattern
Effect=1-2 years signal clear Yes
El Nino pattern
Drivers Eutrophication Lake Victoria eutrophication through increase nutrient loading related to landuse
Aquaculture amp Fisheries Group Wageningen University
2112011
24
Assignment 1 Drivers Your situation
What type of system
stable ndash pulsed
What drivers are important climate wind waterlevel droughts upwelling eutrophication land
use change
What indicators needed for assessment
What datainformation is needed to monitor longterm developments
Who haswhere is this information available
Fish communities
Physical environment
Ecosystems
Fish communities
Fishing techniques
Fisheries management
Economics
Administration
Env
ironm
ent
Aquaculture amp Fisheries Group Wageningen University
2112011
25
A Lindeman pyramid illustrating
a fish community
Size
Biomass
The biomass-size distribution important indicators in both single species and community studies
A fish community
Fish communities ndash size biomass trophic groups
Size of individual fish
Competition
Predation
Detrivores Herbivores Zooplanktivores etc
Piscivores
Aquaculture amp Fisheries Group Wageningen University
2112011
26
Tilapia ndash Oreochromis mossmbicus detrivore
Small Clupeidae zooplanktivores
Lake Tanganyika
bull Limnothrissa miodon 17 cm (top)
bull Stolothrissa tanganicae 10 cm
Lake Mweru
bullMicrothrissa moeruensis 6cm
Aquaculture amp Fisheries Group Wageningen University
2112011
27
Small zooplankton ndash from eutrophic Tjeukemeer
Nile Perch from Lake Victoria Piscivore
Aquaculture amp Fisheries Group Wageningen University
2112011
28
Haplochromis Species From Nile Perch Stomachs
Lake Mweru ndash a fish community
Length (cm)
MolluscInsect
Cyprinidae (5)Cichlidae (3)Mormyridae (5)Bagridae (2)Mochokidae (3)TylochromisOreochromisClariidae (2)Serranochromis (2)HydrocynusSchilbeidae (2)AlestesOthers (50)
Molluscivore
MicrophytovorePiscivore
5 10 15 20 25 30 35 40 45 50 55 60 65 70 75 80 850
25
50
75
100
125
150
175
200
1970 - 1972
Aquaculture amp Fisheries Group Wageningen University
2112011
29
Size
Biomass
Multispecies fisheries Mweru ndash all sizes and trophic
levelshellip
hellip and all levels are fished
Assignment 2 Fish communities my situation
How many different species are there in the fishery
Which are most important
What biomass (large ndash medium small)
What maximum sizes (large ndash medium ndash small)
What trophic levels (piscivores herbivores benthivores)
What spaces (pelagic demersal migratory)
Draw the most important species into a biomass size spectrum
order them by maximum size trophic level and space (pelagics on top demersal on the bottom)
Aquaculture amp Fisheries Group Wageningen University
2112011
30
Physical environment
Ecosystems
Fish communities
Fishing techniques
Fisheries management
Economics
Administration
Env
ironm
ent
Fish species ndash resilience to fishing
Change in Fish Communities Fishing Environment
Size of individual fish
Competition
Predation
Detrivores Herbivores Zooplanktivores etc
Piscivores
Fishing pressure
Aquaculture amp Fisheries Group Wageningen University
2112011
31
Catch development in a multispecies fishery
Catch
Fishing effort
Fishing down process ndash example Oueme river
Succession of species
black disappeared lt1965
hatched seriously reduced
peak yields around 10000 ton in rsquo50rsquo60ies
Why are some species less resilient to fishing
Aquaculture amp Fisheries Group Wageningen University
2112011
32
time
N
Population growth
Logistic population growth dNdt=r0N(1NK)
K carrying capacity (Nmax)
r0 steepness of the increase
Life history strategies r and Kselected species
rselected species small shortlived high reproductive rates (sardines)
Rapid growth and development Early maturation many offspring with low survival rates Population size below carrying capacity Minimal parental careoffspring Use unpredictable or unstable habitats Abundance varies greatly in time and space Generalists limited niche or trophic specialisation Resources rarely limiting (no competition) Wide dispersal good colonisers rapid response to disturbance Selection for productivity
Anchovy Max age 3-4 years
r=43 Population doubling time lt15 months
Aquaculture amp Fisheries Group Wageningen University
2112011
33
Life history strategies r and Kselected species
Kselected species large longlived lower reproductive rates (sharks rays)
Slow growth long life span Fewer offspring with higher survival rates Population size operate near carrying capacity (K) Use more predictable or stable habitats Parental care is common Abundance stable over time Specialists efficient users of a particular environment (niche
specialist) Resources often become limiting competition Poor colonizers of new or empty habitats (no dispersal) Selection for efficiency (competitive ability)
Hammerhead sharkMax age 14 years
r=08 PDT = 45 ndash 14 years
Not the complete story fish are more plastichellip
Aquaculture amp Fisheries Group Wageningen University
2112011
34
Three basic life history strategiesGrowth
(population)
SurvivalFecundity
Opportunist strategist small shortliving early maturing fish asymp rselected
Periodic strategist high fecundity longer lifespan
Equilibrium strategist medium size some parental care few but larger offspring asymp Kselected
Winemiller and Rose 1992
King and McFarlane 2003
Intermediate strategist
Opportunistic strategist
Early maturing fish frequent reproduction extended spawning period rapid larval growth high population turnover rate (PB = Z = r) eg mosquito fish Marginal habitats (eg like terrestrialaquatic ecotone)
More common in tropical freshwaters
Rarely exploited (small size) otherwise no management needed but to protect founder populations
Aquaculture amp Fisheries Group Wageningen University
2112011
35
Equilibrium strategist
Large adult body size parental care behaviour
Tropical (stable) fresh waters coral reefs (K)
Density dependent processes and resource limitation
Management maintenance of a productive environment and a healthy adult stocks
Periodic strategist
Maximises age specific fecundity at the expense of juvenile survivorship
If favorable conditions for immatures = periodic synchronous reproduction in phase with periodicity of large numbers
of small offspring
Weak stock recruitment relationships
Management maintain a critical density of adults stocks Protect spawning season andor habitat
Aquaculture amp Fisheries Group Wageningen University
2112011
36
Fishbase species resilience to fishing pressure life
history
Three categories of species resilience to fishing Very lowlow ndash medium ndash high
Based on lifehistory characteristics reproduction feeding and spatial behavior
Through the effects of survival fecundity and growth
trophic position
migratory behaviour
See FishBase wwwfishbaseorg
Lake Mweru ndash Mormyrops anguilloides
Resilience Low
Minimum population doubling time = generation time 8 years
Life span 24 years
Max length 150 cm
Lengthage2at2maturity 65 cm 5 years
Trophic level 36
Migratory no
Intermediateperiodic
Aquaculture amp Fisheries Group Wageningen University
2112011
37
Lake Mweru Hydrocynus vittatus
Resilience Mediumlow
Generation time 3 years
Life span 11 years
Max length 105 cm FL
Lengthage2at2maturity 42 cm 2years
Trophic level 44
Migratory yes spawning migrations
Periodic
Lake Mweru Oreochromis mweruensis
Lake Mweru
Resilience High
Minimum population doubling time lt 15 months
Life span 11 years
Max length 40 cm
Lengthage2at2maturity 15 cm 1year
Trophic level 20
Migratory no
Intermediate opportunistc
Aquaculture amp Fisheries Group Wageningen University
2112011
38
Lake Mweru Microthrissa moeruensis
bull Z = PB ~ 5 ndash 7
Resilience High
Generation time 6 months
Life span 25 years
Max length 5 cm
Lengthage2at2first maturity 3 cm04 year
Trophic level 20 ndash 30
Migratory no
Lake MweruOpportunistic
Assignment 3 Resilience to fishing my situation
Use main species in the fishery in assignment 2 (choose at least three) What is their productivityresilience to fishing
What characteristics are used to assess thisbull Size longevity reproduction feeding spatial behaviour
What is the turnover time (PB = Z = r)
Use Fishbase to find out these characteristics What indicators
What datainformation is needed Who haswhere is this information available
Aquaculture amp Fisheries Group Wageningen University
2112011
39
Fishing pressure fish communities and system stability
Physical environment
Ecosystems
Fish communities
Fishing techniques
Fisheries management
Economics
Administration
Env
ironm
ent
Change in Fish Communities Fishing Environment
Size of individual fish
Competition
Predation
Detrivores Herbivores Zooplanktivores etc
Piscivores
Fishing pressure
Aquaculture amp Fisheries Group Wageningen University
2112011
40
Change in Fish Communities Fishing Environment
Piscivores
Size of individual fish
Competition
Predation
Detrivores Herbivores Zooplanktivores etc
Fishing pressure
driving force
Drivers climate wind waterlevel droughts upwelling eutrophication
Fish Communities ndash population regulation
Constant systems
Pulsed systems
Population regulation
nonselective catastrophic mortality
(environmentdominant)
selective mortality (predation competitiondominant)
environment determines prevailing mortality pattern
Aquaculture amp Fisheries Group Wageningen University
2112011
41
Most ecological processes and life history traits can be related to the prevailing mortality pattern
Life history and natural selection
0
20
40
60
80
100
0 1 2 3 4 5 6 7 8
Relative age (years)
Abu
ndan
ce (
N)
but large fish have more eggs
50 cm = 1 mill eggs 100 cm = 16 mill eggs
Age at 50 maturity
Young fish are supposed to die only a fraction will spawn
Aquaculture amp Fisheries Group Wageningen University
2112011
42
Fishing mortality
Age (years)
Inst
anta
neou
s ra
te o
f m
orta
lity
Predation mortality
From ICES (1997)
is almost exactly oppositeSelectivity predation versus fishing
Management promotes harvesting patterns that is opposite to what most fish stock are naturally adapted to
effort
Age and size structure changesunder selective fishing to younger and smaller individuals
A sign of fishing hellip
Aquaculture amp Fisheries Group Wageningen University
2112011
43
Median age-at-maturation of Northeast Arctic cod (Joslashrgensen 1990 Jorgensen et al 2007 Science Conover et al )
and this is what happens
Fishery induced evolution (nr species)
Maturity lower age (6)
Maturity lower size (7)
Reduced growth (6)
Increase fecundity (3)
Loss genetic div (3)
Leading to lower yields
Small
Random
Large
Increased mortality on
Mean individual weight at age after 4 generations
Evidence Size selection (Growth)
= genetic changes
After Conover and Munch 2002Atlantic silverside Menidia menidia max age=2 years R= PDT lt15 months r=58
Aquaculture amp Fisheries Group Wageningen University
2112011
44
Effect of sizeselective fishing (Yield)
Trends in average total weight harvested across multiple generations of size-selective exploitation
Mortality on
Size selective fishing with large mesh sizes on adults We are deliberately pushing stocks to genetically
stable smaller sizes
Small
Random
Large
The rK selection principle the effects of selective
fishing
Age (size)
Abu
ndan
ce (L
og N
)
Slope = total mortality rate Z = r
Increased juvenile mortality= K-selection
Increased adult mortality= r-selection
r-selection Unstable environment abiotic mortality ndash non-predictive non-selectiveK-selection Stable environment biotic mortality (predation) ndash predictive size selective
Aquaculture amp Fisheries Group Wageningen University
2112011
45
Abundance size spectra
Abu
ndan
ce
Size
The distribution of abundance by size follows regular patterns
slope steepens when large fish removed
phytoplankton
zooplankton
small fish
big fish
Year
1976 1978 1980 1982 1984 1986 1988 1990 1992 1994
Slo
pe
-10
-9
-8
-7
-6
-5
Rice amp Gislason (1996)
Trends in size-spectrum slopes of the North Sea
Fishing effects on community sizestructure
Aquaculture amp Fisheries Group Wageningen University
2112011
46
Question
How do you fish a multispecies community
Selective ndash Targeting large sizes with single gears
Unselective ndash Targeting all sizes with many gears
Multispecies community
How should it be harvested
What should be minimum mesh-size
Aquaculture amp Fisheries Group Wageningen University
2112011
47
Selective fishing will change the slope
Biomasssize distributions
Example from lake Kariba Zambiawhere fishers are using illegal smallmeshed nets
The system remains unchanged except everything is less
Kolding et al 2003
Parallel slopes only intercept lower
Aquaculture amp Fisheries Group Wageningen University
2112011
48
2
3
4
5
Tro
phic
leve
l
Pauly et al (1998)
Fishing down the food web
Example from Lake Volta Ghana
The whole fish community is targeted highly pulsed system
highly dynamic fishery (spatial temporal movements fishermen)
27 fishing methods
25 kgday
74 species utilized
All trophic levels utilized by combining gears with specific trophic profiles 1 2 3 4 5Trophic level
Gears in the fishery ( species sample size)
Van Zwieten et al 2008
Aquaculture amp Fisheries Group Wageningen University
2112011
49
Is nonselective fishing bad
There is no empirical evidence
On the contrary we know that selective fishing is bad but we still advocate it
But how do we impose gear mesh and size restrictions in a multispecies fishery
The optimum fishing pattern is un-selective How much
How
Is fishing down the food web bad
Where is the highest production
Sohellip what is the best fishing pattern
What if we fish everything
A non-selective harvesting pattern is ecosystem conserving
The system remains intact but everything is less
This means fishing down the food-web
Aquaculture amp Fisheries Group Wageningen University
2112011
50
Indicators ndash biomass size distribution
Size of individual fish
Biomass Unexploited Population = Blt40
Maximum length = Lmax10
Fishing pressure
Mean length exploited population = L5
Biomass Exploited Population = Bgt40
Mean length total= Lmean
Intercept = Iasd
Assignment 4 Fishing down my situation
Characterise your fishery Single species single gear ndash multigear
Specific target species ndash all species are targeted (multispecies)
Specific size ndash all sizes (quantify)
Is there a shift from large specimen to small
Is there a shift from large species ndash to small Is there a shift in trophic level
What information is needed What indicators
Where to get this information
Aquaculture amp Fisheries Group Wageningen University
2112011
51
Dynamics of fishing ndash stabilise catch variability
Physical environment
Ecosystems
Fish communities
Fishing techniques
Fisheries management
Economics
Administration
Env
ironm
ent
Diversity in methods ndash small units adaptive
Hook and line fisherman
Lake Jaba Nigeria
Trap fishermen
Lake Mweru Zambia
Aquaculture amp Fisheries Group Wageningen University
2112011
52
Labor intensive beach seining on demersals
Small fish common Chilimira seine small pelagics
Aquaculture amp Fisheries Group Wageningen University
2112011
53
Innovative Nkacha seine small demersals
Unevenly distributed ndash important gears lake Mweru
Aquaculture amp Fisheries Group Wageningen University
2112011
54
Highly mobile ndash movement fishermen Lake Malawi
movement one fisherman in 6 months
SE Arm of Lake Malawi
Characteristics of smallscale fisheries
Small units simple processing small scale trading
Methods diverse innovative labor intensive
Opportunistic adaptive
Large subsistence element (small fish)
Unevenly distributed highly mobile
Aquaculture amp Fisheries Group Wageningen University
2112011
55
Fishing mortality (F)
number of units
efficiency
Effort (f)
Catchability (q)Fishing mortality (F)
More of the same
Decreasing numbers = management
Better methods = Increasing efficiency
=development
So while we both lsquomanagersquo and lsquodeveloprsquo the fishing mortality stays the same
Uh
Tradeoffs Economic efficiency vs employment
opportunities
0
20
40
60
80
100
120
140
160
180
1945 1950 1955 1960 1965 1970 1975 1980 1985 1990 1995 2000 2005
Fish
erm
en (
1000
)
Cat
ch p
er
fishe
rman
(to
ns)
0
500000
1000000
1500000
2000000
2500000
3000000
3500000
4000000
Qua
ntity
(to
ns)
Quantity (tons) Fishermen (1000) Catch (tons) per fisherman
Total catch numbers of fishers amp catch per fisherman in the Norwegian fishery 1945-2005
Effort (f) decreases while CpUE increases because catchability (q = efficiency) increases
Aquaculture amp Fisheries Group Wageningen University
2112011
56
Assignment 5 Dynamics fishery ndash my situation
How has fishing effort developed over time In terms of numbers (fishermen boats)
In terms of gears bull Types
bull Active ndash passive methods
In terms of spatial distribution
In terms of trophic levels
What informationdata needed What indicators
Who haswhere is this information
Goal
Apply a systems approach to fishery information ndashdevise indicators System
bull Understand the role of environment and fishing as sources of population regulation (mortality)
Species Stocksbull Understand that different species have different resilience to fishing
bull Understand r K principle
Selectivity ndash Catch and effortbull Discuss the consequences of selective and unselective fishing on fish
communities
bull Understand the characteristics of small scale fisheries
Aquaculture amp Fisheries Group Wageningen University
2112011
57
Summary All species and systems ndash important sets of
indicators
Effort (numbers types)
Species (composition in catch)
Catch (by species total)
Catch per unit Effort (~relative biomass)
Length (in catch at maturity)
Drivers (as explanatory factor)
copy Wageningen UR
End hellipbeginning
Aquaculture amp Fisheries Group Wageningen University
2112011
58
Summary environment species resilience management Life history strategy Opportunistic Periodic Equilibrium Environment Temporally stochastic
with small-scale patches
Seasonal with large-scale patches
Stable with fine-scaled spatial variation
Demographic trade-off 1 age at maturity 2 fecundity 3 juvenile survivorship
low low low
high high low
high low high
Demographic character Maximise (re)colonising capability of habitats over small spatial scales
Maximise age-specific fecundity spreading of reproductive effort over many years andor large areas
Maximise juvenile survivorship in resource limited density-dependent environments
Life history traits - size - age at maturity - size at maturity - clutch size - egg size - larvalYOY growth - reproductive season - parental care
Small Early Small Small Small Rapid Long No
Large Delayed Mediumlarge Large Small Rapid Short No
Smallmedium Delayed Medium Small Large Slow Long Yes
- Maintain critical minimum spawning biomass
- Maintain appropriate age structure (including large specimen)
- Maintenance of adult stock
Primary management objectives
- Protection against large scale or chronic perturbations that eliminate key refugia in space and time
- Spatial refuges directed at adult stock (including spawning habitats and migration routes)
- Maintain integrity of adult habitat
Environment
Demographic trade-offs
Life history traits
Management objectives

Aquaculture amp Fisheries Group Wageningen University
2112011
3
Part 1 Sermon
Management cycle Quantified objective
eg Y=50 kg ha1 yr 1
Evaluation
eg Y too low overfishing
Management measure
eg 30 reduction in number of boats
Information
monitoring catches
eg Y=30 kg ha1 yr 1
Feedback
Userstakeholder preferences
Biological potentials and constraints
Resource use problem
Aquaculture amp Fisheries Group Wageningen University
2112011
4
Participation
Writing history together
Users and information needs changing role of
science in evaluations
Aquaculture amp Fisheries Group Wageningen University
2112011
5
Perceptions on stock sizes of researchers and fishers
1970 1975 1980 1985 1990 1995 2000 20050
20000
40000
60000
80000
100000
Exp
loita
ble
stoc
k (to
nnes
)
sole
Catch ratesStock size
Photo Van Densen
More inclusive stakeholder involvement the information
challenge
Fishers Managers
Greens TradersSupermarkets general
public
DataInformationKnowledge
Role of science
Measurement Historical data Sensitivity Theoretical basis
B F important
Responsiveness to action
Costs
Total pressure (C f F) important
Related to quality notions of good practice
Selectivity important (q) - labels
Experts
Related to experience spaces
Catch efficiency (Cf q) important
Aquaculture amp Fisheries Group Wageningen University
2112011
6
Management cycle Quantified objective
eg Y=50 kgha1 yr 1
Evaluation
eg Y too low overfishing
Management measure
eg 30 reduction in number of boats
Information
monitoring catches
eg Y=30 kgha1 yr 1
Feedback
Userstakeholder preferences
Biological potentials and constraints
Resource use problemFrom values hellip
hellipto techniqueshellip
hellipto valueshellip
Role of fisheries biologist experience for all
Knowledge
Information
Data
Structuring
Experience learning
Evaluation sensemaking
Aquaculture amp Fisheries Group Wageningen University
2112011
7
Evaluative capacity ndash social learning
Writing history together Fishers managers others
Management objectives ndash information needs
Production planning ldquoFeed the peoplerdquo
Fisheries Management ldquoSet levels of resource usagerdquo
Nature conservation ldquoRetain the integrity of naturerdquo
bull Biological
bull Social and economic
Aquaculture amp Fisheries Group Wageningen University
2112011
8
Only 2 biological questions in fisheries management
How much = Fishing pressure
bull Effort (f )
bull Catch (C)
How = Fishing pattern
bull Catchability (q )
bull Selectivity (s )
How much
How
Why fisheries (stock) assessements
Optimising catches ndash how much
Long term sustainability
Given variable stock sizes
Sharing arrangements catches ndash how much how
Between fishers
Between countries (eg migratory stocks shared seas and lakes)
Assessing sustainability of fisheries ndash how
Total pressure
Selectivity of catches size communities incl fish birds mammals
bull Tracking and tracing
bull Labelling
Habitats
Aquaculture amp Fisheries Group Wageningen University
2112011
9
Focus management and environmentalists on human impact and
control Fishers refer to natural influences Dispute
Catch
Effort
Nature
Fishing community
Researcher
Size
Objective measure
Total effort
Total catch MSY
Main objective to ensure optimalsustainable harvest
Main measure control of fishing effort
Aquaculture amp Fisheries Group Wageningen University
2112011
10
Control of targeted sizes
Bio
mas
s
Length (Age)
Selectivity curve small hook
Selectivity curve large hook
Available biomass Available
biomass
Control of pressure reference level (MSY)
Cat
ch (
= Y
ield
)
Fishing pressure
Overexploited
Maximum Sustainable Yield
Aquaculture amp Fisheries Group Wageningen University
2112011
11
Fisheries management options
Input controls Ban of fishing techniques (q) Maximummin mesh size (q) Change in gear construction (q) Days at sea (f)
Reduce number of gears (f)
Closed areas (f)
Closed seasons (f)
Protection habitats (fq)
B
C F = fq
Output controls (C)
Total allowable catch (TAC)
Individual Transferable Quota (ITQ)
Target specific specieslengths
C = FB
That is all Any available or
conceivable regulation can be reduced to the two terms C and F with goals defined on B
All are through regulating fishing effort
BMSY SSBmin SSBpa Cf MSY
M
R
G
Biomass
F=fq
Nt
t
R
t
tage
Wt
t
Ft
tc
C
Statistical
CEDRS
trends assessment
adaptation
Analytical
Experimental
Research
CEDRS
assessment
predictions
f
q
+ sd
HolisticBlack box approach
Analytical approach
Fisheries science ndash information evaluation
Aquaculture amp Fisheries Group Wageningen University
2112011
12
Data needed for assessment general
Basic data from the fishery
CatchperUnit Effort (tonnes numbers)
Effort (numbers)
Length (cm)
Basic research data
Migration (tagging)
Spawning (recruitment maturity stages areas)
Age
Natural Mortality
Trade offs in multispecies communities ndash no free lunch
MMSY =
Target LimitStay clear off
Aquaculture amp Fisheries Group Wageningen University
2112011
13
Goals data collection needs linkages
Production planning trade Catch Input ndash labor vessels No link
Fisheries management Catch and effort linked By commercial species
Conservation Catch and effort linked Selectivity All species Habitats ecosystems
Increase in
- Resolution
- Linked data
- Costs
Ecosystem based management
Ecosystem based management What is that
Change in information base Fisheries Science = heavy investment in population dynamics Ecosystem = interaction between organisms with each other
and the physical environment New questions arise on habitats and nontarget organisms
Not clear how the fisheries ldquohowrdquo and ldquohow muchrdquo questions can be dealt with Focus on more generic measures as MPArsquos (keeping a bank)
Focus on clarity of information for all involved what info is needed
Aquaculture amp Fisheries Group Wageningen University
2112011
14
Biomass
Models ndash Indicators references and the long view
Fishing mortality = CB
Recruitment
Growth
Natural mortality
Indicator approaches ndash system stakeholder
Size of fish
Biomas s
Fishing
Nutrients
Pressure
Driver
State
Size of fish
Biomas s
Fishing
Nutrients
Pressure
Driver
State
Aquaculture amp Fisheries Group Wageningen University
2112011
15
Indicator approaches ndash system stakeholder
Size of fish
B
io
ma
s s
Fishing
Nutrients
Pressure
Driver
State
Size of fish
B
io
ma
s s
Fishing
Nutrients
Pressure
Driver
State
Fishers Managers
Greens TradersSupermarkets general
public
DataInformationKnowledge
Role of science
Part 2 a system approach
Aquaculture amp Fisheries Group Wageningen University
2112011
16
Goal
Apply a systems approach to fishery information ndashdevising indicators System
bull Understand the role of environment and fishing as sources of population regulation (mortality)
Species Stocksbull Understand that different species have different resilience to fishing
Selectivity ndash Catch and effortbull Understand consequences of (un)selective fishing on fish communities
bull Understand the characteristics of small scale fisheries
bull Understand the potential (and drive) to stabilise catches
Africa diversity of freshwater and marine systemsFreshwaters bull Rivers Nile Orange Congo Zambezi etc
bull River floodplains Niger Congo Zambezi Kafue Pongolo etc
bull Exorheic swamps Sudd Bangweulu Kamulondo Cuvette Centrale Luapula Shire Malagarasi Lukanga
bull Endorheic wetlands and lakes
Chad Okavango Chilwa Rukwa
bull Man made riverine lakes
Kariba Cabora-Bassa Volta Nasser Kainji
bull Shallow lakes open drainage
George Edward Kyoga Malombe Mweru
bull Large deep lakes Tanganyika Victoria Malawi Turkana etc Marine systems bull Upwelling areas Coastal East and Souther Africa
Mauretania Namibia bull Estuaries River mouths bull Tidal flats Banc drsquoAacuterguin bull Continental flats banks Coastal Mozambique Sofala bank bull Coral reefs Red Sea Coastal Islands Tanzania Kenya bull Seemounts bull Open ocean
Aquaculture amp Fisheries Group Wageningen University
2112011
17
Two important indicators
Catch
Effort
Fopt
C = fqB
Relation productivity amp number of fishermen
y = 30xR2 = 082
y = 26 xR2 = 08157
0
5
10
15
20
25
30
35
40
45
50
0 2 4 6 8 10 12 14 16
Density (fisherskm^2)
Cat
ch (
tKm
^2y
ear)
Malombe
Chilwa
MweruChiuta
Albert
Itezhi-tezhi
Edward
Bangweulu
Tanganyika
Nasser amp Kariba
Turkana Kivu
Malawi
Victoria 19702
Victoria 1990 Victoria 20024
Volta Kainji
Average annual catch rate for African fishers = 3 tonyear irrespective of system
Aquaculture amp Fisheries Group Wageningen University
2112011
18
Information needs towards indicators
Systems differ
in productivity
In variability in productivity
in species communities
in effort dynamics
Contextualising fishing patterns and outcome
Scaled indicators
Systems approach ndash sources catch variability
Physical forcing drivers Rainfall water level nutrient pulsing
Climate el Niňo cycles nutrient upwelling
Landuse runoff rainfall nutrient loading siltation habitat change
Ecological spatial heterogeneity
Fish communities species attributes
Exploitation fishery characteristics
(Co)management structure organisation goals
Aquaculture amp Fisheries Group Wageningen University
2112011
19
System approach ndash a theory
Physical environment
Ecosystems
Fish communities
Fishing techniques
Fisheries management
Economics
Administration
Env
ironm
ent
Ecosystem drivers ndash pulsed stable
Physical environment
Ecosystems
Fish communities
Fishing techniques
Fisheries management
Economics
Administration
Env
ironm
ent
Aquaculture amp Fisheries Group Wageningen University
2112011
20
Okavango ndash highly pulsed system
Fluctuating environment Unpredictable
Mortality = density independent high often catastrophic
Population = variable in time less than carrying capacity
Freshwater Lake MalawiVictoria ndash constant system
Stable environment predictable
Mortality density dependent low constant
Population size constant in time around carrying capacity
Aquaculture amp Fisheries Group Wageningen University
2112011
21
Marine Red River Estuary Variable Predictable
What are the dominant life history strategies
What are the dominant life history strategies
Marine Komodo Coral Reefs Highly Stable Predictable
Aquaculture amp Fisheries Group Wageningen University
2112011
22
Drivers ndash waterlevels ndash nutrient pulsing
Scale of variation
Time Process
decadal community
annual stocks
seasonal year class
Monthly industrial catch rate clupeids lake Tanganyika
1955 1960 1965 1970 1975 1980 1985 1990 1995
Year
0
1
2
3
4
5
6
7
8
x 1000 kgvessel
small
Drivers ndash wind stress ndash nutrient upwelling
decadal annual seasonal variation
Aquaculture amp Fisheries Group Wageningen University
2112011
23
Drivers ndash weather patterns ndash nutrient upwelling
Normal pattern
Effect=1-2 years signal clear Yes
El Nino pattern
Drivers Eutrophication Lake Victoria eutrophication through increase nutrient loading related to landuse
Aquaculture amp Fisheries Group Wageningen University
2112011
24
Assignment 1 Drivers Your situation
What type of system
stable ndash pulsed
What drivers are important climate wind waterlevel droughts upwelling eutrophication land
use change
What indicators needed for assessment
What datainformation is needed to monitor longterm developments
Who haswhere is this information available
Fish communities
Physical environment
Ecosystems
Fish communities
Fishing techniques
Fisheries management
Economics
Administration
Env
ironm
ent
Aquaculture amp Fisheries Group Wageningen University
2112011
25
A Lindeman pyramid illustrating
a fish community
Size
Biomass
The biomass-size distribution important indicators in both single species and community studies
A fish community
Fish communities ndash size biomass trophic groups
Size of individual fish
Competition
Predation
Detrivores Herbivores Zooplanktivores etc
Piscivores
Aquaculture amp Fisheries Group Wageningen University
2112011
26
Tilapia ndash Oreochromis mossmbicus detrivore
Small Clupeidae zooplanktivores
Lake Tanganyika
bull Limnothrissa miodon 17 cm (top)
bull Stolothrissa tanganicae 10 cm
Lake Mweru
bullMicrothrissa moeruensis 6cm
Aquaculture amp Fisheries Group Wageningen University
2112011
27
Small zooplankton ndash from eutrophic Tjeukemeer
Nile Perch from Lake Victoria Piscivore
Aquaculture amp Fisheries Group Wageningen University
2112011
28
Haplochromis Species From Nile Perch Stomachs
Lake Mweru ndash a fish community
Length (cm)
MolluscInsect
Cyprinidae (5)Cichlidae (3)Mormyridae (5)Bagridae (2)Mochokidae (3)TylochromisOreochromisClariidae (2)Serranochromis (2)HydrocynusSchilbeidae (2)AlestesOthers (50)
Molluscivore
MicrophytovorePiscivore
5 10 15 20 25 30 35 40 45 50 55 60 65 70 75 80 850
25
50
75
100
125
150
175
200
1970 - 1972
Aquaculture amp Fisheries Group Wageningen University
2112011
29
Size
Biomass
Multispecies fisheries Mweru ndash all sizes and trophic
levelshellip
hellip and all levels are fished
Assignment 2 Fish communities my situation
How many different species are there in the fishery
Which are most important
What biomass (large ndash medium small)
What maximum sizes (large ndash medium ndash small)
What trophic levels (piscivores herbivores benthivores)
What spaces (pelagic demersal migratory)
Draw the most important species into a biomass size spectrum
order them by maximum size trophic level and space (pelagics on top demersal on the bottom)
Aquaculture amp Fisheries Group Wageningen University
2112011
30
Physical environment
Ecosystems
Fish communities
Fishing techniques
Fisheries management
Economics
Administration
Env
ironm
ent
Fish species ndash resilience to fishing
Change in Fish Communities Fishing Environment
Size of individual fish
Competition
Predation
Detrivores Herbivores Zooplanktivores etc
Piscivores
Fishing pressure
Aquaculture amp Fisheries Group Wageningen University
2112011
31
Catch development in a multispecies fishery
Catch
Fishing effort
Fishing down process ndash example Oueme river
Succession of species
black disappeared lt1965
hatched seriously reduced
peak yields around 10000 ton in rsquo50rsquo60ies
Why are some species less resilient to fishing
Aquaculture amp Fisheries Group Wageningen University
2112011
32
time
N
Population growth
Logistic population growth dNdt=r0N(1NK)
K carrying capacity (Nmax)
r0 steepness of the increase
Life history strategies r and Kselected species
rselected species small shortlived high reproductive rates (sardines)
Rapid growth and development Early maturation many offspring with low survival rates Population size below carrying capacity Minimal parental careoffspring Use unpredictable or unstable habitats Abundance varies greatly in time and space Generalists limited niche or trophic specialisation Resources rarely limiting (no competition) Wide dispersal good colonisers rapid response to disturbance Selection for productivity
Anchovy Max age 3-4 years
r=43 Population doubling time lt15 months
Aquaculture amp Fisheries Group Wageningen University
2112011
33
Life history strategies r and Kselected species
Kselected species large longlived lower reproductive rates (sharks rays)
Slow growth long life span Fewer offspring with higher survival rates Population size operate near carrying capacity (K) Use more predictable or stable habitats Parental care is common Abundance stable over time Specialists efficient users of a particular environment (niche
specialist) Resources often become limiting competition Poor colonizers of new or empty habitats (no dispersal) Selection for efficiency (competitive ability)
Hammerhead sharkMax age 14 years
r=08 PDT = 45 ndash 14 years
Not the complete story fish are more plastichellip
Aquaculture amp Fisheries Group Wageningen University
2112011
34
Three basic life history strategiesGrowth
(population)
SurvivalFecundity
Opportunist strategist small shortliving early maturing fish asymp rselected
Periodic strategist high fecundity longer lifespan
Equilibrium strategist medium size some parental care few but larger offspring asymp Kselected
Winemiller and Rose 1992
King and McFarlane 2003
Intermediate strategist
Opportunistic strategist
Early maturing fish frequent reproduction extended spawning period rapid larval growth high population turnover rate (PB = Z = r) eg mosquito fish Marginal habitats (eg like terrestrialaquatic ecotone)
More common in tropical freshwaters
Rarely exploited (small size) otherwise no management needed but to protect founder populations
Aquaculture amp Fisheries Group Wageningen University
2112011
35
Equilibrium strategist
Large adult body size parental care behaviour
Tropical (stable) fresh waters coral reefs (K)
Density dependent processes and resource limitation
Management maintenance of a productive environment and a healthy adult stocks
Periodic strategist
Maximises age specific fecundity at the expense of juvenile survivorship
If favorable conditions for immatures = periodic synchronous reproduction in phase with periodicity of large numbers
of small offspring
Weak stock recruitment relationships
Management maintain a critical density of adults stocks Protect spawning season andor habitat
Aquaculture amp Fisheries Group Wageningen University
2112011
36
Fishbase species resilience to fishing pressure life
history
Three categories of species resilience to fishing Very lowlow ndash medium ndash high
Based on lifehistory characteristics reproduction feeding and spatial behavior
Through the effects of survival fecundity and growth
trophic position
migratory behaviour
See FishBase wwwfishbaseorg
Lake Mweru ndash Mormyrops anguilloides
Resilience Low
Minimum population doubling time = generation time 8 years
Life span 24 years
Max length 150 cm
Lengthage2at2maturity 65 cm 5 years
Trophic level 36
Migratory no
Intermediateperiodic
Aquaculture amp Fisheries Group Wageningen University
2112011
37
Lake Mweru Hydrocynus vittatus
Resilience Mediumlow
Generation time 3 years
Life span 11 years
Max length 105 cm FL
Lengthage2at2maturity 42 cm 2years
Trophic level 44
Migratory yes spawning migrations
Periodic
Lake Mweru Oreochromis mweruensis
Lake Mweru
Resilience High
Minimum population doubling time lt 15 months
Life span 11 years
Max length 40 cm
Lengthage2at2maturity 15 cm 1year
Trophic level 20
Migratory no
Intermediate opportunistc
Aquaculture amp Fisheries Group Wageningen University
2112011
38
Lake Mweru Microthrissa moeruensis
bull Z = PB ~ 5 ndash 7
Resilience High
Generation time 6 months
Life span 25 years
Max length 5 cm
Lengthage2at2first maturity 3 cm04 year
Trophic level 20 ndash 30
Migratory no
Lake MweruOpportunistic
Assignment 3 Resilience to fishing my situation
Use main species in the fishery in assignment 2 (choose at least three) What is their productivityresilience to fishing
What characteristics are used to assess thisbull Size longevity reproduction feeding spatial behaviour
What is the turnover time (PB = Z = r)
Use Fishbase to find out these characteristics What indicators
What datainformation is needed Who haswhere is this information available
Aquaculture amp Fisheries Group Wageningen University
2112011
39
Fishing pressure fish communities and system stability
Physical environment
Ecosystems
Fish communities
Fishing techniques
Fisheries management
Economics
Administration
Env
ironm
ent
Change in Fish Communities Fishing Environment
Size of individual fish
Competition
Predation
Detrivores Herbivores Zooplanktivores etc
Piscivores
Fishing pressure
Aquaculture amp Fisheries Group Wageningen University
2112011
40
Change in Fish Communities Fishing Environment
Piscivores
Size of individual fish
Competition
Predation
Detrivores Herbivores Zooplanktivores etc
Fishing pressure
driving force
Drivers climate wind waterlevel droughts upwelling eutrophication
Fish Communities ndash population regulation
Constant systems
Pulsed systems
Population regulation
nonselective catastrophic mortality
(environmentdominant)
selective mortality (predation competitiondominant)
environment determines prevailing mortality pattern
Aquaculture amp Fisheries Group Wageningen University
2112011
41
Most ecological processes and life history traits can be related to the prevailing mortality pattern
Life history and natural selection
0
20
40
60
80
100
0 1 2 3 4 5 6 7 8
Relative age (years)
Abu
ndan
ce (
N)
but large fish have more eggs
50 cm = 1 mill eggs 100 cm = 16 mill eggs
Age at 50 maturity
Young fish are supposed to die only a fraction will spawn
Aquaculture amp Fisheries Group Wageningen University
2112011
42
Fishing mortality
Age (years)
Inst
anta
neou
s ra
te o
f m
orta
lity
Predation mortality
From ICES (1997)
is almost exactly oppositeSelectivity predation versus fishing
Management promotes harvesting patterns that is opposite to what most fish stock are naturally adapted to
effort
Age and size structure changesunder selective fishing to younger and smaller individuals
A sign of fishing hellip
Aquaculture amp Fisheries Group Wageningen University
2112011
43
Median age-at-maturation of Northeast Arctic cod (Joslashrgensen 1990 Jorgensen et al 2007 Science Conover et al )
and this is what happens
Fishery induced evolution (nr species)
Maturity lower age (6)
Maturity lower size (7)
Reduced growth (6)
Increase fecundity (3)
Loss genetic div (3)
Leading to lower yields
Small
Random
Large
Increased mortality on
Mean individual weight at age after 4 generations
Evidence Size selection (Growth)
= genetic changes
After Conover and Munch 2002Atlantic silverside Menidia menidia max age=2 years R= PDT lt15 months r=58
Aquaculture amp Fisheries Group Wageningen University
2112011
44
Effect of sizeselective fishing (Yield)
Trends in average total weight harvested across multiple generations of size-selective exploitation
Mortality on
Size selective fishing with large mesh sizes on adults We are deliberately pushing stocks to genetically
stable smaller sizes
Small
Random
Large
The rK selection principle the effects of selective
fishing
Age (size)
Abu
ndan
ce (L
og N
)
Slope = total mortality rate Z = r
Increased juvenile mortality= K-selection
Increased adult mortality= r-selection
r-selection Unstable environment abiotic mortality ndash non-predictive non-selectiveK-selection Stable environment biotic mortality (predation) ndash predictive size selective
Aquaculture amp Fisheries Group Wageningen University
2112011
45
Abundance size spectra
Abu
ndan
ce
Size
The distribution of abundance by size follows regular patterns
slope steepens when large fish removed
phytoplankton
zooplankton
small fish
big fish
Year
1976 1978 1980 1982 1984 1986 1988 1990 1992 1994
Slo
pe
-10
-9
-8
-7
-6
-5
Rice amp Gislason (1996)
Trends in size-spectrum slopes of the North Sea
Fishing effects on community sizestructure
Aquaculture amp Fisheries Group Wageningen University
2112011
46
Question
How do you fish a multispecies community
Selective ndash Targeting large sizes with single gears
Unselective ndash Targeting all sizes with many gears
Multispecies community
How should it be harvested
What should be minimum mesh-size
Aquaculture amp Fisheries Group Wageningen University
2112011
47
Selective fishing will change the slope
Biomasssize distributions
Example from lake Kariba Zambiawhere fishers are using illegal smallmeshed nets
The system remains unchanged except everything is less
Kolding et al 2003
Parallel slopes only intercept lower
Aquaculture amp Fisheries Group Wageningen University
2112011
48
2
3
4
5
Tro
phic
leve
l
Pauly et al (1998)
Fishing down the food web
Example from Lake Volta Ghana
The whole fish community is targeted highly pulsed system
highly dynamic fishery (spatial temporal movements fishermen)
27 fishing methods
25 kgday
74 species utilized
All trophic levels utilized by combining gears with specific trophic profiles 1 2 3 4 5Trophic level
Gears in the fishery ( species sample size)
Van Zwieten et al 2008
Aquaculture amp Fisheries Group Wageningen University
2112011
49
Is nonselective fishing bad
There is no empirical evidence
On the contrary we know that selective fishing is bad but we still advocate it
But how do we impose gear mesh and size restrictions in a multispecies fishery
The optimum fishing pattern is un-selective How much
How
Is fishing down the food web bad
Where is the highest production
Sohellip what is the best fishing pattern
What if we fish everything
A non-selective harvesting pattern is ecosystem conserving
The system remains intact but everything is less
This means fishing down the food-web
Aquaculture amp Fisheries Group Wageningen University
2112011
50
Indicators ndash biomass size distribution
Size of individual fish
Biomass Unexploited Population = Blt40
Maximum length = Lmax10
Fishing pressure
Mean length exploited population = L5
Biomass Exploited Population = Bgt40
Mean length total= Lmean
Intercept = Iasd
Assignment 4 Fishing down my situation
Characterise your fishery Single species single gear ndash multigear
Specific target species ndash all species are targeted (multispecies)
Specific size ndash all sizes (quantify)
Is there a shift from large specimen to small
Is there a shift from large species ndash to small Is there a shift in trophic level
What information is needed What indicators
Where to get this information
Aquaculture amp Fisheries Group Wageningen University
2112011
51
Dynamics of fishing ndash stabilise catch variability
Physical environment
Ecosystems
Fish communities
Fishing techniques
Fisheries management
Economics
Administration
Env
ironm
ent
Diversity in methods ndash small units adaptive
Hook and line fisherman
Lake Jaba Nigeria
Trap fishermen
Lake Mweru Zambia
Aquaculture amp Fisheries Group Wageningen University
2112011
52
Labor intensive beach seining on demersals
Small fish common Chilimira seine small pelagics
Aquaculture amp Fisheries Group Wageningen University
2112011
53
Innovative Nkacha seine small demersals
Unevenly distributed ndash important gears lake Mweru
Aquaculture amp Fisheries Group Wageningen University
2112011
54
Highly mobile ndash movement fishermen Lake Malawi
movement one fisherman in 6 months
SE Arm of Lake Malawi
Characteristics of smallscale fisheries
Small units simple processing small scale trading
Methods diverse innovative labor intensive
Opportunistic adaptive
Large subsistence element (small fish)
Unevenly distributed highly mobile
Aquaculture amp Fisheries Group Wageningen University
2112011
55
Fishing mortality (F)
number of units
efficiency
Effort (f)
Catchability (q)Fishing mortality (F)
More of the same
Decreasing numbers = management
Better methods = Increasing efficiency
=development
So while we both lsquomanagersquo and lsquodeveloprsquo the fishing mortality stays the same
Uh
Tradeoffs Economic efficiency vs employment
opportunities
0
20
40
60
80
100
120
140
160
180
1945 1950 1955 1960 1965 1970 1975 1980 1985 1990 1995 2000 2005
Fish
erm
en (
1000
)
Cat
ch p
er
fishe
rman
(to
ns)
0
500000
1000000
1500000
2000000
2500000
3000000
3500000
4000000
Qua
ntity
(to
ns)
Quantity (tons) Fishermen (1000) Catch (tons) per fisherman
Total catch numbers of fishers amp catch per fisherman in the Norwegian fishery 1945-2005
Effort (f) decreases while CpUE increases because catchability (q = efficiency) increases
Aquaculture amp Fisheries Group Wageningen University
2112011
56
Assignment 5 Dynamics fishery ndash my situation
How has fishing effort developed over time In terms of numbers (fishermen boats)
In terms of gears bull Types
bull Active ndash passive methods
In terms of spatial distribution
In terms of trophic levels
What informationdata needed What indicators
Who haswhere is this information
Goal
Apply a systems approach to fishery information ndashdevise indicators System
bull Understand the role of environment and fishing as sources of population regulation (mortality)
Species Stocksbull Understand that different species have different resilience to fishing
bull Understand r K principle
Selectivity ndash Catch and effortbull Discuss the consequences of selective and unselective fishing on fish
communities
bull Understand the characteristics of small scale fisheries
Aquaculture amp Fisheries Group Wageningen University
2112011
57
Summary All species and systems ndash important sets of
indicators
Effort (numbers types)
Species (composition in catch)
Catch (by species total)
Catch per unit Effort (~relative biomass)
Length (in catch at maturity)
Drivers (as explanatory factor)
copy Wageningen UR
End hellipbeginning
Aquaculture amp Fisheries Group Wageningen University
2112011
58
Summary environment species resilience management Life history strategy Opportunistic Periodic Equilibrium Environment Temporally stochastic
with small-scale patches
Seasonal with large-scale patches
Stable with fine-scaled spatial variation
Demographic trade-off 1 age at maturity 2 fecundity 3 juvenile survivorship
low low low
high high low
high low high
Demographic character Maximise (re)colonising capability of habitats over small spatial scales
Maximise age-specific fecundity spreading of reproductive effort over many years andor large areas
Maximise juvenile survivorship in resource limited density-dependent environments
Life history traits - size - age at maturity - size at maturity - clutch size - egg size - larvalYOY growth - reproductive season - parental care
Small Early Small Small Small Rapid Long No
Large Delayed Mediumlarge Large Small Rapid Short No
Smallmedium Delayed Medium Small Large Slow Long Yes
- Maintain critical minimum spawning biomass
- Maintain appropriate age structure (including large specimen)
- Maintenance of adult stock
Primary management objectives
- Protection against large scale or chronic perturbations that eliminate key refugia in space and time
- Spatial refuges directed at adult stock (including spawning habitats and migration routes)
- Maintain integrity of adult habitat
Environment
Demographic trade-offs
Life history traits
Management objectives

Aquaculture amp Fisheries Group Wageningen University
2112011
4
Participation
Writing history together
Users and information needs changing role of
science in evaluations
Aquaculture amp Fisheries Group Wageningen University
2112011
5
Perceptions on stock sizes of researchers and fishers
1970 1975 1980 1985 1990 1995 2000 20050
20000
40000
60000
80000
100000
Exp
loita
ble
stoc
k (to
nnes
)
sole
Catch ratesStock size
Photo Van Densen
More inclusive stakeholder involvement the information
challenge
Fishers Managers
Greens TradersSupermarkets general
public
DataInformationKnowledge
Role of science
Measurement Historical data Sensitivity Theoretical basis
B F important
Responsiveness to action
Costs
Total pressure (C f F) important
Related to quality notions of good practice
Selectivity important (q) - labels
Experts
Related to experience spaces
Catch efficiency (Cf q) important
Aquaculture amp Fisheries Group Wageningen University
2112011
6
Management cycle Quantified objective
eg Y=50 kgha1 yr 1
Evaluation
eg Y too low overfishing
Management measure
eg 30 reduction in number of boats
Information
monitoring catches
eg Y=30 kgha1 yr 1
Feedback
Userstakeholder preferences
Biological potentials and constraints
Resource use problemFrom values hellip
hellipto techniqueshellip
hellipto valueshellip
Role of fisheries biologist experience for all
Knowledge
Information
Data
Structuring
Experience learning
Evaluation sensemaking
Aquaculture amp Fisheries Group Wageningen University
2112011
7
Evaluative capacity ndash social learning
Writing history together Fishers managers others
Management objectives ndash information needs
Production planning ldquoFeed the peoplerdquo
Fisheries Management ldquoSet levels of resource usagerdquo
Nature conservation ldquoRetain the integrity of naturerdquo
bull Biological
bull Social and economic
Aquaculture amp Fisheries Group Wageningen University
2112011
8
Only 2 biological questions in fisheries management
How much = Fishing pressure
bull Effort (f )
bull Catch (C)
How = Fishing pattern
bull Catchability (q )
bull Selectivity (s )
How much
How
Why fisheries (stock) assessements
Optimising catches ndash how much
Long term sustainability
Given variable stock sizes
Sharing arrangements catches ndash how much how
Between fishers
Between countries (eg migratory stocks shared seas and lakes)
Assessing sustainability of fisheries ndash how
Total pressure
Selectivity of catches size communities incl fish birds mammals
bull Tracking and tracing
bull Labelling
Habitats
Aquaculture amp Fisheries Group Wageningen University
2112011
9
Focus management and environmentalists on human impact and
control Fishers refer to natural influences Dispute
Catch
Effort
Nature
Fishing community
Researcher
Size
Objective measure
Total effort
Total catch MSY
Main objective to ensure optimalsustainable harvest
Main measure control of fishing effort
Aquaculture amp Fisheries Group Wageningen University
2112011
10
Control of targeted sizes
Bio
mas
s
Length (Age)
Selectivity curve small hook
Selectivity curve large hook
Available biomass Available
biomass
Control of pressure reference level (MSY)
Cat
ch (
= Y
ield
)
Fishing pressure
Overexploited
Maximum Sustainable Yield
Aquaculture amp Fisheries Group Wageningen University
2112011
11
Fisheries management options
Input controls Ban of fishing techniques (q) Maximummin mesh size (q) Change in gear construction (q) Days at sea (f)
Reduce number of gears (f)
Closed areas (f)
Closed seasons (f)
Protection habitats (fq)
B
C F = fq
Output controls (C)
Total allowable catch (TAC)
Individual Transferable Quota (ITQ)
Target specific specieslengths
C = FB
That is all Any available or
conceivable regulation can be reduced to the two terms C and F with goals defined on B
All are through regulating fishing effort
BMSY SSBmin SSBpa Cf MSY
M
R
G
Biomass
F=fq
Nt
t
R
t
tage
Wt
t
Ft
tc
C
Statistical
CEDRS
trends assessment
adaptation
Analytical
Experimental
Research
CEDRS
assessment
predictions
f
q
+ sd
HolisticBlack box approach
Analytical approach
Fisheries science ndash information evaluation
Aquaculture amp Fisheries Group Wageningen University
2112011
12
Data needed for assessment general
Basic data from the fishery
CatchperUnit Effort (tonnes numbers)
Effort (numbers)
Length (cm)
Basic research data
Migration (tagging)
Spawning (recruitment maturity stages areas)
Age
Natural Mortality
Trade offs in multispecies communities ndash no free lunch
MMSY =
Target LimitStay clear off
Aquaculture amp Fisheries Group Wageningen University
2112011
13
Goals data collection needs linkages
Production planning trade Catch Input ndash labor vessels No link
Fisheries management Catch and effort linked By commercial species
Conservation Catch and effort linked Selectivity All species Habitats ecosystems
Increase in
- Resolution
- Linked data
- Costs
Ecosystem based management
Ecosystem based management What is that
Change in information base Fisheries Science = heavy investment in population dynamics Ecosystem = interaction between organisms with each other
and the physical environment New questions arise on habitats and nontarget organisms
Not clear how the fisheries ldquohowrdquo and ldquohow muchrdquo questions can be dealt with Focus on more generic measures as MPArsquos (keeping a bank)
Focus on clarity of information for all involved what info is needed
Aquaculture amp Fisheries Group Wageningen University
2112011
14
Biomass
Models ndash Indicators references and the long view
Fishing mortality = CB
Recruitment
Growth
Natural mortality
Indicator approaches ndash system stakeholder
Size of fish
Biomas s
Fishing
Nutrients
Pressure
Driver
State
Size of fish
Biomas s
Fishing
Nutrients
Pressure
Driver
State
Aquaculture amp Fisheries Group Wageningen University
2112011
15
Indicator approaches ndash system stakeholder
Size of fish
B
io
ma
s s
Fishing
Nutrients
Pressure
Driver
State
Size of fish
B
io
ma
s s
Fishing
Nutrients
Pressure
Driver
State
Fishers Managers
Greens TradersSupermarkets general
public
DataInformationKnowledge
Role of science
Part 2 a system approach
Aquaculture amp Fisheries Group Wageningen University
2112011
16
Goal
Apply a systems approach to fishery information ndashdevising indicators System
bull Understand the role of environment and fishing as sources of population regulation (mortality)
Species Stocksbull Understand that different species have different resilience to fishing
Selectivity ndash Catch and effortbull Understand consequences of (un)selective fishing on fish communities
bull Understand the characteristics of small scale fisheries
bull Understand the potential (and drive) to stabilise catches
Africa diversity of freshwater and marine systemsFreshwaters bull Rivers Nile Orange Congo Zambezi etc
bull River floodplains Niger Congo Zambezi Kafue Pongolo etc
bull Exorheic swamps Sudd Bangweulu Kamulondo Cuvette Centrale Luapula Shire Malagarasi Lukanga
bull Endorheic wetlands and lakes
Chad Okavango Chilwa Rukwa
bull Man made riverine lakes
Kariba Cabora-Bassa Volta Nasser Kainji
bull Shallow lakes open drainage
George Edward Kyoga Malombe Mweru
bull Large deep lakes Tanganyika Victoria Malawi Turkana etc Marine systems bull Upwelling areas Coastal East and Souther Africa
Mauretania Namibia bull Estuaries River mouths bull Tidal flats Banc drsquoAacuterguin bull Continental flats banks Coastal Mozambique Sofala bank bull Coral reefs Red Sea Coastal Islands Tanzania Kenya bull Seemounts bull Open ocean
Aquaculture amp Fisheries Group Wageningen University
2112011
17
Two important indicators
Catch
Effort
Fopt
C = fqB
Relation productivity amp number of fishermen
y = 30xR2 = 082
y = 26 xR2 = 08157
0
5
10
15
20
25
30
35
40
45
50
0 2 4 6 8 10 12 14 16
Density (fisherskm^2)
Cat
ch (
tKm
^2y
ear)
Malombe
Chilwa
MweruChiuta
Albert
Itezhi-tezhi
Edward
Bangweulu
Tanganyika
Nasser amp Kariba
Turkana Kivu
Malawi
Victoria 19702
Victoria 1990 Victoria 20024
Volta Kainji
Average annual catch rate for African fishers = 3 tonyear irrespective of system
Aquaculture amp Fisheries Group Wageningen University
2112011
18
Information needs towards indicators
Systems differ
in productivity
In variability in productivity
in species communities
in effort dynamics
Contextualising fishing patterns and outcome
Scaled indicators
Systems approach ndash sources catch variability
Physical forcing drivers Rainfall water level nutrient pulsing
Climate el Niňo cycles nutrient upwelling
Landuse runoff rainfall nutrient loading siltation habitat change
Ecological spatial heterogeneity
Fish communities species attributes
Exploitation fishery characteristics
(Co)management structure organisation goals
Aquaculture amp Fisheries Group Wageningen University
2112011
19
System approach ndash a theory
Physical environment
Ecosystems
Fish communities
Fishing techniques
Fisheries management
Economics
Administration
Env
ironm
ent
Ecosystem drivers ndash pulsed stable
Physical environment
Ecosystems
Fish communities
Fishing techniques
Fisheries management
Economics
Administration
Env
ironm
ent
Aquaculture amp Fisheries Group Wageningen University
2112011
20
Okavango ndash highly pulsed system
Fluctuating environment Unpredictable
Mortality = density independent high often catastrophic
Population = variable in time less than carrying capacity
Freshwater Lake MalawiVictoria ndash constant system
Stable environment predictable
Mortality density dependent low constant
Population size constant in time around carrying capacity
Aquaculture amp Fisheries Group Wageningen University
2112011
21
Marine Red River Estuary Variable Predictable
What are the dominant life history strategies
What are the dominant life history strategies
Marine Komodo Coral Reefs Highly Stable Predictable
Aquaculture amp Fisheries Group Wageningen University
2112011
22
Drivers ndash waterlevels ndash nutrient pulsing
Scale of variation
Time Process
decadal community
annual stocks
seasonal year class
Monthly industrial catch rate clupeids lake Tanganyika
1955 1960 1965 1970 1975 1980 1985 1990 1995
Year
0
1
2
3
4
5
6
7
8
x 1000 kgvessel
small
Drivers ndash wind stress ndash nutrient upwelling
decadal annual seasonal variation
Aquaculture amp Fisheries Group Wageningen University
2112011
23
Drivers ndash weather patterns ndash nutrient upwelling
Normal pattern
Effect=1-2 years signal clear Yes
El Nino pattern
Drivers Eutrophication Lake Victoria eutrophication through increase nutrient loading related to landuse
Aquaculture amp Fisheries Group Wageningen University
2112011
24
Assignment 1 Drivers Your situation
What type of system
stable ndash pulsed
What drivers are important climate wind waterlevel droughts upwelling eutrophication land
use change
What indicators needed for assessment
What datainformation is needed to monitor longterm developments
Who haswhere is this information available
Fish communities
Physical environment
Ecosystems
Fish communities
Fishing techniques
Fisheries management
Economics
Administration
Env
ironm
ent
Aquaculture amp Fisheries Group Wageningen University
2112011
25
A Lindeman pyramid illustrating
a fish community
Size
Biomass
The biomass-size distribution important indicators in both single species and community studies
A fish community
Fish communities ndash size biomass trophic groups
Size of individual fish
Competition
Predation
Detrivores Herbivores Zooplanktivores etc
Piscivores
Aquaculture amp Fisheries Group Wageningen University
2112011
26
Tilapia ndash Oreochromis mossmbicus detrivore
Small Clupeidae zooplanktivores
Lake Tanganyika
bull Limnothrissa miodon 17 cm (top)
bull Stolothrissa tanganicae 10 cm
Lake Mweru
bullMicrothrissa moeruensis 6cm
Aquaculture amp Fisheries Group Wageningen University
2112011
27
Small zooplankton ndash from eutrophic Tjeukemeer
Nile Perch from Lake Victoria Piscivore
Aquaculture amp Fisheries Group Wageningen University
2112011
28
Haplochromis Species From Nile Perch Stomachs
Lake Mweru ndash a fish community
Length (cm)
MolluscInsect
Cyprinidae (5)Cichlidae (3)Mormyridae (5)Bagridae (2)Mochokidae (3)TylochromisOreochromisClariidae (2)Serranochromis (2)HydrocynusSchilbeidae (2)AlestesOthers (50)
Molluscivore
MicrophytovorePiscivore
5 10 15 20 25 30 35 40 45 50 55 60 65 70 75 80 850
25
50
75
100
125
150
175
200
1970 - 1972
Aquaculture amp Fisheries Group Wageningen University
2112011
29
Size
Biomass
Multispecies fisheries Mweru ndash all sizes and trophic
levelshellip
hellip and all levels are fished
Assignment 2 Fish communities my situation
How many different species are there in the fishery
Which are most important
What biomass (large ndash medium small)
What maximum sizes (large ndash medium ndash small)
What trophic levels (piscivores herbivores benthivores)
What spaces (pelagic demersal migratory)
Draw the most important species into a biomass size spectrum
order them by maximum size trophic level and space (pelagics on top demersal on the bottom)
Aquaculture amp Fisheries Group Wageningen University
2112011
30
Physical environment
Ecosystems
Fish communities
Fishing techniques
Fisheries management
Economics
Administration
Env
ironm
ent
Fish species ndash resilience to fishing
Change in Fish Communities Fishing Environment
Size of individual fish
Competition
Predation
Detrivores Herbivores Zooplanktivores etc
Piscivores
Fishing pressure
Aquaculture amp Fisheries Group Wageningen University
2112011
31
Catch development in a multispecies fishery
Catch
Fishing effort
Fishing down process ndash example Oueme river
Succession of species
black disappeared lt1965
hatched seriously reduced
peak yields around 10000 ton in rsquo50rsquo60ies
Why are some species less resilient to fishing
Aquaculture amp Fisheries Group Wageningen University
2112011
32
time
N
Population growth
Logistic population growth dNdt=r0N(1NK)
K carrying capacity (Nmax)
r0 steepness of the increase
Life history strategies r and Kselected species
rselected species small shortlived high reproductive rates (sardines)
Rapid growth and development Early maturation many offspring with low survival rates Population size below carrying capacity Minimal parental careoffspring Use unpredictable or unstable habitats Abundance varies greatly in time and space Generalists limited niche or trophic specialisation Resources rarely limiting (no competition) Wide dispersal good colonisers rapid response to disturbance Selection for productivity
Anchovy Max age 3-4 years
r=43 Population doubling time lt15 months
Aquaculture amp Fisheries Group Wageningen University
2112011
33
Life history strategies r and Kselected species
Kselected species large longlived lower reproductive rates (sharks rays)
Slow growth long life span Fewer offspring with higher survival rates Population size operate near carrying capacity (K) Use more predictable or stable habitats Parental care is common Abundance stable over time Specialists efficient users of a particular environment (niche
specialist) Resources often become limiting competition Poor colonizers of new or empty habitats (no dispersal) Selection for efficiency (competitive ability)
Hammerhead sharkMax age 14 years
r=08 PDT = 45 ndash 14 years
Not the complete story fish are more plastichellip
Aquaculture amp Fisheries Group Wageningen University
2112011
34
Three basic life history strategiesGrowth
(population)
SurvivalFecundity
Opportunist strategist small shortliving early maturing fish asymp rselected
Periodic strategist high fecundity longer lifespan
Equilibrium strategist medium size some parental care few but larger offspring asymp Kselected
Winemiller and Rose 1992
King and McFarlane 2003
Intermediate strategist
Opportunistic strategist
Early maturing fish frequent reproduction extended spawning period rapid larval growth high population turnover rate (PB = Z = r) eg mosquito fish Marginal habitats (eg like terrestrialaquatic ecotone)
More common in tropical freshwaters
Rarely exploited (small size) otherwise no management needed but to protect founder populations
Aquaculture amp Fisheries Group Wageningen University
2112011
35
Equilibrium strategist
Large adult body size parental care behaviour
Tropical (stable) fresh waters coral reefs (K)
Density dependent processes and resource limitation
Management maintenance of a productive environment and a healthy adult stocks
Periodic strategist
Maximises age specific fecundity at the expense of juvenile survivorship
If favorable conditions for immatures = periodic synchronous reproduction in phase with periodicity of large numbers
of small offspring
Weak stock recruitment relationships
Management maintain a critical density of adults stocks Protect spawning season andor habitat
Aquaculture amp Fisheries Group Wageningen University
2112011
36
Fishbase species resilience to fishing pressure life
history
Three categories of species resilience to fishing Very lowlow ndash medium ndash high
Based on lifehistory characteristics reproduction feeding and spatial behavior
Through the effects of survival fecundity and growth
trophic position
migratory behaviour
See FishBase wwwfishbaseorg
Lake Mweru ndash Mormyrops anguilloides
Resilience Low
Minimum population doubling time = generation time 8 years
Life span 24 years
Max length 150 cm
Lengthage2at2maturity 65 cm 5 years
Trophic level 36
Migratory no
Intermediateperiodic
Aquaculture amp Fisheries Group Wageningen University
2112011
37
Lake Mweru Hydrocynus vittatus
Resilience Mediumlow
Generation time 3 years
Life span 11 years
Max length 105 cm FL
Lengthage2at2maturity 42 cm 2years
Trophic level 44
Migratory yes spawning migrations
Periodic
Lake Mweru Oreochromis mweruensis
Lake Mweru
Resilience High
Minimum population doubling time lt 15 months
Life span 11 years
Max length 40 cm
Lengthage2at2maturity 15 cm 1year
Trophic level 20
Migratory no
Intermediate opportunistc
Aquaculture amp Fisheries Group Wageningen University
2112011
38
Lake Mweru Microthrissa moeruensis
bull Z = PB ~ 5 ndash 7
Resilience High
Generation time 6 months
Life span 25 years
Max length 5 cm
Lengthage2at2first maturity 3 cm04 year
Trophic level 20 ndash 30
Migratory no
Lake MweruOpportunistic
Assignment 3 Resilience to fishing my situation
Use main species in the fishery in assignment 2 (choose at least three) What is their productivityresilience to fishing
What characteristics are used to assess thisbull Size longevity reproduction feeding spatial behaviour
What is the turnover time (PB = Z = r)
Use Fishbase to find out these characteristics What indicators
What datainformation is needed Who haswhere is this information available
Aquaculture amp Fisheries Group Wageningen University
2112011
39
Fishing pressure fish communities and system stability
Physical environment
Ecosystems
Fish communities
Fishing techniques
Fisheries management
Economics
Administration
Env
ironm
ent
Change in Fish Communities Fishing Environment
Size of individual fish
Competition
Predation
Detrivores Herbivores Zooplanktivores etc
Piscivores
Fishing pressure
Aquaculture amp Fisheries Group Wageningen University
2112011
40
Change in Fish Communities Fishing Environment
Piscivores
Size of individual fish
Competition
Predation
Detrivores Herbivores Zooplanktivores etc
Fishing pressure
driving force
Drivers climate wind waterlevel droughts upwelling eutrophication
Fish Communities ndash population regulation
Constant systems
Pulsed systems
Population regulation
nonselective catastrophic mortality
(environmentdominant)
selective mortality (predation competitiondominant)
environment determines prevailing mortality pattern
Aquaculture amp Fisheries Group Wageningen University
2112011
41
Most ecological processes and life history traits can be related to the prevailing mortality pattern
Life history and natural selection
0
20
40
60
80
100
0 1 2 3 4 5 6 7 8
Relative age (years)
Abu
ndan
ce (
N)
but large fish have more eggs
50 cm = 1 mill eggs 100 cm = 16 mill eggs
Age at 50 maturity
Young fish are supposed to die only a fraction will spawn
Aquaculture amp Fisheries Group Wageningen University
2112011
42
Fishing mortality
Age (years)
Inst
anta
neou
s ra
te o
f m
orta
lity
Predation mortality
From ICES (1997)
is almost exactly oppositeSelectivity predation versus fishing
Management promotes harvesting patterns that is opposite to what most fish stock are naturally adapted to
effort
Age and size structure changesunder selective fishing to younger and smaller individuals
A sign of fishing hellip
Aquaculture amp Fisheries Group Wageningen University
2112011
43
Median age-at-maturation of Northeast Arctic cod (Joslashrgensen 1990 Jorgensen et al 2007 Science Conover et al )
and this is what happens
Fishery induced evolution (nr species)
Maturity lower age (6)
Maturity lower size (7)
Reduced growth (6)
Increase fecundity (3)
Loss genetic div (3)
Leading to lower yields
Small
Random
Large
Increased mortality on
Mean individual weight at age after 4 generations
Evidence Size selection (Growth)
= genetic changes
After Conover and Munch 2002Atlantic silverside Menidia menidia max age=2 years R= PDT lt15 months r=58
Aquaculture amp Fisheries Group Wageningen University
2112011
44
Effect of sizeselective fishing (Yield)
Trends in average total weight harvested across multiple generations of size-selective exploitation
Mortality on
Size selective fishing with large mesh sizes on adults We are deliberately pushing stocks to genetically
stable smaller sizes
Small
Random
Large
The rK selection principle the effects of selective
fishing
Age (size)
Abu
ndan
ce (L
og N
)
Slope = total mortality rate Z = r
Increased juvenile mortality= K-selection
Increased adult mortality= r-selection
r-selection Unstable environment abiotic mortality ndash non-predictive non-selectiveK-selection Stable environment biotic mortality (predation) ndash predictive size selective
Aquaculture amp Fisheries Group Wageningen University
2112011
45
Abundance size spectra
Abu
ndan
ce
Size
The distribution of abundance by size follows regular patterns
slope steepens when large fish removed
phytoplankton
zooplankton
small fish
big fish
Year
1976 1978 1980 1982 1984 1986 1988 1990 1992 1994
Slo
pe
-10
-9
-8
-7
-6
-5
Rice amp Gislason (1996)
Trends in size-spectrum slopes of the North Sea
Fishing effects on community sizestructure
Aquaculture amp Fisheries Group Wageningen University
2112011
46
Question
How do you fish a multispecies community
Selective ndash Targeting large sizes with single gears
Unselective ndash Targeting all sizes with many gears
Multispecies community
How should it be harvested
What should be minimum mesh-size
Aquaculture amp Fisheries Group Wageningen University
2112011
47
Selective fishing will change the slope
Biomasssize distributions
Example from lake Kariba Zambiawhere fishers are using illegal smallmeshed nets
The system remains unchanged except everything is less
Kolding et al 2003
Parallel slopes only intercept lower
Aquaculture amp Fisheries Group Wageningen University
2112011
48
2
3
4
5
Tro
phic
leve
l
Pauly et al (1998)
Fishing down the food web
Example from Lake Volta Ghana
The whole fish community is targeted highly pulsed system
highly dynamic fishery (spatial temporal movements fishermen)
27 fishing methods
25 kgday
74 species utilized
All trophic levels utilized by combining gears with specific trophic profiles 1 2 3 4 5Trophic level
Gears in the fishery ( species sample size)
Van Zwieten et al 2008
Aquaculture amp Fisheries Group Wageningen University
2112011
49
Is nonselective fishing bad
There is no empirical evidence
On the contrary we know that selective fishing is bad but we still advocate it
But how do we impose gear mesh and size restrictions in a multispecies fishery
The optimum fishing pattern is un-selective How much
How
Is fishing down the food web bad
Where is the highest production
Sohellip what is the best fishing pattern
What if we fish everything
A non-selective harvesting pattern is ecosystem conserving
The system remains intact but everything is less
This means fishing down the food-web
Aquaculture amp Fisheries Group Wageningen University
2112011
50
Indicators ndash biomass size distribution
Size of individual fish
Biomass Unexploited Population = Blt40
Maximum length = Lmax10
Fishing pressure
Mean length exploited population = L5
Biomass Exploited Population = Bgt40
Mean length total= Lmean
Intercept = Iasd
Assignment 4 Fishing down my situation
Characterise your fishery Single species single gear ndash multigear
Specific target species ndash all species are targeted (multispecies)
Specific size ndash all sizes (quantify)
Is there a shift from large specimen to small
Is there a shift from large species ndash to small Is there a shift in trophic level
What information is needed What indicators
Where to get this information
Aquaculture amp Fisheries Group Wageningen University
2112011
51
Dynamics of fishing ndash stabilise catch variability
Physical environment
Ecosystems
Fish communities
Fishing techniques
Fisheries management
Economics
Administration
Env
ironm
ent
Diversity in methods ndash small units adaptive
Hook and line fisherman
Lake Jaba Nigeria
Trap fishermen
Lake Mweru Zambia
Aquaculture amp Fisheries Group Wageningen University
2112011
52
Labor intensive beach seining on demersals
Small fish common Chilimira seine small pelagics
Aquaculture amp Fisheries Group Wageningen University
2112011
53
Innovative Nkacha seine small demersals
Unevenly distributed ndash important gears lake Mweru
Aquaculture amp Fisheries Group Wageningen University
2112011
54
Highly mobile ndash movement fishermen Lake Malawi
movement one fisherman in 6 months
SE Arm of Lake Malawi
Characteristics of smallscale fisheries
Small units simple processing small scale trading
Methods diverse innovative labor intensive
Opportunistic adaptive
Large subsistence element (small fish)
Unevenly distributed highly mobile
Aquaculture amp Fisheries Group Wageningen University
2112011
55
Fishing mortality (F)
number of units
efficiency
Effort (f)
Catchability (q)Fishing mortality (F)
More of the same
Decreasing numbers = management
Better methods = Increasing efficiency
=development
So while we both lsquomanagersquo and lsquodeveloprsquo the fishing mortality stays the same
Uh
Tradeoffs Economic efficiency vs employment
opportunities
0
20
40
60
80
100
120
140
160
180
1945 1950 1955 1960 1965 1970 1975 1980 1985 1990 1995 2000 2005
Fish
erm
en (
1000
)
Cat
ch p
er
fishe
rman
(to
ns)
0
500000
1000000
1500000
2000000
2500000
3000000
3500000
4000000
Qua
ntity
(to
ns)
Quantity (tons) Fishermen (1000) Catch (tons) per fisherman
Total catch numbers of fishers amp catch per fisherman in the Norwegian fishery 1945-2005
Effort (f) decreases while CpUE increases because catchability (q = efficiency) increases
Aquaculture amp Fisheries Group Wageningen University
2112011
56
Assignment 5 Dynamics fishery ndash my situation
How has fishing effort developed over time In terms of numbers (fishermen boats)
In terms of gears bull Types
bull Active ndash passive methods
In terms of spatial distribution
In terms of trophic levels
What informationdata needed What indicators
Who haswhere is this information
Goal
Apply a systems approach to fishery information ndashdevise indicators System
bull Understand the role of environment and fishing as sources of population regulation (mortality)
Species Stocksbull Understand that different species have different resilience to fishing
bull Understand r K principle
Selectivity ndash Catch and effortbull Discuss the consequences of selective and unselective fishing on fish
communities
bull Understand the characteristics of small scale fisheries
Aquaculture amp Fisheries Group Wageningen University
2112011
57
Summary All species and systems ndash important sets of
indicators
Effort (numbers types)
Species (composition in catch)
Catch (by species total)
Catch per unit Effort (~relative biomass)
Length (in catch at maturity)
Drivers (as explanatory factor)
copy Wageningen UR
End hellipbeginning
Aquaculture amp Fisheries Group Wageningen University
2112011
58
Summary environment species resilience management Life history strategy Opportunistic Periodic Equilibrium Environment Temporally stochastic
with small-scale patches
Seasonal with large-scale patches
Stable with fine-scaled spatial variation
Demographic trade-off 1 age at maturity 2 fecundity 3 juvenile survivorship
low low low
high high low
high low high
Demographic character Maximise (re)colonising capability of habitats over small spatial scales
Maximise age-specific fecundity spreading of reproductive effort over many years andor large areas
Maximise juvenile survivorship in resource limited density-dependent environments
Life history traits - size - age at maturity - size at maturity - clutch size - egg size - larvalYOY growth - reproductive season - parental care
Small Early Small Small Small Rapid Long No
Large Delayed Mediumlarge Large Small Rapid Short No
Smallmedium Delayed Medium Small Large Slow Long Yes
- Maintain critical minimum spawning biomass
- Maintain appropriate age structure (including large specimen)
- Maintenance of adult stock
Primary management objectives
- Protection against large scale or chronic perturbations that eliminate key refugia in space and time
- Spatial refuges directed at adult stock (including spawning habitats and migration routes)
- Maintain integrity of adult habitat
Environment
Demographic trade-offs
Life history traits
Management objectives

Aquaculture amp Fisheries Group Wageningen University
2112011
5
Perceptions on stock sizes of researchers and fishers
1970 1975 1980 1985 1990 1995 2000 20050
20000
40000
60000
80000
100000
Exp
loita
ble
stoc
k (to
nnes
)
sole
Catch ratesStock size
Photo Van Densen
More inclusive stakeholder involvement the information
challenge
Fishers Managers
Greens TradersSupermarkets general
public
DataInformationKnowledge
Role of science
Measurement Historical data Sensitivity Theoretical basis
B F important
Responsiveness to action
Costs
Total pressure (C f F) important
Related to quality notions of good practice
Selectivity important (q) - labels
Experts
Related to experience spaces
Catch efficiency (Cf q) important
Aquaculture amp Fisheries Group Wageningen University
2112011
6
Management cycle Quantified objective
eg Y=50 kgha1 yr 1
Evaluation
eg Y too low overfishing
Management measure
eg 30 reduction in number of boats
Information
monitoring catches
eg Y=30 kgha1 yr 1
Feedback
Userstakeholder preferences
Biological potentials and constraints
Resource use problemFrom values hellip
hellipto techniqueshellip
hellipto valueshellip
Role of fisheries biologist experience for all
Knowledge
Information
Data
Structuring
Experience learning
Evaluation sensemaking
Aquaculture amp Fisheries Group Wageningen University
2112011
7
Evaluative capacity ndash social learning
Writing history together Fishers managers others
Management objectives ndash information needs
Production planning ldquoFeed the peoplerdquo
Fisheries Management ldquoSet levels of resource usagerdquo
Nature conservation ldquoRetain the integrity of naturerdquo
bull Biological
bull Social and economic
Aquaculture amp Fisheries Group Wageningen University
2112011
8
Only 2 biological questions in fisheries management
How much = Fishing pressure
bull Effort (f )
bull Catch (C)
How = Fishing pattern
bull Catchability (q )
bull Selectivity (s )
How much
How
Why fisheries (stock) assessements
Optimising catches ndash how much
Long term sustainability
Given variable stock sizes
Sharing arrangements catches ndash how much how
Between fishers
Between countries (eg migratory stocks shared seas and lakes)
Assessing sustainability of fisheries ndash how
Total pressure
Selectivity of catches size communities incl fish birds mammals
bull Tracking and tracing
bull Labelling
Habitats
Aquaculture amp Fisheries Group Wageningen University
2112011
9
Focus management and environmentalists on human impact and
control Fishers refer to natural influences Dispute
Catch
Effort
Nature
Fishing community
Researcher
Size
Objective measure
Total effort
Total catch MSY
Main objective to ensure optimalsustainable harvest
Main measure control of fishing effort
Aquaculture amp Fisheries Group Wageningen University
2112011
10
Control of targeted sizes
Bio
mas
s
Length (Age)
Selectivity curve small hook
Selectivity curve large hook
Available biomass Available
biomass
Control of pressure reference level (MSY)
Cat
ch (
= Y
ield
)
Fishing pressure
Overexploited
Maximum Sustainable Yield
Aquaculture amp Fisheries Group Wageningen University
2112011
11
Fisheries management options
Input controls Ban of fishing techniques (q) Maximummin mesh size (q) Change in gear construction (q) Days at sea (f)
Reduce number of gears (f)
Closed areas (f)
Closed seasons (f)
Protection habitats (fq)
B
C F = fq
Output controls (C)
Total allowable catch (TAC)
Individual Transferable Quota (ITQ)
Target specific specieslengths
C = FB
That is all Any available or
conceivable regulation can be reduced to the two terms C and F with goals defined on B
All are through regulating fishing effort
BMSY SSBmin SSBpa Cf MSY
M
R
G
Biomass
F=fq
Nt
t
R
t
tage
Wt
t
Ft
tc
C
Statistical
CEDRS
trends assessment
adaptation
Analytical
Experimental
Research
CEDRS
assessment
predictions
f
q
+ sd
HolisticBlack box approach
Analytical approach
Fisheries science ndash information evaluation
Aquaculture amp Fisheries Group Wageningen University
2112011
12
Data needed for assessment general
Basic data from the fishery
CatchperUnit Effort (tonnes numbers)
Effort (numbers)
Length (cm)
Basic research data
Migration (tagging)
Spawning (recruitment maturity stages areas)
Age
Natural Mortality
Trade offs in multispecies communities ndash no free lunch
MMSY =
Target LimitStay clear off
Aquaculture amp Fisheries Group Wageningen University
2112011
13
Goals data collection needs linkages
Production planning trade Catch Input ndash labor vessels No link
Fisheries management Catch and effort linked By commercial species
Conservation Catch and effort linked Selectivity All species Habitats ecosystems
Increase in
- Resolution
- Linked data
- Costs
Ecosystem based management
Ecosystem based management What is that
Change in information base Fisheries Science = heavy investment in population dynamics Ecosystem = interaction between organisms with each other
and the physical environment New questions arise on habitats and nontarget organisms
Not clear how the fisheries ldquohowrdquo and ldquohow muchrdquo questions can be dealt with Focus on more generic measures as MPArsquos (keeping a bank)
Focus on clarity of information for all involved what info is needed
Aquaculture amp Fisheries Group Wageningen University
2112011
14
Biomass
Models ndash Indicators references and the long view
Fishing mortality = CB
Recruitment
Growth
Natural mortality
Indicator approaches ndash system stakeholder
Size of fish
Biomas s
Fishing
Nutrients
Pressure
Driver
State
Size of fish
Biomas s
Fishing
Nutrients
Pressure
Driver
State
Aquaculture amp Fisheries Group Wageningen University
2112011
15
Indicator approaches ndash system stakeholder
Size of fish
B
io
ma
s s
Fishing
Nutrients
Pressure
Driver
State
Size of fish
B
io
ma
s s
Fishing
Nutrients
Pressure
Driver
State
Fishers Managers
Greens TradersSupermarkets general
public
DataInformationKnowledge
Role of science
Part 2 a system approach
Aquaculture amp Fisheries Group Wageningen University
2112011
16
Goal
Apply a systems approach to fishery information ndashdevising indicators System
bull Understand the role of environment and fishing as sources of population regulation (mortality)
Species Stocksbull Understand that different species have different resilience to fishing
Selectivity ndash Catch and effortbull Understand consequences of (un)selective fishing on fish communities
bull Understand the characteristics of small scale fisheries
bull Understand the potential (and drive) to stabilise catches
Africa diversity of freshwater and marine systemsFreshwaters bull Rivers Nile Orange Congo Zambezi etc
bull River floodplains Niger Congo Zambezi Kafue Pongolo etc
bull Exorheic swamps Sudd Bangweulu Kamulondo Cuvette Centrale Luapula Shire Malagarasi Lukanga
bull Endorheic wetlands and lakes
Chad Okavango Chilwa Rukwa
bull Man made riverine lakes
Kariba Cabora-Bassa Volta Nasser Kainji
bull Shallow lakes open drainage
George Edward Kyoga Malombe Mweru
bull Large deep lakes Tanganyika Victoria Malawi Turkana etc Marine systems bull Upwelling areas Coastal East and Souther Africa
Mauretania Namibia bull Estuaries River mouths bull Tidal flats Banc drsquoAacuterguin bull Continental flats banks Coastal Mozambique Sofala bank bull Coral reefs Red Sea Coastal Islands Tanzania Kenya bull Seemounts bull Open ocean
Aquaculture amp Fisheries Group Wageningen University
2112011
17
Two important indicators
Catch
Effort
Fopt
C = fqB
Relation productivity amp number of fishermen
y = 30xR2 = 082
y = 26 xR2 = 08157
0
5
10
15
20
25
30
35
40
45
50
0 2 4 6 8 10 12 14 16
Density (fisherskm^2)
Cat
ch (
tKm
^2y
ear)
Malombe
Chilwa
MweruChiuta
Albert
Itezhi-tezhi
Edward
Bangweulu
Tanganyika
Nasser amp Kariba
Turkana Kivu
Malawi
Victoria 19702
Victoria 1990 Victoria 20024
Volta Kainji
Average annual catch rate for African fishers = 3 tonyear irrespective of system
Aquaculture amp Fisheries Group Wageningen University
2112011
18
Information needs towards indicators
Systems differ
in productivity
In variability in productivity
in species communities
in effort dynamics
Contextualising fishing patterns and outcome
Scaled indicators
Systems approach ndash sources catch variability
Physical forcing drivers Rainfall water level nutrient pulsing
Climate el Niňo cycles nutrient upwelling
Landuse runoff rainfall nutrient loading siltation habitat change
Ecological spatial heterogeneity
Fish communities species attributes
Exploitation fishery characteristics
(Co)management structure organisation goals
Aquaculture amp Fisheries Group Wageningen University
2112011
19
System approach ndash a theory
Physical environment
Ecosystems
Fish communities
Fishing techniques
Fisheries management
Economics
Administration
Env
ironm
ent
Ecosystem drivers ndash pulsed stable
Physical environment
Ecosystems
Fish communities
Fishing techniques
Fisheries management
Economics
Administration
Env
ironm
ent
Aquaculture amp Fisheries Group Wageningen University
2112011
20
Okavango ndash highly pulsed system
Fluctuating environment Unpredictable
Mortality = density independent high often catastrophic
Population = variable in time less than carrying capacity
Freshwater Lake MalawiVictoria ndash constant system
Stable environment predictable
Mortality density dependent low constant
Population size constant in time around carrying capacity
Aquaculture amp Fisheries Group Wageningen University
2112011
21
Marine Red River Estuary Variable Predictable
What are the dominant life history strategies
What are the dominant life history strategies
Marine Komodo Coral Reefs Highly Stable Predictable
Aquaculture amp Fisheries Group Wageningen University
2112011
22
Drivers ndash waterlevels ndash nutrient pulsing
Scale of variation
Time Process
decadal community
annual stocks
seasonal year class
Monthly industrial catch rate clupeids lake Tanganyika
1955 1960 1965 1970 1975 1980 1985 1990 1995
Year
0
1
2
3
4
5
6
7
8
x 1000 kgvessel
small
Drivers ndash wind stress ndash nutrient upwelling
decadal annual seasonal variation
Aquaculture amp Fisheries Group Wageningen University
2112011
23
Drivers ndash weather patterns ndash nutrient upwelling
Normal pattern
Effect=1-2 years signal clear Yes
El Nino pattern
Drivers Eutrophication Lake Victoria eutrophication through increase nutrient loading related to landuse
Aquaculture amp Fisheries Group Wageningen University
2112011
24
Assignment 1 Drivers Your situation
What type of system
stable ndash pulsed
What drivers are important climate wind waterlevel droughts upwelling eutrophication land
use change
What indicators needed for assessment
What datainformation is needed to monitor longterm developments
Who haswhere is this information available
Fish communities
Physical environment
Ecosystems
Fish communities
Fishing techniques
Fisheries management
Economics
Administration
Env
ironm
ent
Aquaculture amp Fisheries Group Wageningen University
2112011
25
A Lindeman pyramid illustrating
a fish community
Size
Biomass
The biomass-size distribution important indicators in both single species and community studies
A fish community
Fish communities ndash size biomass trophic groups
Size of individual fish
Competition
Predation
Detrivores Herbivores Zooplanktivores etc
Piscivores
Aquaculture amp Fisheries Group Wageningen University
2112011
26
Tilapia ndash Oreochromis mossmbicus detrivore
Small Clupeidae zooplanktivores
Lake Tanganyika
bull Limnothrissa miodon 17 cm (top)
bull Stolothrissa tanganicae 10 cm
Lake Mweru
bullMicrothrissa moeruensis 6cm
Aquaculture amp Fisheries Group Wageningen University
2112011
27
Small zooplankton ndash from eutrophic Tjeukemeer
Nile Perch from Lake Victoria Piscivore
Aquaculture amp Fisheries Group Wageningen University
2112011
28
Haplochromis Species From Nile Perch Stomachs
Lake Mweru ndash a fish community
Length (cm)
MolluscInsect
Cyprinidae (5)Cichlidae (3)Mormyridae (5)Bagridae (2)Mochokidae (3)TylochromisOreochromisClariidae (2)Serranochromis (2)HydrocynusSchilbeidae (2)AlestesOthers (50)
Molluscivore
MicrophytovorePiscivore
5 10 15 20 25 30 35 40 45 50 55 60 65 70 75 80 850
25
50
75
100
125
150
175
200
1970 - 1972
Aquaculture amp Fisheries Group Wageningen University
2112011
29
Size
Biomass
Multispecies fisheries Mweru ndash all sizes and trophic
levelshellip
hellip and all levels are fished
Assignment 2 Fish communities my situation
How many different species are there in the fishery
Which are most important
What biomass (large ndash medium small)
What maximum sizes (large ndash medium ndash small)
What trophic levels (piscivores herbivores benthivores)
What spaces (pelagic demersal migratory)
Draw the most important species into a biomass size spectrum
order them by maximum size trophic level and space (pelagics on top demersal on the bottom)
Aquaculture amp Fisheries Group Wageningen University
2112011
30
Physical environment
Ecosystems
Fish communities
Fishing techniques
Fisheries management
Economics
Administration
Env
ironm
ent
Fish species ndash resilience to fishing
Change in Fish Communities Fishing Environment
Size of individual fish
Competition
Predation
Detrivores Herbivores Zooplanktivores etc
Piscivores
Fishing pressure
Aquaculture amp Fisheries Group Wageningen University
2112011
31
Catch development in a multispecies fishery
Catch
Fishing effort
Fishing down process ndash example Oueme river
Succession of species
black disappeared lt1965
hatched seriously reduced
peak yields around 10000 ton in rsquo50rsquo60ies
Why are some species less resilient to fishing
Aquaculture amp Fisheries Group Wageningen University
2112011
32
time
N
Population growth
Logistic population growth dNdt=r0N(1NK)
K carrying capacity (Nmax)
r0 steepness of the increase
Life history strategies r and Kselected species
rselected species small shortlived high reproductive rates (sardines)
Rapid growth and development Early maturation many offspring with low survival rates Population size below carrying capacity Minimal parental careoffspring Use unpredictable or unstable habitats Abundance varies greatly in time and space Generalists limited niche or trophic specialisation Resources rarely limiting (no competition) Wide dispersal good colonisers rapid response to disturbance Selection for productivity
Anchovy Max age 3-4 years
r=43 Population doubling time lt15 months
Aquaculture amp Fisheries Group Wageningen University
2112011
33
Life history strategies r and Kselected species
Kselected species large longlived lower reproductive rates (sharks rays)
Slow growth long life span Fewer offspring with higher survival rates Population size operate near carrying capacity (K) Use more predictable or stable habitats Parental care is common Abundance stable over time Specialists efficient users of a particular environment (niche
specialist) Resources often become limiting competition Poor colonizers of new or empty habitats (no dispersal) Selection for efficiency (competitive ability)
Hammerhead sharkMax age 14 years
r=08 PDT = 45 ndash 14 years
Not the complete story fish are more plastichellip
Aquaculture amp Fisheries Group Wageningen University
2112011
34
Three basic life history strategiesGrowth
(population)
SurvivalFecundity
Opportunist strategist small shortliving early maturing fish asymp rselected
Periodic strategist high fecundity longer lifespan
Equilibrium strategist medium size some parental care few but larger offspring asymp Kselected
Winemiller and Rose 1992
King and McFarlane 2003
Intermediate strategist
Opportunistic strategist
Early maturing fish frequent reproduction extended spawning period rapid larval growth high population turnover rate (PB = Z = r) eg mosquito fish Marginal habitats (eg like terrestrialaquatic ecotone)
More common in tropical freshwaters
Rarely exploited (small size) otherwise no management needed but to protect founder populations
Aquaculture amp Fisheries Group Wageningen University
2112011
35
Equilibrium strategist
Large adult body size parental care behaviour
Tropical (stable) fresh waters coral reefs (K)
Density dependent processes and resource limitation
Management maintenance of a productive environment and a healthy adult stocks
Periodic strategist
Maximises age specific fecundity at the expense of juvenile survivorship
If favorable conditions for immatures = periodic synchronous reproduction in phase with periodicity of large numbers
of small offspring
Weak stock recruitment relationships
Management maintain a critical density of adults stocks Protect spawning season andor habitat
Aquaculture amp Fisheries Group Wageningen University
2112011
36
Fishbase species resilience to fishing pressure life
history
Three categories of species resilience to fishing Very lowlow ndash medium ndash high
Based on lifehistory characteristics reproduction feeding and spatial behavior
Through the effects of survival fecundity and growth
trophic position
migratory behaviour
See FishBase wwwfishbaseorg
Lake Mweru ndash Mormyrops anguilloides
Resilience Low
Minimum population doubling time = generation time 8 years
Life span 24 years
Max length 150 cm
Lengthage2at2maturity 65 cm 5 years
Trophic level 36
Migratory no
Intermediateperiodic
Aquaculture amp Fisheries Group Wageningen University
2112011
37
Lake Mweru Hydrocynus vittatus
Resilience Mediumlow
Generation time 3 years
Life span 11 years
Max length 105 cm FL
Lengthage2at2maturity 42 cm 2years
Trophic level 44
Migratory yes spawning migrations
Periodic
Lake Mweru Oreochromis mweruensis
Lake Mweru
Resilience High
Minimum population doubling time lt 15 months
Life span 11 years
Max length 40 cm
Lengthage2at2maturity 15 cm 1year
Trophic level 20
Migratory no
Intermediate opportunistc
Aquaculture amp Fisheries Group Wageningen University
2112011
38
Lake Mweru Microthrissa moeruensis
bull Z = PB ~ 5 ndash 7
Resilience High
Generation time 6 months
Life span 25 years
Max length 5 cm
Lengthage2at2first maturity 3 cm04 year
Trophic level 20 ndash 30
Migratory no
Lake MweruOpportunistic
Assignment 3 Resilience to fishing my situation
Use main species in the fishery in assignment 2 (choose at least three) What is their productivityresilience to fishing
What characteristics are used to assess thisbull Size longevity reproduction feeding spatial behaviour
What is the turnover time (PB = Z = r)
Use Fishbase to find out these characteristics What indicators
What datainformation is needed Who haswhere is this information available
Aquaculture amp Fisheries Group Wageningen University
2112011
39
Fishing pressure fish communities and system stability
Physical environment
Ecosystems
Fish communities
Fishing techniques
Fisheries management
Economics
Administration
Env
ironm
ent
Change in Fish Communities Fishing Environment
Size of individual fish
Competition
Predation
Detrivores Herbivores Zooplanktivores etc
Piscivores
Fishing pressure
Aquaculture amp Fisheries Group Wageningen University
2112011
40
Change in Fish Communities Fishing Environment
Piscivores
Size of individual fish
Competition
Predation
Detrivores Herbivores Zooplanktivores etc
Fishing pressure
driving force
Drivers climate wind waterlevel droughts upwelling eutrophication
Fish Communities ndash population regulation
Constant systems
Pulsed systems
Population regulation
nonselective catastrophic mortality
(environmentdominant)
selective mortality (predation competitiondominant)
environment determines prevailing mortality pattern
Aquaculture amp Fisheries Group Wageningen University
2112011
41
Most ecological processes and life history traits can be related to the prevailing mortality pattern
Life history and natural selection
0
20
40
60
80
100
0 1 2 3 4 5 6 7 8
Relative age (years)
Abu
ndan
ce (
N)
but large fish have more eggs
50 cm = 1 mill eggs 100 cm = 16 mill eggs
Age at 50 maturity
Young fish are supposed to die only a fraction will spawn
Aquaculture amp Fisheries Group Wageningen University
2112011
42
Fishing mortality
Age (years)
Inst
anta
neou
s ra
te o
f m
orta
lity
Predation mortality
From ICES (1997)
is almost exactly oppositeSelectivity predation versus fishing
Management promotes harvesting patterns that is opposite to what most fish stock are naturally adapted to
effort
Age and size structure changesunder selective fishing to younger and smaller individuals
A sign of fishing hellip
Aquaculture amp Fisheries Group Wageningen University
2112011
43
Median age-at-maturation of Northeast Arctic cod (Joslashrgensen 1990 Jorgensen et al 2007 Science Conover et al )
and this is what happens
Fishery induced evolution (nr species)
Maturity lower age (6)
Maturity lower size (7)
Reduced growth (6)
Increase fecundity (3)
Loss genetic div (3)
Leading to lower yields
Small
Random
Large
Increased mortality on
Mean individual weight at age after 4 generations
Evidence Size selection (Growth)
= genetic changes
After Conover and Munch 2002Atlantic silverside Menidia menidia max age=2 years R= PDT lt15 months r=58
Aquaculture amp Fisheries Group Wageningen University
2112011
44
Effect of sizeselective fishing (Yield)
Trends in average total weight harvested across multiple generations of size-selective exploitation
Mortality on
Size selective fishing with large mesh sizes on adults We are deliberately pushing stocks to genetically
stable smaller sizes
Small
Random
Large
The rK selection principle the effects of selective
fishing
Age (size)
Abu
ndan
ce (L
og N
)
Slope = total mortality rate Z = r
Increased juvenile mortality= K-selection
Increased adult mortality= r-selection
r-selection Unstable environment abiotic mortality ndash non-predictive non-selectiveK-selection Stable environment biotic mortality (predation) ndash predictive size selective
Aquaculture amp Fisheries Group Wageningen University
2112011
45
Abundance size spectra
Abu
ndan
ce
Size
The distribution of abundance by size follows regular patterns
slope steepens when large fish removed
phytoplankton
zooplankton
small fish
big fish
Year
1976 1978 1980 1982 1984 1986 1988 1990 1992 1994
Slo
pe
-10
-9
-8
-7
-6
-5
Rice amp Gislason (1996)
Trends in size-spectrum slopes of the North Sea
Fishing effects on community sizestructure
Aquaculture amp Fisheries Group Wageningen University
2112011
46
Question
How do you fish a multispecies community
Selective ndash Targeting large sizes with single gears
Unselective ndash Targeting all sizes with many gears
Multispecies community
How should it be harvested
What should be minimum mesh-size
Aquaculture amp Fisheries Group Wageningen University
2112011
47
Selective fishing will change the slope
Biomasssize distributions
Example from lake Kariba Zambiawhere fishers are using illegal smallmeshed nets
The system remains unchanged except everything is less
Kolding et al 2003
Parallel slopes only intercept lower
Aquaculture amp Fisheries Group Wageningen University
2112011
48
2
3
4
5
Tro
phic
leve
l
Pauly et al (1998)
Fishing down the food web
Example from Lake Volta Ghana
The whole fish community is targeted highly pulsed system
highly dynamic fishery (spatial temporal movements fishermen)
27 fishing methods
25 kgday
74 species utilized
All trophic levels utilized by combining gears with specific trophic profiles 1 2 3 4 5Trophic level
Gears in the fishery ( species sample size)
Van Zwieten et al 2008
Aquaculture amp Fisheries Group Wageningen University
2112011
49
Is nonselective fishing bad
There is no empirical evidence
On the contrary we know that selective fishing is bad but we still advocate it
But how do we impose gear mesh and size restrictions in a multispecies fishery
The optimum fishing pattern is un-selective How much
How
Is fishing down the food web bad
Where is the highest production
Sohellip what is the best fishing pattern
What if we fish everything
A non-selective harvesting pattern is ecosystem conserving
The system remains intact but everything is less
This means fishing down the food-web
Aquaculture amp Fisheries Group Wageningen University
2112011
50
Indicators ndash biomass size distribution
Size of individual fish
Biomass Unexploited Population = Blt40
Maximum length = Lmax10
Fishing pressure
Mean length exploited population = L5
Biomass Exploited Population = Bgt40
Mean length total= Lmean
Intercept = Iasd
Assignment 4 Fishing down my situation
Characterise your fishery Single species single gear ndash multigear
Specific target species ndash all species are targeted (multispecies)
Specific size ndash all sizes (quantify)
Is there a shift from large specimen to small
Is there a shift from large species ndash to small Is there a shift in trophic level
What information is needed What indicators
Where to get this information
Aquaculture amp Fisheries Group Wageningen University
2112011
51
Dynamics of fishing ndash stabilise catch variability
Physical environment
Ecosystems
Fish communities
Fishing techniques
Fisheries management
Economics
Administration
Env
ironm
ent
Diversity in methods ndash small units adaptive
Hook and line fisherman
Lake Jaba Nigeria
Trap fishermen
Lake Mweru Zambia
Aquaculture amp Fisheries Group Wageningen University
2112011
52
Labor intensive beach seining on demersals
Small fish common Chilimira seine small pelagics
Aquaculture amp Fisheries Group Wageningen University
2112011
53
Innovative Nkacha seine small demersals
Unevenly distributed ndash important gears lake Mweru
Aquaculture amp Fisheries Group Wageningen University
2112011
54
Highly mobile ndash movement fishermen Lake Malawi
movement one fisherman in 6 months
SE Arm of Lake Malawi
Characteristics of smallscale fisheries
Small units simple processing small scale trading
Methods diverse innovative labor intensive
Opportunistic adaptive
Large subsistence element (small fish)
Unevenly distributed highly mobile
Aquaculture amp Fisheries Group Wageningen University
2112011
55
Fishing mortality (F)
number of units
efficiency
Effort (f)
Catchability (q)Fishing mortality (F)
More of the same
Decreasing numbers = management
Better methods = Increasing efficiency
=development
So while we both lsquomanagersquo and lsquodeveloprsquo the fishing mortality stays the same
Uh
Tradeoffs Economic efficiency vs employment
opportunities
0
20
40
60
80
100
120
140
160
180
1945 1950 1955 1960 1965 1970 1975 1980 1985 1990 1995 2000 2005
Fish
erm
en (
1000
)
Cat
ch p
er
fishe
rman
(to
ns)
0
500000
1000000
1500000
2000000
2500000
3000000
3500000
4000000
Qua
ntity
(to
ns)
Quantity (tons) Fishermen (1000) Catch (tons) per fisherman
Total catch numbers of fishers amp catch per fisherman in the Norwegian fishery 1945-2005
Effort (f) decreases while CpUE increases because catchability (q = efficiency) increases
Aquaculture amp Fisheries Group Wageningen University
2112011
56
Assignment 5 Dynamics fishery ndash my situation
How has fishing effort developed over time In terms of numbers (fishermen boats)
In terms of gears bull Types
bull Active ndash passive methods
In terms of spatial distribution
In terms of trophic levels
What informationdata needed What indicators
Who haswhere is this information
Goal
Apply a systems approach to fishery information ndashdevise indicators System
bull Understand the role of environment and fishing as sources of population regulation (mortality)
Species Stocksbull Understand that different species have different resilience to fishing
bull Understand r K principle
Selectivity ndash Catch and effortbull Discuss the consequences of selective and unselective fishing on fish
communities
bull Understand the characteristics of small scale fisheries
Aquaculture amp Fisheries Group Wageningen University
2112011
57
Summary All species and systems ndash important sets of
indicators
Effort (numbers types)
Species (composition in catch)
Catch (by species total)
Catch per unit Effort (~relative biomass)
Length (in catch at maturity)
Drivers (as explanatory factor)
copy Wageningen UR
End hellipbeginning
Aquaculture amp Fisheries Group Wageningen University
2112011
58
Summary environment species resilience management Life history strategy Opportunistic Periodic Equilibrium Environment Temporally stochastic
with small-scale patches
Seasonal with large-scale patches
Stable with fine-scaled spatial variation
Demographic trade-off 1 age at maturity 2 fecundity 3 juvenile survivorship
low low low
high high low
high low high
Demographic character Maximise (re)colonising capability of habitats over small spatial scales
Maximise age-specific fecundity spreading of reproductive effort over many years andor large areas
Maximise juvenile survivorship in resource limited density-dependent environments
Life history traits - size - age at maturity - size at maturity - clutch size - egg size - larvalYOY growth - reproductive season - parental care
Small Early Small Small Small Rapid Long No
Large Delayed Mediumlarge Large Small Rapid Short No
Smallmedium Delayed Medium Small Large Slow Long Yes
- Maintain critical minimum spawning biomass
- Maintain appropriate age structure (including large specimen)
- Maintenance of adult stock
Primary management objectives
- Protection against large scale or chronic perturbations that eliminate key refugia in space and time
- Spatial refuges directed at adult stock (including spawning habitats and migration routes)
- Maintain integrity of adult habitat
Environment
Demographic trade-offs
Life history traits
Management objectives

Aquaculture amp Fisheries Group Wageningen University
2112011
6
Management cycle Quantified objective
eg Y=50 kgha1 yr 1
Evaluation
eg Y too low overfishing
Management measure
eg 30 reduction in number of boats
Information
monitoring catches
eg Y=30 kgha1 yr 1
Feedback
Userstakeholder preferences
Biological potentials and constraints
Resource use problemFrom values hellip
hellipto techniqueshellip
hellipto valueshellip
Role of fisheries biologist experience for all
Knowledge
Information
Data
Structuring
Experience learning
Evaluation sensemaking
Aquaculture amp Fisheries Group Wageningen University
2112011
7
Evaluative capacity ndash social learning
Writing history together Fishers managers others
Management objectives ndash information needs
Production planning ldquoFeed the peoplerdquo
Fisheries Management ldquoSet levels of resource usagerdquo
Nature conservation ldquoRetain the integrity of naturerdquo
bull Biological
bull Social and economic
Aquaculture amp Fisheries Group Wageningen University
2112011
8
Only 2 biological questions in fisheries management
How much = Fishing pressure
bull Effort (f )
bull Catch (C)
How = Fishing pattern
bull Catchability (q )
bull Selectivity (s )
How much
How
Why fisheries (stock) assessements
Optimising catches ndash how much
Long term sustainability
Given variable stock sizes
Sharing arrangements catches ndash how much how
Between fishers
Between countries (eg migratory stocks shared seas and lakes)
Assessing sustainability of fisheries ndash how
Total pressure
Selectivity of catches size communities incl fish birds mammals
bull Tracking and tracing
bull Labelling
Habitats
Aquaculture amp Fisheries Group Wageningen University
2112011
9
Focus management and environmentalists on human impact and
control Fishers refer to natural influences Dispute
Catch
Effort
Nature
Fishing community
Researcher
Size
Objective measure
Total effort
Total catch MSY
Main objective to ensure optimalsustainable harvest
Main measure control of fishing effort
Aquaculture amp Fisheries Group Wageningen University
2112011
10
Control of targeted sizes
Bio
mas
s
Length (Age)
Selectivity curve small hook
Selectivity curve large hook
Available biomass Available
biomass
Control of pressure reference level (MSY)
Cat
ch (
= Y
ield
)
Fishing pressure
Overexploited
Maximum Sustainable Yield
Aquaculture amp Fisheries Group Wageningen University
2112011
11
Fisheries management options
Input controls Ban of fishing techniques (q) Maximummin mesh size (q) Change in gear construction (q) Days at sea (f)
Reduce number of gears (f)
Closed areas (f)
Closed seasons (f)
Protection habitats (fq)
B
C F = fq
Output controls (C)
Total allowable catch (TAC)
Individual Transferable Quota (ITQ)
Target specific specieslengths
C = FB
That is all Any available or
conceivable regulation can be reduced to the two terms C and F with goals defined on B
All are through regulating fishing effort
BMSY SSBmin SSBpa Cf MSY
M
R
G
Biomass
F=fq
Nt
t
R
t
tage
Wt
t
Ft
tc
C
Statistical
CEDRS
trends assessment
adaptation
Analytical
Experimental
Research
CEDRS
assessment
predictions
f
q
+ sd
HolisticBlack box approach
Analytical approach
Fisheries science ndash information evaluation
Aquaculture amp Fisheries Group Wageningen University
2112011
12
Data needed for assessment general
Basic data from the fishery
CatchperUnit Effort (tonnes numbers)
Effort (numbers)
Length (cm)
Basic research data
Migration (tagging)
Spawning (recruitment maturity stages areas)
Age
Natural Mortality
Trade offs in multispecies communities ndash no free lunch
MMSY =
Target LimitStay clear off
Aquaculture amp Fisheries Group Wageningen University
2112011
13
Goals data collection needs linkages
Production planning trade Catch Input ndash labor vessels No link
Fisheries management Catch and effort linked By commercial species
Conservation Catch and effort linked Selectivity All species Habitats ecosystems
Increase in
- Resolution
- Linked data
- Costs
Ecosystem based management
Ecosystem based management What is that
Change in information base Fisheries Science = heavy investment in population dynamics Ecosystem = interaction between organisms with each other
and the physical environment New questions arise on habitats and nontarget organisms
Not clear how the fisheries ldquohowrdquo and ldquohow muchrdquo questions can be dealt with Focus on more generic measures as MPArsquos (keeping a bank)
Focus on clarity of information for all involved what info is needed
Aquaculture amp Fisheries Group Wageningen University
2112011
14
Biomass
Models ndash Indicators references and the long view
Fishing mortality = CB
Recruitment
Growth
Natural mortality
Indicator approaches ndash system stakeholder
Size of fish
Biomas s
Fishing
Nutrients
Pressure
Driver
State
Size of fish
Biomas s
Fishing
Nutrients
Pressure
Driver
State
Aquaculture amp Fisheries Group Wageningen University
2112011
15
Indicator approaches ndash system stakeholder
Size of fish
B
io
ma
s s
Fishing
Nutrients
Pressure
Driver
State
Size of fish
B
io
ma
s s
Fishing
Nutrients
Pressure
Driver
State
Fishers Managers
Greens TradersSupermarkets general
public
DataInformationKnowledge
Role of science
Part 2 a system approach
Aquaculture amp Fisheries Group Wageningen University
2112011
16
Goal
Apply a systems approach to fishery information ndashdevising indicators System
bull Understand the role of environment and fishing as sources of population regulation (mortality)
Species Stocksbull Understand that different species have different resilience to fishing
Selectivity ndash Catch and effortbull Understand consequences of (un)selective fishing on fish communities
bull Understand the characteristics of small scale fisheries
bull Understand the potential (and drive) to stabilise catches
Africa diversity of freshwater and marine systemsFreshwaters bull Rivers Nile Orange Congo Zambezi etc
bull River floodplains Niger Congo Zambezi Kafue Pongolo etc
bull Exorheic swamps Sudd Bangweulu Kamulondo Cuvette Centrale Luapula Shire Malagarasi Lukanga
bull Endorheic wetlands and lakes
Chad Okavango Chilwa Rukwa
bull Man made riverine lakes
Kariba Cabora-Bassa Volta Nasser Kainji
bull Shallow lakes open drainage
George Edward Kyoga Malombe Mweru
bull Large deep lakes Tanganyika Victoria Malawi Turkana etc Marine systems bull Upwelling areas Coastal East and Souther Africa
Mauretania Namibia bull Estuaries River mouths bull Tidal flats Banc drsquoAacuterguin bull Continental flats banks Coastal Mozambique Sofala bank bull Coral reefs Red Sea Coastal Islands Tanzania Kenya bull Seemounts bull Open ocean
Aquaculture amp Fisheries Group Wageningen University
2112011
17
Two important indicators
Catch
Effort
Fopt
C = fqB
Relation productivity amp number of fishermen
y = 30xR2 = 082
y = 26 xR2 = 08157
0
5
10
15
20
25
30
35
40
45
50
0 2 4 6 8 10 12 14 16
Density (fisherskm^2)
Cat
ch (
tKm
^2y
ear)
Malombe
Chilwa
MweruChiuta
Albert
Itezhi-tezhi
Edward
Bangweulu
Tanganyika
Nasser amp Kariba
Turkana Kivu
Malawi
Victoria 19702
Victoria 1990 Victoria 20024
Volta Kainji
Average annual catch rate for African fishers = 3 tonyear irrespective of system
Aquaculture amp Fisheries Group Wageningen University
2112011
18
Information needs towards indicators
Systems differ
in productivity
In variability in productivity
in species communities
in effort dynamics
Contextualising fishing patterns and outcome
Scaled indicators
Systems approach ndash sources catch variability
Physical forcing drivers Rainfall water level nutrient pulsing
Climate el Niňo cycles nutrient upwelling
Landuse runoff rainfall nutrient loading siltation habitat change
Ecological spatial heterogeneity
Fish communities species attributes
Exploitation fishery characteristics
(Co)management structure organisation goals
Aquaculture amp Fisheries Group Wageningen University
2112011
19
System approach ndash a theory
Physical environment
Ecosystems
Fish communities
Fishing techniques
Fisheries management
Economics
Administration
Env
ironm
ent
Ecosystem drivers ndash pulsed stable
Physical environment
Ecosystems
Fish communities
Fishing techniques
Fisheries management
Economics
Administration
Env
ironm
ent
Aquaculture amp Fisheries Group Wageningen University
2112011
20
Okavango ndash highly pulsed system
Fluctuating environment Unpredictable
Mortality = density independent high often catastrophic
Population = variable in time less than carrying capacity
Freshwater Lake MalawiVictoria ndash constant system
Stable environment predictable
Mortality density dependent low constant
Population size constant in time around carrying capacity
Aquaculture amp Fisheries Group Wageningen University
2112011
21
Marine Red River Estuary Variable Predictable
What are the dominant life history strategies
What are the dominant life history strategies
Marine Komodo Coral Reefs Highly Stable Predictable
Aquaculture amp Fisheries Group Wageningen University
2112011
22
Drivers ndash waterlevels ndash nutrient pulsing
Scale of variation
Time Process
decadal community
annual stocks
seasonal year class
Monthly industrial catch rate clupeids lake Tanganyika
1955 1960 1965 1970 1975 1980 1985 1990 1995
Year
0
1
2
3
4
5
6
7
8
x 1000 kgvessel
small
Drivers ndash wind stress ndash nutrient upwelling
decadal annual seasonal variation
Aquaculture amp Fisheries Group Wageningen University
2112011
23
Drivers ndash weather patterns ndash nutrient upwelling
Normal pattern
Effect=1-2 years signal clear Yes
El Nino pattern
Drivers Eutrophication Lake Victoria eutrophication through increase nutrient loading related to landuse
Aquaculture amp Fisheries Group Wageningen University
2112011
24
Assignment 1 Drivers Your situation
What type of system
stable ndash pulsed
What drivers are important climate wind waterlevel droughts upwelling eutrophication land
use change
What indicators needed for assessment
What datainformation is needed to monitor longterm developments
Who haswhere is this information available
Fish communities
Physical environment
Ecosystems
Fish communities
Fishing techniques
Fisheries management
Economics
Administration
Env
ironm
ent
Aquaculture amp Fisheries Group Wageningen University
2112011
25
A Lindeman pyramid illustrating
a fish community
Size
Biomass
The biomass-size distribution important indicators in both single species and community studies
A fish community
Fish communities ndash size biomass trophic groups
Size of individual fish
Competition
Predation
Detrivores Herbivores Zooplanktivores etc
Piscivores
Aquaculture amp Fisheries Group Wageningen University
2112011
26
Tilapia ndash Oreochromis mossmbicus detrivore
Small Clupeidae zooplanktivores
Lake Tanganyika
bull Limnothrissa miodon 17 cm (top)
bull Stolothrissa tanganicae 10 cm
Lake Mweru
bullMicrothrissa moeruensis 6cm
Aquaculture amp Fisheries Group Wageningen University
2112011
27
Small zooplankton ndash from eutrophic Tjeukemeer
Nile Perch from Lake Victoria Piscivore
Aquaculture amp Fisheries Group Wageningen University
2112011
28
Haplochromis Species From Nile Perch Stomachs
Lake Mweru ndash a fish community
Length (cm)
MolluscInsect
Cyprinidae (5)Cichlidae (3)Mormyridae (5)Bagridae (2)Mochokidae (3)TylochromisOreochromisClariidae (2)Serranochromis (2)HydrocynusSchilbeidae (2)AlestesOthers (50)
Molluscivore
MicrophytovorePiscivore
5 10 15 20 25 30 35 40 45 50 55 60 65 70 75 80 850
25
50
75
100
125
150
175
200
1970 - 1972
Aquaculture amp Fisheries Group Wageningen University
2112011
29
Size
Biomass
Multispecies fisheries Mweru ndash all sizes and trophic
levelshellip
hellip and all levels are fished
Assignment 2 Fish communities my situation
How many different species are there in the fishery
Which are most important
What biomass (large ndash medium small)
What maximum sizes (large ndash medium ndash small)
What trophic levels (piscivores herbivores benthivores)
What spaces (pelagic demersal migratory)
Draw the most important species into a biomass size spectrum
order them by maximum size trophic level and space (pelagics on top demersal on the bottom)
Aquaculture amp Fisheries Group Wageningen University
2112011
30
Physical environment
Ecosystems
Fish communities
Fishing techniques
Fisheries management
Economics
Administration
Env
ironm
ent
Fish species ndash resilience to fishing
Change in Fish Communities Fishing Environment
Size of individual fish
Competition
Predation
Detrivores Herbivores Zooplanktivores etc
Piscivores
Fishing pressure
Aquaculture amp Fisheries Group Wageningen University
2112011
31
Catch development in a multispecies fishery
Catch
Fishing effort
Fishing down process ndash example Oueme river
Succession of species
black disappeared lt1965
hatched seriously reduced
peak yields around 10000 ton in rsquo50rsquo60ies
Why are some species less resilient to fishing
Aquaculture amp Fisheries Group Wageningen University
2112011
32
time
N
Population growth
Logistic population growth dNdt=r0N(1NK)
K carrying capacity (Nmax)
r0 steepness of the increase
Life history strategies r and Kselected species
rselected species small shortlived high reproductive rates (sardines)
Rapid growth and development Early maturation many offspring with low survival rates Population size below carrying capacity Minimal parental careoffspring Use unpredictable or unstable habitats Abundance varies greatly in time and space Generalists limited niche or trophic specialisation Resources rarely limiting (no competition) Wide dispersal good colonisers rapid response to disturbance Selection for productivity
Anchovy Max age 3-4 years
r=43 Population doubling time lt15 months
Aquaculture amp Fisheries Group Wageningen University
2112011
33
Life history strategies r and Kselected species
Kselected species large longlived lower reproductive rates (sharks rays)
Slow growth long life span Fewer offspring with higher survival rates Population size operate near carrying capacity (K) Use more predictable or stable habitats Parental care is common Abundance stable over time Specialists efficient users of a particular environment (niche
specialist) Resources often become limiting competition Poor colonizers of new or empty habitats (no dispersal) Selection for efficiency (competitive ability)
Hammerhead sharkMax age 14 years
r=08 PDT = 45 ndash 14 years
Not the complete story fish are more plastichellip
Aquaculture amp Fisheries Group Wageningen University
2112011
34
Three basic life history strategiesGrowth
(population)
SurvivalFecundity
Opportunist strategist small shortliving early maturing fish asymp rselected
Periodic strategist high fecundity longer lifespan
Equilibrium strategist medium size some parental care few but larger offspring asymp Kselected
Winemiller and Rose 1992
King and McFarlane 2003
Intermediate strategist
Opportunistic strategist
Early maturing fish frequent reproduction extended spawning period rapid larval growth high population turnover rate (PB = Z = r) eg mosquito fish Marginal habitats (eg like terrestrialaquatic ecotone)
More common in tropical freshwaters
Rarely exploited (small size) otherwise no management needed but to protect founder populations
Aquaculture amp Fisheries Group Wageningen University
2112011
35
Equilibrium strategist
Large adult body size parental care behaviour
Tropical (stable) fresh waters coral reefs (K)
Density dependent processes and resource limitation
Management maintenance of a productive environment and a healthy adult stocks
Periodic strategist
Maximises age specific fecundity at the expense of juvenile survivorship
If favorable conditions for immatures = periodic synchronous reproduction in phase with periodicity of large numbers
of small offspring
Weak stock recruitment relationships
Management maintain a critical density of adults stocks Protect spawning season andor habitat
Aquaculture amp Fisheries Group Wageningen University
2112011
36
Fishbase species resilience to fishing pressure life
history
Three categories of species resilience to fishing Very lowlow ndash medium ndash high
Based on lifehistory characteristics reproduction feeding and spatial behavior
Through the effects of survival fecundity and growth
trophic position
migratory behaviour
See FishBase wwwfishbaseorg
Lake Mweru ndash Mormyrops anguilloides
Resilience Low
Minimum population doubling time = generation time 8 years
Life span 24 years
Max length 150 cm
Lengthage2at2maturity 65 cm 5 years
Trophic level 36
Migratory no
Intermediateperiodic
Aquaculture amp Fisheries Group Wageningen University
2112011
37
Lake Mweru Hydrocynus vittatus
Resilience Mediumlow
Generation time 3 years
Life span 11 years
Max length 105 cm FL
Lengthage2at2maturity 42 cm 2years
Trophic level 44
Migratory yes spawning migrations
Periodic
Lake Mweru Oreochromis mweruensis
Lake Mweru
Resilience High
Minimum population doubling time lt 15 months
Life span 11 years
Max length 40 cm
Lengthage2at2maturity 15 cm 1year
Trophic level 20
Migratory no
Intermediate opportunistc
Aquaculture amp Fisheries Group Wageningen University
2112011
38
Lake Mweru Microthrissa moeruensis
bull Z = PB ~ 5 ndash 7
Resilience High
Generation time 6 months
Life span 25 years
Max length 5 cm
Lengthage2at2first maturity 3 cm04 year
Trophic level 20 ndash 30
Migratory no
Lake MweruOpportunistic
Assignment 3 Resilience to fishing my situation
Use main species in the fishery in assignment 2 (choose at least three) What is their productivityresilience to fishing
What characteristics are used to assess thisbull Size longevity reproduction feeding spatial behaviour
What is the turnover time (PB = Z = r)
Use Fishbase to find out these characteristics What indicators
What datainformation is needed Who haswhere is this information available
Aquaculture amp Fisheries Group Wageningen University
2112011
39
Fishing pressure fish communities and system stability
Physical environment
Ecosystems
Fish communities
Fishing techniques
Fisheries management
Economics
Administration
Env
ironm
ent
Change in Fish Communities Fishing Environment
Size of individual fish
Competition
Predation
Detrivores Herbivores Zooplanktivores etc
Piscivores
Fishing pressure
Aquaculture amp Fisheries Group Wageningen University
2112011
40
Change in Fish Communities Fishing Environment
Piscivores
Size of individual fish
Competition
Predation
Detrivores Herbivores Zooplanktivores etc
Fishing pressure
driving force
Drivers climate wind waterlevel droughts upwelling eutrophication
Fish Communities ndash population regulation
Constant systems
Pulsed systems
Population regulation
nonselective catastrophic mortality
(environmentdominant)
selective mortality (predation competitiondominant)
environment determines prevailing mortality pattern
Aquaculture amp Fisheries Group Wageningen University
2112011
41
Most ecological processes and life history traits can be related to the prevailing mortality pattern
Life history and natural selection
0
20
40
60
80
100
0 1 2 3 4 5 6 7 8
Relative age (years)
Abu
ndan
ce (
N)
but large fish have more eggs
50 cm = 1 mill eggs 100 cm = 16 mill eggs
Age at 50 maturity
Young fish are supposed to die only a fraction will spawn
Aquaculture amp Fisheries Group Wageningen University
2112011
42
Fishing mortality
Age (years)
Inst
anta
neou
s ra
te o
f m
orta
lity
Predation mortality
From ICES (1997)
is almost exactly oppositeSelectivity predation versus fishing
Management promotes harvesting patterns that is opposite to what most fish stock are naturally adapted to
effort
Age and size structure changesunder selective fishing to younger and smaller individuals
A sign of fishing hellip
Aquaculture amp Fisheries Group Wageningen University
2112011
43
Median age-at-maturation of Northeast Arctic cod (Joslashrgensen 1990 Jorgensen et al 2007 Science Conover et al )
and this is what happens
Fishery induced evolution (nr species)
Maturity lower age (6)
Maturity lower size (7)
Reduced growth (6)
Increase fecundity (3)
Loss genetic div (3)
Leading to lower yields
Small
Random
Large
Increased mortality on
Mean individual weight at age after 4 generations
Evidence Size selection (Growth)
= genetic changes
After Conover and Munch 2002Atlantic silverside Menidia menidia max age=2 years R= PDT lt15 months r=58
Aquaculture amp Fisheries Group Wageningen University
2112011
44
Effect of sizeselective fishing (Yield)
Trends in average total weight harvested across multiple generations of size-selective exploitation
Mortality on
Size selective fishing with large mesh sizes on adults We are deliberately pushing stocks to genetically
stable smaller sizes
Small
Random
Large
The rK selection principle the effects of selective
fishing
Age (size)
Abu
ndan
ce (L
og N
)
Slope = total mortality rate Z = r
Increased juvenile mortality= K-selection
Increased adult mortality= r-selection
r-selection Unstable environment abiotic mortality ndash non-predictive non-selectiveK-selection Stable environment biotic mortality (predation) ndash predictive size selective
Aquaculture amp Fisheries Group Wageningen University
2112011
45
Abundance size spectra
Abu
ndan
ce
Size
The distribution of abundance by size follows regular patterns
slope steepens when large fish removed
phytoplankton
zooplankton
small fish
big fish
Year
1976 1978 1980 1982 1984 1986 1988 1990 1992 1994
Slo
pe
-10
-9
-8
-7
-6
-5
Rice amp Gislason (1996)
Trends in size-spectrum slopes of the North Sea
Fishing effects on community sizestructure
Aquaculture amp Fisheries Group Wageningen University
2112011
46
Question
How do you fish a multispecies community
Selective ndash Targeting large sizes with single gears
Unselective ndash Targeting all sizes with many gears
Multispecies community
How should it be harvested
What should be minimum mesh-size
Aquaculture amp Fisheries Group Wageningen University
2112011
47
Selective fishing will change the slope
Biomasssize distributions
Example from lake Kariba Zambiawhere fishers are using illegal smallmeshed nets
The system remains unchanged except everything is less
Kolding et al 2003
Parallel slopes only intercept lower
Aquaculture amp Fisheries Group Wageningen University
2112011
48
2
3
4
5
Tro
phic
leve
l
Pauly et al (1998)
Fishing down the food web
Example from Lake Volta Ghana
The whole fish community is targeted highly pulsed system
highly dynamic fishery (spatial temporal movements fishermen)
27 fishing methods
25 kgday
74 species utilized
All trophic levels utilized by combining gears with specific trophic profiles 1 2 3 4 5Trophic level
Gears in the fishery ( species sample size)
Van Zwieten et al 2008
Aquaculture amp Fisheries Group Wageningen University
2112011
49
Is nonselective fishing bad
There is no empirical evidence
On the contrary we know that selective fishing is bad but we still advocate it
But how do we impose gear mesh and size restrictions in a multispecies fishery
The optimum fishing pattern is un-selective How much
How
Is fishing down the food web bad
Where is the highest production
Sohellip what is the best fishing pattern
What if we fish everything
A non-selective harvesting pattern is ecosystem conserving
The system remains intact but everything is less
This means fishing down the food-web
Aquaculture amp Fisheries Group Wageningen University
2112011
50
Indicators ndash biomass size distribution
Size of individual fish
Biomass Unexploited Population = Blt40
Maximum length = Lmax10
Fishing pressure
Mean length exploited population = L5
Biomass Exploited Population = Bgt40
Mean length total= Lmean
Intercept = Iasd
Assignment 4 Fishing down my situation
Characterise your fishery Single species single gear ndash multigear
Specific target species ndash all species are targeted (multispecies)
Specific size ndash all sizes (quantify)
Is there a shift from large specimen to small
Is there a shift from large species ndash to small Is there a shift in trophic level
What information is needed What indicators
Where to get this information
Aquaculture amp Fisheries Group Wageningen University
2112011
51
Dynamics of fishing ndash stabilise catch variability
Physical environment
Ecosystems
Fish communities
Fishing techniques
Fisheries management
Economics
Administration
Env
ironm
ent
Diversity in methods ndash small units adaptive
Hook and line fisherman
Lake Jaba Nigeria
Trap fishermen
Lake Mweru Zambia
Aquaculture amp Fisheries Group Wageningen University
2112011
52
Labor intensive beach seining on demersals
Small fish common Chilimira seine small pelagics
Aquaculture amp Fisheries Group Wageningen University
2112011
53
Innovative Nkacha seine small demersals
Unevenly distributed ndash important gears lake Mweru
Aquaculture amp Fisheries Group Wageningen University
2112011
54
Highly mobile ndash movement fishermen Lake Malawi
movement one fisherman in 6 months
SE Arm of Lake Malawi
Characteristics of smallscale fisheries
Small units simple processing small scale trading
Methods diverse innovative labor intensive
Opportunistic adaptive
Large subsistence element (small fish)
Unevenly distributed highly mobile
Aquaculture amp Fisheries Group Wageningen University
2112011
55
Fishing mortality (F)
number of units
efficiency
Effort (f)
Catchability (q)Fishing mortality (F)
More of the same
Decreasing numbers = management
Better methods = Increasing efficiency
=development
So while we both lsquomanagersquo and lsquodeveloprsquo the fishing mortality stays the same
Uh
Tradeoffs Economic efficiency vs employment
opportunities
0
20
40
60
80
100
120
140
160
180
1945 1950 1955 1960 1965 1970 1975 1980 1985 1990 1995 2000 2005
Fish
erm
en (
1000
)
Cat
ch p
er
fishe
rman
(to
ns)
0
500000
1000000
1500000
2000000
2500000
3000000
3500000
4000000
Qua
ntity
(to
ns)
Quantity (tons) Fishermen (1000) Catch (tons) per fisherman
Total catch numbers of fishers amp catch per fisherman in the Norwegian fishery 1945-2005
Effort (f) decreases while CpUE increases because catchability (q = efficiency) increases
Aquaculture amp Fisheries Group Wageningen University
2112011
56
Assignment 5 Dynamics fishery ndash my situation
How has fishing effort developed over time In terms of numbers (fishermen boats)
In terms of gears bull Types
bull Active ndash passive methods
In terms of spatial distribution
In terms of trophic levels
What informationdata needed What indicators
Who haswhere is this information
Goal
Apply a systems approach to fishery information ndashdevise indicators System
bull Understand the role of environment and fishing as sources of population regulation (mortality)
Species Stocksbull Understand that different species have different resilience to fishing
bull Understand r K principle
Selectivity ndash Catch and effortbull Discuss the consequences of selective and unselective fishing on fish
communities
bull Understand the characteristics of small scale fisheries
Aquaculture amp Fisheries Group Wageningen University
2112011
57
Summary All species and systems ndash important sets of
indicators
Effort (numbers types)
Species (composition in catch)
Catch (by species total)
Catch per unit Effort (~relative biomass)
Length (in catch at maturity)
Drivers (as explanatory factor)
copy Wageningen UR
End hellipbeginning
Aquaculture amp Fisheries Group Wageningen University
2112011
58
Summary environment species resilience management Life history strategy Opportunistic Periodic Equilibrium Environment Temporally stochastic
with small-scale patches
Seasonal with large-scale patches
Stable with fine-scaled spatial variation
Demographic trade-off 1 age at maturity 2 fecundity 3 juvenile survivorship
low low low
high high low
high low high
Demographic character Maximise (re)colonising capability of habitats over small spatial scales
Maximise age-specific fecundity spreading of reproductive effort over many years andor large areas
Maximise juvenile survivorship in resource limited density-dependent environments
Life history traits - size - age at maturity - size at maturity - clutch size - egg size - larvalYOY growth - reproductive season - parental care
Small Early Small Small Small Rapid Long No
Large Delayed Mediumlarge Large Small Rapid Short No
Smallmedium Delayed Medium Small Large Slow Long Yes
- Maintain critical minimum spawning biomass
- Maintain appropriate age structure (including large specimen)
- Maintenance of adult stock
Primary management objectives
- Protection against large scale or chronic perturbations that eliminate key refugia in space and time
- Spatial refuges directed at adult stock (including spawning habitats and migration routes)
- Maintain integrity of adult habitat
Environment
Demographic trade-offs
Life history traits
Management objectives

Aquaculture amp Fisheries Group Wageningen University
2112011
7
Evaluative capacity ndash social learning
Writing history together Fishers managers others
Management objectives ndash information needs
Production planning ldquoFeed the peoplerdquo
Fisheries Management ldquoSet levels of resource usagerdquo
Nature conservation ldquoRetain the integrity of naturerdquo
bull Biological
bull Social and economic
Aquaculture amp Fisheries Group Wageningen University
2112011
8
Only 2 biological questions in fisheries management
How much = Fishing pressure
bull Effort (f )
bull Catch (C)
How = Fishing pattern
bull Catchability (q )
bull Selectivity (s )
How much
How
Why fisheries (stock) assessements
Optimising catches ndash how much
Long term sustainability
Given variable stock sizes
Sharing arrangements catches ndash how much how
Between fishers
Between countries (eg migratory stocks shared seas and lakes)
Assessing sustainability of fisheries ndash how
Total pressure
Selectivity of catches size communities incl fish birds mammals
bull Tracking and tracing
bull Labelling
Habitats
Aquaculture amp Fisheries Group Wageningen University
2112011
9
Focus management and environmentalists on human impact and
control Fishers refer to natural influences Dispute
Catch
Effort
Nature
Fishing community
Researcher
Size
Objective measure
Total effort
Total catch MSY
Main objective to ensure optimalsustainable harvest
Main measure control of fishing effort
Aquaculture amp Fisheries Group Wageningen University
2112011
10
Control of targeted sizes
Bio
mas
s
Length (Age)
Selectivity curve small hook
Selectivity curve large hook
Available biomass Available
biomass
Control of pressure reference level (MSY)
Cat
ch (
= Y
ield
)
Fishing pressure
Overexploited
Maximum Sustainable Yield
Aquaculture amp Fisheries Group Wageningen University
2112011
11
Fisheries management options
Input controls Ban of fishing techniques (q) Maximummin mesh size (q) Change in gear construction (q) Days at sea (f)
Reduce number of gears (f)
Closed areas (f)
Closed seasons (f)
Protection habitats (fq)
B
C F = fq
Output controls (C)
Total allowable catch (TAC)
Individual Transferable Quota (ITQ)
Target specific specieslengths
C = FB
That is all Any available or
conceivable regulation can be reduced to the two terms C and F with goals defined on B
All are through regulating fishing effort
BMSY SSBmin SSBpa Cf MSY
M
R
G
Biomass
F=fq
Nt
t
R
t
tage
Wt
t
Ft
tc
C
Statistical
CEDRS
trends assessment
adaptation
Analytical
Experimental
Research
CEDRS
assessment
predictions
f
q
+ sd
HolisticBlack box approach
Analytical approach
Fisheries science ndash information evaluation
Aquaculture amp Fisheries Group Wageningen University
2112011
12
Data needed for assessment general
Basic data from the fishery
CatchperUnit Effort (tonnes numbers)
Effort (numbers)
Length (cm)
Basic research data
Migration (tagging)
Spawning (recruitment maturity stages areas)
Age
Natural Mortality
Trade offs in multispecies communities ndash no free lunch
MMSY =
Target LimitStay clear off
Aquaculture amp Fisheries Group Wageningen University
2112011
13
Goals data collection needs linkages
Production planning trade Catch Input ndash labor vessels No link
Fisheries management Catch and effort linked By commercial species
Conservation Catch and effort linked Selectivity All species Habitats ecosystems
Increase in
- Resolution
- Linked data
- Costs
Ecosystem based management
Ecosystem based management What is that
Change in information base Fisheries Science = heavy investment in population dynamics Ecosystem = interaction between organisms with each other
and the physical environment New questions arise on habitats and nontarget organisms
Not clear how the fisheries ldquohowrdquo and ldquohow muchrdquo questions can be dealt with Focus on more generic measures as MPArsquos (keeping a bank)
Focus on clarity of information for all involved what info is needed
Aquaculture amp Fisheries Group Wageningen University
2112011
14
Biomass
Models ndash Indicators references and the long view
Fishing mortality = CB
Recruitment
Growth
Natural mortality
Indicator approaches ndash system stakeholder
Size of fish
Biomas s
Fishing
Nutrients
Pressure
Driver
State
Size of fish
Biomas s
Fishing
Nutrients
Pressure
Driver
State
Aquaculture amp Fisheries Group Wageningen University
2112011
15
Indicator approaches ndash system stakeholder
Size of fish
B
io
ma
s s
Fishing
Nutrients
Pressure
Driver
State
Size of fish
B
io
ma
s s
Fishing
Nutrients
Pressure
Driver
State
Fishers Managers
Greens TradersSupermarkets general
public
DataInformationKnowledge
Role of science
Part 2 a system approach
Aquaculture amp Fisheries Group Wageningen University
2112011
16
Goal
Apply a systems approach to fishery information ndashdevising indicators System
bull Understand the role of environment and fishing as sources of population regulation (mortality)
Species Stocksbull Understand that different species have different resilience to fishing
Selectivity ndash Catch and effortbull Understand consequences of (un)selective fishing on fish communities
bull Understand the characteristics of small scale fisheries
bull Understand the potential (and drive) to stabilise catches
Africa diversity of freshwater and marine systemsFreshwaters bull Rivers Nile Orange Congo Zambezi etc
bull River floodplains Niger Congo Zambezi Kafue Pongolo etc
bull Exorheic swamps Sudd Bangweulu Kamulondo Cuvette Centrale Luapula Shire Malagarasi Lukanga
bull Endorheic wetlands and lakes
Chad Okavango Chilwa Rukwa
bull Man made riverine lakes
Kariba Cabora-Bassa Volta Nasser Kainji
bull Shallow lakes open drainage
George Edward Kyoga Malombe Mweru
bull Large deep lakes Tanganyika Victoria Malawi Turkana etc Marine systems bull Upwelling areas Coastal East and Souther Africa
Mauretania Namibia bull Estuaries River mouths bull Tidal flats Banc drsquoAacuterguin bull Continental flats banks Coastal Mozambique Sofala bank bull Coral reefs Red Sea Coastal Islands Tanzania Kenya bull Seemounts bull Open ocean
Aquaculture amp Fisheries Group Wageningen University
2112011
17
Two important indicators
Catch
Effort
Fopt
C = fqB
Relation productivity amp number of fishermen
y = 30xR2 = 082
y = 26 xR2 = 08157
0
5
10
15
20
25
30
35
40
45
50
0 2 4 6 8 10 12 14 16
Density (fisherskm^2)
Cat
ch (
tKm
^2y
ear)
Malombe
Chilwa
MweruChiuta
Albert
Itezhi-tezhi
Edward
Bangweulu
Tanganyika
Nasser amp Kariba
Turkana Kivu
Malawi
Victoria 19702
Victoria 1990 Victoria 20024
Volta Kainji
Average annual catch rate for African fishers = 3 tonyear irrespective of system
Aquaculture amp Fisheries Group Wageningen University
2112011
18
Information needs towards indicators
Systems differ
in productivity
In variability in productivity
in species communities
in effort dynamics
Contextualising fishing patterns and outcome
Scaled indicators
Systems approach ndash sources catch variability
Physical forcing drivers Rainfall water level nutrient pulsing
Climate el Niňo cycles nutrient upwelling
Landuse runoff rainfall nutrient loading siltation habitat change
Ecological spatial heterogeneity
Fish communities species attributes
Exploitation fishery characteristics
(Co)management structure organisation goals
Aquaculture amp Fisheries Group Wageningen University
2112011
19
System approach ndash a theory
Physical environment
Ecosystems
Fish communities
Fishing techniques
Fisheries management
Economics
Administration
Env
ironm
ent
Ecosystem drivers ndash pulsed stable
Physical environment
Ecosystems
Fish communities
Fishing techniques
Fisheries management
Economics
Administration
Env
ironm
ent
Aquaculture amp Fisheries Group Wageningen University
2112011
20
Okavango ndash highly pulsed system
Fluctuating environment Unpredictable
Mortality = density independent high often catastrophic
Population = variable in time less than carrying capacity
Freshwater Lake MalawiVictoria ndash constant system
Stable environment predictable
Mortality density dependent low constant
Population size constant in time around carrying capacity
Aquaculture amp Fisheries Group Wageningen University
2112011
21
Marine Red River Estuary Variable Predictable
What are the dominant life history strategies
What are the dominant life history strategies
Marine Komodo Coral Reefs Highly Stable Predictable
Aquaculture amp Fisheries Group Wageningen University
2112011
22
Drivers ndash waterlevels ndash nutrient pulsing
Scale of variation
Time Process
decadal community
annual stocks
seasonal year class
Monthly industrial catch rate clupeids lake Tanganyika
1955 1960 1965 1970 1975 1980 1985 1990 1995
Year
0
1
2
3
4
5
6
7
8
x 1000 kgvessel
small
Drivers ndash wind stress ndash nutrient upwelling
decadal annual seasonal variation
Aquaculture amp Fisheries Group Wageningen University
2112011
23
Drivers ndash weather patterns ndash nutrient upwelling
Normal pattern
Effect=1-2 years signal clear Yes
El Nino pattern
Drivers Eutrophication Lake Victoria eutrophication through increase nutrient loading related to landuse
Aquaculture amp Fisheries Group Wageningen University
2112011
24
Assignment 1 Drivers Your situation
What type of system
stable ndash pulsed
What drivers are important climate wind waterlevel droughts upwelling eutrophication land
use change
What indicators needed for assessment
What datainformation is needed to monitor longterm developments
Who haswhere is this information available
Fish communities
Physical environment
Ecosystems
Fish communities
Fishing techniques
Fisheries management
Economics
Administration
Env
ironm
ent
Aquaculture amp Fisheries Group Wageningen University
2112011
25
A Lindeman pyramid illustrating
a fish community
Size
Biomass
The biomass-size distribution important indicators in both single species and community studies
A fish community
Fish communities ndash size biomass trophic groups
Size of individual fish
Competition
Predation
Detrivores Herbivores Zooplanktivores etc
Piscivores
Aquaculture amp Fisheries Group Wageningen University
2112011
26
Tilapia ndash Oreochromis mossmbicus detrivore
Small Clupeidae zooplanktivores
Lake Tanganyika
bull Limnothrissa miodon 17 cm (top)
bull Stolothrissa tanganicae 10 cm
Lake Mweru
bullMicrothrissa moeruensis 6cm
Aquaculture amp Fisheries Group Wageningen University
2112011
27
Small zooplankton ndash from eutrophic Tjeukemeer
Nile Perch from Lake Victoria Piscivore
Aquaculture amp Fisheries Group Wageningen University
2112011
28
Haplochromis Species From Nile Perch Stomachs
Lake Mweru ndash a fish community
Length (cm)
MolluscInsect
Cyprinidae (5)Cichlidae (3)Mormyridae (5)Bagridae (2)Mochokidae (3)TylochromisOreochromisClariidae (2)Serranochromis (2)HydrocynusSchilbeidae (2)AlestesOthers (50)
Molluscivore
MicrophytovorePiscivore
5 10 15 20 25 30 35 40 45 50 55 60 65 70 75 80 850
25
50
75
100
125
150
175
200
1970 - 1972
Aquaculture amp Fisheries Group Wageningen University
2112011
29
Size
Biomass
Multispecies fisheries Mweru ndash all sizes and trophic
levelshellip
hellip and all levels are fished
Assignment 2 Fish communities my situation
How many different species are there in the fishery
Which are most important
What biomass (large ndash medium small)
What maximum sizes (large ndash medium ndash small)
What trophic levels (piscivores herbivores benthivores)
What spaces (pelagic demersal migratory)
Draw the most important species into a biomass size spectrum
order them by maximum size trophic level and space (pelagics on top demersal on the bottom)
Aquaculture amp Fisheries Group Wageningen University
2112011
30
Physical environment
Ecosystems
Fish communities
Fishing techniques
Fisheries management
Economics
Administration
Env
ironm
ent
Fish species ndash resilience to fishing
Change in Fish Communities Fishing Environment
Size of individual fish
Competition
Predation
Detrivores Herbivores Zooplanktivores etc
Piscivores
Fishing pressure
Aquaculture amp Fisheries Group Wageningen University
2112011
31
Catch development in a multispecies fishery
Catch
Fishing effort
Fishing down process ndash example Oueme river
Succession of species
black disappeared lt1965
hatched seriously reduced
peak yields around 10000 ton in rsquo50rsquo60ies
Why are some species less resilient to fishing
Aquaculture amp Fisheries Group Wageningen University
2112011
32
time
N
Population growth
Logistic population growth dNdt=r0N(1NK)
K carrying capacity (Nmax)
r0 steepness of the increase
Life history strategies r and Kselected species
rselected species small shortlived high reproductive rates (sardines)
Rapid growth and development Early maturation many offspring with low survival rates Population size below carrying capacity Minimal parental careoffspring Use unpredictable or unstable habitats Abundance varies greatly in time and space Generalists limited niche or trophic specialisation Resources rarely limiting (no competition) Wide dispersal good colonisers rapid response to disturbance Selection for productivity
Anchovy Max age 3-4 years
r=43 Population doubling time lt15 months
Aquaculture amp Fisheries Group Wageningen University
2112011
33
Life history strategies r and Kselected species
Kselected species large longlived lower reproductive rates (sharks rays)
Slow growth long life span Fewer offspring with higher survival rates Population size operate near carrying capacity (K) Use more predictable or stable habitats Parental care is common Abundance stable over time Specialists efficient users of a particular environment (niche
specialist) Resources often become limiting competition Poor colonizers of new or empty habitats (no dispersal) Selection for efficiency (competitive ability)
Hammerhead sharkMax age 14 years
r=08 PDT = 45 ndash 14 years
Not the complete story fish are more plastichellip
Aquaculture amp Fisheries Group Wageningen University
2112011
34
Three basic life history strategiesGrowth
(population)
SurvivalFecundity
Opportunist strategist small shortliving early maturing fish asymp rselected
Periodic strategist high fecundity longer lifespan
Equilibrium strategist medium size some parental care few but larger offspring asymp Kselected
Winemiller and Rose 1992
King and McFarlane 2003
Intermediate strategist
Opportunistic strategist
Early maturing fish frequent reproduction extended spawning period rapid larval growth high population turnover rate (PB = Z = r) eg mosquito fish Marginal habitats (eg like terrestrialaquatic ecotone)
More common in tropical freshwaters
Rarely exploited (small size) otherwise no management needed but to protect founder populations
Aquaculture amp Fisheries Group Wageningen University
2112011
35
Equilibrium strategist
Large adult body size parental care behaviour
Tropical (stable) fresh waters coral reefs (K)
Density dependent processes and resource limitation
Management maintenance of a productive environment and a healthy adult stocks
Periodic strategist
Maximises age specific fecundity at the expense of juvenile survivorship
If favorable conditions for immatures = periodic synchronous reproduction in phase with periodicity of large numbers
of small offspring
Weak stock recruitment relationships
Management maintain a critical density of adults stocks Protect spawning season andor habitat
Aquaculture amp Fisheries Group Wageningen University
2112011
36
Fishbase species resilience to fishing pressure life
history
Three categories of species resilience to fishing Very lowlow ndash medium ndash high
Based on lifehistory characteristics reproduction feeding and spatial behavior
Through the effects of survival fecundity and growth
trophic position
migratory behaviour
See FishBase wwwfishbaseorg
Lake Mweru ndash Mormyrops anguilloides
Resilience Low
Minimum population doubling time = generation time 8 years
Life span 24 years
Max length 150 cm
Lengthage2at2maturity 65 cm 5 years
Trophic level 36
Migratory no
Intermediateperiodic
Aquaculture amp Fisheries Group Wageningen University
2112011
37
Lake Mweru Hydrocynus vittatus
Resilience Mediumlow
Generation time 3 years
Life span 11 years
Max length 105 cm FL
Lengthage2at2maturity 42 cm 2years
Trophic level 44
Migratory yes spawning migrations
Periodic
Lake Mweru Oreochromis mweruensis
Lake Mweru
Resilience High
Minimum population doubling time lt 15 months
Life span 11 years
Max length 40 cm
Lengthage2at2maturity 15 cm 1year
Trophic level 20
Migratory no
Intermediate opportunistc
Aquaculture amp Fisheries Group Wageningen University
2112011
38
Lake Mweru Microthrissa moeruensis
bull Z = PB ~ 5 ndash 7
Resilience High
Generation time 6 months
Life span 25 years
Max length 5 cm
Lengthage2at2first maturity 3 cm04 year
Trophic level 20 ndash 30
Migratory no
Lake MweruOpportunistic
Assignment 3 Resilience to fishing my situation
Use main species in the fishery in assignment 2 (choose at least three) What is their productivityresilience to fishing
What characteristics are used to assess thisbull Size longevity reproduction feeding spatial behaviour
What is the turnover time (PB = Z = r)
Use Fishbase to find out these characteristics What indicators
What datainformation is needed Who haswhere is this information available
Aquaculture amp Fisheries Group Wageningen University
2112011
39
Fishing pressure fish communities and system stability
Physical environment
Ecosystems
Fish communities
Fishing techniques
Fisheries management
Economics
Administration
Env
ironm
ent
Change in Fish Communities Fishing Environment
Size of individual fish
Competition
Predation
Detrivores Herbivores Zooplanktivores etc
Piscivores
Fishing pressure
Aquaculture amp Fisheries Group Wageningen University
2112011
40
Change in Fish Communities Fishing Environment
Piscivores
Size of individual fish
Competition
Predation
Detrivores Herbivores Zooplanktivores etc
Fishing pressure
driving force
Drivers climate wind waterlevel droughts upwelling eutrophication
Fish Communities ndash population regulation
Constant systems
Pulsed systems
Population regulation
nonselective catastrophic mortality
(environmentdominant)
selective mortality (predation competitiondominant)
environment determines prevailing mortality pattern
Aquaculture amp Fisheries Group Wageningen University
2112011
41
Most ecological processes and life history traits can be related to the prevailing mortality pattern
Life history and natural selection
0
20
40
60
80
100
0 1 2 3 4 5 6 7 8
Relative age (years)
Abu
ndan
ce (
N)
but large fish have more eggs
50 cm = 1 mill eggs 100 cm = 16 mill eggs
Age at 50 maturity
Young fish are supposed to die only a fraction will spawn
Aquaculture amp Fisheries Group Wageningen University
2112011
42
Fishing mortality
Age (years)
Inst
anta
neou
s ra
te o
f m
orta
lity
Predation mortality
From ICES (1997)
is almost exactly oppositeSelectivity predation versus fishing
Management promotes harvesting patterns that is opposite to what most fish stock are naturally adapted to
effort
Age and size structure changesunder selective fishing to younger and smaller individuals
A sign of fishing hellip
Aquaculture amp Fisheries Group Wageningen University
2112011
43
Median age-at-maturation of Northeast Arctic cod (Joslashrgensen 1990 Jorgensen et al 2007 Science Conover et al )
and this is what happens
Fishery induced evolution (nr species)
Maturity lower age (6)
Maturity lower size (7)
Reduced growth (6)
Increase fecundity (3)
Loss genetic div (3)
Leading to lower yields
Small
Random
Large
Increased mortality on
Mean individual weight at age after 4 generations
Evidence Size selection (Growth)
= genetic changes
After Conover and Munch 2002Atlantic silverside Menidia menidia max age=2 years R= PDT lt15 months r=58
Aquaculture amp Fisheries Group Wageningen University
2112011
44
Effect of sizeselective fishing (Yield)
Trends in average total weight harvested across multiple generations of size-selective exploitation
Mortality on
Size selective fishing with large mesh sizes on adults We are deliberately pushing stocks to genetically
stable smaller sizes
Small
Random
Large
The rK selection principle the effects of selective
fishing
Age (size)
Abu
ndan
ce (L
og N
)
Slope = total mortality rate Z = r
Increased juvenile mortality= K-selection
Increased adult mortality= r-selection
r-selection Unstable environment abiotic mortality ndash non-predictive non-selectiveK-selection Stable environment biotic mortality (predation) ndash predictive size selective
Aquaculture amp Fisheries Group Wageningen University
2112011
45
Abundance size spectra
Abu
ndan
ce
Size
The distribution of abundance by size follows regular patterns
slope steepens when large fish removed
phytoplankton
zooplankton
small fish
big fish
Year
1976 1978 1980 1982 1984 1986 1988 1990 1992 1994
Slo
pe
-10
-9
-8
-7
-6
-5
Rice amp Gislason (1996)
Trends in size-spectrum slopes of the North Sea
Fishing effects on community sizestructure
Aquaculture amp Fisheries Group Wageningen University
2112011
46
Question
How do you fish a multispecies community
Selective ndash Targeting large sizes with single gears
Unselective ndash Targeting all sizes with many gears
Multispecies community
How should it be harvested
What should be minimum mesh-size
Aquaculture amp Fisheries Group Wageningen University
2112011
47
Selective fishing will change the slope
Biomasssize distributions
Example from lake Kariba Zambiawhere fishers are using illegal smallmeshed nets
The system remains unchanged except everything is less
Kolding et al 2003
Parallel slopes only intercept lower
Aquaculture amp Fisheries Group Wageningen University
2112011
48
2
3
4
5
Tro
phic
leve
l
Pauly et al (1998)
Fishing down the food web
Example from Lake Volta Ghana
The whole fish community is targeted highly pulsed system
highly dynamic fishery (spatial temporal movements fishermen)
27 fishing methods
25 kgday
74 species utilized
All trophic levels utilized by combining gears with specific trophic profiles 1 2 3 4 5Trophic level
Gears in the fishery ( species sample size)
Van Zwieten et al 2008
Aquaculture amp Fisheries Group Wageningen University
2112011
49
Is nonselective fishing bad
There is no empirical evidence
On the contrary we know that selective fishing is bad but we still advocate it
But how do we impose gear mesh and size restrictions in a multispecies fishery
The optimum fishing pattern is un-selective How much
How
Is fishing down the food web bad
Where is the highest production
Sohellip what is the best fishing pattern
What if we fish everything
A non-selective harvesting pattern is ecosystem conserving
The system remains intact but everything is less
This means fishing down the food-web
Aquaculture amp Fisheries Group Wageningen University
2112011
50
Indicators ndash biomass size distribution
Size of individual fish
Biomass Unexploited Population = Blt40
Maximum length = Lmax10
Fishing pressure
Mean length exploited population = L5
Biomass Exploited Population = Bgt40
Mean length total= Lmean
Intercept = Iasd
Assignment 4 Fishing down my situation
Characterise your fishery Single species single gear ndash multigear
Specific target species ndash all species are targeted (multispecies)
Specific size ndash all sizes (quantify)
Is there a shift from large specimen to small
Is there a shift from large species ndash to small Is there a shift in trophic level
What information is needed What indicators
Where to get this information
Aquaculture amp Fisheries Group Wageningen University
2112011
51
Dynamics of fishing ndash stabilise catch variability
Physical environment
Ecosystems
Fish communities
Fishing techniques
Fisheries management
Economics
Administration
Env
ironm
ent
Diversity in methods ndash small units adaptive
Hook and line fisherman
Lake Jaba Nigeria
Trap fishermen
Lake Mweru Zambia
Aquaculture amp Fisheries Group Wageningen University
2112011
52
Labor intensive beach seining on demersals
Small fish common Chilimira seine small pelagics
Aquaculture amp Fisheries Group Wageningen University
2112011
53
Innovative Nkacha seine small demersals
Unevenly distributed ndash important gears lake Mweru
Aquaculture amp Fisheries Group Wageningen University
2112011
54
Highly mobile ndash movement fishermen Lake Malawi
movement one fisherman in 6 months
SE Arm of Lake Malawi
Characteristics of smallscale fisheries
Small units simple processing small scale trading
Methods diverse innovative labor intensive
Opportunistic adaptive
Large subsistence element (small fish)
Unevenly distributed highly mobile
Aquaculture amp Fisheries Group Wageningen University
2112011
55
Fishing mortality (F)
number of units
efficiency
Effort (f)
Catchability (q)Fishing mortality (F)
More of the same
Decreasing numbers = management
Better methods = Increasing efficiency
=development
So while we both lsquomanagersquo and lsquodeveloprsquo the fishing mortality stays the same
Uh
Tradeoffs Economic efficiency vs employment
opportunities
0
20
40
60
80
100
120
140
160
180
1945 1950 1955 1960 1965 1970 1975 1980 1985 1990 1995 2000 2005
Fish
erm
en (
1000
)
Cat
ch p
er
fishe
rman
(to
ns)
0
500000
1000000
1500000
2000000
2500000
3000000
3500000
4000000
Qua
ntity
(to
ns)
Quantity (tons) Fishermen (1000) Catch (tons) per fisherman
Total catch numbers of fishers amp catch per fisherman in the Norwegian fishery 1945-2005
Effort (f) decreases while CpUE increases because catchability (q = efficiency) increases
Aquaculture amp Fisheries Group Wageningen University
2112011
56
Assignment 5 Dynamics fishery ndash my situation
How has fishing effort developed over time In terms of numbers (fishermen boats)
In terms of gears bull Types
bull Active ndash passive methods
In terms of spatial distribution
In terms of trophic levels
What informationdata needed What indicators
Who haswhere is this information
Goal
Apply a systems approach to fishery information ndashdevise indicators System
bull Understand the role of environment and fishing as sources of population regulation (mortality)
Species Stocksbull Understand that different species have different resilience to fishing
bull Understand r K principle
Selectivity ndash Catch and effortbull Discuss the consequences of selective and unselective fishing on fish
communities
bull Understand the characteristics of small scale fisheries
Aquaculture amp Fisheries Group Wageningen University
2112011
57
Summary All species and systems ndash important sets of
indicators
Effort (numbers types)
Species (composition in catch)
Catch (by species total)
Catch per unit Effort (~relative biomass)
Length (in catch at maturity)
Drivers (as explanatory factor)
copy Wageningen UR
End hellipbeginning
Aquaculture amp Fisheries Group Wageningen University
2112011
58
Summary environment species resilience management Life history strategy Opportunistic Periodic Equilibrium Environment Temporally stochastic
with small-scale patches
Seasonal with large-scale patches
Stable with fine-scaled spatial variation
Demographic trade-off 1 age at maturity 2 fecundity 3 juvenile survivorship
low low low
high high low
high low high
Demographic character Maximise (re)colonising capability of habitats over small spatial scales
Maximise age-specific fecundity spreading of reproductive effort over many years andor large areas
Maximise juvenile survivorship in resource limited density-dependent environments
Life history traits - size - age at maturity - size at maturity - clutch size - egg size - larvalYOY growth - reproductive season - parental care
Small Early Small Small Small Rapid Long No
Large Delayed Mediumlarge Large Small Rapid Short No
Smallmedium Delayed Medium Small Large Slow Long Yes
- Maintain critical minimum spawning biomass
- Maintain appropriate age structure (including large specimen)
- Maintenance of adult stock
Primary management objectives
- Protection against large scale or chronic perturbations that eliminate key refugia in space and time
- Spatial refuges directed at adult stock (including spawning habitats and migration routes)
- Maintain integrity of adult habitat
Environment
Demographic trade-offs
Life history traits
Management objectives

Aquaculture amp Fisheries Group Wageningen University
2112011
8
Only 2 biological questions in fisheries management
How much = Fishing pressure
bull Effort (f )
bull Catch (C)
How = Fishing pattern
bull Catchability (q )
bull Selectivity (s )
How much
How
Why fisheries (stock) assessements
Optimising catches ndash how much
Long term sustainability
Given variable stock sizes
Sharing arrangements catches ndash how much how
Between fishers
Between countries (eg migratory stocks shared seas and lakes)
Assessing sustainability of fisheries ndash how
Total pressure
Selectivity of catches size communities incl fish birds mammals
bull Tracking and tracing
bull Labelling
Habitats
Aquaculture amp Fisheries Group Wageningen University
2112011
9
Focus management and environmentalists on human impact and
control Fishers refer to natural influences Dispute
Catch
Effort
Nature
Fishing community
Researcher
Size
Objective measure
Total effort
Total catch MSY
Main objective to ensure optimalsustainable harvest
Main measure control of fishing effort
Aquaculture amp Fisheries Group Wageningen University
2112011
10
Control of targeted sizes
Bio
mas
s
Length (Age)
Selectivity curve small hook
Selectivity curve large hook
Available biomass Available
biomass
Control of pressure reference level (MSY)
Cat
ch (
= Y
ield
)
Fishing pressure
Overexploited
Maximum Sustainable Yield
Aquaculture amp Fisheries Group Wageningen University
2112011
11
Fisheries management options
Input controls Ban of fishing techniques (q) Maximummin mesh size (q) Change in gear construction (q) Days at sea (f)
Reduce number of gears (f)
Closed areas (f)
Closed seasons (f)
Protection habitats (fq)
B
C F = fq
Output controls (C)
Total allowable catch (TAC)
Individual Transferable Quota (ITQ)
Target specific specieslengths
C = FB
That is all Any available or
conceivable regulation can be reduced to the two terms C and F with goals defined on B
All are through regulating fishing effort
BMSY SSBmin SSBpa Cf MSY
M
R
G
Biomass
F=fq
Nt
t
R
t
tage
Wt
t
Ft
tc
C
Statistical
CEDRS
trends assessment
adaptation
Analytical
Experimental
Research
CEDRS
assessment
predictions
f
q
+ sd
HolisticBlack box approach
Analytical approach
Fisheries science ndash information evaluation
Aquaculture amp Fisheries Group Wageningen University
2112011
12
Data needed for assessment general
Basic data from the fishery
CatchperUnit Effort (tonnes numbers)
Effort (numbers)
Length (cm)
Basic research data
Migration (tagging)
Spawning (recruitment maturity stages areas)
Age
Natural Mortality
Trade offs in multispecies communities ndash no free lunch
MMSY =
Target LimitStay clear off
Aquaculture amp Fisheries Group Wageningen University
2112011
13
Goals data collection needs linkages
Production planning trade Catch Input ndash labor vessels No link
Fisheries management Catch and effort linked By commercial species
Conservation Catch and effort linked Selectivity All species Habitats ecosystems
Increase in
- Resolution
- Linked data
- Costs
Ecosystem based management
Ecosystem based management What is that
Change in information base Fisheries Science = heavy investment in population dynamics Ecosystem = interaction between organisms with each other
and the physical environment New questions arise on habitats and nontarget organisms
Not clear how the fisheries ldquohowrdquo and ldquohow muchrdquo questions can be dealt with Focus on more generic measures as MPArsquos (keeping a bank)
Focus on clarity of information for all involved what info is needed
Aquaculture amp Fisheries Group Wageningen University
2112011
14
Biomass
Models ndash Indicators references and the long view
Fishing mortality = CB
Recruitment
Growth
Natural mortality
Indicator approaches ndash system stakeholder
Size of fish
Biomas s
Fishing
Nutrients
Pressure
Driver
State
Size of fish
Biomas s
Fishing
Nutrients
Pressure
Driver
State
Aquaculture amp Fisheries Group Wageningen University
2112011
15
Indicator approaches ndash system stakeholder
Size of fish
B
io
ma
s s
Fishing
Nutrients
Pressure
Driver
State
Size of fish
B
io
ma
s s
Fishing
Nutrients
Pressure
Driver
State
Fishers Managers
Greens TradersSupermarkets general
public
DataInformationKnowledge
Role of science
Part 2 a system approach
Aquaculture amp Fisheries Group Wageningen University
2112011
16
Goal
Apply a systems approach to fishery information ndashdevising indicators System
bull Understand the role of environment and fishing as sources of population regulation (mortality)
Species Stocksbull Understand that different species have different resilience to fishing
Selectivity ndash Catch and effortbull Understand consequences of (un)selective fishing on fish communities
bull Understand the characteristics of small scale fisheries
bull Understand the potential (and drive) to stabilise catches
Africa diversity of freshwater and marine systemsFreshwaters bull Rivers Nile Orange Congo Zambezi etc
bull River floodplains Niger Congo Zambezi Kafue Pongolo etc
bull Exorheic swamps Sudd Bangweulu Kamulondo Cuvette Centrale Luapula Shire Malagarasi Lukanga
bull Endorheic wetlands and lakes
Chad Okavango Chilwa Rukwa
bull Man made riverine lakes
Kariba Cabora-Bassa Volta Nasser Kainji
bull Shallow lakes open drainage
George Edward Kyoga Malombe Mweru
bull Large deep lakes Tanganyika Victoria Malawi Turkana etc Marine systems bull Upwelling areas Coastal East and Souther Africa
Mauretania Namibia bull Estuaries River mouths bull Tidal flats Banc drsquoAacuterguin bull Continental flats banks Coastal Mozambique Sofala bank bull Coral reefs Red Sea Coastal Islands Tanzania Kenya bull Seemounts bull Open ocean
Aquaculture amp Fisheries Group Wageningen University
2112011
17
Two important indicators
Catch
Effort
Fopt
C = fqB
Relation productivity amp number of fishermen
y = 30xR2 = 082
y = 26 xR2 = 08157
0
5
10
15
20
25
30
35
40
45
50
0 2 4 6 8 10 12 14 16
Density (fisherskm^2)
Cat
ch (
tKm
^2y
ear)
Malombe
Chilwa
MweruChiuta
Albert
Itezhi-tezhi
Edward
Bangweulu
Tanganyika
Nasser amp Kariba
Turkana Kivu
Malawi
Victoria 19702
Victoria 1990 Victoria 20024
Volta Kainji
Average annual catch rate for African fishers = 3 tonyear irrespective of system
Aquaculture amp Fisheries Group Wageningen University
2112011
18
Information needs towards indicators
Systems differ
in productivity
In variability in productivity
in species communities
in effort dynamics
Contextualising fishing patterns and outcome
Scaled indicators
Systems approach ndash sources catch variability
Physical forcing drivers Rainfall water level nutrient pulsing
Climate el Niňo cycles nutrient upwelling
Landuse runoff rainfall nutrient loading siltation habitat change
Ecological spatial heterogeneity
Fish communities species attributes
Exploitation fishery characteristics
(Co)management structure organisation goals
Aquaculture amp Fisheries Group Wageningen University
2112011
19
System approach ndash a theory
Physical environment
Ecosystems
Fish communities
Fishing techniques
Fisheries management
Economics
Administration
Env
ironm
ent
Ecosystem drivers ndash pulsed stable
Physical environment
Ecosystems
Fish communities
Fishing techniques
Fisheries management
Economics
Administration
Env
ironm
ent
Aquaculture amp Fisheries Group Wageningen University
2112011
20
Okavango ndash highly pulsed system
Fluctuating environment Unpredictable
Mortality = density independent high often catastrophic
Population = variable in time less than carrying capacity
Freshwater Lake MalawiVictoria ndash constant system
Stable environment predictable
Mortality density dependent low constant
Population size constant in time around carrying capacity
Aquaculture amp Fisheries Group Wageningen University
2112011
21
Marine Red River Estuary Variable Predictable
What are the dominant life history strategies
What are the dominant life history strategies
Marine Komodo Coral Reefs Highly Stable Predictable
Aquaculture amp Fisheries Group Wageningen University
2112011
22
Drivers ndash waterlevels ndash nutrient pulsing
Scale of variation
Time Process
decadal community
annual stocks
seasonal year class
Monthly industrial catch rate clupeids lake Tanganyika
1955 1960 1965 1970 1975 1980 1985 1990 1995
Year
0
1
2
3
4
5
6
7
8
x 1000 kgvessel
small
Drivers ndash wind stress ndash nutrient upwelling
decadal annual seasonal variation
Aquaculture amp Fisheries Group Wageningen University
2112011
23
Drivers ndash weather patterns ndash nutrient upwelling
Normal pattern
Effect=1-2 years signal clear Yes
El Nino pattern
Drivers Eutrophication Lake Victoria eutrophication through increase nutrient loading related to landuse
Aquaculture amp Fisheries Group Wageningen University
2112011
24
Assignment 1 Drivers Your situation
What type of system
stable ndash pulsed
What drivers are important climate wind waterlevel droughts upwelling eutrophication land
use change
What indicators needed for assessment
What datainformation is needed to monitor longterm developments
Who haswhere is this information available
Fish communities
Physical environment
Ecosystems
Fish communities
Fishing techniques
Fisheries management
Economics
Administration
Env
ironm
ent
Aquaculture amp Fisheries Group Wageningen University
2112011
25
A Lindeman pyramid illustrating
a fish community
Size
Biomass
The biomass-size distribution important indicators in both single species and community studies
A fish community
Fish communities ndash size biomass trophic groups
Size of individual fish
Competition
Predation
Detrivores Herbivores Zooplanktivores etc
Piscivores
Aquaculture amp Fisheries Group Wageningen University
2112011
26
Tilapia ndash Oreochromis mossmbicus detrivore
Small Clupeidae zooplanktivores
Lake Tanganyika
bull Limnothrissa miodon 17 cm (top)
bull Stolothrissa tanganicae 10 cm
Lake Mweru
bullMicrothrissa moeruensis 6cm
Aquaculture amp Fisheries Group Wageningen University
2112011
27
Small zooplankton ndash from eutrophic Tjeukemeer
Nile Perch from Lake Victoria Piscivore
Aquaculture amp Fisheries Group Wageningen University
2112011
28
Haplochromis Species From Nile Perch Stomachs
Lake Mweru ndash a fish community
Length (cm)
MolluscInsect
Cyprinidae (5)Cichlidae (3)Mormyridae (5)Bagridae (2)Mochokidae (3)TylochromisOreochromisClariidae (2)Serranochromis (2)HydrocynusSchilbeidae (2)AlestesOthers (50)
Molluscivore
MicrophytovorePiscivore
5 10 15 20 25 30 35 40 45 50 55 60 65 70 75 80 850
25
50
75
100
125
150
175
200
1970 - 1972
Aquaculture amp Fisheries Group Wageningen University
2112011
29
Size
Biomass
Multispecies fisheries Mweru ndash all sizes and trophic
levelshellip
hellip and all levels are fished
Assignment 2 Fish communities my situation
How many different species are there in the fishery
Which are most important
What biomass (large ndash medium small)
What maximum sizes (large ndash medium ndash small)
What trophic levels (piscivores herbivores benthivores)
What spaces (pelagic demersal migratory)
Draw the most important species into a biomass size spectrum
order them by maximum size trophic level and space (pelagics on top demersal on the bottom)
Aquaculture amp Fisheries Group Wageningen University
2112011
30
Physical environment
Ecosystems
Fish communities
Fishing techniques
Fisheries management
Economics
Administration
Env
ironm
ent
Fish species ndash resilience to fishing
Change in Fish Communities Fishing Environment
Size of individual fish
Competition
Predation
Detrivores Herbivores Zooplanktivores etc
Piscivores
Fishing pressure
Aquaculture amp Fisheries Group Wageningen University
2112011
31
Catch development in a multispecies fishery
Catch
Fishing effort
Fishing down process ndash example Oueme river
Succession of species
black disappeared lt1965
hatched seriously reduced
peak yields around 10000 ton in rsquo50rsquo60ies
Why are some species less resilient to fishing
Aquaculture amp Fisheries Group Wageningen University
2112011
32
time
N
Population growth
Logistic population growth dNdt=r0N(1NK)
K carrying capacity (Nmax)
r0 steepness of the increase
Life history strategies r and Kselected species
rselected species small shortlived high reproductive rates (sardines)
Rapid growth and development Early maturation many offspring with low survival rates Population size below carrying capacity Minimal parental careoffspring Use unpredictable or unstable habitats Abundance varies greatly in time and space Generalists limited niche or trophic specialisation Resources rarely limiting (no competition) Wide dispersal good colonisers rapid response to disturbance Selection for productivity
Anchovy Max age 3-4 years
r=43 Population doubling time lt15 months
Aquaculture amp Fisheries Group Wageningen University
2112011
33
Life history strategies r and Kselected species
Kselected species large longlived lower reproductive rates (sharks rays)
Slow growth long life span Fewer offspring with higher survival rates Population size operate near carrying capacity (K) Use more predictable or stable habitats Parental care is common Abundance stable over time Specialists efficient users of a particular environment (niche
specialist) Resources often become limiting competition Poor colonizers of new or empty habitats (no dispersal) Selection for efficiency (competitive ability)
Hammerhead sharkMax age 14 years
r=08 PDT = 45 ndash 14 years
Not the complete story fish are more plastichellip
Aquaculture amp Fisheries Group Wageningen University
2112011
34
Three basic life history strategiesGrowth
(population)
SurvivalFecundity
Opportunist strategist small shortliving early maturing fish asymp rselected
Periodic strategist high fecundity longer lifespan
Equilibrium strategist medium size some parental care few but larger offspring asymp Kselected
Winemiller and Rose 1992
King and McFarlane 2003
Intermediate strategist
Opportunistic strategist
Early maturing fish frequent reproduction extended spawning period rapid larval growth high population turnover rate (PB = Z = r) eg mosquito fish Marginal habitats (eg like terrestrialaquatic ecotone)
More common in tropical freshwaters
Rarely exploited (small size) otherwise no management needed but to protect founder populations
Aquaculture amp Fisheries Group Wageningen University
2112011
35
Equilibrium strategist
Large adult body size parental care behaviour
Tropical (stable) fresh waters coral reefs (K)
Density dependent processes and resource limitation
Management maintenance of a productive environment and a healthy adult stocks
Periodic strategist
Maximises age specific fecundity at the expense of juvenile survivorship
If favorable conditions for immatures = periodic synchronous reproduction in phase with periodicity of large numbers
of small offspring
Weak stock recruitment relationships
Management maintain a critical density of adults stocks Protect spawning season andor habitat
Aquaculture amp Fisheries Group Wageningen University
2112011
36
Fishbase species resilience to fishing pressure life
history
Three categories of species resilience to fishing Very lowlow ndash medium ndash high
Based on lifehistory characteristics reproduction feeding and spatial behavior
Through the effects of survival fecundity and growth
trophic position
migratory behaviour
See FishBase wwwfishbaseorg
Lake Mweru ndash Mormyrops anguilloides
Resilience Low
Minimum population doubling time = generation time 8 years
Life span 24 years
Max length 150 cm
Lengthage2at2maturity 65 cm 5 years
Trophic level 36
Migratory no
Intermediateperiodic
Aquaculture amp Fisheries Group Wageningen University
2112011
37
Lake Mweru Hydrocynus vittatus
Resilience Mediumlow
Generation time 3 years
Life span 11 years
Max length 105 cm FL
Lengthage2at2maturity 42 cm 2years
Trophic level 44
Migratory yes spawning migrations
Periodic
Lake Mweru Oreochromis mweruensis
Lake Mweru
Resilience High
Minimum population doubling time lt 15 months
Life span 11 years
Max length 40 cm
Lengthage2at2maturity 15 cm 1year
Trophic level 20
Migratory no
Intermediate opportunistc
Aquaculture amp Fisheries Group Wageningen University
2112011
38
Lake Mweru Microthrissa moeruensis
bull Z = PB ~ 5 ndash 7
Resilience High
Generation time 6 months
Life span 25 years
Max length 5 cm
Lengthage2at2first maturity 3 cm04 year
Trophic level 20 ndash 30
Migratory no
Lake MweruOpportunistic
Assignment 3 Resilience to fishing my situation
Use main species in the fishery in assignment 2 (choose at least three) What is their productivityresilience to fishing
What characteristics are used to assess thisbull Size longevity reproduction feeding spatial behaviour
What is the turnover time (PB = Z = r)
Use Fishbase to find out these characteristics What indicators
What datainformation is needed Who haswhere is this information available
Aquaculture amp Fisheries Group Wageningen University
2112011
39
Fishing pressure fish communities and system stability
Physical environment
Ecosystems
Fish communities
Fishing techniques
Fisheries management
Economics
Administration
Env
ironm
ent
Change in Fish Communities Fishing Environment
Size of individual fish
Competition
Predation
Detrivores Herbivores Zooplanktivores etc
Piscivores
Fishing pressure
Aquaculture amp Fisheries Group Wageningen University
2112011
40
Change in Fish Communities Fishing Environment
Piscivores
Size of individual fish
Competition
Predation
Detrivores Herbivores Zooplanktivores etc
Fishing pressure
driving force
Drivers climate wind waterlevel droughts upwelling eutrophication
Fish Communities ndash population regulation
Constant systems
Pulsed systems
Population regulation
nonselective catastrophic mortality
(environmentdominant)
selective mortality (predation competitiondominant)
environment determines prevailing mortality pattern
Aquaculture amp Fisheries Group Wageningen University
2112011
41
Most ecological processes and life history traits can be related to the prevailing mortality pattern
Life history and natural selection
0
20
40
60
80
100
0 1 2 3 4 5 6 7 8
Relative age (years)
Abu
ndan
ce (
N)
but large fish have more eggs
50 cm = 1 mill eggs 100 cm = 16 mill eggs
Age at 50 maturity
Young fish are supposed to die only a fraction will spawn
Aquaculture amp Fisheries Group Wageningen University
2112011
42
Fishing mortality
Age (years)
Inst
anta
neou
s ra
te o
f m
orta
lity
Predation mortality
From ICES (1997)
is almost exactly oppositeSelectivity predation versus fishing
Management promotes harvesting patterns that is opposite to what most fish stock are naturally adapted to
effort
Age and size structure changesunder selective fishing to younger and smaller individuals
A sign of fishing hellip
Aquaculture amp Fisheries Group Wageningen University
2112011
43
Median age-at-maturation of Northeast Arctic cod (Joslashrgensen 1990 Jorgensen et al 2007 Science Conover et al )
and this is what happens
Fishery induced evolution (nr species)
Maturity lower age (6)
Maturity lower size (7)
Reduced growth (6)
Increase fecundity (3)
Loss genetic div (3)
Leading to lower yields
Small
Random
Large
Increased mortality on
Mean individual weight at age after 4 generations
Evidence Size selection (Growth)
= genetic changes
After Conover and Munch 2002Atlantic silverside Menidia menidia max age=2 years R= PDT lt15 months r=58
Aquaculture amp Fisheries Group Wageningen University
2112011
44
Effect of sizeselective fishing (Yield)
Trends in average total weight harvested across multiple generations of size-selective exploitation
Mortality on
Size selective fishing with large mesh sizes on adults We are deliberately pushing stocks to genetically
stable smaller sizes
Small
Random
Large
The rK selection principle the effects of selective
fishing
Age (size)
Abu
ndan
ce (L
og N
)
Slope = total mortality rate Z = r
Increased juvenile mortality= K-selection
Increased adult mortality= r-selection
r-selection Unstable environment abiotic mortality ndash non-predictive non-selectiveK-selection Stable environment biotic mortality (predation) ndash predictive size selective
Aquaculture amp Fisheries Group Wageningen University
2112011
45
Abundance size spectra
Abu
ndan
ce
Size
The distribution of abundance by size follows regular patterns
slope steepens when large fish removed
phytoplankton
zooplankton
small fish
big fish
Year
1976 1978 1980 1982 1984 1986 1988 1990 1992 1994
Slo
pe
-10
-9
-8
-7
-6
-5
Rice amp Gislason (1996)
Trends in size-spectrum slopes of the North Sea
Fishing effects on community sizestructure
Aquaculture amp Fisheries Group Wageningen University
2112011
46
Question
How do you fish a multispecies community
Selective ndash Targeting large sizes with single gears
Unselective ndash Targeting all sizes with many gears
Multispecies community
How should it be harvested
What should be minimum mesh-size
Aquaculture amp Fisheries Group Wageningen University
2112011
47
Selective fishing will change the slope
Biomasssize distributions
Example from lake Kariba Zambiawhere fishers are using illegal smallmeshed nets
The system remains unchanged except everything is less
Kolding et al 2003
Parallel slopes only intercept lower
Aquaculture amp Fisheries Group Wageningen University
2112011
48
2
3
4
5
Tro
phic
leve
l
Pauly et al (1998)
Fishing down the food web
Example from Lake Volta Ghana
The whole fish community is targeted highly pulsed system
highly dynamic fishery (spatial temporal movements fishermen)
27 fishing methods
25 kgday
74 species utilized
All trophic levels utilized by combining gears with specific trophic profiles 1 2 3 4 5Trophic level
Gears in the fishery ( species sample size)
Van Zwieten et al 2008
Aquaculture amp Fisheries Group Wageningen University
2112011
49
Is nonselective fishing bad
There is no empirical evidence
On the contrary we know that selective fishing is bad but we still advocate it
But how do we impose gear mesh and size restrictions in a multispecies fishery
The optimum fishing pattern is un-selective How much
How
Is fishing down the food web bad
Where is the highest production
Sohellip what is the best fishing pattern
What if we fish everything
A non-selective harvesting pattern is ecosystem conserving
The system remains intact but everything is less
This means fishing down the food-web
Aquaculture amp Fisheries Group Wageningen University
2112011
50
Indicators ndash biomass size distribution
Size of individual fish
Biomass Unexploited Population = Blt40
Maximum length = Lmax10
Fishing pressure
Mean length exploited population = L5
Biomass Exploited Population = Bgt40
Mean length total= Lmean
Intercept = Iasd
Assignment 4 Fishing down my situation
Characterise your fishery Single species single gear ndash multigear
Specific target species ndash all species are targeted (multispecies)
Specific size ndash all sizes (quantify)
Is there a shift from large specimen to small
Is there a shift from large species ndash to small Is there a shift in trophic level
What information is needed What indicators
Where to get this information
Aquaculture amp Fisheries Group Wageningen University
2112011
51
Dynamics of fishing ndash stabilise catch variability
Physical environment
Ecosystems
Fish communities
Fishing techniques
Fisheries management
Economics
Administration
Env
ironm
ent
Diversity in methods ndash small units adaptive
Hook and line fisherman
Lake Jaba Nigeria
Trap fishermen
Lake Mweru Zambia
Aquaculture amp Fisheries Group Wageningen University
2112011
52
Labor intensive beach seining on demersals
Small fish common Chilimira seine small pelagics
Aquaculture amp Fisheries Group Wageningen University
2112011
53
Innovative Nkacha seine small demersals
Unevenly distributed ndash important gears lake Mweru
Aquaculture amp Fisheries Group Wageningen University
2112011
54
Highly mobile ndash movement fishermen Lake Malawi
movement one fisherman in 6 months
SE Arm of Lake Malawi
Characteristics of smallscale fisheries
Small units simple processing small scale trading
Methods diverse innovative labor intensive
Opportunistic adaptive
Large subsistence element (small fish)
Unevenly distributed highly mobile
Aquaculture amp Fisheries Group Wageningen University
2112011
55
Fishing mortality (F)
number of units
efficiency
Effort (f)
Catchability (q)Fishing mortality (F)
More of the same
Decreasing numbers = management
Better methods = Increasing efficiency
=development
So while we both lsquomanagersquo and lsquodeveloprsquo the fishing mortality stays the same
Uh
Tradeoffs Economic efficiency vs employment
opportunities
0
20
40
60
80
100
120
140
160
180
1945 1950 1955 1960 1965 1970 1975 1980 1985 1990 1995 2000 2005
Fish
erm
en (
1000
)
Cat
ch p
er
fishe
rman
(to
ns)
0
500000
1000000
1500000
2000000
2500000
3000000
3500000
4000000
Qua
ntity
(to
ns)
Quantity (tons) Fishermen (1000) Catch (tons) per fisherman
Total catch numbers of fishers amp catch per fisherman in the Norwegian fishery 1945-2005
Effort (f) decreases while CpUE increases because catchability (q = efficiency) increases
Aquaculture amp Fisheries Group Wageningen University
2112011
56
Assignment 5 Dynamics fishery ndash my situation
How has fishing effort developed over time In terms of numbers (fishermen boats)
In terms of gears bull Types
bull Active ndash passive methods
In terms of spatial distribution
In terms of trophic levels
What informationdata needed What indicators
Who haswhere is this information
Goal
Apply a systems approach to fishery information ndashdevise indicators System
bull Understand the role of environment and fishing as sources of population regulation (mortality)
Species Stocksbull Understand that different species have different resilience to fishing
bull Understand r K principle
Selectivity ndash Catch and effortbull Discuss the consequences of selective and unselective fishing on fish
communities
bull Understand the characteristics of small scale fisheries
Aquaculture amp Fisheries Group Wageningen University
2112011
57
Summary All species and systems ndash important sets of
indicators
Effort (numbers types)
Species (composition in catch)
Catch (by species total)
Catch per unit Effort (~relative biomass)
Length (in catch at maturity)
Drivers (as explanatory factor)
copy Wageningen UR
End hellipbeginning
Aquaculture amp Fisheries Group Wageningen University
2112011
58
Summary environment species resilience management Life history strategy Opportunistic Periodic Equilibrium Environment Temporally stochastic
with small-scale patches
Seasonal with large-scale patches
Stable with fine-scaled spatial variation
Demographic trade-off 1 age at maturity 2 fecundity 3 juvenile survivorship
low low low
high high low
high low high
Demographic character Maximise (re)colonising capability of habitats over small spatial scales
Maximise age-specific fecundity spreading of reproductive effort over many years andor large areas
Maximise juvenile survivorship in resource limited density-dependent environments
Life history traits - size - age at maturity - size at maturity - clutch size - egg size - larvalYOY growth - reproductive season - parental care
Small Early Small Small Small Rapid Long No
Large Delayed Mediumlarge Large Small Rapid Short No
Smallmedium Delayed Medium Small Large Slow Long Yes
- Maintain critical minimum spawning biomass
- Maintain appropriate age structure (including large specimen)
- Maintenance of adult stock
Primary management objectives
- Protection against large scale or chronic perturbations that eliminate key refugia in space and time
- Spatial refuges directed at adult stock (including spawning habitats and migration routes)
- Maintain integrity of adult habitat
Environment
Demographic trade-offs
Life history traits
Management objectives

Aquaculture amp Fisheries Group Wageningen University
2112011
10
Control of targeted sizes
Bio
mas
s
Length (Age)
Selectivity curve small hook
Selectivity curve large hook
Available biomass Available
biomass
Control of pressure reference level (MSY)
Cat
ch (
= Y
ield
)
Fishing pressure
Overexploited
Maximum Sustainable Yield
Aquaculture amp Fisheries Group Wageningen University
2112011
11
Fisheries management options
Input controls Ban of fishing techniques (q) Maximummin mesh size (q) Change in gear construction (q) Days at sea (f)
Reduce number of gears (f)
Closed areas (f)
Closed seasons (f)
Protection habitats (fq)
B
C F = fq
Output controls (C)
Total allowable catch (TAC)
Individual Transferable Quota (ITQ)
Target specific specieslengths
C = FB
That is all Any available or
conceivable regulation can be reduced to the two terms C and F with goals defined on B
All are through regulating fishing effort
BMSY SSBmin SSBpa Cf MSY
M
R
G
Biomass
F=fq
Nt
t
R
t
tage
Wt
t
Ft
tc
C
Statistical
CEDRS
trends assessment
adaptation
Analytical
Experimental
Research
CEDRS
assessment
predictions
f
q
+ sd
HolisticBlack box approach
Analytical approach
Fisheries science ndash information evaluation
Aquaculture amp Fisheries Group Wageningen University
2112011
12
Data needed for assessment general
Basic data from the fishery
CatchperUnit Effort (tonnes numbers)
Effort (numbers)
Length (cm)
Basic research data
Migration (tagging)
Spawning (recruitment maturity stages areas)
Age
Natural Mortality
Trade offs in multispecies communities ndash no free lunch
MMSY =
Target LimitStay clear off
Aquaculture amp Fisheries Group Wageningen University
2112011
13
Goals data collection needs linkages
Production planning trade Catch Input ndash labor vessels No link
Fisheries management Catch and effort linked By commercial species
Conservation Catch and effort linked Selectivity All species Habitats ecosystems
Increase in
- Resolution
- Linked data
- Costs
Ecosystem based management
Ecosystem based management What is that
Change in information base Fisheries Science = heavy investment in population dynamics Ecosystem = interaction between organisms with each other
and the physical environment New questions arise on habitats and nontarget organisms
Not clear how the fisheries ldquohowrdquo and ldquohow muchrdquo questions can be dealt with Focus on more generic measures as MPArsquos (keeping a bank)
Focus on clarity of information for all involved what info is needed
Aquaculture amp Fisheries Group Wageningen University
2112011
14
Biomass
Models ndash Indicators references and the long view
Fishing mortality = CB
Recruitment
Growth
Natural mortality
Indicator approaches ndash system stakeholder
Size of fish
Biomas s
Fishing
Nutrients
Pressure
Driver
State
Size of fish
Biomas s
Fishing
Nutrients
Pressure
Driver
State
Aquaculture amp Fisheries Group Wageningen University
2112011
15
Indicator approaches ndash system stakeholder
Size of fish
B
io
ma
s s
Fishing
Nutrients
Pressure
Driver
State
Size of fish
B
io
ma
s s
Fishing
Nutrients
Pressure
Driver
State
Fishers Managers
Greens TradersSupermarkets general
public
DataInformationKnowledge
Role of science
Part 2 a system approach
Aquaculture amp Fisheries Group Wageningen University
2112011
16
Goal
Apply a systems approach to fishery information ndashdevising indicators System
bull Understand the role of environment and fishing as sources of population regulation (mortality)
Species Stocksbull Understand that different species have different resilience to fishing
Selectivity ndash Catch and effortbull Understand consequences of (un)selective fishing on fish communities
bull Understand the characteristics of small scale fisheries
bull Understand the potential (and drive) to stabilise catches
Africa diversity of freshwater and marine systemsFreshwaters bull Rivers Nile Orange Congo Zambezi etc
bull River floodplains Niger Congo Zambezi Kafue Pongolo etc
bull Exorheic swamps Sudd Bangweulu Kamulondo Cuvette Centrale Luapula Shire Malagarasi Lukanga
bull Endorheic wetlands and lakes
Chad Okavango Chilwa Rukwa
bull Man made riverine lakes
Kariba Cabora-Bassa Volta Nasser Kainji
bull Shallow lakes open drainage
George Edward Kyoga Malombe Mweru
bull Large deep lakes Tanganyika Victoria Malawi Turkana etc Marine systems bull Upwelling areas Coastal East and Souther Africa
Mauretania Namibia bull Estuaries River mouths bull Tidal flats Banc drsquoAacuterguin bull Continental flats banks Coastal Mozambique Sofala bank bull Coral reefs Red Sea Coastal Islands Tanzania Kenya bull Seemounts bull Open ocean
Aquaculture amp Fisheries Group Wageningen University
2112011
17
Two important indicators
Catch
Effort
Fopt
C = fqB
Relation productivity amp number of fishermen
y = 30xR2 = 082
y = 26 xR2 = 08157
0
5
10
15
20
25
30
35
40
45
50
0 2 4 6 8 10 12 14 16
Density (fisherskm^2)
Cat
ch (
tKm
^2y
ear)
Malombe
Chilwa
MweruChiuta
Albert
Itezhi-tezhi
Edward
Bangweulu
Tanganyika
Nasser amp Kariba
Turkana Kivu
Malawi
Victoria 19702
Victoria 1990 Victoria 20024
Volta Kainji
Average annual catch rate for African fishers = 3 tonyear irrespective of system
Aquaculture amp Fisheries Group Wageningen University
2112011
18
Information needs towards indicators
Systems differ
in productivity
In variability in productivity
in species communities
in effort dynamics
Contextualising fishing patterns and outcome
Scaled indicators
Systems approach ndash sources catch variability
Physical forcing drivers Rainfall water level nutrient pulsing
Climate el Niňo cycles nutrient upwelling
Landuse runoff rainfall nutrient loading siltation habitat change
Ecological spatial heterogeneity
Fish communities species attributes
Exploitation fishery characteristics
(Co)management structure organisation goals
Aquaculture amp Fisheries Group Wageningen University
2112011
19
System approach ndash a theory
Physical environment
Ecosystems
Fish communities
Fishing techniques
Fisheries management
Economics
Administration
Env
ironm
ent
Ecosystem drivers ndash pulsed stable
Physical environment
Ecosystems
Fish communities
Fishing techniques
Fisheries management
Economics
Administration
Env
ironm
ent
Aquaculture amp Fisheries Group Wageningen University
2112011
20
Okavango ndash highly pulsed system
Fluctuating environment Unpredictable
Mortality = density independent high often catastrophic
Population = variable in time less than carrying capacity
Freshwater Lake MalawiVictoria ndash constant system
Stable environment predictable
Mortality density dependent low constant
Population size constant in time around carrying capacity
Aquaculture amp Fisheries Group Wageningen University
2112011
21
Marine Red River Estuary Variable Predictable
What are the dominant life history strategies
What are the dominant life history strategies
Marine Komodo Coral Reefs Highly Stable Predictable
Aquaculture amp Fisheries Group Wageningen University
2112011
22
Drivers ndash waterlevels ndash nutrient pulsing
Scale of variation
Time Process
decadal community
annual stocks
seasonal year class
Monthly industrial catch rate clupeids lake Tanganyika
1955 1960 1965 1970 1975 1980 1985 1990 1995
Year
0
1
2
3
4
5
6
7
8
x 1000 kgvessel
small
Drivers ndash wind stress ndash nutrient upwelling
decadal annual seasonal variation
Aquaculture amp Fisheries Group Wageningen University
2112011
23
Drivers ndash weather patterns ndash nutrient upwelling
Normal pattern
Effect=1-2 years signal clear Yes
El Nino pattern
Drivers Eutrophication Lake Victoria eutrophication through increase nutrient loading related to landuse
Aquaculture amp Fisheries Group Wageningen University
2112011
24
Assignment 1 Drivers Your situation
What type of system
stable ndash pulsed
What drivers are important climate wind waterlevel droughts upwelling eutrophication land
use change
What indicators needed for assessment
What datainformation is needed to monitor longterm developments
Who haswhere is this information available
Fish communities
Physical environment
Ecosystems
Fish communities
Fishing techniques
Fisheries management
Economics
Administration
Env
ironm
ent
Aquaculture amp Fisheries Group Wageningen University
2112011
25
A Lindeman pyramid illustrating
a fish community
Size
Biomass
The biomass-size distribution important indicators in both single species and community studies
A fish community
Fish communities ndash size biomass trophic groups
Size of individual fish
Competition
Predation
Detrivores Herbivores Zooplanktivores etc
Piscivores
Aquaculture amp Fisheries Group Wageningen University
2112011
26
Tilapia ndash Oreochromis mossmbicus detrivore
Small Clupeidae zooplanktivores
Lake Tanganyika
bull Limnothrissa miodon 17 cm (top)
bull Stolothrissa tanganicae 10 cm
Lake Mweru
bullMicrothrissa moeruensis 6cm
Aquaculture amp Fisheries Group Wageningen University
2112011
27
Small zooplankton ndash from eutrophic Tjeukemeer
Nile Perch from Lake Victoria Piscivore
Aquaculture amp Fisheries Group Wageningen University
2112011
28
Haplochromis Species From Nile Perch Stomachs
Lake Mweru ndash a fish community
Length (cm)
MolluscInsect
Cyprinidae (5)Cichlidae (3)Mormyridae (5)Bagridae (2)Mochokidae (3)TylochromisOreochromisClariidae (2)Serranochromis (2)HydrocynusSchilbeidae (2)AlestesOthers (50)
Molluscivore
MicrophytovorePiscivore
5 10 15 20 25 30 35 40 45 50 55 60 65 70 75 80 850
25
50
75
100
125
150
175
200
1970 - 1972
Aquaculture amp Fisheries Group Wageningen University
2112011
29
Size
Biomass
Multispecies fisheries Mweru ndash all sizes and trophic
levelshellip
hellip and all levels are fished
Assignment 2 Fish communities my situation
How many different species are there in the fishery
Which are most important
What biomass (large ndash medium small)
What maximum sizes (large ndash medium ndash small)
What trophic levels (piscivores herbivores benthivores)
What spaces (pelagic demersal migratory)
Draw the most important species into a biomass size spectrum
order them by maximum size trophic level and space (pelagics on top demersal on the bottom)
Aquaculture amp Fisheries Group Wageningen University
2112011
30
Physical environment
Ecosystems
Fish communities
Fishing techniques
Fisheries management
Economics
Administration
Env
ironm
ent
Fish species ndash resilience to fishing
Change in Fish Communities Fishing Environment
Size of individual fish
Competition
Predation
Detrivores Herbivores Zooplanktivores etc
Piscivores
Fishing pressure
Aquaculture amp Fisheries Group Wageningen University
2112011
31
Catch development in a multispecies fishery
Catch
Fishing effort
Fishing down process ndash example Oueme river
Succession of species
black disappeared lt1965
hatched seriously reduced
peak yields around 10000 ton in rsquo50rsquo60ies
Why are some species less resilient to fishing
Aquaculture amp Fisheries Group Wageningen University
2112011
32
time
N
Population growth
Logistic population growth dNdt=r0N(1NK)
K carrying capacity (Nmax)
r0 steepness of the increase
Life history strategies r and Kselected species
rselected species small shortlived high reproductive rates (sardines)
Rapid growth and development Early maturation many offspring with low survival rates Population size below carrying capacity Minimal parental careoffspring Use unpredictable or unstable habitats Abundance varies greatly in time and space Generalists limited niche or trophic specialisation Resources rarely limiting (no competition) Wide dispersal good colonisers rapid response to disturbance Selection for productivity
Anchovy Max age 3-4 years
r=43 Population doubling time lt15 months
Aquaculture amp Fisheries Group Wageningen University
2112011
33
Life history strategies r and Kselected species
Kselected species large longlived lower reproductive rates (sharks rays)
Slow growth long life span Fewer offspring with higher survival rates Population size operate near carrying capacity (K) Use more predictable or stable habitats Parental care is common Abundance stable over time Specialists efficient users of a particular environment (niche
specialist) Resources often become limiting competition Poor colonizers of new or empty habitats (no dispersal) Selection for efficiency (competitive ability)
Hammerhead sharkMax age 14 years
r=08 PDT = 45 ndash 14 years
Not the complete story fish are more plastichellip
Aquaculture amp Fisheries Group Wageningen University
2112011
34
Three basic life history strategiesGrowth
(population)
SurvivalFecundity
Opportunist strategist small shortliving early maturing fish asymp rselected
Periodic strategist high fecundity longer lifespan
Equilibrium strategist medium size some parental care few but larger offspring asymp Kselected
Winemiller and Rose 1992
King and McFarlane 2003
Intermediate strategist
Opportunistic strategist
Early maturing fish frequent reproduction extended spawning period rapid larval growth high population turnover rate (PB = Z = r) eg mosquito fish Marginal habitats (eg like terrestrialaquatic ecotone)
More common in tropical freshwaters
Rarely exploited (small size) otherwise no management needed but to protect founder populations
Aquaculture amp Fisheries Group Wageningen University
2112011
35
Equilibrium strategist
Large adult body size parental care behaviour
Tropical (stable) fresh waters coral reefs (K)
Density dependent processes and resource limitation
Management maintenance of a productive environment and a healthy adult stocks
Periodic strategist
Maximises age specific fecundity at the expense of juvenile survivorship
If favorable conditions for immatures = periodic synchronous reproduction in phase with periodicity of large numbers
of small offspring
Weak stock recruitment relationships
Management maintain a critical density of adults stocks Protect spawning season andor habitat
Aquaculture amp Fisheries Group Wageningen University
2112011
36
Fishbase species resilience to fishing pressure life
history
Three categories of species resilience to fishing Very lowlow ndash medium ndash high
Based on lifehistory characteristics reproduction feeding and spatial behavior
Through the effects of survival fecundity and growth
trophic position
migratory behaviour
See FishBase wwwfishbaseorg
Lake Mweru ndash Mormyrops anguilloides
Resilience Low
Minimum population doubling time = generation time 8 years
Life span 24 years
Max length 150 cm
Lengthage2at2maturity 65 cm 5 years
Trophic level 36
Migratory no
Intermediateperiodic
Aquaculture amp Fisheries Group Wageningen University
2112011
37
Lake Mweru Hydrocynus vittatus
Resilience Mediumlow
Generation time 3 years
Life span 11 years
Max length 105 cm FL
Lengthage2at2maturity 42 cm 2years
Trophic level 44
Migratory yes spawning migrations
Periodic
Lake Mweru Oreochromis mweruensis
Lake Mweru
Resilience High
Minimum population doubling time lt 15 months
Life span 11 years
Max length 40 cm
Lengthage2at2maturity 15 cm 1year
Trophic level 20
Migratory no
Intermediate opportunistc
Aquaculture amp Fisheries Group Wageningen University
2112011
38
Lake Mweru Microthrissa moeruensis
bull Z = PB ~ 5 ndash 7
Resilience High
Generation time 6 months
Life span 25 years
Max length 5 cm
Lengthage2at2first maturity 3 cm04 year
Trophic level 20 ndash 30
Migratory no
Lake MweruOpportunistic
Assignment 3 Resilience to fishing my situation
Use main species in the fishery in assignment 2 (choose at least three) What is their productivityresilience to fishing
What characteristics are used to assess thisbull Size longevity reproduction feeding spatial behaviour
What is the turnover time (PB = Z = r)
Use Fishbase to find out these characteristics What indicators
What datainformation is needed Who haswhere is this information available
Aquaculture amp Fisheries Group Wageningen University
2112011
39
Fishing pressure fish communities and system stability
Physical environment
Ecosystems
Fish communities
Fishing techniques
Fisheries management
Economics
Administration
Env
ironm
ent
Change in Fish Communities Fishing Environment
Size of individual fish
Competition
Predation
Detrivores Herbivores Zooplanktivores etc
Piscivores
Fishing pressure
Aquaculture amp Fisheries Group Wageningen University
2112011
40
Change in Fish Communities Fishing Environment
Piscivores
Size of individual fish
Competition
Predation
Detrivores Herbivores Zooplanktivores etc
Fishing pressure
driving force
Drivers climate wind waterlevel droughts upwelling eutrophication
Fish Communities ndash population regulation
Constant systems
Pulsed systems
Population regulation
nonselective catastrophic mortality
(environmentdominant)
selective mortality (predation competitiondominant)
environment determines prevailing mortality pattern
Aquaculture amp Fisheries Group Wageningen University
2112011
41
Most ecological processes and life history traits can be related to the prevailing mortality pattern
Life history and natural selection
0
20
40
60
80
100
0 1 2 3 4 5 6 7 8
Relative age (years)
Abu
ndan
ce (
N)
but large fish have more eggs
50 cm = 1 mill eggs 100 cm = 16 mill eggs
Age at 50 maturity
Young fish are supposed to die only a fraction will spawn
Aquaculture amp Fisheries Group Wageningen University
2112011
42
Fishing mortality
Age (years)
Inst
anta
neou
s ra
te o
f m
orta
lity
Predation mortality
From ICES (1997)
is almost exactly oppositeSelectivity predation versus fishing
Management promotes harvesting patterns that is opposite to what most fish stock are naturally adapted to
effort
Age and size structure changesunder selective fishing to younger and smaller individuals
A sign of fishing hellip
Aquaculture amp Fisheries Group Wageningen University
2112011
43
Median age-at-maturation of Northeast Arctic cod (Joslashrgensen 1990 Jorgensen et al 2007 Science Conover et al )
and this is what happens
Fishery induced evolution (nr species)
Maturity lower age (6)
Maturity lower size (7)
Reduced growth (6)
Increase fecundity (3)
Loss genetic div (3)
Leading to lower yields
Small
Random
Large
Increased mortality on
Mean individual weight at age after 4 generations
Evidence Size selection (Growth)
= genetic changes
After Conover and Munch 2002Atlantic silverside Menidia menidia max age=2 years R= PDT lt15 months r=58
Aquaculture amp Fisheries Group Wageningen University
2112011
44
Effect of sizeselective fishing (Yield)
Trends in average total weight harvested across multiple generations of size-selective exploitation
Mortality on
Size selective fishing with large mesh sizes on adults We are deliberately pushing stocks to genetically
stable smaller sizes
Small
Random
Large
The rK selection principle the effects of selective
fishing
Age (size)
Abu
ndan
ce (L
og N
)
Slope = total mortality rate Z = r
Increased juvenile mortality= K-selection
Increased adult mortality= r-selection
r-selection Unstable environment abiotic mortality ndash non-predictive non-selectiveK-selection Stable environment biotic mortality (predation) ndash predictive size selective
Aquaculture amp Fisheries Group Wageningen University
2112011
45
Abundance size spectra
Abu
ndan
ce
Size
The distribution of abundance by size follows regular patterns
slope steepens when large fish removed
phytoplankton
zooplankton
small fish
big fish
Year
1976 1978 1980 1982 1984 1986 1988 1990 1992 1994
Slo
pe
-10
-9
-8
-7
-6
-5
Rice amp Gislason (1996)
Trends in size-spectrum slopes of the North Sea
Fishing effects on community sizestructure
Aquaculture amp Fisheries Group Wageningen University
2112011
46
Question
How do you fish a multispecies community
Selective ndash Targeting large sizes with single gears
Unselective ndash Targeting all sizes with many gears
Multispecies community
How should it be harvested
What should be minimum mesh-size
Aquaculture amp Fisheries Group Wageningen University
2112011
47
Selective fishing will change the slope
Biomasssize distributions
Example from lake Kariba Zambiawhere fishers are using illegal smallmeshed nets
The system remains unchanged except everything is less
Kolding et al 2003
Parallel slopes only intercept lower
Aquaculture amp Fisheries Group Wageningen University
2112011
48
2
3
4
5
Tro
phic
leve
l
Pauly et al (1998)
Fishing down the food web
Example from Lake Volta Ghana
The whole fish community is targeted highly pulsed system
highly dynamic fishery (spatial temporal movements fishermen)
27 fishing methods
25 kgday
74 species utilized
All trophic levels utilized by combining gears with specific trophic profiles 1 2 3 4 5Trophic level
Gears in the fishery ( species sample size)
Van Zwieten et al 2008
Aquaculture amp Fisheries Group Wageningen University
2112011
49
Is nonselective fishing bad
There is no empirical evidence
On the contrary we know that selective fishing is bad but we still advocate it
But how do we impose gear mesh and size restrictions in a multispecies fishery
The optimum fishing pattern is un-selective How much
How
Is fishing down the food web bad
Where is the highest production
Sohellip what is the best fishing pattern
What if we fish everything
A non-selective harvesting pattern is ecosystem conserving
The system remains intact but everything is less
This means fishing down the food-web
Aquaculture amp Fisheries Group Wageningen University
2112011
50
Indicators ndash biomass size distribution
Size of individual fish
Biomass Unexploited Population = Blt40
Maximum length = Lmax10
Fishing pressure
Mean length exploited population = L5
Biomass Exploited Population = Bgt40
Mean length total= Lmean
Intercept = Iasd
Assignment 4 Fishing down my situation
Characterise your fishery Single species single gear ndash multigear
Specific target species ndash all species are targeted (multispecies)
Specific size ndash all sizes (quantify)
Is there a shift from large specimen to small
Is there a shift from large species ndash to small Is there a shift in trophic level
What information is needed What indicators
Where to get this information
Aquaculture amp Fisheries Group Wageningen University
2112011
51
Dynamics of fishing ndash stabilise catch variability
Physical environment
Ecosystems
Fish communities
Fishing techniques
Fisheries management
Economics
Administration
Env
ironm
ent
Diversity in methods ndash small units adaptive
Hook and line fisherman
Lake Jaba Nigeria
Trap fishermen
Lake Mweru Zambia
Aquaculture amp Fisheries Group Wageningen University
2112011
52
Labor intensive beach seining on demersals
Small fish common Chilimira seine small pelagics
Aquaculture amp Fisheries Group Wageningen University
2112011
53
Innovative Nkacha seine small demersals
Unevenly distributed ndash important gears lake Mweru
Aquaculture amp Fisheries Group Wageningen University
2112011
54
Highly mobile ndash movement fishermen Lake Malawi
movement one fisherman in 6 months
SE Arm of Lake Malawi
Characteristics of smallscale fisheries
Small units simple processing small scale trading
Methods diverse innovative labor intensive
Opportunistic adaptive
Large subsistence element (small fish)
Unevenly distributed highly mobile
Aquaculture amp Fisheries Group Wageningen University
2112011
55
Fishing mortality (F)
number of units
efficiency
Effort (f)
Catchability (q)Fishing mortality (F)
More of the same
Decreasing numbers = management
Better methods = Increasing efficiency
=development
So while we both lsquomanagersquo and lsquodeveloprsquo the fishing mortality stays the same
Uh
Tradeoffs Economic efficiency vs employment
opportunities
0
20
40
60
80
100
120
140
160
180
1945 1950 1955 1960 1965 1970 1975 1980 1985 1990 1995 2000 2005
Fish
erm
en (
1000
)
Cat
ch p
er
fishe
rman
(to
ns)
0
500000
1000000
1500000
2000000
2500000
3000000
3500000
4000000
Qua
ntity
(to
ns)
Quantity (tons) Fishermen (1000) Catch (tons) per fisherman
Total catch numbers of fishers amp catch per fisherman in the Norwegian fishery 1945-2005
Effort (f) decreases while CpUE increases because catchability (q = efficiency) increases
Aquaculture amp Fisheries Group Wageningen University
2112011
56
Assignment 5 Dynamics fishery ndash my situation
How has fishing effort developed over time In terms of numbers (fishermen boats)
In terms of gears bull Types
bull Active ndash passive methods
In terms of spatial distribution
In terms of trophic levels
What informationdata needed What indicators
Who haswhere is this information
Goal
Apply a systems approach to fishery information ndashdevise indicators System
bull Understand the role of environment and fishing as sources of population regulation (mortality)
Species Stocksbull Understand that different species have different resilience to fishing
bull Understand r K principle
Selectivity ndash Catch and effortbull Discuss the consequences of selective and unselective fishing on fish
communities
bull Understand the characteristics of small scale fisheries
Aquaculture amp Fisheries Group Wageningen University
2112011
57
Summary All species and systems ndash important sets of
indicators
Effort (numbers types)
Species (composition in catch)
Catch (by species total)
Catch per unit Effort (~relative biomass)
Length (in catch at maturity)
Drivers (as explanatory factor)
copy Wageningen UR
End hellipbeginning
Aquaculture amp Fisheries Group Wageningen University
2112011
58
Summary environment species resilience management Life history strategy Opportunistic Periodic Equilibrium Environment Temporally stochastic
with small-scale patches
Seasonal with large-scale patches
Stable with fine-scaled spatial variation
Demographic trade-off 1 age at maturity 2 fecundity 3 juvenile survivorship
low low low
high high low
high low high
Demographic character Maximise (re)colonising capability of habitats over small spatial scales
Maximise age-specific fecundity spreading of reproductive effort over many years andor large areas
Maximise juvenile survivorship in resource limited density-dependent environments
Life history traits - size - age at maturity - size at maturity - clutch size - egg size - larvalYOY growth - reproductive season - parental care
Small Early Small Small Small Rapid Long No
Large Delayed Mediumlarge Large Small Rapid Short No
Smallmedium Delayed Medium Small Large Slow Long Yes
- Maintain critical minimum spawning biomass
- Maintain appropriate age structure (including large specimen)
- Maintenance of adult stock
Primary management objectives
- Protection against large scale or chronic perturbations that eliminate key refugia in space and time
- Spatial refuges directed at adult stock (including spawning habitats and migration routes)
- Maintain integrity of adult habitat
Environment
Demographic trade-offs
Life history traits
Management objectives

Aquaculture amp Fisheries Group Wageningen University
2112011
14
Biomass
Models ndash Indicators references and the long view
Fishing mortality = CB
Recruitment
Growth
Natural mortality
Indicator approaches ndash system stakeholder
Size of fish
Biomas s
Fishing
Nutrients
Pressure
Driver
State
Size of fish
Biomas s
Fishing
Nutrients
Pressure
Driver
State
Aquaculture amp Fisheries Group Wageningen University
2112011
15
Indicator approaches ndash system stakeholder
Size of fish
B
io
ma
s s
Fishing
Nutrients
Pressure
Driver
State
Size of fish
B
io
ma
s s
Fishing
Nutrients
Pressure
Driver
State
Fishers Managers
Greens TradersSupermarkets general
public
DataInformationKnowledge
Role of science
Part 2 a system approach
Aquaculture amp Fisheries Group Wageningen University
2112011
16
Goal
Apply a systems approach to fishery information ndashdevising indicators System
bull Understand the role of environment and fishing as sources of population regulation (mortality)
Species Stocksbull Understand that different species have different resilience to fishing
Selectivity ndash Catch and effortbull Understand consequences of (un)selective fishing on fish communities
bull Understand the characteristics of small scale fisheries
bull Understand the potential (and drive) to stabilise catches
Africa diversity of freshwater and marine systemsFreshwaters bull Rivers Nile Orange Congo Zambezi etc
bull River floodplains Niger Congo Zambezi Kafue Pongolo etc
bull Exorheic swamps Sudd Bangweulu Kamulondo Cuvette Centrale Luapula Shire Malagarasi Lukanga
bull Endorheic wetlands and lakes
Chad Okavango Chilwa Rukwa
bull Man made riverine lakes
Kariba Cabora-Bassa Volta Nasser Kainji
bull Shallow lakes open drainage
George Edward Kyoga Malombe Mweru
bull Large deep lakes Tanganyika Victoria Malawi Turkana etc Marine systems bull Upwelling areas Coastal East and Souther Africa
Mauretania Namibia bull Estuaries River mouths bull Tidal flats Banc drsquoAacuterguin bull Continental flats banks Coastal Mozambique Sofala bank bull Coral reefs Red Sea Coastal Islands Tanzania Kenya bull Seemounts bull Open ocean
Aquaculture amp Fisheries Group Wageningen University
2112011
17
Two important indicators
Catch
Effort
Fopt
C = fqB
Relation productivity amp number of fishermen
y = 30xR2 = 082
y = 26 xR2 = 08157
0
5
10
15
20
25
30
35
40
45
50
0 2 4 6 8 10 12 14 16
Density (fisherskm^2)
Cat
ch (
tKm
^2y
ear)
Malombe
Chilwa
MweruChiuta
Albert
Itezhi-tezhi
Edward
Bangweulu
Tanganyika
Nasser amp Kariba
Turkana Kivu
Malawi
Victoria 19702
Victoria 1990 Victoria 20024
Volta Kainji
Average annual catch rate for African fishers = 3 tonyear irrespective of system
Aquaculture amp Fisheries Group Wageningen University
2112011
18
Information needs towards indicators
Systems differ
in productivity
In variability in productivity
in species communities
in effort dynamics
Contextualising fishing patterns and outcome
Scaled indicators
Systems approach ndash sources catch variability
Physical forcing drivers Rainfall water level nutrient pulsing
Climate el Niňo cycles nutrient upwelling
Landuse runoff rainfall nutrient loading siltation habitat change
Ecological spatial heterogeneity
Fish communities species attributes
Exploitation fishery characteristics
(Co)management structure organisation goals
Aquaculture amp Fisheries Group Wageningen University
2112011
19
System approach ndash a theory
Physical environment
Ecosystems
Fish communities
Fishing techniques
Fisheries management
Economics
Administration
Env
ironm
ent
Ecosystem drivers ndash pulsed stable
Physical environment
Ecosystems
Fish communities
Fishing techniques
Fisheries management
Economics
Administration
Env
ironm
ent
Aquaculture amp Fisheries Group Wageningen University
2112011
20
Okavango ndash highly pulsed system
Fluctuating environment Unpredictable
Mortality = density independent high often catastrophic
Population = variable in time less than carrying capacity
Freshwater Lake MalawiVictoria ndash constant system
Stable environment predictable
Mortality density dependent low constant
Population size constant in time around carrying capacity
Aquaculture amp Fisheries Group Wageningen University
2112011
21
Marine Red River Estuary Variable Predictable
What are the dominant life history strategies
What are the dominant life history strategies
Marine Komodo Coral Reefs Highly Stable Predictable
Aquaculture amp Fisheries Group Wageningen University
2112011
22
Drivers ndash waterlevels ndash nutrient pulsing
Scale of variation
Time Process
decadal community
annual stocks
seasonal year class
Monthly industrial catch rate clupeids lake Tanganyika
1955 1960 1965 1970 1975 1980 1985 1990 1995
Year
0
1
2
3
4
5
6
7
8
x 1000 kgvessel
small
Drivers ndash wind stress ndash nutrient upwelling
decadal annual seasonal variation
Aquaculture amp Fisheries Group Wageningen University
2112011
23
Drivers ndash weather patterns ndash nutrient upwelling
Normal pattern
Effect=1-2 years signal clear Yes
El Nino pattern
Drivers Eutrophication Lake Victoria eutrophication through increase nutrient loading related to landuse
Aquaculture amp Fisheries Group Wageningen University
2112011
24
Assignment 1 Drivers Your situation
What type of system
stable ndash pulsed
What drivers are important climate wind waterlevel droughts upwelling eutrophication land
use change
What indicators needed for assessment
What datainformation is needed to monitor longterm developments
Who haswhere is this information available
Fish communities
Physical environment
Ecosystems
Fish communities
Fishing techniques
Fisheries management
Economics
Administration
Env
ironm
ent
Aquaculture amp Fisheries Group Wageningen University
2112011
25
A Lindeman pyramid illustrating
a fish community
Size
Biomass
The biomass-size distribution important indicators in both single species and community studies
A fish community
Fish communities ndash size biomass trophic groups
Size of individual fish
Competition
Predation
Detrivores Herbivores Zooplanktivores etc
Piscivores
Aquaculture amp Fisheries Group Wageningen University
2112011
26
Tilapia ndash Oreochromis mossmbicus detrivore
Small Clupeidae zooplanktivores
Lake Tanganyika
bull Limnothrissa miodon 17 cm (top)
bull Stolothrissa tanganicae 10 cm
Lake Mweru
bullMicrothrissa moeruensis 6cm
Aquaculture amp Fisheries Group Wageningen University
2112011
27
Small zooplankton ndash from eutrophic Tjeukemeer
Nile Perch from Lake Victoria Piscivore
Aquaculture amp Fisheries Group Wageningen University
2112011
28
Haplochromis Species From Nile Perch Stomachs
Lake Mweru ndash a fish community
Length (cm)
MolluscInsect
Cyprinidae (5)Cichlidae (3)Mormyridae (5)Bagridae (2)Mochokidae (3)TylochromisOreochromisClariidae (2)Serranochromis (2)HydrocynusSchilbeidae (2)AlestesOthers (50)
Molluscivore
MicrophytovorePiscivore
5 10 15 20 25 30 35 40 45 50 55 60 65 70 75 80 850
25
50
75
100
125
150
175
200
1970 - 1972
Aquaculture amp Fisheries Group Wageningen University
2112011
29
Size
Biomass
Multispecies fisheries Mweru ndash all sizes and trophic
levelshellip
hellip and all levels are fished
Assignment 2 Fish communities my situation
How many different species are there in the fishery
Which are most important
What biomass (large ndash medium small)
What maximum sizes (large ndash medium ndash small)
What trophic levels (piscivores herbivores benthivores)
What spaces (pelagic demersal migratory)
Draw the most important species into a biomass size spectrum
order them by maximum size trophic level and space (pelagics on top demersal on the bottom)
Aquaculture amp Fisheries Group Wageningen University
2112011
30
Physical environment
Ecosystems
Fish communities
Fishing techniques
Fisheries management
Economics
Administration
Env
ironm
ent
Fish species ndash resilience to fishing
Change in Fish Communities Fishing Environment
Size of individual fish
Competition
Predation
Detrivores Herbivores Zooplanktivores etc
Piscivores
Fishing pressure
Aquaculture amp Fisheries Group Wageningen University
2112011
31
Catch development in a multispecies fishery
Catch
Fishing effort
Fishing down process ndash example Oueme river
Succession of species
black disappeared lt1965
hatched seriously reduced
peak yields around 10000 ton in rsquo50rsquo60ies
Why are some species less resilient to fishing
Aquaculture amp Fisheries Group Wageningen University
2112011
32
time
N
Population growth
Logistic population growth dNdt=r0N(1NK)
K carrying capacity (Nmax)
r0 steepness of the increase
Life history strategies r and Kselected species
rselected species small shortlived high reproductive rates (sardines)
Rapid growth and development Early maturation many offspring with low survival rates Population size below carrying capacity Minimal parental careoffspring Use unpredictable or unstable habitats Abundance varies greatly in time and space Generalists limited niche or trophic specialisation Resources rarely limiting (no competition) Wide dispersal good colonisers rapid response to disturbance Selection for productivity
Anchovy Max age 3-4 years
r=43 Population doubling time lt15 months
Aquaculture amp Fisheries Group Wageningen University
2112011
33
Life history strategies r and Kselected species
Kselected species large longlived lower reproductive rates (sharks rays)
Slow growth long life span Fewer offspring with higher survival rates Population size operate near carrying capacity (K) Use more predictable or stable habitats Parental care is common Abundance stable over time Specialists efficient users of a particular environment (niche
specialist) Resources often become limiting competition Poor colonizers of new or empty habitats (no dispersal) Selection for efficiency (competitive ability)
Hammerhead sharkMax age 14 years
r=08 PDT = 45 ndash 14 years
Not the complete story fish are more plastichellip
Aquaculture amp Fisheries Group Wageningen University
2112011
34
Three basic life history strategiesGrowth
(population)
SurvivalFecundity
Opportunist strategist small shortliving early maturing fish asymp rselected
Periodic strategist high fecundity longer lifespan
Equilibrium strategist medium size some parental care few but larger offspring asymp Kselected
Winemiller and Rose 1992
King and McFarlane 2003
Intermediate strategist
Opportunistic strategist
Early maturing fish frequent reproduction extended spawning period rapid larval growth high population turnover rate (PB = Z = r) eg mosquito fish Marginal habitats (eg like terrestrialaquatic ecotone)
More common in tropical freshwaters
Rarely exploited (small size) otherwise no management needed but to protect founder populations
Aquaculture amp Fisheries Group Wageningen University
2112011
35
Equilibrium strategist
Large adult body size parental care behaviour
Tropical (stable) fresh waters coral reefs (K)
Density dependent processes and resource limitation
Management maintenance of a productive environment and a healthy adult stocks
Periodic strategist
Maximises age specific fecundity at the expense of juvenile survivorship
If favorable conditions for immatures = periodic synchronous reproduction in phase with periodicity of large numbers
of small offspring
Weak stock recruitment relationships
Management maintain a critical density of adults stocks Protect spawning season andor habitat
Aquaculture amp Fisheries Group Wageningen University
2112011
36
Fishbase species resilience to fishing pressure life
history
Three categories of species resilience to fishing Very lowlow ndash medium ndash high
Based on lifehistory characteristics reproduction feeding and spatial behavior
Through the effects of survival fecundity and growth
trophic position
migratory behaviour
See FishBase wwwfishbaseorg
Lake Mweru ndash Mormyrops anguilloides
Resilience Low
Minimum population doubling time = generation time 8 years
Life span 24 years
Max length 150 cm
Lengthage2at2maturity 65 cm 5 years
Trophic level 36
Migratory no
Intermediateperiodic
Aquaculture amp Fisheries Group Wageningen University
2112011
37
Lake Mweru Hydrocynus vittatus
Resilience Mediumlow
Generation time 3 years
Life span 11 years
Max length 105 cm FL
Lengthage2at2maturity 42 cm 2years
Trophic level 44
Migratory yes spawning migrations
Periodic
Lake Mweru Oreochromis mweruensis
Lake Mweru
Resilience High
Minimum population doubling time lt 15 months
Life span 11 years
Max length 40 cm
Lengthage2at2maturity 15 cm 1year
Trophic level 20
Migratory no
Intermediate opportunistc
Aquaculture amp Fisheries Group Wageningen University
2112011
38
Lake Mweru Microthrissa moeruensis
bull Z = PB ~ 5 ndash 7
Resilience High
Generation time 6 months
Life span 25 years
Max length 5 cm
Lengthage2at2first maturity 3 cm04 year
Trophic level 20 ndash 30
Migratory no
Lake MweruOpportunistic
Assignment 3 Resilience to fishing my situation
Use main species in the fishery in assignment 2 (choose at least three) What is their productivityresilience to fishing
What characteristics are used to assess thisbull Size longevity reproduction feeding spatial behaviour
What is the turnover time (PB = Z = r)
Use Fishbase to find out these characteristics What indicators
What datainformation is needed Who haswhere is this information available
Aquaculture amp Fisheries Group Wageningen University
2112011
39
Fishing pressure fish communities and system stability
Physical environment
Ecosystems
Fish communities
Fishing techniques
Fisheries management
Economics
Administration
Env
ironm
ent
Change in Fish Communities Fishing Environment
Size of individual fish
Competition
Predation
Detrivores Herbivores Zooplanktivores etc
Piscivores
Fishing pressure
Aquaculture amp Fisheries Group Wageningen University
2112011
40
Change in Fish Communities Fishing Environment
Piscivores
Size of individual fish
Competition
Predation
Detrivores Herbivores Zooplanktivores etc
Fishing pressure
driving force
Drivers climate wind waterlevel droughts upwelling eutrophication
Fish Communities ndash population regulation
Constant systems
Pulsed systems
Population regulation
nonselective catastrophic mortality
(environmentdominant)
selective mortality (predation competitiondominant)
environment determines prevailing mortality pattern
Aquaculture amp Fisheries Group Wageningen University
2112011
41
Most ecological processes and life history traits can be related to the prevailing mortality pattern
Life history and natural selection
0
20
40
60
80
100
0 1 2 3 4 5 6 7 8
Relative age (years)
Abu
ndan
ce (
N)
but large fish have more eggs
50 cm = 1 mill eggs 100 cm = 16 mill eggs
Age at 50 maturity
Young fish are supposed to die only a fraction will spawn
Aquaculture amp Fisheries Group Wageningen University
2112011
42
Fishing mortality
Age (years)
Inst
anta
neou
s ra
te o
f m
orta
lity
Predation mortality
From ICES (1997)
is almost exactly oppositeSelectivity predation versus fishing
Management promotes harvesting patterns that is opposite to what most fish stock are naturally adapted to
effort
Age and size structure changesunder selective fishing to younger and smaller individuals
A sign of fishing hellip
Aquaculture amp Fisheries Group Wageningen University
2112011
43
Median age-at-maturation of Northeast Arctic cod (Joslashrgensen 1990 Jorgensen et al 2007 Science Conover et al )
and this is what happens
Fishery induced evolution (nr species)
Maturity lower age (6)
Maturity lower size (7)
Reduced growth (6)
Increase fecundity (3)
Loss genetic div (3)
Leading to lower yields
Small
Random
Large
Increased mortality on
Mean individual weight at age after 4 generations
Evidence Size selection (Growth)
= genetic changes
After Conover and Munch 2002Atlantic silverside Menidia menidia max age=2 years R= PDT lt15 months r=58
Aquaculture amp Fisheries Group Wageningen University
2112011
44
Effect of sizeselective fishing (Yield)
Trends in average total weight harvested across multiple generations of size-selective exploitation
Mortality on
Size selective fishing with large mesh sizes on adults We are deliberately pushing stocks to genetically
stable smaller sizes
Small
Random
Large
The rK selection principle the effects of selective
fishing
Age (size)
Abu
ndan
ce (L
og N
)
Slope = total mortality rate Z = r
Increased juvenile mortality= K-selection
Increased adult mortality= r-selection
r-selection Unstable environment abiotic mortality ndash non-predictive non-selectiveK-selection Stable environment biotic mortality (predation) ndash predictive size selective
Aquaculture amp Fisheries Group Wageningen University
2112011
45
Abundance size spectra
Abu
ndan
ce
Size
The distribution of abundance by size follows regular patterns
slope steepens when large fish removed
phytoplankton
zooplankton
small fish
big fish
Year
1976 1978 1980 1982 1984 1986 1988 1990 1992 1994
Slo
pe
-10
-9
-8
-7
-6
-5
Rice amp Gislason (1996)
Trends in size-spectrum slopes of the North Sea
Fishing effects on community sizestructure
Aquaculture amp Fisheries Group Wageningen University
2112011
46
Question
How do you fish a multispecies community
Selective ndash Targeting large sizes with single gears
Unselective ndash Targeting all sizes with many gears
Multispecies community
How should it be harvested
What should be minimum mesh-size
Aquaculture amp Fisheries Group Wageningen University
2112011
47
Selective fishing will change the slope
Biomasssize distributions
Example from lake Kariba Zambiawhere fishers are using illegal smallmeshed nets
The system remains unchanged except everything is less
Kolding et al 2003
Parallel slopes only intercept lower
Aquaculture amp Fisheries Group Wageningen University
2112011
48
2
3
4
5
Tro
phic
leve
l
Pauly et al (1998)
Fishing down the food web
Example from Lake Volta Ghana
The whole fish community is targeted highly pulsed system
highly dynamic fishery (spatial temporal movements fishermen)
27 fishing methods
25 kgday
74 species utilized
All trophic levels utilized by combining gears with specific trophic profiles 1 2 3 4 5Trophic level
Gears in the fishery ( species sample size)
Van Zwieten et al 2008
Aquaculture amp Fisheries Group Wageningen University
2112011
49
Is nonselective fishing bad
There is no empirical evidence
On the contrary we know that selective fishing is bad but we still advocate it
But how do we impose gear mesh and size restrictions in a multispecies fishery
The optimum fishing pattern is un-selective How much
How
Is fishing down the food web bad
Where is the highest production
Sohellip what is the best fishing pattern
What if we fish everything
A non-selective harvesting pattern is ecosystem conserving
The system remains intact but everything is less
This means fishing down the food-web
Aquaculture amp Fisheries Group Wageningen University
2112011
50
Indicators ndash biomass size distribution
Size of individual fish
Biomass Unexploited Population = Blt40
Maximum length = Lmax10
Fishing pressure
Mean length exploited population = L5
Biomass Exploited Population = Bgt40
Mean length total= Lmean
Intercept = Iasd
Assignment 4 Fishing down my situation
Characterise your fishery Single species single gear ndash multigear
Specific target species ndash all species are targeted (multispecies)
Specific size ndash all sizes (quantify)
Is there a shift from large specimen to small
Is there a shift from large species ndash to small Is there a shift in trophic level
What information is needed What indicators
Where to get this information
Aquaculture amp Fisheries Group Wageningen University
2112011
51
Dynamics of fishing ndash stabilise catch variability
Physical environment
Ecosystems
Fish communities
Fishing techniques
Fisheries management
Economics
Administration
Env
ironm
ent
Diversity in methods ndash small units adaptive
Hook and line fisherman
Lake Jaba Nigeria
Trap fishermen
Lake Mweru Zambia
Aquaculture amp Fisheries Group Wageningen University
2112011
52
Labor intensive beach seining on demersals
Small fish common Chilimira seine small pelagics
Aquaculture amp Fisheries Group Wageningen University
2112011
53
Innovative Nkacha seine small demersals
Unevenly distributed ndash important gears lake Mweru
Aquaculture amp Fisheries Group Wageningen University
2112011
54
Highly mobile ndash movement fishermen Lake Malawi
movement one fisherman in 6 months
SE Arm of Lake Malawi
Characteristics of smallscale fisheries
Small units simple processing small scale trading
Methods diverse innovative labor intensive
Opportunistic adaptive
Large subsistence element (small fish)
Unevenly distributed highly mobile
Aquaculture amp Fisheries Group Wageningen University
2112011
55
Fishing mortality (F)
number of units
efficiency
Effort (f)
Catchability (q)Fishing mortality (F)
More of the same
Decreasing numbers = management
Better methods = Increasing efficiency
=development
So while we both lsquomanagersquo and lsquodeveloprsquo the fishing mortality stays the same
Uh
Tradeoffs Economic efficiency vs employment
opportunities
0
20
40
60
80
100
120
140
160
180
1945 1950 1955 1960 1965 1970 1975 1980 1985 1990 1995 2000 2005
Fish
erm
en (
1000
)
Cat
ch p
er
fishe
rman
(to
ns)
0
500000
1000000
1500000
2000000
2500000
3000000
3500000
4000000
Qua
ntity
(to
ns)
Quantity (tons) Fishermen (1000) Catch (tons) per fisherman
Total catch numbers of fishers amp catch per fisherman in the Norwegian fishery 1945-2005
Effort (f) decreases while CpUE increases because catchability (q = efficiency) increases
Aquaculture amp Fisheries Group Wageningen University
2112011
56
Assignment 5 Dynamics fishery ndash my situation
How has fishing effort developed over time In terms of numbers (fishermen boats)
In terms of gears bull Types
bull Active ndash passive methods
In terms of spatial distribution
In terms of trophic levels
What informationdata needed What indicators
Who haswhere is this information
Goal
Apply a systems approach to fishery information ndashdevise indicators System
bull Understand the role of environment and fishing as sources of population regulation (mortality)
Species Stocksbull Understand that different species have different resilience to fishing
bull Understand r K principle
Selectivity ndash Catch and effortbull Discuss the consequences of selective and unselective fishing on fish
communities
bull Understand the characteristics of small scale fisheries
Aquaculture amp Fisheries Group Wageningen University
2112011
57
Summary All species and systems ndash important sets of
indicators
Effort (numbers types)
Species (composition in catch)
Catch (by species total)
Catch per unit Effort (~relative biomass)
Length (in catch at maturity)
Drivers (as explanatory factor)
copy Wageningen UR
End hellipbeginning
Aquaculture amp Fisheries Group Wageningen University
2112011
58
Summary environment species resilience management Life history strategy Opportunistic Periodic Equilibrium Environment Temporally stochastic
with small-scale patches
Seasonal with large-scale patches
Stable with fine-scaled spatial variation
Demographic trade-off 1 age at maturity 2 fecundity 3 juvenile survivorship
low low low
high high low
high low high
Demographic character Maximise (re)colonising capability of habitats over small spatial scales
Maximise age-specific fecundity spreading of reproductive effort over many years andor large areas
Maximise juvenile survivorship in resource limited density-dependent environments
Life history traits - size - age at maturity - size at maturity - clutch size - egg size - larvalYOY growth - reproductive season - parental care
Small Early Small Small Small Rapid Long No
Large Delayed Mediumlarge Large Small Rapid Short No
Smallmedium Delayed Medium Small Large Slow Long Yes
- Maintain critical minimum spawning biomass
- Maintain appropriate age structure (including large specimen)
- Maintenance of adult stock
Primary management objectives
- Protection against large scale or chronic perturbations that eliminate key refugia in space and time
- Spatial refuges directed at adult stock (including spawning habitats and migration routes)
- Maintain integrity of adult habitat
Environment
Demographic trade-offs
Life history traits
Management objectives
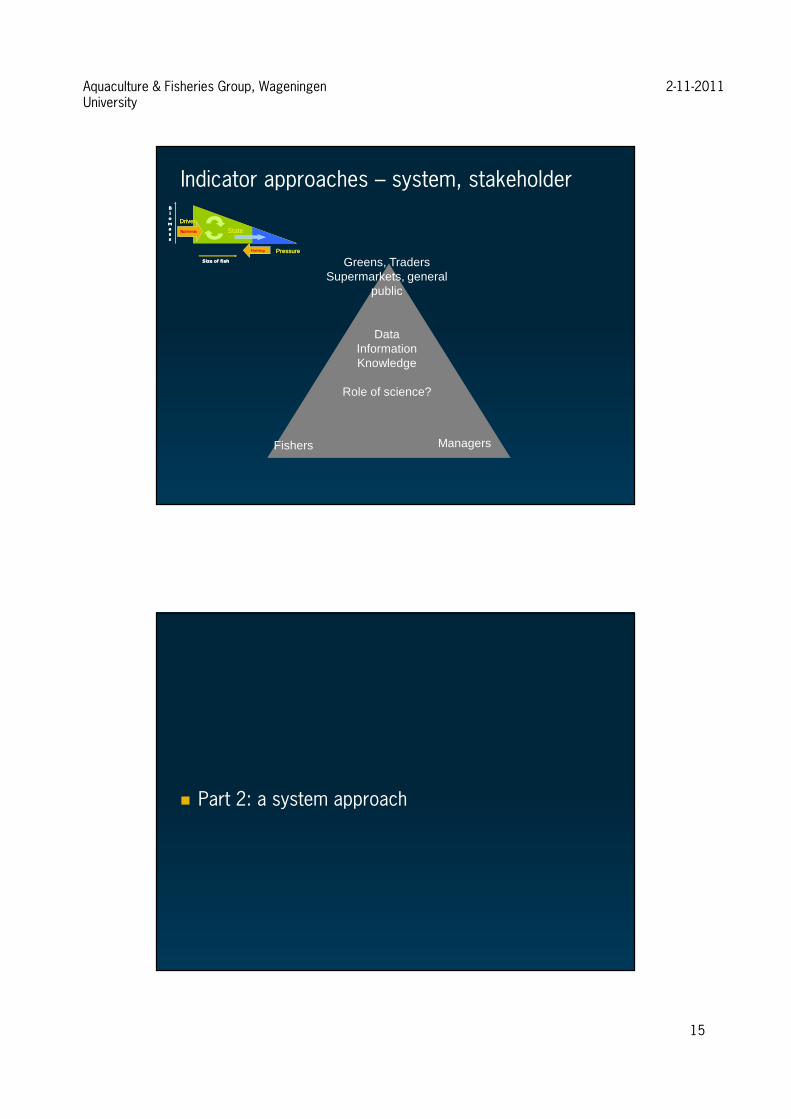
Aquaculture amp Fisheries Group Wageningen University
2112011
15
Indicator approaches ndash system stakeholder
Size of fish
B
io
ma
s s
Fishing
Nutrients
Pressure
Driver
State
Size of fish
B
io
ma
s s
Fishing
Nutrients
Pressure
Driver
State
Fishers Managers
Greens TradersSupermarkets general
public
DataInformationKnowledge
Role of science
Part 2 a system approach
Aquaculture amp Fisheries Group Wageningen University
2112011
16
Goal
Apply a systems approach to fishery information ndashdevising indicators System
bull Understand the role of environment and fishing as sources of population regulation (mortality)
Species Stocksbull Understand that different species have different resilience to fishing
Selectivity ndash Catch and effortbull Understand consequences of (un)selective fishing on fish communities
bull Understand the characteristics of small scale fisheries
bull Understand the potential (and drive) to stabilise catches
Africa diversity of freshwater and marine systemsFreshwaters bull Rivers Nile Orange Congo Zambezi etc
bull River floodplains Niger Congo Zambezi Kafue Pongolo etc
bull Exorheic swamps Sudd Bangweulu Kamulondo Cuvette Centrale Luapula Shire Malagarasi Lukanga
bull Endorheic wetlands and lakes
Chad Okavango Chilwa Rukwa
bull Man made riverine lakes
Kariba Cabora-Bassa Volta Nasser Kainji
bull Shallow lakes open drainage
George Edward Kyoga Malombe Mweru
bull Large deep lakes Tanganyika Victoria Malawi Turkana etc Marine systems bull Upwelling areas Coastal East and Souther Africa
Mauretania Namibia bull Estuaries River mouths bull Tidal flats Banc drsquoAacuterguin bull Continental flats banks Coastal Mozambique Sofala bank bull Coral reefs Red Sea Coastal Islands Tanzania Kenya bull Seemounts bull Open ocean
Aquaculture amp Fisheries Group Wageningen University
2112011
17
Two important indicators
Catch
Effort
Fopt
C = fqB
Relation productivity amp number of fishermen
y = 30xR2 = 082
y = 26 xR2 = 08157
0
5
10
15
20
25
30
35
40
45
50
0 2 4 6 8 10 12 14 16
Density (fisherskm^2)
Cat
ch (
tKm
^2y
ear)
Malombe
Chilwa
MweruChiuta
Albert
Itezhi-tezhi
Edward
Bangweulu
Tanganyika
Nasser amp Kariba
Turkana Kivu
Malawi
Victoria 19702
Victoria 1990 Victoria 20024
Volta Kainji
Average annual catch rate for African fishers = 3 tonyear irrespective of system
Aquaculture amp Fisheries Group Wageningen University
2112011
18
Information needs towards indicators
Systems differ
in productivity
In variability in productivity
in species communities
in effort dynamics
Contextualising fishing patterns and outcome
Scaled indicators
Systems approach ndash sources catch variability
Physical forcing drivers Rainfall water level nutrient pulsing
Climate el Niňo cycles nutrient upwelling
Landuse runoff rainfall nutrient loading siltation habitat change
Ecological spatial heterogeneity
Fish communities species attributes
Exploitation fishery characteristics
(Co)management structure organisation goals
Aquaculture amp Fisheries Group Wageningen University
2112011
19
System approach ndash a theory
Physical environment
Ecosystems
Fish communities
Fishing techniques
Fisheries management
Economics
Administration
Env
ironm
ent
Ecosystem drivers ndash pulsed stable
Physical environment
Ecosystems
Fish communities
Fishing techniques
Fisheries management
Economics
Administration
Env
ironm
ent
Aquaculture amp Fisheries Group Wageningen University
2112011
20
Okavango ndash highly pulsed system
Fluctuating environment Unpredictable
Mortality = density independent high often catastrophic
Population = variable in time less than carrying capacity
Freshwater Lake MalawiVictoria ndash constant system
Stable environment predictable
Mortality density dependent low constant
Population size constant in time around carrying capacity
Aquaculture amp Fisheries Group Wageningen University
2112011
21
Marine Red River Estuary Variable Predictable
What are the dominant life history strategies
What are the dominant life history strategies
Marine Komodo Coral Reefs Highly Stable Predictable
Aquaculture amp Fisheries Group Wageningen University
2112011
22
Drivers ndash waterlevels ndash nutrient pulsing
Scale of variation
Time Process
decadal community
annual stocks
seasonal year class
Monthly industrial catch rate clupeids lake Tanganyika
1955 1960 1965 1970 1975 1980 1985 1990 1995
Year
0
1
2
3
4
5
6
7
8
x 1000 kgvessel
small
Drivers ndash wind stress ndash nutrient upwelling
decadal annual seasonal variation
Aquaculture amp Fisheries Group Wageningen University
2112011
23
Drivers ndash weather patterns ndash nutrient upwelling
Normal pattern
Effect=1-2 years signal clear Yes
El Nino pattern
Drivers Eutrophication Lake Victoria eutrophication through increase nutrient loading related to landuse
Aquaculture amp Fisheries Group Wageningen University
2112011
24
Assignment 1 Drivers Your situation
What type of system
stable ndash pulsed
What drivers are important climate wind waterlevel droughts upwelling eutrophication land
use change
What indicators needed for assessment
What datainformation is needed to monitor longterm developments
Who haswhere is this information available
Fish communities
Physical environment
Ecosystems
Fish communities
Fishing techniques
Fisheries management
Economics
Administration
Env
ironm
ent
Aquaculture amp Fisheries Group Wageningen University
2112011
25
A Lindeman pyramid illustrating
a fish community
Size
Biomass
The biomass-size distribution important indicators in both single species and community studies
A fish community
Fish communities ndash size biomass trophic groups
Size of individual fish
Competition
Predation
Detrivores Herbivores Zooplanktivores etc
Piscivores
Aquaculture amp Fisheries Group Wageningen University
2112011
26
Tilapia ndash Oreochromis mossmbicus detrivore
Small Clupeidae zooplanktivores
Lake Tanganyika
bull Limnothrissa miodon 17 cm (top)
bull Stolothrissa tanganicae 10 cm
Lake Mweru
bullMicrothrissa moeruensis 6cm
Aquaculture amp Fisheries Group Wageningen University
2112011
27
Small zooplankton ndash from eutrophic Tjeukemeer
Nile Perch from Lake Victoria Piscivore
Aquaculture amp Fisheries Group Wageningen University
2112011
28
Haplochromis Species From Nile Perch Stomachs
Lake Mweru ndash a fish community
Length (cm)
MolluscInsect
Cyprinidae (5)Cichlidae (3)Mormyridae (5)Bagridae (2)Mochokidae (3)TylochromisOreochromisClariidae (2)Serranochromis (2)HydrocynusSchilbeidae (2)AlestesOthers (50)
Molluscivore
MicrophytovorePiscivore
5 10 15 20 25 30 35 40 45 50 55 60 65 70 75 80 850
25
50
75
100
125
150
175
200
1970 - 1972
Aquaculture amp Fisheries Group Wageningen University
2112011
29
Size
Biomass
Multispecies fisheries Mweru ndash all sizes and trophic
levelshellip
hellip and all levels are fished
Assignment 2 Fish communities my situation
How many different species are there in the fishery
Which are most important
What biomass (large ndash medium small)
What maximum sizes (large ndash medium ndash small)
What trophic levels (piscivores herbivores benthivores)
What spaces (pelagic demersal migratory)
Draw the most important species into a biomass size spectrum
order them by maximum size trophic level and space (pelagics on top demersal on the bottom)
Aquaculture amp Fisheries Group Wageningen University
2112011
30
Physical environment
Ecosystems
Fish communities
Fishing techniques
Fisheries management
Economics
Administration
Env
ironm
ent
Fish species ndash resilience to fishing
Change in Fish Communities Fishing Environment
Size of individual fish
Competition
Predation
Detrivores Herbivores Zooplanktivores etc
Piscivores
Fishing pressure
Aquaculture amp Fisheries Group Wageningen University
2112011
31
Catch development in a multispecies fishery
Catch
Fishing effort
Fishing down process ndash example Oueme river
Succession of species
black disappeared lt1965
hatched seriously reduced
peak yields around 10000 ton in rsquo50rsquo60ies
Why are some species less resilient to fishing
Aquaculture amp Fisheries Group Wageningen University
2112011
32
time
N
Population growth
Logistic population growth dNdt=r0N(1NK)
K carrying capacity (Nmax)
r0 steepness of the increase
Life history strategies r and Kselected species
rselected species small shortlived high reproductive rates (sardines)
Rapid growth and development Early maturation many offspring with low survival rates Population size below carrying capacity Minimal parental careoffspring Use unpredictable or unstable habitats Abundance varies greatly in time and space Generalists limited niche or trophic specialisation Resources rarely limiting (no competition) Wide dispersal good colonisers rapid response to disturbance Selection for productivity
Anchovy Max age 3-4 years
r=43 Population doubling time lt15 months
Aquaculture amp Fisheries Group Wageningen University
2112011
33
Life history strategies r and Kselected species
Kselected species large longlived lower reproductive rates (sharks rays)
Slow growth long life span Fewer offspring with higher survival rates Population size operate near carrying capacity (K) Use more predictable or stable habitats Parental care is common Abundance stable over time Specialists efficient users of a particular environment (niche
specialist) Resources often become limiting competition Poor colonizers of new or empty habitats (no dispersal) Selection for efficiency (competitive ability)
Hammerhead sharkMax age 14 years
r=08 PDT = 45 ndash 14 years
Not the complete story fish are more plastichellip
Aquaculture amp Fisheries Group Wageningen University
2112011
34
Three basic life history strategiesGrowth
(population)
SurvivalFecundity
Opportunist strategist small shortliving early maturing fish asymp rselected
Periodic strategist high fecundity longer lifespan
Equilibrium strategist medium size some parental care few but larger offspring asymp Kselected
Winemiller and Rose 1992
King and McFarlane 2003
Intermediate strategist
Opportunistic strategist
Early maturing fish frequent reproduction extended spawning period rapid larval growth high population turnover rate (PB = Z = r) eg mosquito fish Marginal habitats (eg like terrestrialaquatic ecotone)
More common in tropical freshwaters
Rarely exploited (small size) otherwise no management needed but to protect founder populations
Aquaculture amp Fisheries Group Wageningen University
2112011
35
Equilibrium strategist
Large adult body size parental care behaviour
Tropical (stable) fresh waters coral reefs (K)
Density dependent processes and resource limitation
Management maintenance of a productive environment and a healthy adult stocks
Periodic strategist
Maximises age specific fecundity at the expense of juvenile survivorship
If favorable conditions for immatures = periodic synchronous reproduction in phase with periodicity of large numbers
of small offspring
Weak stock recruitment relationships
Management maintain a critical density of adults stocks Protect spawning season andor habitat
Aquaculture amp Fisheries Group Wageningen University
2112011
36
Fishbase species resilience to fishing pressure life
history
Three categories of species resilience to fishing Very lowlow ndash medium ndash high
Based on lifehistory characteristics reproduction feeding and spatial behavior
Through the effects of survival fecundity and growth
trophic position
migratory behaviour
See FishBase wwwfishbaseorg
Lake Mweru ndash Mormyrops anguilloides
Resilience Low
Minimum population doubling time = generation time 8 years
Life span 24 years
Max length 150 cm
Lengthage2at2maturity 65 cm 5 years
Trophic level 36
Migratory no
Intermediateperiodic
Aquaculture amp Fisheries Group Wageningen University
2112011
37
Lake Mweru Hydrocynus vittatus
Resilience Mediumlow
Generation time 3 years
Life span 11 years
Max length 105 cm FL
Lengthage2at2maturity 42 cm 2years
Trophic level 44
Migratory yes spawning migrations
Periodic
Lake Mweru Oreochromis mweruensis
Lake Mweru
Resilience High
Minimum population doubling time lt 15 months
Life span 11 years
Max length 40 cm
Lengthage2at2maturity 15 cm 1year
Trophic level 20
Migratory no
Intermediate opportunistc
Aquaculture amp Fisheries Group Wageningen University
2112011
38
Lake Mweru Microthrissa moeruensis
bull Z = PB ~ 5 ndash 7
Resilience High
Generation time 6 months
Life span 25 years
Max length 5 cm
Lengthage2at2first maturity 3 cm04 year
Trophic level 20 ndash 30
Migratory no
Lake MweruOpportunistic
Assignment 3 Resilience to fishing my situation
Use main species in the fishery in assignment 2 (choose at least three) What is their productivityresilience to fishing
What characteristics are used to assess thisbull Size longevity reproduction feeding spatial behaviour
What is the turnover time (PB = Z = r)
Use Fishbase to find out these characteristics What indicators
What datainformation is needed Who haswhere is this information available
Aquaculture amp Fisheries Group Wageningen University
2112011
39
Fishing pressure fish communities and system stability
Physical environment
Ecosystems
Fish communities
Fishing techniques
Fisheries management
Economics
Administration
Env
ironm
ent
Change in Fish Communities Fishing Environment
Size of individual fish
Competition
Predation
Detrivores Herbivores Zooplanktivores etc
Piscivores
Fishing pressure
Aquaculture amp Fisheries Group Wageningen University
2112011
40
Change in Fish Communities Fishing Environment
Piscivores
Size of individual fish
Competition
Predation
Detrivores Herbivores Zooplanktivores etc
Fishing pressure
driving force
Drivers climate wind waterlevel droughts upwelling eutrophication
Fish Communities ndash population regulation
Constant systems
Pulsed systems
Population regulation
nonselective catastrophic mortality
(environmentdominant)
selective mortality (predation competitiondominant)
environment determines prevailing mortality pattern
Aquaculture amp Fisheries Group Wageningen University
2112011
41
Most ecological processes and life history traits can be related to the prevailing mortality pattern
Life history and natural selection
0
20
40
60
80
100
0 1 2 3 4 5 6 7 8
Relative age (years)
Abu
ndan
ce (
N)
but large fish have more eggs
50 cm = 1 mill eggs 100 cm = 16 mill eggs
Age at 50 maturity
Young fish are supposed to die only a fraction will spawn
Aquaculture amp Fisheries Group Wageningen University
2112011
42
Fishing mortality
Age (years)
Inst
anta
neou
s ra
te o
f m
orta
lity
Predation mortality
From ICES (1997)
is almost exactly oppositeSelectivity predation versus fishing
Management promotes harvesting patterns that is opposite to what most fish stock are naturally adapted to
effort
Age and size structure changesunder selective fishing to younger and smaller individuals
A sign of fishing hellip
Aquaculture amp Fisheries Group Wageningen University
2112011
43
Median age-at-maturation of Northeast Arctic cod (Joslashrgensen 1990 Jorgensen et al 2007 Science Conover et al )
and this is what happens
Fishery induced evolution (nr species)
Maturity lower age (6)
Maturity lower size (7)
Reduced growth (6)
Increase fecundity (3)
Loss genetic div (3)
Leading to lower yields
Small
Random
Large
Increased mortality on
Mean individual weight at age after 4 generations
Evidence Size selection (Growth)
= genetic changes
After Conover and Munch 2002Atlantic silverside Menidia menidia max age=2 years R= PDT lt15 months r=58
Aquaculture amp Fisheries Group Wageningen University
2112011
44
Effect of sizeselective fishing (Yield)
Trends in average total weight harvested across multiple generations of size-selective exploitation
Mortality on
Size selective fishing with large mesh sizes on adults We are deliberately pushing stocks to genetically
stable smaller sizes
Small
Random
Large
The rK selection principle the effects of selective
fishing
Age (size)
Abu
ndan
ce (L
og N
)
Slope = total mortality rate Z = r
Increased juvenile mortality= K-selection
Increased adult mortality= r-selection
r-selection Unstable environment abiotic mortality ndash non-predictive non-selectiveK-selection Stable environment biotic mortality (predation) ndash predictive size selective
Aquaculture amp Fisheries Group Wageningen University
2112011
45
Abundance size spectra
Abu
ndan
ce
Size
The distribution of abundance by size follows regular patterns
slope steepens when large fish removed
phytoplankton
zooplankton
small fish
big fish
Year
1976 1978 1980 1982 1984 1986 1988 1990 1992 1994
Slo
pe
-10
-9
-8
-7
-6
-5
Rice amp Gislason (1996)
Trends in size-spectrum slopes of the North Sea
Fishing effects on community sizestructure
Aquaculture amp Fisheries Group Wageningen University
2112011
46
Question
How do you fish a multispecies community
Selective ndash Targeting large sizes with single gears
Unselective ndash Targeting all sizes with many gears
Multispecies community
How should it be harvested
What should be minimum mesh-size
Aquaculture amp Fisheries Group Wageningen University
2112011
47
Selective fishing will change the slope
Biomasssize distributions
Example from lake Kariba Zambiawhere fishers are using illegal smallmeshed nets
The system remains unchanged except everything is less
Kolding et al 2003
Parallel slopes only intercept lower
Aquaculture amp Fisheries Group Wageningen University
2112011
48
2
3
4
5
Tro
phic
leve
l
Pauly et al (1998)
Fishing down the food web
Example from Lake Volta Ghana
The whole fish community is targeted highly pulsed system
highly dynamic fishery (spatial temporal movements fishermen)
27 fishing methods
25 kgday
74 species utilized
All trophic levels utilized by combining gears with specific trophic profiles 1 2 3 4 5Trophic level
Gears in the fishery ( species sample size)
Van Zwieten et al 2008
Aquaculture amp Fisheries Group Wageningen University
2112011
49
Is nonselective fishing bad
There is no empirical evidence
On the contrary we know that selective fishing is bad but we still advocate it
But how do we impose gear mesh and size restrictions in a multispecies fishery
The optimum fishing pattern is un-selective How much
How
Is fishing down the food web bad
Where is the highest production
Sohellip what is the best fishing pattern
What if we fish everything
A non-selective harvesting pattern is ecosystem conserving
The system remains intact but everything is less
This means fishing down the food-web
Aquaculture amp Fisheries Group Wageningen University
2112011
50
Indicators ndash biomass size distribution
Size of individual fish
Biomass Unexploited Population = Blt40
Maximum length = Lmax10
Fishing pressure
Mean length exploited population = L5
Biomass Exploited Population = Bgt40
Mean length total= Lmean
Intercept = Iasd
Assignment 4 Fishing down my situation
Characterise your fishery Single species single gear ndash multigear
Specific target species ndash all species are targeted (multispecies)
Specific size ndash all sizes (quantify)
Is there a shift from large specimen to small
Is there a shift from large species ndash to small Is there a shift in trophic level
What information is needed What indicators
Where to get this information
Aquaculture amp Fisheries Group Wageningen University
2112011
51
Dynamics of fishing ndash stabilise catch variability
Physical environment
Ecosystems
Fish communities
Fishing techniques
Fisheries management
Economics
Administration
Env
ironm
ent
Diversity in methods ndash small units adaptive
Hook and line fisherman
Lake Jaba Nigeria
Trap fishermen
Lake Mweru Zambia
Aquaculture amp Fisheries Group Wageningen University
2112011
52
Labor intensive beach seining on demersals
Small fish common Chilimira seine small pelagics
Aquaculture amp Fisheries Group Wageningen University
2112011
53
Innovative Nkacha seine small demersals
Unevenly distributed ndash important gears lake Mweru
Aquaculture amp Fisheries Group Wageningen University
2112011
54
Highly mobile ndash movement fishermen Lake Malawi
movement one fisherman in 6 months
SE Arm of Lake Malawi
Characteristics of smallscale fisheries
Small units simple processing small scale trading
Methods diverse innovative labor intensive
Opportunistic adaptive
Large subsistence element (small fish)
Unevenly distributed highly mobile
Aquaculture amp Fisheries Group Wageningen University
2112011
55
Fishing mortality (F)
number of units
efficiency
Effort (f)
Catchability (q)Fishing mortality (F)
More of the same
Decreasing numbers = management
Better methods = Increasing efficiency
=development
So while we both lsquomanagersquo and lsquodeveloprsquo the fishing mortality stays the same
Uh
Tradeoffs Economic efficiency vs employment
opportunities
0
20
40
60
80
100
120
140
160
180
1945 1950 1955 1960 1965 1970 1975 1980 1985 1990 1995 2000 2005
Fish
erm
en (
1000
)
Cat
ch p
er
fishe
rman
(to
ns)
0
500000
1000000
1500000
2000000
2500000
3000000
3500000
4000000
Qua
ntity
(to
ns)
Quantity (tons) Fishermen (1000) Catch (tons) per fisherman
Total catch numbers of fishers amp catch per fisherman in the Norwegian fishery 1945-2005
Effort (f) decreases while CpUE increases because catchability (q = efficiency) increases
Aquaculture amp Fisheries Group Wageningen University
2112011
56
Assignment 5 Dynamics fishery ndash my situation
How has fishing effort developed over time In terms of numbers (fishermen boats)
In terms of gears bull Types
bull Active ndash passive methods
In terms of spatial distribution
In terms of trophic levels
What informationdata needed What indicators
Who haswhere is this information
Goal
Apply a systems approach to fishery information ndashdevise indicators System
bull Understand the role of environment and fishing as sources of population regulation (mortality)
Species Stocksbull Understand that different species have different resilience to fishing
bull Understand r K principle
Selectivity ndash Catch and effortbull Discuss the consequences of selective and unselective fishing on fish
communities
bull Understand the characteristics of small scale fisheries
Aquaculture amp Fisheries Group Wageningen University
2112011
57
Summary All species and systems ndash important sets of
indicators
Effort (numbers types)
Species (composition in catch)
Catch (by species total)
Catch per unit Effort (~relative biomass)
Length (in catch at maturity)
Drivers (as explanatory factor)
copy Wageningen UR
End hellipbeginning
Aquaculture amp Fisheries Group Wageningen University
2112011
58
Summary environment species resilience management Life history strategy Opportunistic Periodic Equilibrium Environment Temporally stochastic
with small-scale patches
Seasonal with large-scale patches
Stable with fine-scaled spatial variation
Demographic trade-off 1 age at maturity 2 fecundity 3 juvenile survivorship
low low low
high high low
high low high
Demographic character Maximise (re)colonising capability of habitats over small spatial scales
Maximise age-specific fecundity spreading of reproductive effort over many years andor large areas
Maximise juvenile survivorship in resource limited density-dependent environments
Life history traits - size - age at maturity - size at maturity - clutch size - egg size - larvalYOY growth - reproductive season - parental care
Small Early Small Small Small Rapid Long No
Large Delayed Mediumlarge Large Small Rapid Short No
Smallmedium Delayed Medium Small Large Slow Long Yes
- Maintain critical minimum spawning biomass
- Maintain appropriate age structure (including large specimen)
- Maintenance of adult stock
Primary management objectives
- Protection against large scale or chronic perturbations that eliminate key refugia in space and time
- Spatial refuges directed at adult stock (including spawning habitats and migration routes)
- Maintain integrity of adult habitat
Environment
Demographic trade-offs
Life history traits
Management objectives

Aquaculture amp Fisheries Group Wageningen University
2112011
18
Information needs towards indicators
Systems differ
in productivity
In variability in productivity
in species communities
in effort dynamics
Contextualising fishing patterns and outcome
Scaled indicators
Systems approach ndash sources catch variability
Physical forcing drivers Rainfall water level nutrient pulsing
Climate el Niňo cycles nutrient upwelling
Landuse runoff rainfall nutrient loading siltation habitat change
Ecological spatial heterogeneity
Fish communities species attributes
Exploitation fishery characteristics
(Co)management structure organisation goals
Aquaculture amp Fisheries Group Wageningen University
2112011
19
System approach ndash a theory
Physical environment
Ecosystems
Fish communities
Fishing techniques
Fisheries management
Economics
Administration
Env
ironm
ent
Ecosystem drivers ndash pulsed stable
Physical environment
Ecosystems
Fish communities
Fishing techniques
Fisheries management
Economics
Administration
Env
ironm
ent
Aquaculture amp Fisheries Group Wageningen University
2112011
20
Okavango ndash highly pulsed system
Fluctuating environment Unpredictable
Mortality = density independent high often catastrophic
Population = variable in time less than carrying capacity
Freshwater Lake MalawiVictoria ndash constant system
Stable environment predictable
Mortality density dependent low constant
Population size constant in time around carrying capacity
Aquaculture amp Fisheries Group Wageningen University
2112011
21
Marine Red River Estuary Variable Predictable
What are the dominant life history strategies
What are the dominant life history strategies
Marine Komodo Coral Reefs Highly Stable Predictable
Aquaculture amp Fisheries Group Wageningen University
2112011
22
Drivers ndash waterlevels ndash nutrient pulsing
Scale of variation
Time Process
decadal community
annual stocks
seasonal year class
Monthly industrial catch rate clupeids lake Tanganyika
1955 1960 1965 1970 1975 1980 1985 1990 1995
Year
0
1
2
3
4
5
6
7
8
x 1000 kgvessel
small
Drivers ndash wind stress ndash nutrient upwelling
decadal annual seasonal variation
Aquaculture amp Fisheries Group Wageningen University
2112011
23
Drivers ndash weather patterns ndash nutrient upwelling
Normal pattern
Effect=1-2 years signal clear Yes
El Nino pattern
Drivers Eutrophication Lake Victoria eutrophication through increase nutrient loading related to landuse
Aquaculture amp Fisheries Group Wageningen University
2112011
24
Assignment 1 Drivers Your situation
What type of system
stable ndash pulsed
What drivers are important climate wind waterlevel droughts upwelling eutrophication land
use change
What indicators needed for assessment
What datainformation is needed to monitor longterm developments
Who haswhere is this information available
Fish communities
Physical environment
Ecosystems
Fish communities
Fishing techniques
Fisheries management
Economics
Administration
Env
ironm
ent
Aquaculture amp Fisheries Group Wageningen University
2112011
25
A Lindeman pyramid illustrating
a fish community
Size
Biomass
The biomass-size distribution important indicators in both single species and community studies
A fish community
Fish communities ndash size biomass trophic groups
Size of individual fish
Competition
Predation
Detrivores Herbivores Zooplanktivores etc
Piscivores
Aquaculture amp Fisheries Group Wageningen University
2112011
26
Tilapia ndash Oreochromis mossmbicus detrivore
Small Clupeidae zooplanktivores
Lake Tanganyika
bull Limnothrissa miodon 17 cm (top)
bull Stolothrissa tanganicae 10 cm
Lake Mweru
bullMicrothrissa moeruensis 6cm
Aquaculture amp Fisheries Group Wageningen University
2112011
27
Small zooplankton ndash from eutrophic Tjeukemeer
Nile Perch from Lake Victoria Piscivore
Aquaculture amp Fisheries Group Wageningen University
2112011
28
Haplochromis Species From Nile Perch Stomachs
Lake Mweru ndash a fish community
Length (cm)
MolluscInsect
Cyprinidae (5)Cichlidae (3)Mormyridae (5)Bagridae (2)Mochokidae (3)TylochromisOreochromisClariidae (2)Serranochromis (2)HydrocynusSchilbeidae (2)AlestesOthers (50)
Molluscivore
MicrophytovorePiscivore
5 10 15 20 25 30 35 40 45 50 55 60 65 70 75 80 850
25
50
75
100
125
150
175
200
1970 - 1972
Aquaculture amp Fisheries Group Wageningen University
2112011
29
Size
Biomass
Multispecies fisheries Mweru ndash all sizes and trophic
levelshellip
hellip and all levels are fished
Assignment 2 Fish communities my situation
How many different species are there in the fishery
Which are most important
What biomass (large ndash medium small)
What maximum sizes (large ndash medium ndash small)
What trophic levels (piscivores herbivores benthivores)
What spaces (pelagic demersal migratory)
Draw the most important species into a biomass size spectrum
order them by maximum size trophic level and space (pelagics on top demersal on the bottom)
Aquaculture amp Fisheries Group Wageningen University
2112011
30
Physical environment
Ecosystems
Fish communities
Fishing techniques
Fisheries management
Economics
Administration
Env
ironm
ent
Fish species ndash resilience to fishing
Change in Fish Communities Fishing Environment
Size of individual fish
Competition
Predation
Detrivores Herbivores Zooplanktivores etc
Piscivores
Fishing pressure
Aquaculture amp Fisheries Group Wageningen University
2112011
31
Catch development in a multispecies fishery
Catch
Fishing effort
Fishing down process ndash example Oueme river
Succession of species
black disappeared lt1965
hatched seriously reduced
peak yields around 10000 ton in rsquo50rsquo60ies
Why are some species less resilient to fishing
Aquaculture amp Fisheries Group Wageningen University
2112011
32
time
N
Population growth
Logistic population growth dNdt=r0N(1NK)
K carrying capacity (Nmax)
r0 steepness of the increase
Life history strategies r and Kselected species
rselected species small shortlived high reproductive rates (sardines)
Rapid growth and development Early maturation many offspring with low survival rates Population size below carrying capacity Minimal parental careoffspring Use unpredictable or unstable habitats Abundance varies greatly in time and space Generalists limited niche or trophic specialisation Resources rarely limiting (no competition) Wide dispersal good colonisers rapid response to disturbance Selection for productivity
Anchovy Max age 3-4 years
r=43 Population doubling time lt15 months
Aquaculture amp Fisheries Group Wageningen University
2112011
33
Life history strategies r and Kselected species
Kselected species large longlived lower reproductive rates (sharks rays)
Slow growth long life span Fewer offspring with higher survival rates Population size operate near carrying capacity (K) Use more predictable or stable habitats Parental care is common Abundance stable over time Specialists efficient users of a particular environment (niche
specialist) Resources often become limiting competition Poor colonizers of new or empty habitats (no dispersal) Selection for efficiency (competitive ability)
Hammerhead sharkMax age 14 years
r=08 PDT = 45 ndash 14 years
Not the complete story fish are more plastichellip
Aquaculture amp Fisheries Group Wageningen University
2112011
34
Three basic life history strategiesGrowth
(population)
SurvivalFecundity
Opportunist strategist small shortliving early maturing fish asymp rselected
Periodic strategist high fecundity longer lifespan
Equilibrium strategist medium size some parental care few but larger offspring asymp Kselected
Winemiller and Rose 1992
King and McFarlane 2003
Intermediate strategist
Opportunistic strategist
Early maturing fish frequent reproduction extended spawning period rapid larval growth high population turnover rate (PB = Z = r) eg mosquito fish Marginal habitats (eg like terrestrialaquatic ecotone)
More common in tropical freshwaters
Rarely exploited (small size) otherwise no management needed but to protect founder populations
Aquaculture amp Fisheries Group Wageningen University
2112011
35
Equilibrium strategist
Large adult body size parental care behaviour
Tropical (stable) fresh waters coral reefs (K)
Density dependent processes and resource limitation
Management maintenance of a productive environment and a healthy adult stocks
Periodic strategist
Maximises age specific fecundity at the expense of juvenile survivorship
If favorable conditions for immatures = periodic synchronous reproduction in phase with periodicity of large numbers
of small offspring
Weak stock recruitment relationships
Management maintain a critical density of adults stocks Protect spawning season andor habitat
Aquaculture amp Fisheries Group Wageningen University
2112011
36
Fishbase species resilience to fishing pressure life
history
Three categories of species resilience to fishing Very lowlow ndash medium ndash high
Based on lifehistory characteristics reproduction feeding and spatial behavior
Through the effects of survival fecundity and growth
trophic position
migratory behaviour
See FishBase wwwfishbaseorg
Lake Mweru ndash Mormyrops anguilloides
Resilience Low
Minimum population doubling time = generation time 8 years
Life span 24 years
Max length 150 cm
Lengthage2at2maturity 65 cm 5 years
Trophic level 36
Migratory no
Intermediateperiodic
Aquaculture amp Fisheries Group Wageningen University
2112011
37
Lake Mweru Hydrocynus vittatus
Resilience Mediumlow
Generation time 3 years
Life span 11 years
Max length 105 cm FL
Lengthage2at2maturity 42 cm 2years
Trophic level 44
Migratory yes spawning migrations
Periodic
Lake Mweru Oreochromis mweruensis
Lake Mweru
Resilience High
Minimum population doubling time lt 15 months
Life span 11 years
Max length 40 cm
Lengthage2at2maturity 15 cm 1year
Trophic level 20
Migratory no
Intermediate opportunistc
Aquaculture amp Fisheries Group Wageningen University
2112011
38
Lake Mweru Microthrissa moeruensis
bull Z = PB ~ 5 ndash 7
Resilience High
Generation time 6 months
Life span 25 years
Max length 5 cm
Lengthage2at2first maturity 3 cm04 year
Trophic level 20 ndash 30
Migratory no
Lake MweruOpportunistic
Assignment 3 Resilience to fishing my situation
Use main species in the fishery in assignment 2 (choose at least three) What is their productivityresilience to fishing
What characteristics are used to assess thisbull Size longevity reproduction feeding spatial behaviour
What is the turnover time (PB = Z = r)
Use Fishbase to find out these characteristics What indicators
What datainformation is needed Who haswhere is this information available
Aquaculture amp Fisheries Group Wageningen University
2112011
39
Fishing pressure fish communities and system stability
Physical environment
Ecosystems
Fish communities
Fishing techniques
Fisheries management
Economics
Administration
Env
ironm
ent
Change in Fish Communities Fishing Environment
Size of individual fish
Competition
Predation
Detrivores Herbivores Zooplanktivores etc
Piscivores
Fishing pressure
Aquaculture amp Fisheries Group Wageningen University
2112011
40
Change in Fish Communities Fishing Environment
Piscivores
Size of individual fish
Competition
Predation
Detrivores Herbivores Zooplanktivores etc
Fishing pressure
driving force
Drivers climate wind waterlevel droughts upwelling eutrophication
Fish Communities ndash population regulation
Constant systems
Pulsed systems
Population regulation
nonselective catastrophic mortality
(environmentdominant)
selective mortality (predation competitiondominant)
environment determines prevailing mortality pattern
Aquaculture amp Fisheries Group Wageningen University
2112011
41
Most ecological processes and life history traits can be related to the prevailing mortality pattern
Life history and natural selection
0
20
40
60
80
100
0 1 2 3 4 5 6 7 8
Relative age (years)
Abu
ndan
ce (
N)
but large fish have more eggs
50 cm = 1 mill eggs 100 cm = 16 mill eggs
Age at 50 maturity
Young fish are supposed to die only a fraction will spawn
Aquaculture amp Fisheries Group Wageningen University
2112011
42
Fishing mortality
Age (years)
Inst
anta
neou
s ra
te o
f m
orta
lity
Predation mortality
From ICES (1997)
is almost exactly oppositeSelectivity predation versus fishing
Management promotes harvesting patterns that is opposite to what most fish stock are naturally adapted to
effort
Age and size structure changesunder selective fishing to younger and smaller individuals
A sign of fishing hellip
Aquaculture amp Fisheries Group Wageningen University
2112011
43
Median age-at-maturation of Northeast Arctic cod (Joslashrgensen 1990 Jorgensen et al 2007 Science Conover et al )
and this is what happens
Fishery induced evolution (nr species)
Maturity lower age (6)
Maturity lower size (7)
Reduced growth (6)
Increase fecundity (3)
Loss genetic div (3)
Leading to lower yields
Small
Random
Large
Increased mortality on
Mean individual weight at age after 4 generations
Evidence Size selection (Growth)
= genetic changes
After Conover and Munch 2002Atlantic silverside Menidia menidia max age=2 years R= PDT lt15 months r=58
Aquaculture amp Fisheries Group Wageningen University
2112011
44
Effect of sizeselective fishing (Yield)
Trends in average total weight harvested across multiple generations of size-selective exploitation
Mortality on
Size selective fishing with large mesh sizes on adults We are deliberately pushing stocks to genetically
stable smaller sizes
Small
Random
Large
The rK selection principle the effects of selective
fishing
Age (size)
Abu
ndan
ce (L
og N
)
Slope = total mortality rate Z = r
Increased juvenile mortality= K-selection
Increased adult mortality= r-selection
r-selection Unstable environment abiotic mortality ndash non-predictive non-selectiveK-selection Stable environment biotic mortality (predation) ndash predictive size selective
Aquaculture amp Fisheries Group Wageningen University
2112011
45
Abundance size spectra
Abu
ndan
ce
Size
The distribution of abundance by size follows regular patterns
slope steepens when large fish removed
phytoplankton
zooplankton
small fish
big fish
Year
1976 1978 1980 1982 1984 1986 1988 1990 1992 1994
Slo
pe
-10
-9
-8
-7
-6
-5
Rice amp Gislason (1996)
Trends in size-spectrum slopes of the North Sea
Fishing effects on community sizestructure
Aquaculture amp Fisheries Group Wageningen University
2112011
46
Question
How do you fish a multispecies community
Selective ndash Targeting large sizes with single gears
Unselective ndash Targeting all sizes with many gears
Multispecies community
How should it be harvested
What should be minimum mesh-size
Aquaculture amp Fisheries Group Wageningen University
2112011
47
Selective fishing will change the slope
Biomasssize distributions
Example from lake Kariba Zambiawhere fishers are using illegal smallmeshed nets
The system remains unchanged except everything is less
Kolding et al 2003
Parallel slopes only intercept lower
Aquaculture amp Fisheries Group Wageningen University
2112011
48
2
3
4
5
Tro
phic
leve
l
Pauly et al (1998)
Fishing down the food web
Example from Lake Volta Ghana
The whole fish community is targeted highly pulsed system
highly dynamic fishery (spatial temporal movements fishermen)
27 fishing methods
25 kgday
74 species utilized
All trophic levels utilized by combining gears with specific trophic profiles 1 2 3 4 5Trophic level
Gears in the fishery ( species sample size)
Van Zwieten et al 2008
Aquaculture amp Fisheries Group Wageningen University
2112011
49
Is nonselective fishing bad
There is no empirical evidence
On the contrary we know that selective fishing is bad but we still advocate it
But how do we impose gear mesh and size restrictions in a multispecies fishery
The optimum fishing pattern is un-selective How much
How
Is fishing down the food web bad
Where is the highest production
Sohellip what is the best fishing pattern
What if we fish everything
A non-selective harvesting pattern is ecosystem conserving
The system remains intact but everything is less
This means fishing down the food-web
Aquaculture amp Fisheries Group Wageningen University
2112011
50
Indicators ndash biomass size distribution
Size of individual fish
Biomass Unexploited Population = Blt40
Maximum length = Lmax10
Fishing pressure
Mean length exploited population = L5
Biomass Exploited Population = Bgt40
Mean length total= Lmean
Intercept = Iasd
Assignment 4 Fishing down my situation
Characterise your fishery Single species single gear ndash multigear
Specific target species ndash all species are targeted (multispecies)
Specific size ndash all sizes (quantify)
Is there a shift from large specimen to small
Is there a shift from large species ndash to small Is there a shift in trophic level
What information is needed What indicators
Where to get this information
Aquaculture amp Fisheries Group Wageningen University
2112011
51
Dynamics of fishing ndash stabilise catch variability
Physical environment
Ecosystems
Fish communities
Fishing techniques
Fisheries management
Economics
Administration
Env
ironm
ent
Diversity in methods ndash small units adaptive
Hook and line fisherman
Lake Jaba Nigeria
Trap fishermen
Lake Mweru Zambia
Aquaculture amp Fisheries Group Wageningen University
2112011
52
Labor intensive beach seining on demersals
Small fish common Chilimira seine small pelagics
Aquaculture amp Fisheries Group Wageningen University
2112011
53
Innovative Nkacha seine small demersals
Unevenly distributed ndash important gears lake Mweru
Aquaculture amp Fisheries Group Wageningen University
2112011
54
Highly mobile ndash movement fishermen Lake Malawi
movement one fisherman in 6 months
SE Arm of Lake Malawi
Characteristics of smallscale fisheries
Small units simple processing small scale trading
Methods diverse innovative labor intensive
Opportunistic adaptive
Large subsistence element (small fish)
Unevenly distributed highly mobile
Aquaculture amp Fisheries Group Wageningen University
2112011
55
Fishing mortality (F)
number of units
efficiency
Effort (f)
Catchability (q)Fishing mortality (F)
More of the same
Decreasing numbers = management
Better methods = Increasing efficiency
=development
So while we both lsquomanagersquo and lsquodeveloprsquo the fishing mortality stays the same
Uh
Tradeoffs Economic efficiency vs employment
opportunities
0
20
40
60
80
100
120
140
160
180
1945 1950 1955 1960 1965 1970 1975 1980 1985 1990 1995 2000 2005
Fish
erm
en (
1000
)
Cat
ch p
er
fishe
rman
(to
ns)
0
500000
1000000
1500000
2000000
2500000
3000000
3500000
4000000
Qua
ntity
(to
ns)
Quantity (tons) Fishermen (1000) Catch (tons) per fisherman
Total catch numbers of fishers amp catch per fisherman in the Norwegian fishery 1945-2005
Effort (f) decreases while CpUE increases because catchability (q = efficiency) increases
Aquaculture amp Fisheries Group Wageningen University
2112011
56
Assignment 5 Dynamics fishery ndash my situation
How has fishing effort developed over time In terms of numbers (fishermen boats)
In terms of gears bull Types
bull Active ndash passive methods
In terms of spatial distribution
In terms of trophic levels
What informationdata needed What indicators
Who haswhere is this information
Goal
Apply a systems approach to fishery information ndashdevise indicators System
bull Understand the role of environment and fishing as sources of population regulation (mortality)
Species Stocksbull Understand that different species have different resilience to fishing
bull Understand r K principle
Selectivity ndash Catch and effortbull Discuss the consequences of selective and unselective fishing on fish
communities
bull Understand the characteristics of small scale fisheries
Aquaculture amp Fisheries Group Wageningen University
2112011
57
Summary All species and systems ndash important sets of
indicators
Effort (numbers types)
Species (composition in catch)
Catch (by species total)
Catch per unit Effort (~relative biomass)
Length (in catch at maturity)
Drivers (as explanatory factor)
copy Wageningen UR
End hellipbeginning
Aquaculture amp Fisheries Group Wageningen University
2112011
58
Summary environment species resilience management Life history strategy Opportunistic Periodic Equilibrium Environment Temporally stochastic
with small-scale patches
Seasonal with large-scale patches
Stable with fine-scaled spatial variation
Demographic trade-off 1 age at maturity 2 fecundity 3 juvenile survivorship
low low low
high high low
high low high
Demographic character Maximise (re)colonising capability of habitats over small spatial scales
Maximise age-specific fecundity spreading of reproductive effort over many years andor large areas
Maximise juvenile survivorship in resource limited density-dependent environments
Life history traits - size - age at maturity - size at maturity - clutch size - egg size - larvalYOY growth - reproductive season - parental care
Small Early Small Small Small Rapid Long No
Large Delayed Mediumlarge Large Small Rapid Short No
Smallmedium Delayed Medium Small Large Slow Long Yes
- Maintain critical minimum spawning biomass
- Maintain appropriate age structure (including large specimen)
- Maintenance of adult stock
Primary management objectives
- Protection against large scale or chronic perturbations that eliminate key refugia in space and time
- Spatial refuges directed at adult stock (including spawning habitats and migration routes)
- Maintain integrity of adult habitat
Environment
Demographic trade-offs
Life history traits
Management objectives
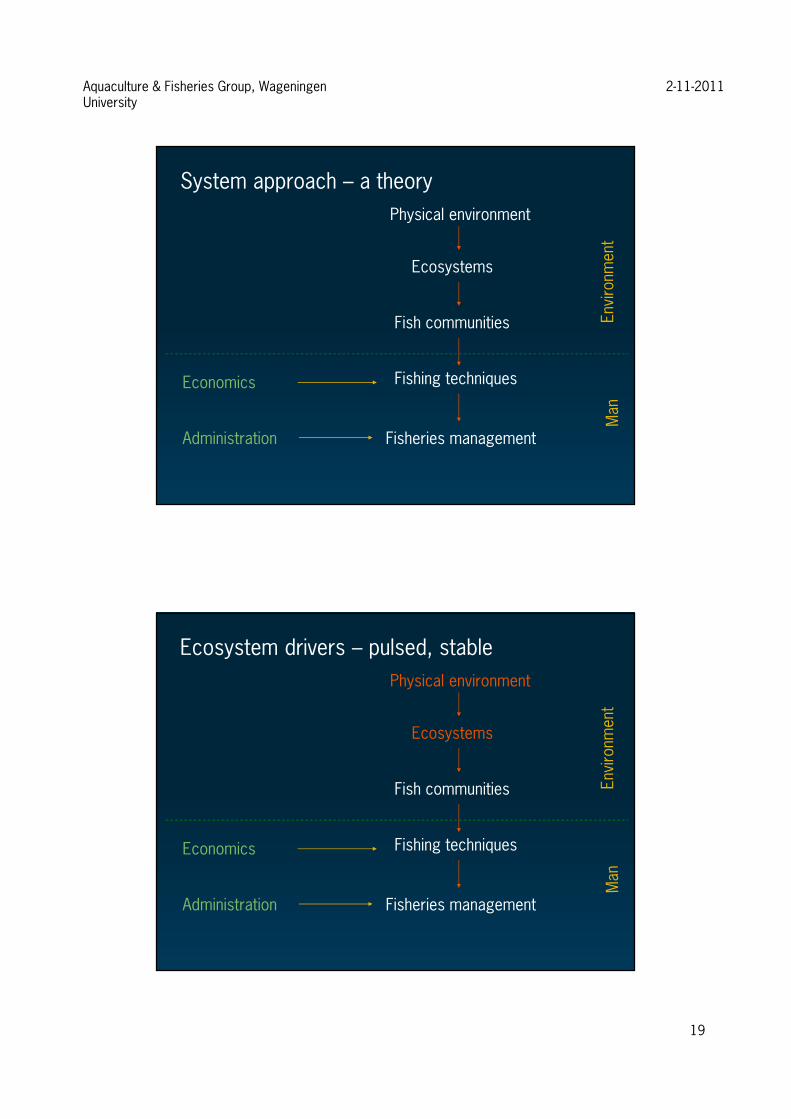
Aquaculture amp Fisheries Group Wageningen University
2112011
20
Okavango ndash highly pulsed system
Fluctuating environment Unpredictable
Mortality = density independent high often catastrophic
Population = variable in time less than carrying capacity
Freshwater Lake MalawiVictoria ndash constant system
Stable environment predictable
Mortality density dependent low constant
Population size constant in time around carrying capacity
Aquaculture amp Fisheries Group Wageningen University
2112011
21
Marine Red River Estuary Variable Predictable
What are the dominant life history strategies
What are the dominant life history strategies
Marine Komodo Coral Reefs Highly Stable Predictable
Aquaculture amp Fisheries Group Wageningen University
2112011
22
Drivers ndash waterlevels ndash nutrient pulsing
Scale of variation
Time Process
decadal community
annual stocks
seasonal year class
Monthly industrial catch rate clupeids lake Tanganyika
1955 1960 1965 1970 1975 1980 1985 1990 1995
Year
0
1
2
3
4
5
6
7
8
x 1000 kgvessel
small
Drivers ndash wind stress ndash nutrient upwelling
decadal annual seasonal variation
Aquaculture amp Fisheries Group Wageningen University
2112011
23
Drivers ndash weather patterns ndash nutrient upwelling
Normal pattern
Effect=1-2 years signal clear Yes
El Nino pattern
Drivers Eutrophication Lake Victoria eutrophication through increase nutrient loading related to landuse
Aquaculture amp Fisheries Group Wageningen University
2112011
24
Assignment 1 Drivers Your situation
What type of system
stable ndash pulsed
What drivers are important climate wind waterlevel droughts upwelling eutrophication land
use change
What indicators needed for assessment
What datainformation is needed to monitor longterm developments
Who haswhere is this information available
Fish communities
Physical environment
Ecosystems
Fish communities
Fishing techniques
Fisheries management
Economics
Administration
Env
ironm
ent
Aquaculture amp Fisheries Group Wageningen University
2112011
25
A Lindeman pyramid illustrating
a fish community
Size
Biomass
The biomass-size distribution important indicators in both single species and community studies
A fish community
Fish communities ndash size biomass trophic groups
Size of individual fish
Competition
Predation
Detrivores Herbivores Zooplanktivores etc
Piscivores
Aquaculture amp Fisheries Group Wageningen University
2112011
26
Tilapia ndash Oreochromis mossmbicus detrivore
Small Clupeidae zooplanktivores
Lake Tanganyika
bull Limnothrissa miodon 17 cm (top)
bull Stolothrissa tanganicae 10 cm
Lake Mweru
bullMicrothrissa moeruensis 6cm
Aquaculture amp Fisheries Group Wageningen University
2112011
27
Small zooplankton ndash from eutrophic Tjeukemeer
Nile Perch from Lake Victoria Piscivore
Aquaculture amp Fisheries Group Wageningen University
2112011
28
Haplochromis Species From Nile Perch Stomachs
Lake Mweru ndash a fish community
Length (cm)
MolluscInsect
Cyprinidae (5)Cichlidae (3)Mormyridae (5)Bagridae (2)Mochokidae (3)TylochromisOreochromisClariidae (2)Serranochromis (2)HydrocynusSchilbeidae (2)AlestesOthers (50)
Molluscivore
MicrophytovorePiscivore
5 10 15 20 25 30 35 40 45 50 55 60 65 70 75 80 850
25
50
75
100
125
150
175
200
1970 - 1972
Aquaculture amp Fisheries Group Wageningen University
2112011
29
Size
Biomass
Multispecies fisheries Mweru ndash all sizes and trophic
levelshellip
hellip and all levels are fished
Assignment 2 Fish communities my situation
How many different species are there in the fishery
Which are most important
What biomass (large ndash medium small)
What maximum sizes (large ndash medium ndash small)
What trophic levels (piscivores herbivores benthivores)
What spaces (pelagic demersal migratory)
Draw the most important species into a biomass size spectrum
order them by maximum size trophic level and space (pelagics on top demersal on the bottom)
Aquaculture amp Fisheries Group Wageningen University
2112011
30
Physical environment
Ecosystems
Fish communities
Fishing techniques
Fisheries management
Economics
Administration
Env
ironm
ent
Fish species ndash resilience to fishing
Change in Fish Communities Fishing Environment
Size of individual fish
Competition
Predation
Detrivores Herbivores Zooplanktivores etc
Piscivores
Fishing pressure
Aquaculture amp Fisheries Group Wageningen University
2112011
31
Catch development in a multispecies fishery
Catch
Fishing effort
Fishing down process ndash example Oueme river
Succession of species
black disappeared lt1965
hatched seriously reduced
peak yields around 10000 ton in rsquo50rsquo60ies
Why are some species less resilient to fishing
Aquaculture amp Fisheries Group Wageningen University
2112011
32
time
N
Population growth
Logistic population growth dNdt=r0N(1NK)
K carrying capacity (Nmax)
r0 steepness of the increase
Life history strategies r and Kselected species
rselected species small shortlived high reproductive rates (sardines)
Rapid growth and development Early maturation many offspring with low survival rates Population size below carrying capacity Minimal parental careoffspring Use unpredictable or unstable habitats Abundance varies greatly in time and space Generalists limited niche or trophic specialisation Resources rarely limiting (no competition) Wide dispersal good colonisers rapid response to disturbance Selection for productivity
Anchovy Max age 3-4 years
r=43 Population doubling time lt15 months
Aquaculture amp Fisheries Group Wageningen University
2112011
33
Life history strategies r and Kselected species
Kselected species large longlived lower reproductive rates (sharks rays)
Slow growth long life span Fewer offspring with higher survival rates Population size operate near carrying capacity (K) Use more predictable or stable habitats Parental care is common Abundance stable over time Specialists efficient users of a particular environment (niche
specialist) Resources often become limiting competition Poor colonizers of new or empty habitats (no dispersal) Selection for efficiency (competitive ability)
Hammerhead sharkMax age 14 years
r=08 PDT = 45 ndash 14 years
Not the complete story fish are more plastichellip
Aquaculture amp Fisheries Group Wageningen University
2112011
34
Three basic life history strategiesGrowth
(population)
SurvivalFecundity
Opportunist strategist small shortliving early maturing fish asymp rselected
Periodic strategist high fecundity longer lifespan
Equilibrium strategist medium size some parental care few but larger offspring asymp Kselected
Winemiller and Rose 1992
King and McFarlane 2003
Intermediate strategist
Opportunistic strategist
Early maturing fish frequent reproduction extended spawning period rapid larval growth high population turnover rate (PB = Z = r) eg mosquito fish Marginal habitats (eg like terrestrialaquatic ecotone)
More common in tropical freshwaters
Rarely exploited (small size) otherwise no management needed but to protect founder populations
Aquaculture amp Fisheries Group Wageningen University
2112011
35
Equilibrium strategist
Large adult body size parental care behaviour
Tropical (stable) fresh waters coral reefs (K)
Density dependent processes and resource limitation
Management maintenance of a productive environment and a healthy adult stocks
Periodic strategist
Maximises age specific fecundity at the expense of juvenile survivorship
If favorable conditions for immatures = periodic synchronous reproduction in phase with periodicity of large numbers
of small offspring
Weak stock recruitment relationships
Management maintain a critical density of adults stocks Protect spawning season andor habitat
Aquaculture amp Fisheries Group Wageningen University
2112011
36
Fishbase species resilience to fishing pressure life
history
Three categories of species resilience to fishing Very lowlow ndash medium ndash high
Based on lifehistory characteristics reproduction feeding and spatial behavior
Through the effects of survival fecundity and growth
trophic position
migratory behaviour
See FishBase wwwfishbaseorg
Lake Mweru ndash Mormyrops anguilloides
Resilience Low
Minimum population doubling time = generation time 8 years
Life span 24 years
Max length 150 cm
Lengthage2at2maturity 65 cm 5 years
Trophic level 36
Migratory no
Intermediateperiodic
Aquaculture amp Fisheries Group Wageningen University
2112011
37
Lake Mweru Hydrocynus vittatus
Resilience Mediumlow
Generation time 3 years
Life span 11 years
Max length 105 cm FL
Lengthage2at2maturity 42 cm 2years
Trophic level 44
Migratory yes spawning migrations
Periodic
Lake Mweru Oreochromis mweruensis
Lake Mweru
Resilience High
Minimum population doubling time lt 15 months
Life span 11 years
Max length 40 cm
Lengthage2at2maturity 15 cm 1year
Trophic level 20
Migratory no
Intermediate opportunistc
Aquaculture amp Fisheries Group Wageningen University
2112011
38
Lake Mweru Microthrissa moeruensis
bull Z = PB ~ 5 ndash 7
Resilience High
Generation time 6 months
Life span 25 years
Max length 5 cm
Lengthage2at2first maturity 3 cm04 year
Trophic level 20 ndash 30
Migratory no
Lake MweruOpportunistic
Assignment 3 Resilience to fishing my situation
Use main species in the fishery in assignment 2 (choose at least three) What is their productivityresilience to fishing
What characteristics are used to assess thisbull Size longevity reproduction feeding spatial behaviour
What is the turnover time (PB = Z = r)
Use Fishbase to find out these characteristics What indicators
What datainformation is needed Who haswhere is this information available
Aquaculture amp Fisheries Group Wageningen University
2112011
39
Fishing pressure fish communities and system stability
Physical environment
Ecosystems
Fish communities
Fishing techniques
Fisheries management
Economics
Administration
Env
ironm
ent
Change in Fish Communities Fishing Environment
Size of individual fish
Competition
Predation
Detrivores Herbivores Zooplanktivores etc
Piscivores
Fishing pressure
Aquaculture amp Fisheries Group Wageningen University
2112011
40
Change in Fish Communities Fishing Environment
Piscivores
Size of individual fish
Competition
Predation
Detrivores Herbivores Zooplanktivores etc
Fishing pressure
driving force
Drivers climate wind waterlevel droughts upwelling eutrophication
Fish Communities ndash population regulation
Constant systems
Pulsed systems
Population regulation
nonselective catastrophic mortality
(environmentdominant)
selective mortality (predation competitiondominant)
environment determines prevailing mortality pattern
Aquaculture amp Fisheries Group Wageningen University
2112011
41
Most ecological processes and life history traits can be related to the prevailing mortality pattern
Life history and natural selection
0
20
40
60
80
100
0 1 2 3 4 5 6 7 8
Relative age (years)
Abu
ndan
ce (
N)
but large fish have more eggs
50 cm = 1 mill eggs 100 cm = 16 mill eggs
Age at 50 maturity
Young fish are supposed to die only a fraction will spawn
Aquaculture amp Fisheries Group Wageningen University
2112011
42
Fishing mortality
Age (years)
Inst
anta
neou
s ra
te o
f m
orta
lity
Predation mortality
From ICES (1997)
is almost exactly oppositeSelectivity predation versus fishing
Management promotes harvesting patterns that is opposite to what most fish stock are naturally adapted to
effort
Age and size structure changesunder selective fishing to younger and smaller individuals
A sign of fishing hellip
Aquaculture amp Fisheries Group Wageningen University
2112011
43
Median age-at-maturation of Northeast Arctic cod (Joslashrgensen 1990 Jorgensen et al 2007 Science Conover et al )
and this is what happens
Fishery induced evolution (nr species)
Maturity lower age (6)
Maturity lower size (7)
Reduced growth (6)
Increase fecundity (3)
Loss genetic div (3)
Leading to lower yields
Small
Random
Large
Increased mortality on
Mean individual weight at age after 4 generations
Evidence Size selection (Growth)
= genetic changes
After Conover and Munch 2002Atlantic silverside Menidia menidia max age=2 years R= PDT lt15 months r=58
Aquaculture amp Fisheries Group Wageningen University
2112011
44
Effect of sizeselective fishing (Yield)
Trends in average total weight harvested across multiple generations of size-selective exploitation
Mortality on
Size selective fishing with large mesh sizes on adults We are deliberately pushing stocks to genetically
stable smaller sizes
Small
Random
Large
The rK selection principle the effects of selective
fishing
Age (size)
Abu
ndan
ce (L
og N
)
Slope = total mortality rate Z = r
Increased juvenile mortality= K-selection
Increased adult mortality= r-selection
r-selection Unstable environment abiotic mortality ndash non-predictive non-selectiveK-selection Stable environment biotic mortality (predation) ndash predictive size selective
Aquaculture amp Fisheries Group Wageningen University
2112011
45
Abundance size spectra
Abu
ndan
ce
Size
The distribution of abundance by size follows regular patterns
slope steepens when large fish removed
phytoplankton
zooplankton
small fish
big fish
Year
1976 1978 1980 1982 1984 1986 1988 1990 1992 1994
Slo
pe
-10
-9
-8
-7
-6
-5
Rice amp Gislason (1996)
Trends in size-spectrum slopes of the North Sea
Fishing effects on community sizestructure
Aquaculture amp Fisheries Group Wageningen University
2112011
46
Question
How do you fish a multispecies community
Selective ndash Targeting large sizes with single gears
Unselective ndash Targeting all sizes with many gears
Multispecies community
How should it be harvested
What should be minimum mesh-size
Aquaculture amp Fisheries Group Wageningen University
2112011
47
Selective fishing will change the slope
Biomasssize distributions
Example from lake Kariba Zambiawhere fishers are using illegal smallmeshed nets
The system remains unchanged except everything is less
Kolding et al 2003
Parallel slopes only intercept lower
Aquaculture amp Fisheries Group Wageningen University
2112011
48
2
3
4
5
Tro
phic
leve
l
Pauly et al (1998)
Fishing down the food web
Example from Lake Volta Ghana
The whole fish community is targeted highly pulsed system
highly dynamic fishery (spatial temporal movements fishermen)
27 fishing methods
25 kgday
74 species utilized
All trophic levels utilized by combining gears with specific trophic profiles 1 2 3 4 5Trophic level
Gears in the fishery ( species sample size)
Van Zwieten et al 2008
Aquaculture amp Fisheries Group Wageningen University
2112011
49
Is nonselective fishing bad
There is no empirical evidence
On the contrary we know that selective fishing is bad but we still advocate it
But how do we impose gear mesh and size restrictions in a multispecies fishery
The optimum fishing pattern is un-selective How much
How
Is fishing down the food web bad
Where is the highest production
Sohellip what is the best fishing pattern
What if we fish everything
A non-selective harvesting pattern is ecosystem conserving
The system remains intact but everything is less
This means fishing down the food-web
Aquaculture amp Fisheries Group Wageningen University
2112011
50
Indicators ndash biomass size distribution
Size of individual fish
Biomass Unexploited Population = Blt40
Maximum length = Lmax10
Fishing pressure
Mean length exploited population = L5
Biomass Exploited Population = Bgt40
Mean length total= Lmean
Intercept = Iasd
Assignment 4 Fishing down my situation
Characterise your fishery Single species single gear ndash multigear
Specific target species ndash all species are targeted (multispecies)
Specific size ndash all sizes (quantify)
Is there a shift from large specimen to small
Is there a shift from large species ndash to small Is there a shift in trophic level
What information is needed What indicators
Where to get this information
Aquaculture amp Fisheries Group Wageningen University
2112011
51
Dynamics of fishing ndash stabilise catch variability
Physical environment
Ecosystems
Fish communities
Fishing techniques
Fisheries management
Economics
Administration
Env
ironm
ent
Diversity in methods ndash small units adaptive
Hook and line fisherman
Lake Jaba Nigeria
Trap fishermen
Lake Mweru Zambia
Aquaculture amp Fisheries Group Wageningen University
2112011
52
Labor intensive beach seining on demersals
Small fish common Chilimira seine small pelagics
Aquaculture amp Fisheries Group Wageningen University
2112011
53
Innovative Nkacha seine small demersals
Unevenly distributed ndash important gears lake Mweru
Aquaculture amp Fisheries Group Wageningen University
2112011
54
Highly mobile ndash movement fishermen Lake Malawi
movement one fisherman in 6 months
SE Arm of Lake Malawi
Characteristics of smallscale fisheries
Small units simple processing small scale trading
Methods diverse innovative labor intensive
Opportunistic adaptive
Large subsistence element (small fish)
Unevenly distributed highly mobile
Aquaculture amp Fisheries Group Wageningen University
2112011
55
Fishing mortality (F)
number of units
efficiency
Effort (f)
Catchability (q)Fishing mortality (F)
More of the same
Decreasing numbers = management
Better methods = Increasing efficiency
=development
So while we both lsquomanagersquo and lsquodeveloprsquo the fishing mortality stays the same
Uh
Tradeoffs Economic efficiency vs employment
opportunities
0
20
40
60
80
100
120
140
160
180
1945 1950 1955 1960 1965 1970 1975 1980 1985 1990 1995 2000 2005
Fish
erm
en (
1000
)
Cat
ch p
er
fishe
rman
(to
ns)
0
500000
1000000
1500000
2000000
2500000
3000000
3500000
4000000
Qua
ntity
(to
ns)
Quantity (tons) Fishermen (1000) Catch (tons) per fisherman
Total catch numbers of fishers amp catch per fisherman in the Norwegian fishery 1945-2005
Effort (f) decreases while CpUE increases because catchability (q = efficiency) increases
Aquaculture amp Fisheries Group Wageningen University
2112011
56
Assignment 5 Dynamics fishery ndash my situation
How has fishing effort developed over time In terms of numbers (fishermen boats)
In terms of gears bull Types
bull Active ndash passive methods
In terms of spatial distribution
In terms of trophic levels
What informationdata needed What indicators
Who haswhere is this information
Goal
Apply a systems approach to fishery information ndashdevise indicators System
bull Understand the role of environment and fishing as sources of population regulation (mortality)
Species Stocksbull Understand that different species have different resilience to fishing
bull Understand r K principle
Selectivity ndash Catch and effortbull Discuss the consequences of selective and unselective fishing on fish
communities
bull Understand the characteristics of small scale fisheries
Aquaculture amp Fisheries Group Wageningen University
2112011
57
Summary All species and systems ndash important sets of
indicators
Effort (numbers types)
Species (composition in catch)
Catch (by species total)
Catch per unit Effort (~relative biomass)
Length (in catch at maturity)
Drivers (as explanatory factor)
copy Wageningen UR
End hellipbeginning
Aquaculture amp Fisheries Group Wageningen University
2112011
58
Summary environment species resilience management Life history strategy Opportunistic Periodic Equilibrium Environment Temporally stochastic
with small-scale patches
Seasonal with large-scale patches
Stable with fine-scaled spatial variation
Demographic trade-off 1 age at maturity 2 fecundity 3 juvenile survivorship
low low low
high high low
high low high
Demographic character Maximise (re)colonising capability of habitats over small spatial scales
Maximise age-specific fecundity spreading of reproductive effort over many years andor large areas
Maximise juvenile survivorship in resource limited density-dependent environments
Life history traits - size - age at maturity - size at maturity - clutch size - egg size - larvalYOY growth - reproductive season - parental care
Small Early Small Small Small Rapid Long No
Large Delayed Mediumlarge Large Small Rapid Short No
Smallmedium Delayed Medium Small Large Slow Long Yes
- Maintain critical minimum spawning biomass
- Maintain appropriate age structure (including large specimen)
- Maintenance of adult stock
Primary management objectives
- Protection against large scale or chronic perturbations that eliminate key refugia in space and time
- Spatial refuges directed at adult stock (including spawning habitats and migration routes)
- Maintain integrity of adult habitat
Environment
Demographic trade-offs
Life history traits
Management objectives

Aquaculture amp Fisheries Group Wageningen University
2112011
25
A Lindeman pyramid illustrating
a fish community
Size
Biomass
The biomass-size distribution important indicators in both single species and community studies
A fish community
Fish communities ndash size biomass trophic groups
Size of individual fish
Competition
Predation
Detrivores Herbivores Zooplanktivores etc
Piscivores
Aquaculture amp Fisheries Group Wageningen University
2112011
26
Tilapia ndash Oreochromis mossmbicus detrivore
Small Clupeidae zooplanktivores
Lake Tanganyika
bull Limnothrissa miodon 17 cm (top)
bull Stolothrissa tanganicae 10 cm
Lake Mweru
bullMicrothrissa moeruensis 6cm
Aquaculture amp Fisheries Group Wageningen University
2112011
27
Small zooplankton ndash from eutrophic Tjeukemeer
Nile Perch from Lake Victoria Piscivore
Aquaculture amp Fisheries Group Wageningen University
2112011
28
Haplochromis Species From Nile Perch Stomachs
Lake Mweru ndash a fish community
Length (cm)
MolluscInsect
Cyprinidae (5)Cichlidae (3)Mormyridae (5)Bagridae (2)Mochokidae (3)TylochromisOreochromisClariidae (2)Serranochromis (2)HydrocynusSchilbeidae (2)AlestesOthers (50)
Molluscivore
MicrophytovorePiscivore
5 10 15 20 25 30 35 40 45 50 55 60 65 70 75 80 850
25
50
75
100
125
150
175
200
1970 - 1972
Aquaculture amp Fisheries Group Wageningen University
2112011
29
Size
Biomass
Multispecies fisheries Mweru ndash all sizes and trophic
levelshellip
hellip and all levels are fished
Assignment 2 Fish communities my situation
How many different species are there in the fishery
Which are most important
What biomass (large ndash medium small)
What maximum sizes (large ndash medium ndash small)
What trophic levels (piscivores herbivores benthivores)
What spaces (pelagic demersal migratory)
Draw the most important species into a biomass size spectrum
order them by maximum size trophic level and space (pelagics on top demersal on the bottom)
Aquaculture amp Fisheries Group Wageningen University
2112011
30
Physical environment
Ecosystems
Fish communities
Fishing techniques
Fisheries management
Economics
Administration
Env
ironm
ent
Fish species ndash resilience to fishing
Change in Fish Communities Fishing Environment
Size of individual fish
Competition
Predation
Detrivores Herbivores Zooplanktivores etc
Piscivores
Fishing pressure
Aquaculture amp Fisheries Group Wageningen University
2112011
31
Catch development in a multispecies fishery
Catch
Fishing effort
Fishing down process ndash example Oueme river
Succession of species
black disappeared lt1965
hatched seriously reduced
peak yields around 10000 ton in rsquo50rsquo60ies
Why are some species less resilient to fishing
Aquaculture amp Fisheries Group Wageningen University
2112011
32
time
N
Population growth
Logistic population growth dNdt=r0N(1NK)
K carrying capacity (Nmax)
r0 steepness of the increase
Life history strategies r and Kselected species
rselected species small shortlived high reproductive rates (sardines)
Rapid growth and development Early maturation many offspring with low survival rates Population size below carrying capacity Minimal parental careoffspring Use unpredictable or unstable habitats Abundance varies greatly in time and space Generalists limited niche or trophic specialisation Resources rarely limiting (no competition) Wide dispersal good colonisers rapid response to disturbance Selection for productivity
Anchovy Max age 3-4 years
r=43 Population doubling time lt15 months
Aquaculture amp Fisheries Group Wageningen University
2112011
33
Life history strategies r and Kselected species
Kselected species large longlived lower reproductive rates (sharks rays)
Slow growth long life span Fewer offspring with higher survival rates Population size operate near carrying capacity (K) Use more predictable or stable habitats Parental care is common Abundance stable over time Specialists efficient users of a particular environment (niche
specialist) Resources often become limiting competition Poor colonizers of new or empty habitats (no dispersal) Selection for efficiency (competitive ability)
Hammerhead sharkMax age 14 years
r=08 PDT = 45 ndash 14 years
Not the complete story fish are more plastichellip
Aquaculture amp Fisheries Group Wageningen University
2112011
34
Three basic life history strategiesGrowth
(population)
SurvivalFecundity
Opportunist strategist small shortliving early maturing fish asymp rselected
Periodic strategist high fecundity longer lifespan
Equilibrium strategist medium size some parental care few but larger offspring asymp Kselected
Winemiller and Rose 1992
King and McFarlane 2003
Intermediate strategist
Opportunistic strategist
Early maturing fish frequent reproduction extended spawning period rapid larval growth high population turnover rate (PB = Z = r) eg mosquito fish Marginal habitats (eg like terrestrialaquatic ecotone)
More common in tropical freshwaters
Rarely exploited (small size) otherwise no management needed but to protect founder populations
Aquaculture amp Fisheries Group Wageningen University
2112011
35
Equilibrium strategist
Large adult body size parental care behaviour
Tropical (stable) fresh waters coral reefs (K)
Density dependent processes and resource limitation
Management maintenance of a productive environment and a healthy adult stocks
Periodic strategist
Maximises age specific fecundity at the expense of juvenile survivorship
If favorable conditions for immatures = periodic synchronous reproduction in phase with periodicity of large numbers
of small offspring
Weak stock recruitment relationships
Management maintain a critical density of adults stocks Protect spawning season andor habitat
Aquaculture amp Fisheries Group Wageningen University
2112011
36
Fishbase species resilience to fishing pressure life
history
Three categories of species resilience to fishing Very lowlow ndash medium ndash high
Based on lifehistory characteristics reproduction feeding and spatial behavior
Through the effects of survival fecundity and growth
trophic position
migratory behaviour
See FishBase wwwfishbaseorg
Lake Mweru ndash Mormyrops anguilloides
Resilience Low
Minimum population doubling time = generation time 8 years
Life span 24 years
Max length 150 cm
Lengthage2at2maturity 65 cm 5 years
Trophic level 36
Migratory no
Intermediateperiodic
Aquaculture amp Fisheries Group Wageningen University
2112011
37
Lake Mweru Hydrocynus vittatus
Resilience Mediumlow
Generation time 3 years
Life span 11 years
Max length 105 cm FL
Lengthage2at2maturity 42 cm 2years
Trophic level 44
Migratory yes spawning migrations
Periodic
Lake Mweru Oreochromis mweruensis
Lake Mweru
Resilience High
Minimum population doubling time lt 15 months
Life span 11 years
Max length 40 cm
Lengthage2at2maturity 15 cm 1year
Trophic level 20
Migratory no
Intermediate opportunistc
Aquaculture amp Fisheries Group Wageningen University
2112011
38
Lake Mweru Microthrissa moeruensis
bull Z = PB ~ 5 ndash 7
Resilience High
Generation time 6 months
Life span 25 years
Max length 5 cm
Lengthage2at2first maturity 3 cm04 year
Trophic level 20 ndash 30
Migratory no
Lake MweruOpportunistic
Assignment 3 Resilience to fishing my situation
Use main species in the fishery in assignment 2 (choose at least three) What is their productivityresilience to fishing
What characteristics are used to assess thisbull Size longevity reproduction feeding spatial behaviour
What is the turnover time (PB = Z = r)
Use Fishbase to find out these characteristics What indicators
What datainformation is needed Who haswhere is this information available
Aquaculture amp Fisheries Group Wageningen University
2112011
39
Fishing pressure fish communities and system stability
Physical environment
Ecosystems
Fish communities
Fishing techniques
Fisheries management
Economics
Administration
Env
ironm
ent
Change in Fish Communities Fishing Environment
Size of individual fish
Competition
Predation
Detrivores Herbivores Zooplanktivores etc
Piscivores
Fishing pressure
Aquaculture amp Fisheries Group Wageningen University
2112011
40
Change in Fish Communities Fishing Environment
Piscivores
Size of individual fish
Competition
Predation
Detrivores Herbivores Zooplanktivores etc
Fishing pressure
driving force
Drivers climate wind waterlevel droughts upwelling eutrophication
Fish Communities ndash population regulation
Constant systems
Pulsed systems
Population regulation
nonselective catastrophic mortality
(environmentdominant)
selective mortality (predation competitiondominant)
environment determines prevailing mortality pattern
Aquaculture amp Fisheries Group Wageningen University
2112011
41
Most ecological processes and life history traits can be related to the prevailing mortality pattern
Life history and natural selection
0
20
40
60
80
100
0 1 2 3 4 5 6 7 8
Relative age (years)
Abu
ndan
ce (
N)
but large fish have more eggs
50 cm = 1 mill eggs 100 cm = 16 mill eggs
Age at 50 maturity
Young fish are supposed to die only a fraction will spawn
Aquaculture amp Fisheries Group Wageningen University
2112011
42
Fishing mortality
Age (years)
Inst
anta
neou
s ra
te o
f m
orta
lity
Predation mortality
From ICES (1997)
is almost exactly oppositeSelectivity predation versus fishing
Management promotes harvesting patterns that is opposite to what most fish stock are naturally adapted to
effort
Age and size structure changesunder selective fishing to younger and smaller individuals
A sign of fishing hellip
Aquaculture amp Fisheries Group Wageningen University
2112011
43
Median age-at-maturation of Northeast Arctic cod (Joslashrgensen 1990 Jorgensen et al 2007 Science Conover et al )
and this is what happens
Fishery induced evolution (nr species)
Maturity lower age (6)
Maturity lower size (7)
Reduced growth (6)
Increase fecundity (3)
Loss genetic div (3)
Leading to lower yields
Small
Random
Large
Increased mortality on
Mean individual weight at age after 4 generations
Evidence Size selection (Growth)
= genetic changes
After Conover and Munch 2002Atlantic silverside Menidia menidia max age=2 years R= PDT lt15 months r=58
Aquaculture amp Fisheries Group Wageningen University
2112011
44
Effect of sizeselective fishing (Yield)
Trends in average total weight harvested across multiple generations of size-selective exploitation
Mortality on
Size selective fishing with large mesh sizes on adults We are deliberately pushing stocks to genetically
stable smaller sizes
Small
Random
Large
The rK selection principle the effects of selective
fishing
Age (size)
Abu
ndan
ce (L
og N
)
Slope = total mortality rate Z = r
Increased juvenile mortality= K-selection
Increased adult mortality= r-selection
r-selection Unstable environment abiotic mortality ndash non-predictive non-selectiveK-selection Stable environment biotic mortality (predation) ndash predictive size selective
Aquaculture amp Fisheries Group Wageningen University
2112011
45
Abundance size spectra
Abu
ndan
ce
Size
The distribution of abundance by size follows regular patterns
slope steepens when large fish removed
phytoplankton
zooplankton
small fish
big fish
Year
1976 1978 1980 1982 1984 1986 1988 1990 1992 1994
Slo
pe
-10
-9
-8
-7
-6
-5
Rice amp Gislason (1996)
Trends in size-spectrum slopes of the North Sea
Fishing effects on community sizestructure
Aquaculture amp Fisheries Group Wageningen University
2112011
46
Question
How do you fish a multispecies community
Selective ndash Targeting large sizes with single gears
Unselective ndash Targeting all sizes with many gears
Multispecies community
How should it be harvested
What should be minimum mesh-size
Aquaculture amp Fisheries Group Wageningen University
2112011
47
Selective fishing will change the slope
Biomasssize distributions
Example from lake Kariba Zambiawhere fishers are using illegal smallmeshed nets
The system remains unchanged except everything is less
Kolding et al 2003
Parallel slopes only intercept lower
Aquaculture amp Fisheries Group Wageningen University
2112011
48
2
3
4
5
Tro
phic
leve
l
Pauly et al (1998)
Fishing down the food web
Example from Lake Volta Ghana
The whole fish community is targeted highly pulsed system
highly dynamic fishery (spatial temporal movements fishermen)
27 fishing methods
25 kgday
74 species utilized
All trophic levels utilized by combining gears with specific trophic profiles 1 2 3 4 5Trophic level
Gears in the fishery ( species sample size)
Van Zwieten et al 2008
Aquaculture amp Fisheries Group Wageningen University
2112011
49
Is nonselective fishing bad
There is no empirical evidence
On the contrary we know that selective fishing is bad but we still advocate it
But how do we impose gear mesh and size restrictions in a multispecies fishery
The optimum fishing pattern is un-selective How much
How
Is fishing down the food web bad
Where is the highest production
Sohellip what is the best fishing pattern
What if we fish everything
A non-selective harvesting pattern is ecosystem conserving
The system remains intact but everything is less
This means fishing down the food-web
Aquaculture amp Fisheries Group Wageningen University
2112011
50
Indicators ndash biomass size distribution
Size of individual fish
Biomass Unexploited Population = Blt40
Maximum length = Lmax10
Fishing pressure
Mean length exploited population = L5
Biomass Exploited Population = Bgt40
Mean length total= Lmean
Intercept = Iasd
Assignment 4 Fishing down my situation
Characterise your fishery Single species single gear ndash multigear
Specific target species ndash all species are targeted (multispecies)
Specific size ndash all sizes (quantify)
Is there a shift from large specimen to small
Is there a shift from large species ndash to small Is there a shift in trophic level
What information is needed What indicators
Where to get this information
Aquaculture amp Fisheries Group Wageningen University
2112011
51
Dynamics of fishing ndash stabilise catch variability
Physical environment
Ecosystems
Fish communities
Fishing techniques
Fisheries management
Economics
Administration
Env
ironm
ent
Diversity in methods ndash small units adaptive
Hook and line fisherman
Lake Jaba Nigeria
Trap fishermen
Lake Mweru Zambia
Aquaculture amp Fisheries Group Wageningen University
2112011
52
Labor intensive beach seining on demersals
Small fish common Chilimira seine small pelagics
Aquaculture amp Fisheries Group Wageningen University
2112011
53
Innovative Nkacha seine small demersals
Unevenly distributed ndash important gears lake Mweru
Aquaculture amp Fisheries Group Wageningen University
2112011
54
Highly mobile ndash movement fishermen Lake Malawi
movement one fisherman in 6 months
SE Arm of Lake Malawi
Characteristics of smallscale fisheries
Small units simple processing small scale trading
Methods diverse innovative labor intensive
Opportunistic adaptive
Large subsistence element (small fish)
Unevenly distributed highly mobile
Aquaculture amp Fisheries Group Wageningen University
2112011
55
Fishing mortality (F)
number of units
efficiency
Effort (f)
Catchability (q)Fishing mortality (F)
More of the same
Decreasing numbers = management
Better methods = Increasing efficiency
=development
So while we both lsquomanagersquo and lsquodeveloprsquo the fishing mortality stays the same
Uh
Tradeoffs Economic efficiency vs employment
opportunities
0
20
40
60
80
100
120
140
160
180
1945 1950 1955 1960 1965 1970 1975 1980 1985 1990 1995 2000 2005
Fish
erm
en (
1000
)
Cat
ch p
er
fishe
rman
(to
ns)
0
500000
1000000
1500000
2000000
2500000
3000000
3500000
4000000
Qua
ntity
(to
ns)
Quantity (tons) Fishermen (1000) Catch (tons) per fisherman
Total catch numbers of fishers amp catch per fisherman in the Norwegian fishery 1945-2005
Effort (f) decreases while CpUE increases because catchability (q = efficiency) increases
Aquaculture amp Fisheries Group Wageningen University
2112011
56
Assignment 5 Dynamics fishery ndash my situation
How has fishing effort developed over time In terms of numbers (fishermen boats)
In terms of gears bull Types
bull Active ndash passive methods
In terms of spatial distribution
In terms of trophic levels
What informationdata needed What indicators
Who haswhere is this information
Goal
Apply a systems approach to fishery information ndashdevise indicators System
bull Understand the role of environment and fishing as sources of population regulation (mortality)
Species Stocksbull Understand that different species have different resilience to fishing
bull Understand r K principle
Selectivity ndash Catch and effortbull Discuss the consequences of selective and unselective fishing on fish
communities
bull Understand the characteristics of small scale fisheries
Aquaculture amp Fisheries Group Wageningen University
2112011
57
Summary All species and systems ndash important sets of
indicators
Effort (numbers types)
Species (composition in catch)
Catch (by species total)
Catch per unit Effort (~relative biomass)
Length (in catch at maturity)
Drivers (as explanatory factor)
copy Wageningen UR
End hellipbeginning
Aquaculture amp Fisheries Group Wageningen University
2112011
58
Summary environment species resilience management Life history strategy Opportunistic Periodic Equilibrium Environment Temporally stochastic
with small-scale patches
Seasonal with large-scale patches
Stable with fine-scaled spatial variation
Demographic trade-off 1 age at maturity 2 fecundity 3 juvenile survivorship
low low low
high high low
high low high
Demographic character Maximise (re)colonising capability of habitats over small spatial scales
Maximise age-specific fecundity spreading of reproductive effort over many years andor large areas
Maximise juvenile survivorship in resource limited density-dependent environments
Life history traits - size - age at maturity - size at maturity - clutch size - egg size - larvalYOY growth - reproductive season - parental care
Small Early Small Small Small Rapid Long No
Large Delayed Mediumlarge Large Small Rapid Short No
Smallmedium Delayed Medium Small Large Slow Long Yes
- Maintain critical minimum spawning biomass
- Maintain appropriate age structure (including large specimen)
- Maintenance of adult stock
Primary management objectives
- Protection against large scale or chronic perturbations that eliminate key refugia in space and time
- Spatial refuges directed at adult stock (including spawning habitats and migration routes)
- Maintain integrity of adult habitat
Environment
Demographic trade-offs
Life history traits
Management objectives

Aquaculture amp Fisheries Group Wageningen University
2112011
34
Three basic life history strategiesGrowth
(population)
SurvivalFecundity
Opportunist strategist small shortliving early maturing fish asymp rselected
Periodic strategist high fecundity longer lifespan
Equilibrium strategist medium size some parental care few but larger offspring asymp Kselected
Winemiller and Rose 1992
King and McFarlane 2003
Intermediate strategist
Opportunistic strategist
Early maturing fish frequent reproduction extended spawning period rapid larval growth high population turnover rate (PB = Z = r) eg mosquito fish Marginal habitats (eg like terrestrialaquatic ecotone)
More common in tropical freshwaters
Rarely exploited (small size) otherwise no management needed but to protect founder populations
Aquaculture amp Fisheries Group Wageningen University
2112011
35
Equilibrium strategist
Large adult body size parental care behaviour
Tropical (stable) fresh waters coral reefs (K)
Density dependent processes and resource limitation
Management maintenance of a productive environment and a healthy adult stocks
Periodic strategist
Maximises age specific fecundity at the expense of juvenile survivorship
If favorable conditions for immatures = periodic synchronous reproduction in phase with periodicity of large numbers
of small offspring
Weak stock recruitment relationships
Management maintain a critical density of adults stocks Protect spawning season andor habitat
Aquaculture amp Fisheries Group Wageningen University
2112011
36
Fishbase species resilience to fishing pressure life
history
Three categories of species resilience to fishing Very lowlow ndash medium ndash high
Based on lifehistory characteristics reproduction feeding and spatial behavior
Through the effects of survival fecundity and growth
trophic position
migratory behaviour
See FishBase wwwfishbaseorg
Lake Mweru ndash Mormyrops anguilloides
Resilience Low
Minimum population doubling time = generation time 8 years
Life span 24 years
Max length 150 cm
Lengthage2at2maturity 65 cm 5 years
Trophic level 36
Migratory no
Intermediateperiodic
Aquaculture amp Fisheries Group Wageningen University
2112011
37
Lake Mweru Hydrocynus vittatus
Resilience Mediumlow
Generation time 3 years
Life span 11 years
Max length 105 cm FL
Lengthage2at2maturity 42 cm 2years
Trophic level 44
Migratory yes spawning migrations
Periodic
Lake Mweru Oreochromis mweruensis
Lake Mweru
Resilience High
Minimum population doubling time lt 15 months
Life span 11 years
Max length 40 cm
Lengthage2at2maturity 15 cm 1year
Trophic level 20
Migratory no
Intermediate opportunistc
Aquaculture amp Fisheries Group Wageningen University
2112011
38
Lake Mweru Microthrissa moeruensis
bull Z = PB ~ 5 ndash 7
Resilience High
Generation time 6 months
Life span 25 years
Max length 5 cm
Lengthage2at2first maturity 3 cm04 year
Trophic level 20 ndash 30
Migratory no
Lake MweruOpportunistic
Assignment 3 Resilience to fishing my situation
Use main species in the fishery in assignment 2 (choose at least three) What is their productivityresilience to fishing
What characteristics are used to assess thisbull Size longevity reproduction feeding spatial behaviour
What is the turnover time (PB = Z = r)
Use Fishbase to find out these characteristics What indicators
What datainformation is needed Who haswhere is this information available
Aquaculture amp Fisheries Group Wageningen University
2112011
39
Fishing pressure fish communities and system stability
Physical environment
Ecosystems
Fish communities
Fishing techniques
Fisheries management
Economics
Administration
Env
ironm
ent
Change in Fish Communities Fishing Environment
Size of individual fish
Competition
Predation
Detrivores Herbivores Zooplanktivores etc
Piscivores
Fishing pressure
Aquaculture amp Fisheries Group Wageningen University
2112011
40
Change in Fish Communities Fishing Environment
Piscivores
Size of individual fish
Competition
Predation
Detrivores Herbivores Zooplanktivores etc
Fishing pressure
driving force
Drivers climate wind waterlevel droughts upwelling eutrophication
Fish Communities ndash population regulation
Constant systems
Pulsed systems
Population regulation
nonselective catastrophic mortality
(environmentdominant)
selective mortality (predation competitiondominant)
environment determines prevailing mortality pattern
Aquaculture amp Fisheries Group Wageningen University
2112011
41
Most ecological processes and life history traits can be related to the prevailing mortality pattern
Life history and natural selection
0
20
40
60
80
100
0 1 2 3 4 5 6 7 8
Relative age (years)
Abu
ndan
ce (
N)
but large fish have more eggs
50 cm = 1 mill eggs 100 cm = 16 mill eggs
Age at 50 maturity
Young fish are supposed to die only a fraction will spawn
Aquaculture amp Fisheries Group Wageningen University
2112011
42
Fishing mortality
Age (years)
Inst
anta
neou
s ra
te o
f m
orta
lity
Predation mortality
From ICES (1997)
is almost exactly oppositeSelectivity predation versus fishing
Management promotes harvesting patterns that is opposite to what most fish stock are naturally adapted to
effort
Age and size structure changesunder selective fishing to younger and smaller individuals
A sign of fishing hellip
Aquaculture amp Fisheries Group Wageningen University
2112011
43
Median age-at-maturation of Northeast Arctic cod (Joslashrgensen 1990 Jorgensen et al 2007 Science Conover et al )
and this is what happens
Fishery induced evolution (nr species)
Maturity lower age (6)
Maturity lower size (7)
Reduced growth (6)
Increase fecundity (3)
Loss genetic div (3)
Leading to lower yields
Small
Random
Large
Increased mortality on
Mean individual weight at age after 4 generations
Evidence Size selection (Growth)
= genetic changes
After Conover and Munch 2002Atlantic silverside Menidia menidia max age=2 years R= PDT lt15 months r=58
Aquaculture amp Fisheries Group Wageningen University
2112011
44
Effect of sizeselective fishing (Yield)
Trends in average total weight harvested across multiple generations of size-selective exploitation
Mortality on
Size selective fishing with large mesh sizes on adults We are deliberately pushing stocks to genetically
stable smaller sizes
Small
Random
Large
The rK selection principle the effects of selective
fishing
Age (size)
Abu
ndan
ce (L
og N
)
Slope = total mortality rate Z = r
Increased juvenile mortality= K-selection
Increased adult mortality= r-selection
r-selection Unstable environment abiotic mortality ndash non-predictive non-selectiveK-selection Stable environment biotic mortality (predation) ndash predictive size selective
Aquaculture amp Fisheries Group Wageningen University
2112011
45
Abundance size spectra
Abu
ndan
ce
Size
The distribution of abundance by size follows regular patterns
slope steepens when large fish removed
phytoplankton
zooplankton
small fish
big fish
Year
1976 1978 1980 1982 1984 1986 1988 1990 1992 1994
Slo
pe
-10
-9
-8
-7
-6
-5
Rice amp Gislason (1996)
Trends in size-spectrum slopes of the North Sea
Fishing effects on community sizestructure
Aquaculture amp Fisheries Group Wageningen University
2112011
46
Question
How do you fish a multispecies community
Selective ndash Targeting large sizes with single gears
Unselective ndash Targeting all sizes with many gears
Multispecies community
How should it be harvested
What should be minimum mesh-size
Aquaculture amp Fisheries Group Wageningen University
2112011
47
Selective fishing will change the slope
Biomasssize distributions
Example from lake Kariba Zambiawhere fishers are using illegal smallmeshed nets
The system remains unchanged except everything is less
Kolding et al 2003
Parallel slopes only intercept lower
Aquaculture amp Fisheries Group Wageningen University
2112011
48
2
3
4
5
Tro
phic
leve
l
Pauly et al (1998)
Fishing down the food web
Example from Lake Volta Ghana
The whole fish community is targeted highly pulsed system
highly dynamic fishery (spatial temporal movements fishermen)
27 fishing methods
25 kgday
74 species utilized
All trophic levels utilized by combining gears with specific trophic profiles 1 2 3 4 5Trophic level
Gears in the fishery ( species sample size)
Van Zwieten et al 2008
Aquaculture amp Fisheries Group Wageningen University
2112011
49
Is nonselective fishing bad
There is no empirical evidence
On the contrary we know that selective fishing is bad but we still advocate it
But how do we impose gear mesh and size restrictions in a multispecies fishery
The optimum fishing pattern is un-selective How much
How
Is fishing down the food web bad
Where is the highest production
Sohellip what is the best fishing pattern
What if we fish everything
A non-selective harvesting pattern is ecosystem conserving
The system remains intact but everything is less
This means fishing down the food-web
Aquaculture amp Fisheries Group Wageningen University
2112011
50
Indicators ndash biomass size distribution
Size of individual fish
Biomass Unexploited Population = Blt40
Maximum length = Lmax10
Fishing pressure
Mean length exploited population = L5
Biomass Exploited Population = Bgt40
Mean length total= Lmean
Intercept = Iasd
Assignment 4 Fishing down my situation
Characterise your fishery Single species single gear ndash multigear
Specific target species ndash all species are targeted (multispecies)
Specific size ndash all sizes (quantify)
Is there a shift from large specimen to small
Is there a shift from large species ndash to small Is there a shift in trophic level
What information is needed What indicators
Where to get this information
Aquaculture amp Fisheries Group Wageningen University
2112011
51
Dynamics of fishing ndash stabilise catch variability
Physical environment
Ecosystems
Fish communities
Fishing techniques
Fisheries management
Economics
Administration
Env
ironm
ent
Diversity in methods ndash small units adaptive
Hook and line fisherman
Lake Jaba Nigeria
Trap fishermen
Lake Mweru Zambia
Aquaculture amp Fisheries Group Wageningen University
2112011
52
Labor intensive beach seining on demersals
Small fish common Chilimira seine small pelagics
Aquaculture amp Fisheries Group Wageningen University
2112011
53
Innovative Nkacha seine small demersals
Unevenly distributed ndash important gears lake Mweru
Aquaculture amp Fisheries Group Wageningen University
2112011
54
Highly mobile ndash movement fishermen Lake Malawi
movement one fisherman in 6 months
SE Arm of Lake Malawi
Characteristics of smallscale fisheries
Small units simple processing small scale trading
Methods diverse innovative labor intensive
Opportunistic adaptive
Large subsistence element (small fish)
Unevenly distributed highly mobile
Aquaculture amp Fisheries Group Wageningen University
2112011
55
Fishing mortality (F)
number of units
efficiency
Effort (f)
Catchability (q)Fishing mortality (F)
More of the same
Decreasing numbers = management
Better methods = Increasing efficiency
=development
So while we both lsquomanagersquo and lsquodeveloprsquo the fishing mortality stays the same
Uh
Tradeoffs Economic efficiency vs employment
opportunities
0
20
40
60
80
100
120
140
160
180
1945 1950 1955 1960 1965 1970 1975 1980 1985 1990 1995 2000 2005
Fish
erm
en (
1000
)
Cat
ch p
er
fishe
rman
(to
ns)
0
500000
1000000
1500000
2000000
2500000
3000000
3500000
4000000
Qua
ntity
(to
ns)
Quantity (tons) Fishermen (1000) Catch (tons) per fisherman
Total catch numbers of fishers amp catch per fisherman in the Norwegian fishery 1945-2005
Effort (f) decreases while CpUE increases because catchability (q = efficiency) increases
Aquaculture amp Fisheries Group Wageningen University
2112011
56
Assignment 5 Dynamics fishery ndash my situation
How has fishing effort developed over time In terms of numbers (fishermen boats)
In terms of gears bull Types
bull Active ndash passive methods
In terms of spatial distribution
In terms of trophic levels
What informationdata needed What indicators
Who haswhere is this information
Goal
Apply a systems approach to fishery information ndashdevise indicators System
bull Understand the role of environment and fishing as sources of population regulation (mortality)
Species Stocksbull Understand that different species have different resilience to fishing
bull Understand r K principle
Selectivity ndash Catch and effortbull Discuss the consequences of selective and unselective fishing on fish
communities
bull Understand the characteristics of small scale fisheries
Aquaculture amp Fisheries Group Wageningen University
2112011
57
Summary All species and systems ndash important sets of
indicators
Effort (numbers types)
Species (composition in catch)
Catch (by species total)
Catch per unit Effort (~relative biomass)
Length (in catch at maturity)
Drivers (as explanatory factor)
copy Wageningen UR
End hellipbeginning
Aquaculture amp Fisheries Group Wageningen University
2112011
58
Summary environment species resilience management Life history strategy Opportunistic Periodic Equilibrium Environment Temporally stochastic
with small-scale patches
Seasonal with large-scale patches
Stable with fine-scaled spatial variation
Demographic trade-off 1 age at maturity 2 fecundity 3 juvenile survivorship
low low low
high high low
high low high
Demographic character Maximise (re)colonising capability of habitats over small spatial scales
Maximise age-specific fecundity spreading of reproductive effort over many years andor large areas
Maximise juvenile survivorship in resource limited density-dependent environments
Life history traits - size - age at maturity - size at maturity - clutch size - egg size - larvalYOY growth - reproductive season - parental care
Small Early Small Small Small Rapid Long No
Large Delayed Mediumlarge Large Small Rapid Short No
Smallmedium Delayed Medium Small Large Slow Long Yes
- Maintain critical minimum spawning biomass
- Maintain appropriate age structure (including large specimen)
- Maintenance of adult stock
Primary management objectives
- Protection against large scale or chronic perturbations that eliminate key refugia in space and time
- Spatial refuges directed at adult stock (including spawning habitats and migration routes)
- Maintain integrity of adult habitat
Environment
Demographic trade-offs
Life history traits
Management objectives
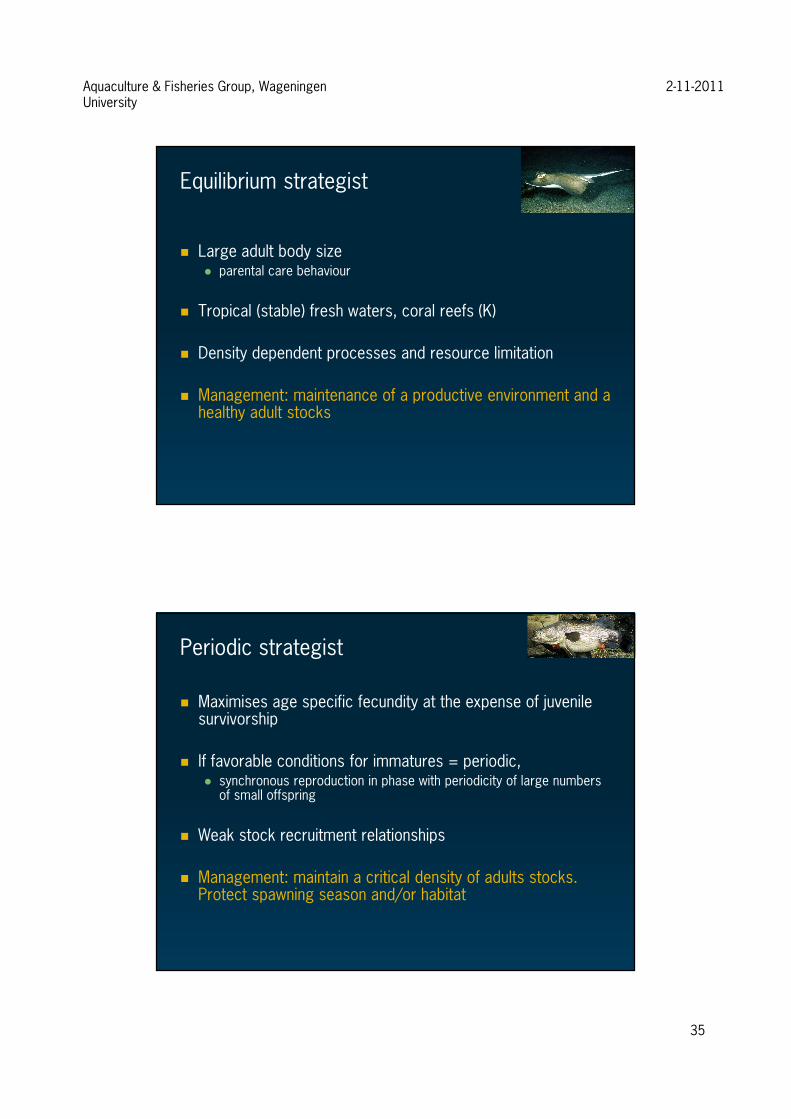
Aquaculture amp Fisheries Group Wageningen University
2112011
39
Fishing pressure fish communities and system stability
Physical environment
Ecosystems
Fish communities
Fishing techniques
Fisheries management
Economics
Administration
Env
ironm
ent
Change in Fish Communities Fishing Environment
Size of individual fish
Competition
Predation
Detrivores Herbivores Zooplanktivores etc
Piscivores
Fishing pressure
Aquaculture amp Fisheries Group Wageningen University
2112011
40
Change in Fish Communities Fishing Environment
Piscivores
Size of individual fish
Competition
Predation
Detrivores Herbivores Zooplanktivores etc
Fishing pressure
driving force
Drivers climate wind waterlevel droughts upwelling eutrophication
Fish Communities ndash population regulation
Constant systems
Pulsed systems
Population regulation
nonselective catastrophic mortality
(environmentdominant)
selective mortality (predation competitiondominant)
environment determines prevailing mortality pattern
Aquaculture amp Fisheries Group Wageningen University
2112011
41
Most ecological processes and life history traits can be related to the prevailing mortality pattern
Life history and natural selection
0
20
40
60
80
100
0 1 2 3 4 5 6 7 8
Relative age (years)
Abu
ndan
ce (
N)
but large fish have more eggs
50 cm = 1 mill eggs 100 cm = 16 mill eggs
Age at 50 maturity
Young fish are supposed to die only a fraction will spawn
Aquaculture amp Fisheries Group Wageningen University
2112011
42
Fishing mortality
Age (years)
Inst
anta
neou
s ra
te o
f m
orta
lity
Predation mortality
From ICES (1997)
is almost exactly oppositeSelectivity predation versus fishing
Management promotes harvesting patterns that is opposite to what most fish stock are naturally adapted to
effort
Age and size structure changesunder selective fishing to younger and smaller individuals
A sign of fishing hellip
Aquaculture amp Fisheries Group Wageningen University
2112011
43
Median age-at-maturation of Northeast Arctic cod (Joslashrgensen 1990 Jorgensen et al 2007 Science Conover et al )
and this is what happens
Fishery induced evolution (nr species)
Maturity lower age (6)
Maturity lower size (7)
Reduced growth (6)
Increase fecundity (3)
Loss genetic div (3)
Leading to lower yields
Small
Random
Large
Increased mortality on
Mean individual weight at age after 4 generations
Evidence Size selection (Growth)
= genetic changes
After Conover and Munch 2002Atlantic silverside Menidia menidia max age=2 years R= PDT lt15 months r=58
Aquaculture amp Fisheries Group Wageningen University
2112011
44
Effect of sizeselective fishing (Yield)
Trends in average total weight harvested across multiple generations of size-selective exploitation
Mortality on
Size selective fishing with large mesh sizes on adults We are deliberately pushing stocks to genetically
stable smaller sizes
Small
Random
Large
The rK selection principle the effects of selective
fishing
Age (size)
Abu
ndan
ce (L
og N
)
Slope = total mortality rate Z = r
Increased juvenile mortality= K-selection
Increased adult mortality= r-selection
r-selection Unstable environment abiotic mortality ndash non-predictive non-selectiveK-selection Stable environment biotic mortality (predation) ndash predictive size selective
Aquaculture amp Fisheries Group Wageningen University
2112011
45
Abundance size spectra
Abu
ndan
ce
Size
The distribution of abundance by size follows regular patterns
slope steepens when large fish removed
phytoplankton
zooplankton
small fish
big fish
Year
1976 1978 1980 1982 1984 1986 1988 1990 1992 1994
Slo
pe
-10
-9
-8
-7
-6
-5
Rice amp Gislason (1996)
Trends in size-spectrum slopes of the North Sea
Fishing effects on community sizestructure
Aquaculture amp Fisheries Group Wageningen University
2112011
46
Question
How do you fish a multispecies community
Selective ndash Targeting large sizes with single gears
Unselective ndash Targeting all sizes with many gears
Multispecies community
How should it be harvested
What should be minimum mesh-size
Aquaculture amp Fisheries Group Wageningen University
2112011
47
Selective fishing will change the slope
Biomasssize distributions
Example from lake Kariba Zambiawhere fishers are using illegal smallmeshed nets
The system remains unchanged except everything is less
Kolding et al 2003
Parallel slopes only intercept lower
Aquaculture amp Fisheries Group Wageningen University
2112011
48
2
3
4
5
Tro
phic
leve
l
Pauly et al (1998)
Fishing down the food web
Example from Lake Volta Ghana
The whole fish community is targeted highly pulsed system
highly dynamic fishery (spatial temporal movements fishermen)
27 fishing methods
25 kgday
74 species utilized
All trophic levels utilized by combining gears with specific trophic profiles 1 2 3 4 5Trophic level
Gears in the fishery ( species sample size)
Van Zwieten et al 2008
Aquaculture amp Fisheries Group Wageningen University
2112011
49
Is nonselective fishing bad
There is no empirical evidence
On the contrary we know that selective fishing is bad but we still advocate it
But how do we impose gear mesh and size restrictions in a multispecies fishery
The optimum fishing pattern is un-selective How much
How
Is fishing down the food web bad
Where is the highest production
Sohellip what is the best fishing pattern
What if we fish everything
A non-selective harvesting pattern is ecosystem conserving
The system remains intact but everything is less
This means fishing down the food-web
Aquaculture amp Fisheries Group Wageningen University
2112011
50
Indicators ndash biomass size distribution
Size of individual fish
Biomass Unexploited Population = Blt40
Maximum length = Lmax10
Fishing pressure
Mean length exploited population = L5
Biomass Exploited Population = Bgt40
Mean length total= Lmean
Intercept = Iasd
Assignment 4 Fishing down my situation
Characterise your fishery Single species single gear ndash multigear
Specific target species ndash all species are targeted (multispecies)
Specific size ndash all sizes (quantify)
Is there a shift from large specimen to small
Is there a shift from large species ndash to small Is there a shift in trophic level
What information is needed What indicators
Where to get this information
Aquaculture amp Fisheries Group Wageningen University
2112011
51
Dynamics of fishing ndash stabilise catch variability
Physical environment
Ecosystems
Fish communities
Fishing techniques
Fisheries management
Economics
Administration
Env
ironm
ent
Diversity in methods ndash small units adaptive
Hook and line fisherman
Lake Jaba Nigeria
Trap fishermen
Lake Mweru Zambia
Aquaculture amp Fisheries Group Wageningen University
2112011
52
Labor intensive beach seining on demersals
Small fish common Chilimira seine small pelagics
Aquaculture amp Fisheries Group Wageningen University
2112011
53
Innovative Nkacha seine small demersals
Unevenly distributed ndash important gears lake Mweru
Aquaculture amp Fisheries Group Wageningen University
2112011
54
Highly mobile ndash movement fishermen Lake Malawi
movement one fisherman in 6 months
SE Arm of Lake Malawi
Characteristics of smallscale fisheries
Small units simple processing small scale trading
Methods diverse innovative labor intensive
Opportunistic adaptive
Large subsistence element (small fish)
Unevenly distributed highly mobile
Aquaculture amp Fisheries Group Wageningen University
2112011
55
Fishing mortality (F)
number of units
efficiency
Effort (f)
Catchability (q)Fishing mortality (F)
More of the same
Decreasing numbers = management
Better methods = Increasing efficiency
=development
So while we both lsquomanagersquo and lsquodeveloprsquo the fishing mortality stays the same
Uh
Tradeoffs Economic efficiency vs employment
opportunities
0
20
40
60
80
100
120
140
160
180
1945 1950 1955 1960 1965 1970 1975 1980 1985 1990 1995 2000 2005
Fish
erm
en (
1000
)
Cat
ch p
er
fishe
rman
(to
ns)
0
500000
1000000
1500000
2000000
2500000
3000000
3500000
4000000
Qua
ntity
(to
ns)
Quantity (tons) Fishermen (1000) Catch (tons) per fisherman
Total catch numbers of fishers amp catch per fisherman in the Norwegian fishery 1945-2005
Effort (f) decreases while CpUE increases because catchability (q = efficiency) increases
Aquaculture amp Fisheries Group Wageningen University
2112011
56
Assignment 5 Dynamics fishery ndash my situation
How has fishing effort developed over time In terms of numbers (fishermen boats)
In terms of gears bull Types
bull Active ndash passive methods
In terms of spatial distribution
In terms of trophic levels
What informationdata needed What indicators
Who haswhere is this information
Goal
Apply a systems approach to fishery information ndashdevise indicators System
bull Understand the role of environment and fishing as sources of population regulation (mortality)
Species Stocksbull Understand that different species have different resilience to fishing
bull Understand r K principle
Selectivity ndash Catch and effortbull Discuss the consequences of selective and unselective fishing on fish
communities
bull Understand the characteristics of small scale fisheries
Aquaculture amp Fisheries Group Wageningen University
2112011
57
Summary All species and systems ndash important sets of
indicators
Effort (numbers types)
Species (composition in catch)
Catch (by species total)
Catch per unit Effort (~relative biomass)
Length (in catch at maturity)
Drivers (as explanatory factor)
copy Wageningen UR
End hellipbeginning
Aquaculture amp Fisheries Group Wageningen University
2112011
58
Summary environment species resilience management Life history strategy Opportunistic Periodic Equilibrium Environment Temporally stochastic
with small-scale patches
Seasonal with large-scale patches
Stable with fine-scaled spatial variation
Demographic trade-off 1 age at maturity 2 fecundity 3 juvenile survivorship
low low low
high high low
high low high
Demographic character Maximise (re)colonising capability of habitats over small spatial scales
Maximise age-specific fecundity spreading of reproductive effort over many years andor large areas
Maximise juvenile survivorship in resource limited density-dependent environments
Life history traits - size - age at maturity - size at maturity - clutch size - egg size - larvalYOY growth - reproductive season - parental care
Small Early Small Small Small Rapid Long No
Large Delayed Mediumlarge Large Small Rapid Short No
Smallmedium Delayed Medium Small Large Slow Long Yes
- Maintain critical minimum spawning biomass
- Maintain appropriate age structure (including large specimen)
- Maintenance of adult stock
Primary management objectives
- Protection against large scale or chronic perturbations that eliminate key refugia in space and time
- Spatial refuges directed at adult stock (including spawning habitats and migration routes)
- Maintain integrity of adult habitat
Environment
Demographic trade-offs
Life history traits
Management objectives
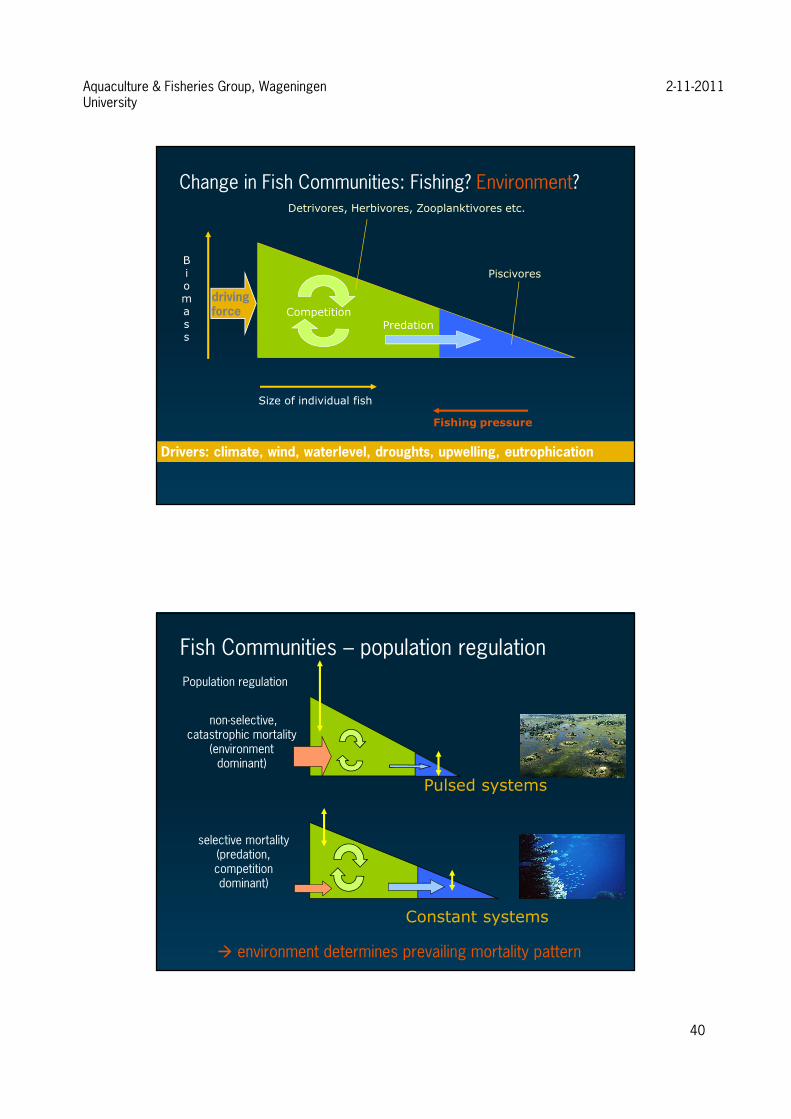
Aquaculture amp Fisheries Group Wageningen University
2112011
40
Change in Fish Communities Fishing Environment
Piscivores
Size of individual fish
Competition
Predation
Detrivores Herbivores Zooplanktivores etc
Fishing pressure
driving force
Drivers climate wind waterlevel droughts upwelling eutrophication
Fish Communities ndash population regulation
Constant systems
Pulsed systems
Population regulation
nonselective catastrophic mortality
(environmentdominant)
selective mortality (predation competitiondominant)
environment determines prevailing mortality pattern
Aquaculture amp Fisheries Group Wageningen University
2112011
41
Most ecological processes and life history traits can be related to the prevailing mortality pattern
Life history and natural selection
0
20
40
60
80
100
0 1 2 3 4 5 6 7 8
Relative age (years)
Abu
ndan
ce (
N)
but large fish have more eggs
50 cm = 1 mill eggs 100 cm = 16 mill eggs
Age at 50 maturity
Young fish are supposed to die only a fraction will spawn
Aquaculture amp Fisheries Group Wageningen University
2112011
42
Fishing mortality
Age (years)
Inst
anta
neou
s ra
te o
f m
orta
lity
Predation mortality
From ICES (1997)
is almost exactly oppositeSelectivity predation versus fishing
Management promotes harvesting patterns that is opposite to what most fish stock are naturally adapted to
effort
Age and size structure changesunder selective fishing to younger and smaller individuals
A sign of fishing hellip
Aquaculture amp Fisheries Group Wageningen University
2112011
43
Median age-at-maturation of Northeast Arctic cod (Joslashrgensen 1990 Jorgensen et al 2007 Science Conover et al )
and this is what happens
Fishery induced evolution (nr species)
Maturity lower age (6)
Maturity lower size (7)
Reduced growth (6)
Increase fecundity (3)
Loss genetic div (3)
Leading to lower yields
Small
Random
Large
Increased mortality on
Mean individual weight at age after 4 generations
Evidence Size selection (Growth)
= genetic changes
After Conover and Munch 2002Atlantic silverside Menidia menidia max age=2 years R= PDT lt15 months r=58
Aquaculture amp Fisheries Group Wageningen University
2112011
44
Effect of sizeselective fishing (Yield)
Trends in average total weight harvested across multiple generations of size-selective exploitation
Mortality on
Size selective fishing with large mesh sizes on adults We are deliberately pushing stocks to genetically
stable smaller sizes
Small
Random
Large
The rK selection principle the effects of selective
fishing
Age (size)
Abu
ndan
ce (L
og N
)
Slope = total mortality rate Z = r
Increased juvenile mortality= K-selection
Increased adult mortality= r-selection
r-selection Unstable environment abiotic mortality ndash non-predictive non-selectiveK-selection Stable environment biotic mortality (predation) ndash predictive size selective
Aquaculture amp Fisheries Group Wageningen University
2112011
45
Abundance size spectra
Abu
ndan
ce
Size
The distribution of abundance by size follows regular patterns
slope steepens when large fish removed
phytoplankton
zooplankton
small fish
big fish
Year
1976 1978 1980 1982 1984 1986 1988 1990 1992 1994
Slo
pe
-10
-9
-8
-7
-6
-5
Rice amp Gislason (1996)
Trends in size-spectrum slopes of the North Sea
Fishing effects on community sizestructure
Aquaculture amp Fisheries Group Wageningen University
2112011
46
Question
How do you fish a multispecies community
Selective ndash Targeting large sizes with single gears
Unselective ndash Targeting all sizes with many gears
Multispecies community
How should it be harvested
What should be minimum mesh-size
Aquaculture amp Fisheries Group Wageningen University
2112011
47
Selective fishing will change the slope
Biomasssize distributions
Example from lake Kariba Zambiawhere fishers are using illegal smallmeshed nets
The system remains unchanged except everything is less
Kolding et al 2003
Parallel slopes only intercept lower
Aquaculture amp Fisheries Group Wageningen University
2112011
48
2
3
4
5
Tro
phic
leve
l
Pauly et al (1998)
Fishing down the food web
Example from Lake Volta Ghana
The whole fish community is targeted highly pulsed system
highly dynamic fishery (spatial temporal movements fishermen)
27 fishing methods
25 kgday
74 species utilized
All trophic levels utilized by combining gears with specific trophic profiles 1 2 3 4 5Trophic level
Gears in the fishery ( species sample size)
Van Zwieten et al 2008
Aquaculture amp Fisheries Group Wageningen University
2112011
49
Is nonselective fishing bad
There is no empirical evidence
On the contrary we know that selective fishing is bad but we still advocate it
But how do we impose gear mesh and size restrictions in a multispecies fishery
The optimum fishing pattern is un-selective How much
How
Is fishing down the food web bad
Where is the highest production
Sohellip what is the best fishing pattern
What if we fish everything
A non-selective harvesting pattern is ecosystem conserving
The system remains intact but everything is less
This means fishing down the food-web
Aquaculture amp Fisheries Group Wageningen University
2112011
50
Indicators ndash biomass size distribution
Size of individual fish
Biomass Unexploited Population = Blt40
Maximum length = Lmax10
Fishing pressure
Mean length exploited population = L5
Biomass Exploited Population = Bgt40
Mean length total= Lmean
Intercept = Iasd
Assignment 4 Fishing down my situation
Characterise your fishery Single species single gear ndash multigear
Specific target species ndash all species are targeted (multispecies)
Specific size ndash all sizes (quantify)
Is there a shift from large specimen to small
Is there a shift from large species ndash to small Is there a shift in trophic level
What information is needed What indicators
Where to get this information
Aquaculture amp Fisheries Group Wageningen University
2112011
51
Dynamics of fishing ndash stabilise catch variability
Physical environment
Ecosystems
Fish communities
Fishing techniques
Fisheries management
Economics
Administration
Env
ironm
ent
Diversity in methods ndash small units adaptive
Hook and line fisherman
Lake Jaba Nigeria
Trap fishermen
Lake Mweru Zambia
Aquaculture amp Fisheries Group Wageningen University
2112011
52
Labor intensive beach seining on demersals
Small fish common Chilimira seine small pelagics
Aquaculture amp Fisheries Group Wageningen University
2112011
53
Innovative Nkacha seine small demersals
Unevenly distributed ndash important gears lake Mweru
Aquaculture amp Fisheries Group Wageningen University
2112011
54
Highly mobile ndash movement fishermen Lake Malawi
movement one fisherman in 6 months
SE Arm of Lake Malawi
Characteristics of smallscale fisheries
Small units simple processing small scale trading
Methods diverse innovative labor intensive
Opportunistic adaptive
Large subsistence element (small fish)
Unevenly distributed highly mobile
Aquaculture amp Fisheries Group Wageningen University
2112011
55
Fishing mortality (F)
number of units
efficiency
Effort (f)
Catchability (q)Fishing mortality (F)
More of the same
Decreasing numbers = management
Better methods = Increasing efficiency
=development
So while we both lsquomanagersquo and lsquodeveloprsquo the fishing mortality stays the same
Uh
Tradeoffs Economic efficiency vs employment
opportunities
0
20
40
60
80
100
120
140
160
180
1945 1950 1955 1960 1965 1970 1975 1980 1985 1990 1995 2000 2005
Fish
erm
en (
1000
)
Cat
ch p
er
fishe
rman
(to
ns)
0
500000
1000000
1500000
2000000
2500000
3000000
3500000
4000000
Qua
ntity
(to
ns)
Quantity (tons) Fishermen (1000) Catch (tons) per fisherman
Total catch numbers of fishers amp catch per fisherman in the Norwegian fishery 1945-2005
Effort (f) decreases while CpUE increases because catchability (q = efficiency) increases
Aquaculture amp Fisheries Group Wageningen University
2112011
56
Assignment 5 Dynamics fishery ndash my situation
How has fishing effort developed over time In terms of numbers (fishermen boats)
In terms of gears bull Types
bull Active ndash passive methods
In terms of spatial distribution
In terms of trophic levels
What informationdata needed What indicators
Who haswhere is this information
Goal
Apply a systems approach to fishery information ndashdevise indicators System
bull Understand the role of environment and fishing as sources of population regulation (mortality)
Species Stocksbull Understand that different species have different resilience to fishing
bull Understand r K principle
Selectivity ndash Catch and effortbull Discuss the consequences of selective and unselective fishing on fish
communities
bull Understand the characteristics of small scale fisheries
Aquaculture amp Fisheries Group Wageningen University
2112011
57
Summary All species and systems ndash important sets of
indicators
Effort (numbers types)
Species (composition in catch)
Catch (by species total)
Catch per unit Effort (~relative biomass)
Length (in catch at maturity)
Drivers (as explanatory factor)
copy Wageningen UR
End hellipbeginning
Aquaculture amp Fisheries Group Wageningen University
2112011
58
Summary environment species resilience management Life history strategy Opportunistic Periodic Equilibrium Environment Temporally stochastic
with small-scale patches
Seasonal with large-scale patches
Stable with fine-scaled spatial variation
Demographic trade-off 1 age at maturity 2 fecundity 3 juvenile survivorship
low low low
high high low
high low high
Demographic character Maximise (re)colonising capability of habitats over small spatial scales
Maximise age-specific fecundity spreading of reproductive effort over many years andor large areas
Maximise juvenile survivorship in resource limited density-dependent environments
Life history traits - size - age at maturity - size at maturity - clutch size - egg size - larvalYOY growth - reproductive season - parental care
Small Early Small Small Small Rapid Long No
Large Delayed Mediumlarge Large Small Rapid Short No
Smallmedium Delayed Medium Small Large Slow Long Yes
- Maintain critical minimum spawning biomass
- Maintain appropriate age structure (including large specimen)
- Maintenance of adult stock
Primary management objectives
- Protection against large scale or chronic perturbations that eliminate key refugia in space and time
- Spatial refuges directed at adult stock (including spawning habitats and migration routes)
- Maintain integrity of adult habitat
Environment
Demographic trade-offs
Life history traits
Management objectives

Aquaculture amp Fisheries Group Wageningen University
2112011
56
Assignment 5 Dynamics fishery ndash my situation
How has fishing effort developed over time In terms of numbers (fishermen boats)
In terms of gears bull Types
bull Active ndash passive methods
In terms of spatial distribution
In terms of trophic levels
What informationdata needed What indicators
Who haswhere is this information
Goal
Apply a systems approach to fishery information ndashdevise indicators System
bull Understand the role of environment and fishing as sources of population regulation (mortality)
Species Stocksbull Understand that different species have different resilience to fishing
bull Understand r K principle
Selectivity ndash Catch and effortbull Discuss the consequences of selective and unselective fishing on fish
communities
bull Understand the characteristics of small scale fisheries
Aquaculture amp Fisheries Group Wageningen University
2112011
57
Summary All species and systems ndash important sets of
indicators
Effort (numbers types)
Species (composition in catch)
Catch (by species total)
Catch per unit Effort (~relative biomass)
Length (in catch at maturity)
Drivers (as explanatory factor)
copy Wageningen UR
End hellipbeginning
Aquaculture amp Fisheries Group Wageningen University
2112011
58
Summary environment species resilience management Life history strategy Opportunistic Periodic Equilibrium Environment Temporally stochastic
with small-scale patches
Seasonal with large-scale patches
Stable with fine-scaled spatial variation
Demographic trade-off 1 age at maturity 2 fecundity 3 juvenile survivorship
low low low
high high low
high low high
Demographic character Maximise (re)colonising capability of habitats over small spatial scales
Maximise age-specific fecundity spreading of reproductive effort over many years andor large areas
Maximise juvenile survivorship in resource limited density-dependent environments
Life history traits - size - age at maturity - size at maturity - clutch size - egg size - larvalYOY growth - reproductive season - parental care
Small Early Small Small Small Rapid Long No
Large Delayed Mediumlarge Large Small Rapid Short No
Smallmedium Delayed Medium Small Large Slow Long Yes
- Maintain critical minimum spawning biomass
- Maintain appropriate age structure (including large specimen)
- Maintenance of adult stock
Primary management objectives
- Protection against large scale or chronic perturbations that eliminate key refugia in space and time
- Spatial refuges directed at adult stock (including spawning habitats and migration routes)
- Maintain integrity of adult habitat
Environment
Demographic trade-offs
Life history traits
Management objectives
Aquaculture amp Fisheries Group Wageningen University
2112011
57
Summary All species and systems ndash important sets of
indicators
Effort (numbers types)
Species (composition in catch)
Catch (by species total)
Catch per unit Effort (~relative biomass)
Length (in catch at maturity)
Drivers (as explanatory factor)
copy Wageningen UR
End hellipbeginning
Aquaculture amp Fisheries Group Wageningen University
2112011
58
Summary environment species resilience management Life history strategy Opportunistic Periodic Equilibrium Environment Temporally stochastic
with small-scale patches
Seasonal with large-scale patches
Stable with fine-scaled spatial variation
Demographic trade-off 1 age at maturity 2 fecundity 3 juvenile survivorship
low low low
high high low
high low high
Demographic character Maximise (re)colonising capability of habitats over small spatial scales
Maximise age-specific fecundity spreading of reproductive effort over many years andor large areas
Maximise juvenile survivorship in resource limited density-dependent environments
Life history traits - size - age at maturity - size at maturity - clutch size - egg size - larvalYOY growth - reproductive season - parental care
Small Early Small Small Small Rapid Long No
Large Delayed Mediumlarge Large Small Rapid Short No
Smallmedium Delayed Medium Small Large Slow Long Yes
- Maintain critical minimum spawning biomass
- Maintain appropriate age structure (including large specimen)
- Maintenance of adult stock
Primary management objectives
- Protection against large scale or chronic perturbations that eliminate key refugia in space and time
- Spatial refuges directed at adult stock (including spawning habitats and migration routes)
- Maintain integrity of adult habitat
Environment
Demographic trade-offs
Life history traits
Management objectives