an assessment of heavy metal and pesticide pollution …
TRANSCRIPT

UNIVERSITY OF KWAZULU-NATAL
AN ASSESSMENT OF HEAVY METAL AND
PESTICIDE POLLUTION AT A
COMMERCIAL AIRPORT
By
Bereketeab Tesfagaber Haile
BSc (Asmara)
Submitted in partial fulfillment of the academic requirement for the degree of Master of Science
(Analytical, Environmental and Industrial Chemistry) in the
School of Chemical and Physical Sciences University of KwaZulu-Natal
Pietermaritzburg 2004

ii
DECLARATION
I hereby declare that this work was carried out in full at the School of Chemical and
Physical Sciences, University of KwaZulu-Natal, Pietermaritzburg.
I hereby certify that this investigation, unless otherwise stated, is the result of my own
research.
Signed:
J}T Hade, BSc.
I hereby certify that the above statement is correct.
Signed:
Dr. C Southway Supervisor
Signed: L O Dr. MR Low Co- Supervisor
Pietermaritzburg
June 2004

iii
ACKNOWLEDGEMENT
I would like to thank my supervisor, Dr. C Southway and my co-supervisor Dr. M Low for
their advice, time patience and encouragement throughout this study.
My sincere thanks go to Dr. S. Spank ie for all her support and for being approachable and
sympathetic.
I would also like to thank all staff and postgraduate students, especially Craig Grimmer
and Karen Kader, for their assistance during my studies.
Thanks are due to the staff and tenant companies at Oribi Airport, Pietermaritzburg,
especially Esmaralda Barnes, Riaan Cilliers, Alfie Paterson, Hans van der Pol and Mitch Spall,
for their assistance and useful information related to my studies.
My heartfelt thanks go also to A Simpson, School of Applied Environmental Sciences, for
his input in preparing the maps in this thesis.
I must thank the technical staff of the Soil Science Department, Essack Abib and Tadd
Dorasamy, for their support in the soil texture analysis.
My thanks go to all friends, especially K Fitsum, G Eyob, G Kefali and T Solomon who
have supported and encouraged me throughout my studies.
Thanks are due to the Eritrean Human Resource Development (EHRD) for funding my
studies.
I would like to especially thank my parents, brothers and sisters for all their love,
encouragement, support and patience.

iv
DEDICATION
This work is dedicated to my mother Tsehay Haylom, my father Tesfagaber Haile, my sisters
and brothers for their support, understanding and spiritual encouragement
during my studies.

V
ABSTRACT
An assessment of heavy metal and pesticide pollution was conducted at a commercial
airport in Pietermaritzburg, which is the base for a local crop spraying operation, as well as
a small-scale aircraft maintenance centre. The study investigated the presence of heavy
metals from the aircraft activities (tyre wear, emission and aircraft body attrition) along ftie
edges of the runway. In addition, the study assessed the pollution of the soil in different
parts of the airport (areas adjacent to the crop sprayer hangar and maintenance hangars
drainage ditch) caused by organic chemicals (pesticides) originating from the washing and
maintenance of the crop spraying aircrafts.
A total of 37 samples were taken from the top soil (0-15 cm) adjacent to both sides of the
runway, approximately 100 meters apart, for heavy metal assessment. Total metal
concentrations were determined on a 1:1 HNO3 acid extract analysed using inductively
coupled plasma spectroscopy and the results compared with the baseline concentrations of
heavy metals in the soils of South Africa. The average levels of the heavy metals in the
soils were: Cd - 4.4, Co - 76, Cr - 142, Mn - 6580, Pb - 64 and Zn - 70 mg/kg. The Cd and
Co concentrations of all samples and the Pb and Zn concentrations of 86% of the samples
were above the South African guidelines for the maximum permissible contents of these
metals (2 mg/kg Cd, 20 mg/kg Co, 6.6 mg/kg Pb, 46.5 mg/kg Zn) in soils. In addition, the
concentration of Cr was significantly above these guidelines (80 mg/kg Cr ) in 51% of the
samples. All the metals, except zinc, were highly correlated with one another indicating the
source for these heavy metals is the same. In addition the concentration of these metals was
high at sampling points adjacent to the runway where pronounced aircraft tyre wear marks
were observed, suggesting that the aircraft activities are the sources of these heavy metals.
A total of 13 samples were collected from areas adjacent to the crop sprayer hangar and the
drainage ditch (at the maintenance hangars) in order to determine the qualitative presence
of organic pollutants. The samples were prepared using soxhlet extraction. Cypermethrin,
deltamethrin, azoxystrobin, fusillade and fluazifop-p-butyl as well as fuel oils Jet Al and
Avgas were qualitatively determined using GC/MS. Only fusillade and fluazifop-p-butyl
were detected, in some of the samples. No quantitative analyses of the organic chemicals
was attempted due to time constraints.
vi
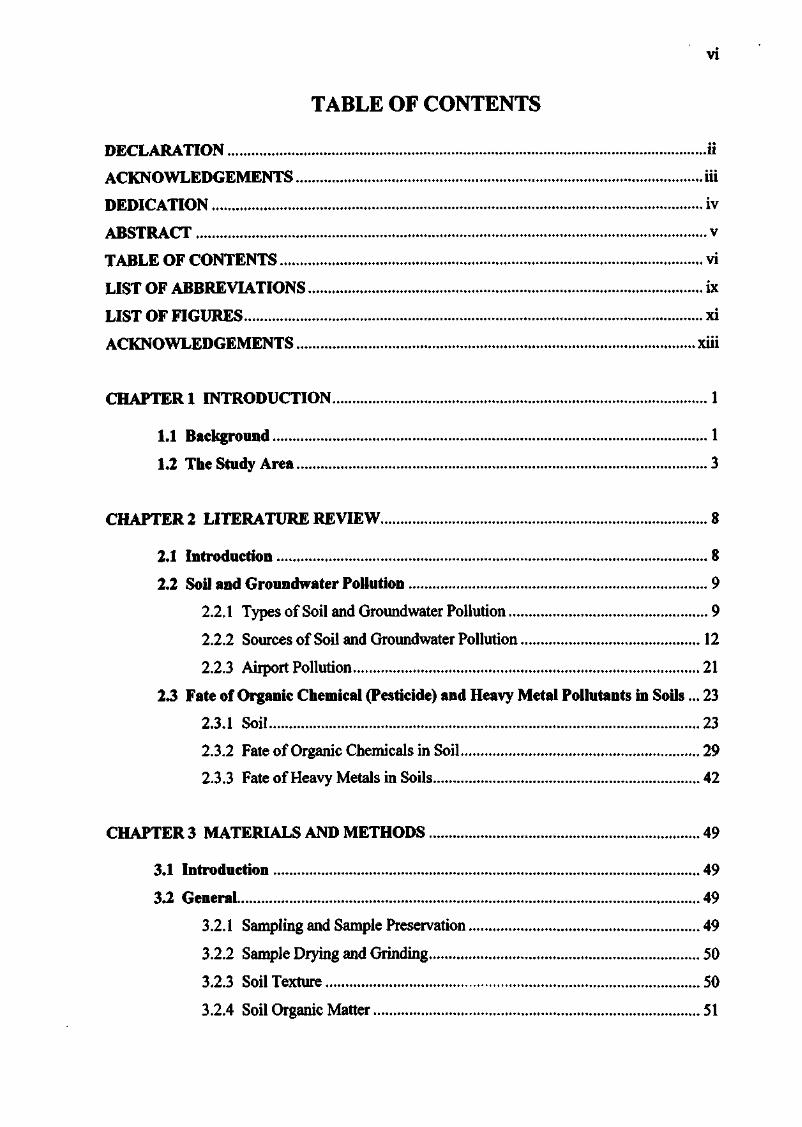
TABLE OF CONTENTS
DECLARATION ii
ACKNOWLEDGEMENTS iii
DEDICATION iv
ABSTRACT v
TABLE OF CONTENTS vi
LIST OF ABBREVIATIONS ix
LIST OF FIGURES xi
ACKNOWLEDGEMENTS xiii
CHAPTER 1 INTRODUCTION 1
1.1 Background 1
1.2 The Study Area 3
CHAPTER 2 LITERATURE REVIEW 8
2.1 Introduction 8
2.2 Soil and Groundwater Pollution 9
2.2.1 Types of Soil and Groundwater Pollution 9
2.2.2 Sources of Soil and Groundwater Pollution 12
2.2.3 Airport Pollution 21
2.3 Fate of Organic Chemical (Pesticide) and Heavy Metal Pollutants in Soils... 23
2.3.1 Soil 23
2.3.2 Fate of Organic Chemicals in Soil 29
2.3.3 Fate of Heavy Metals in Soils 42
CHAPTER 3 MATERIALS AND METHODS 49
3.1 Introduction 49
3.2 General 49
3.2.1 Sampling and Sample Preservation 49
3.2.2 Sample Drying and Grinding 50
3.2.3 Soil Texture 50
3.2.4 Soil Organic Matter 51

vii
3.3 Heavy Metals 53
3.3.1 Acid Digestion 53
3.3.2 Inductively Coupled Plasma-Optical Emission Spectrometry 54
3.4 Organic Chemicals (Pesticides) 57
3.4.1 Extraction and Cleanup 57
3.4.2 Gas Chromatograph-Mass Spectrometer (GC/MS) 58
CHAPTER 4 HEAVY METALS: EXPERIMENTAL, RESULTS AND DISCUSSION. 67
4.1 Introduction 67
4.2 Experimental: Materials and Methods 67
4.2.1 Sampling 67
4.2.2 Sample Drying and Grinding 69
4.2.3 Texture and Colour 69
4.2.4 Organic Matter Content and pH 70
4.2.5. Acid Digestion 71
4.2.6 Operating Conditions of ICP-OES 72
4.2.7 Calibration Curve 74
4.2.8 Statistical Analysis 76
4.3 Results 76
4.3.1 Texture and Colour 76
4.3.2 Organic Matter Content and pH 77
4.3.3 ICP-OES Analysis Results of Heavy Metals 81
4.4 Discussion 87
CHAPTER 5 ORGANIC COMPOUNDS (PESTICIDES): EXPERIMENTAL,
RESULTS AND DISCUSSION 97
5.1 Introduction 97
5.2 Experimental: Materials and Methods 97
5.2.1 Sampling 97
5.2.2 Sample drying and grinding 100
5.2.3 Organic matter determination 100
5.2.4 Soxhlet extraction 100
5.2.5 Sample drying and concentration 101

5.2.6 Sulfur cleanup and nitrogen blow down 102
5.2.7 GC/MS 103
5.3 Results 106
5.3.1 Organic matter 106
5.3.2 GC/MS analysis results for standards 108
5.3.3 GC/MS analysis results for samples 110
5.4 Discussion 114
CHAPTER 6 CONCLUSIONS AND RECOMMENDATIONS 118
REFERENCES 120

AAS
AES
BCF
BOD
CEC
Cl
CSIR
DDE
DDT
dl
El
EPA
EPTC
FAS
GC
GC-MS
ICP-AES
ICP-OES
K-D
K.t
Kow l.s.d.
mlz
MS
NEMP
PCE
PMT
ppm
PVC
RF
s.e.
SCOT
LIST OF ABBREVIATIONS
Atomic absorption spectrometry
Atomic emission spectrometry
Bioconcentration factor
Biological oxygen demand
Cation exchange capacity
Chemical ionisation
Centre for Scientific and Industrial Research
Dichlorodiphenyldichloroethylene
Dichlorodiphenyltrichloroethane
Detection limit
Electron ionisation
Environmental protection agency
Ethyl dipropylthiocarbamate
Iron(II) ammonium suI fate
Gas chromatography
Gas chromatography- mass spectrometry
Inductively coupled plasma atomic emission spectrometry
Inductively coupled plasma optical emission spectrometry
Kudema-Danish
linear distribution coefficient [L kg-I]
Octanol/water partition coefficient
Least significant difference
Mass to charge ratio
Mass spectrometry
National Environmental Management Plan
Polychloroethylene
Photomultiplier tube
Parts per million
Polyvinyl chloride
Radio frequency
Standard error
Support coated open tubular
IX

X
TBA Tetrabutylammomum
TOF Time-of-flight
2,4,5-T 2,4,5-Trichlorophenoxyacetic acid
WCOT Wall coated open tubular columns

LIST OF FIGURES
xi
Figure 1.1 Pietermaritzburg study area showing airport, transport infrastructure,
rivers, industrial and urban areas. Inset shows location of the study
area within South Africa 4
Figure 2.1 Average composition of soil material 23
Figure 3.1 Schematic diagram of Axial ICP-OES 55
Figure 3.2 Schematic diagram of a GC/MS 60
Figure 3.3 Schematic diagram of quadrupole ion trap 65
Figure 4.1 Sampling site and sampling points for heavy metal analysis. The map
is compiled, georeferenced and mosaiced from four aerial
photographs 68
Figure 4.2 Varian Liberty 150 AX Turbo ICP-OES Instrument used in this
research 73
Figure 4.3 Standard calibration curves for cadmium, cobalt, chromium,
manganese, lead and zinc 75
Figure 4.4 Organic matter contents (%) of soil samples from the east and
west sides of the runway 78
Figure 4.5 pH values of the soil samples from the east and west side of the
runway 80
Figure 4.6 Cd, Co and Cr concentrations of soil samples from the east side
of the runway 83
Figure 4.7 Mn, Pb and Zn concentrations of soil samples from the east
side of the runway 84
Figure 4.8 Cd, Co and Cr concentrations of soil samples from the west
side of the runway 85
Figure 4.9 Mn, Pb and Zn concentrations of soil samples from the west
side of the runway 86
Figure 4.10 Comparison of the heavy metal concentrations of the sample
and the baseline concentrations for South African soils 89
Figure 4.11 Correlations of Cd with Pb and Cr for all sampling points and
sandy soil samples from the east side of the runway 94

xii
Figure 4.12 Correlations of Co with Cd and Pb for all sampling points and
sandy soil samples from the west side of the runway 95
Figure 5.1 Sampling site and sampling points for organic chemicals 99
Figure 5.2 The soxhlet extractor apparatus set-up (A), and the extraction
thimble (white) inside the siphonable chamber of the soxhlet
extractor apparatus (B) 101
Figure 5.3 ThermoFinnigan GC/MS apparatus Model K07300000000080
used in the analysis of the organic chemicals 106
Figure 5.4 Organic matter content of the soil samples from the crop
sprayer and maintenance hangars 107
Figure 5.5 Chromatograms of the pesticides Amistar™ and Cypermethrin
used as standards for qualitative analysis of organic chemicals 108
Figure 5.6 Chromatograms of the pesticides Deltamethrin, Fusilade and
Punch-xtra® used as standards for qualitative analysis of
organic chemicals 109
Figure 5.7 Chromatograms of the fuels Jet Al and Av gas used as
standards for qualitative analysis of organic chemicals 110
Figure 5.8 GC/MS chromatograms for samples 304,307 and 308 112
Figure 5.9 GC/MS chromatograms for samples 309,310 and 311 113
xiii
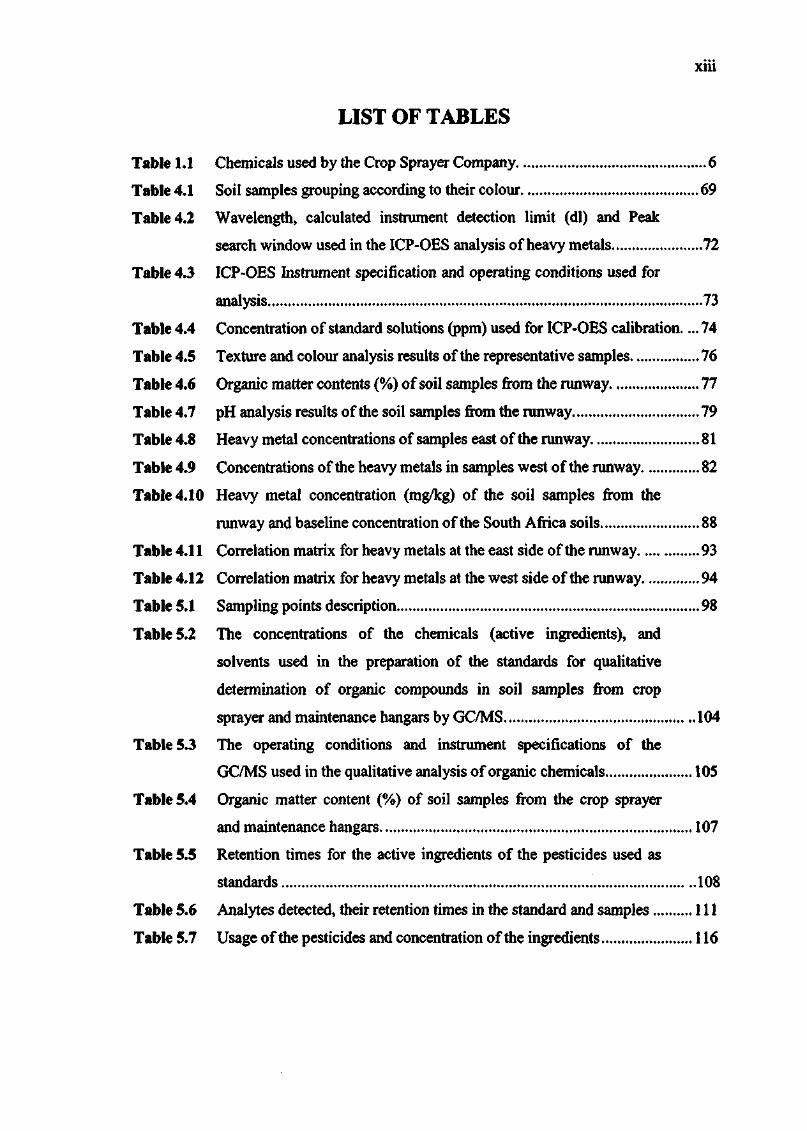
LIST OF TABLES
Table 1.1 Chemicals used by the Crop Sprayer Company 6
Table 4.1 Soil samples grouping according to their colour 69
Table 4.2 Wavelength, calculated instrument detection limit (dl) and Peak
search window used in the ICP-OES analysis of heavy metals 72
Table 4.3 ICP-OES Instrument specification and operating conditions used for
analysis 73
Table 4.4 Concentration of standard solutions (ppm) used for ICP-OES calibration.... 74
Table 4.5 Texture and colour analysis results of the representative samples 76
Table 4.6 Organic matter contents (%) of soil samples from the runway 77
Table 4.7 pH analysis results of the soil samples from the runway 79
Table 4.8 Heavy metal concentrations of samples east of the runway 81
Table 4.9 Concentrations of the heavy metals in samples west of the runway 82
Table 4.10 Heavy metal concentration (mg/kg) of the soil samples from the
runway and baseline concentration of the South Africa soils 88
Table 4.11 Correlation matrix for heavy metals at the east side of the runway 93
Table 4.12 Correlation matrix for heavy metals at the west side of the runway 94
Table 5.1 Sampling points description 98
Table 5.2 The concentrations of the chemicals (active ingredients), and
solvents used in the preparation of the standards for qualitative
determination of organic compounds in soil samples from crop
sprayer and maintenance hangars by GC/MS 104
Table 5.3 The operating conditions and instrument specifications of the
GC/MS used in the qualitative analysis of organic chemicals 105
Table 5.4 Organic matter content (%) of soil samples from the crop sprayer
and maintenance hangars 107
Table 5.5 Retention times for the active ingredients of the pesticides used as
standards 108
Table 5.6 Analytes detected, their retention times in the standard and samples I l l
Table 5.7 Usage of the pesticides and concentration of the ingredients 116

Chapter 1 Introduction 1
CHAPTER 1
INTRODUCTION
1.1 BACKGROUND
Industrial growth is the goal of all developing countries. However, with increasing
industrialisation comes the inevitable increase in industrial pollution. This is because it
requires time to identify and act on pollution problems and political circumstances may
slow or halt such action. Governments' concern to create jobs usually means that when
investors propose a new factory, little attention is given to the likely environmental
impacts. A second reason why pollution can be particularly serious is the concentration of
industry in relatively few locations. In most Third World nations, industrial production is
heavily concentrated in one or two city regions. For instance Bissau, Nairobi and
Port-au-Prince contain a high proportion of their nation's total industrial output.1 Eritrea,
the home-country of the author is no different in this regard.
The manufacturing industrial sector in Eritrea at present consists mainly of light industries
producing a variety of goods, including processed food, beverages, textiles, leather goods,
chemical products, construction materials, ceramics, and metal products.2 Eritrea is likely
to see an expansion of industrial activities, both public and private, now that the damaging
wars with Ethiopia (1960-1991 and 1998-2000) are over.
Eritrea is endowed with commercially significant mineral deposits, including native
deposits of gold and silver and minerals containing copper, zinc, lead and iron ore.2 There
are also sizeable deposits of industrially-important minerals such as potash, sulfur,
gypsum, feldspar, silica sand, and resources for the construction industry, such as granite,
marble and limestone. The government, interested in the potential economic enhancement
that mineral production and beneficiation could provide, continues to seek international
investment in its mineral industry.
The government of Eritrea realises that development in all sectors has to be planned
carefully to ensure the rational use of natural resources and to prevent environmental
degradation. Consequently, it has produced and disseminated the National Environmental
Management Plan (NEMP)3 which, it is hoped, will ensure sustainable development of the

Chapter 1 Introduction 2
country's natural resources taking into account social and economic demands. The NEMP
includes the application of environmental impact assessment procedures and
environmental monitoring.
Although urbanisation in Eritrea remains, as yet, limited, the potential for the deterioration
of the environment with increasing urbanisation and industrialisation is a subject of
concern to the government. Nearly all the major industries in the country are located in
urban areas. According to a 1997 report4, the distribution of Eritrean factories is uneven,
with 55% of private enterprises and about 90% of public enterprises located in the capital
city, Asmara. Almost all the waste generated by these industries is either disposed of as
liquid wastes, which run untreated into sewers or other nearby water bodies, or dumped on
landfill sites. The problem is exacerbated due to the fact that there are limited water
resources in the country, and the existing dependable sources are groundwater. Thus, the
pollution of groundwater by industrial effluents will have serious consequences.
Industrial pollution is not the only cause of air and water pollution. The high proportion of
households and businesses not served by sewers, drains and garbage collection add greatly
to land and water pollution problems, while very congested traffic, with inefficient and
poorly maintained engines, adds greatly to air pollution.
To determine lines of action to be taken to control and manage natural resources and to
minimise or eliminate environmental degradation, the government plans to initiate research
through its own institutions, the University of Asmara, non-governmental organizations
and the international community in fields embracing natural resources conservation and
management. This will require the collection, analysis, dissemination and application of
basic data to the conservation and management of soils, forests, wildlife, fisheries and
water.
A literature survey into soil and ground water pollution has been undertaken to highlight
the possible sources of pollution in Eritrea. The actual project has been designed to train
the author in experimental methodology in environmental chemistry, including data
collection, analysis of the data and most importantly, forming scientifically-sound
conclusions.

Chapter 1 Introduction 3
As the project area was limited to Pietermaritzburg, a general look at possible sources of
pollution was done in the environment of Pietermaritzburg in order to select a study site
which may act as a relevant case-study for dealing with environmental pollution applicable
to the Eritrean context. Consequently, the commercial airport in Pietennaritzburg was
selected as a study site due to the fact that it gives the opportunity to study both organic
and inorganic pollutants.
1.2 THE STUDY AREA
Pietermaritzburg is an administrative and industrial city with a population of 457 700.5 It is
located in the midlands of southern KwaZulu-Natal, about 80 kilometres inland of the
coastal city of Durban. The city is well served by road and rail network and the busy
N3 highway, which links Durban and Johannesburg, passes through the city. The
uMsunduzi River flows from the southwest to the northeast across the city. The
Baynespruit, Dorpspruit, Chase Valley spruit, Blackburrowspruit, Mkondenispruit and
Foxhillspruit are the major tributaries that drain to the uMsunduzi River from the city
catchment area.
Manufacturing industry in Pietermaritzburg is focused in six sectors.6 The leading
industrial sector is the metal manufacturing industry in which the Hulett Aluminium
factory is having a great economic impact. The other manufacturing sectors are wooden
products, shoes, agricultural products, electronics and carpets. Most of these industries are
located in four major industrial areas in the city:
• Willow ton industrial area, located on the hill slopes to the northeast of the city
• Camps Drift, located in the south of the city
• Mkondeni, located southeast of the city, and
• Victoria road, located in the central part of the city
Another potential pollution source in the city is the local airport, and this was identified as
the inspection site for this study. Pietermaritzburg Airport (Oribi Airport) is located south
of the city of Pietermaritzburg, nearby Bisley Heights and north of the Ukulinga
agricultural research station and Bisley Valley Nature Reserve. The airport is situated
between two streams, the Backburrowspruit and Foxhillspruit, located at the east and west
side of the airport (runway) respectively.

Chapter 1 Introduction 4
N
Legend
/ \ / Freeways / \ y Main roads
Secondary roads / \ / R a i l w a y
aRivers Industnal areas
3 Urban areas
N
<D Scale 1 :100 000
1 0 1 2 3 \ V
4 Kilometers \
Compiled by AJ Simpson (Geography, UKZN)
Figure 1.1 Pietermaritzburg study area showing airport, transport infrastructure, rivers,
industrial and urban areas. Inset shows location of study area within South Africa.

Chapter 1 Introduction 5
Turnaround Management on behalf of the Msunduzi City Council of Pietermaritzburg
operates the airport. The airport has a runway 1580 meters long and 30 meters wide. There
are six tenants in the premises of the airport that are involved in a variety of airport-related
businesses.7 The tenants and services they render include:
• SA Airlink: a scheduled airline that offers passenger services,
• Crop Sprayer Company: involved in agrochemical spraying of crops,
• Pacair and Oribi Flying Services: companies involved in aircraft maintenance
operations, and
• Flight Training College and Aero Club: organizations offering flight-training
services.
The airfield maintenance involves a fire and rescue vehicle (cat. 4 airport), a maintenance
LDV (Nissan Bakkie), and grass cutting equipment (Falcon Shlasher and tractors). The
airport gives service to approximately 20000 small passenger (max. 29 passenger), crop
spraying and training aircraft* annually.7 The aircraft maintenance operation organizations
provide maintenance and rebuilding (painting, servicing, overhauling) and aircraft washing
services to approximately 64 aircraft annually.8,9
The Crop Sprayer Company is involved in spraying of pesticides, sugar cane ripening
chemicals and fertilizers, as shown in Table 1.1. The crop spraying aircraft, the chemical
mixing and refilling equipment are all washed in the crop sprayer hangar. The wastewater
from these washing activities goes to a ditch, which flows down approximately 150 meters
before it reaches a fence surrounding the airport. During the dry season, the flow of the
wastewater does not go far beyond the fence. However, in the rainy season the flow of the
water through this ditch can go far beyond the fence, i.e. it drains into the stream in the
vicinity (Blackburrowspruit).

Chapter 1 Introduction 6
Table 1.1 Chemicals used by the Crop Sprayer Company.10
Type of chemical Chemical name
oc-Cypermethrins Insecticide
Deltamethrin
Amistar
Fungicide Flutriafol
Punch extra
Herbicide Glyphosate
Ethephon (Ethrel) Cane ripening
Fusilade
Fertilizer Urea (granular)
Aircraft maintenance and painting in Pacair includes aircraft maintenance and washing.
The wastewater from the maintenance is poured into a container that has a water layer
(bottom) and a paraffin layer (top). The oil (hydrocarbon) goes to the paraffin and the
non-hydrocarbon wastes go to the water. The oil (hydrocarbon) waste is, then, taken by
another company for disposal. Aircraft are washed using water and detergents or soap.
When painting the aircraft, sawdust is applied to the ground so that the paint spill during
painting rests on the sawdust, which then is collected and disposed with the solid wastes.
On average two aircraft per month get serviced by this company. The types of aircrafls that
get serviced are passenger/spray aircraft below 5000 lb (2268 kg) weight.8
Services rendered by Oribi Flying Services include: maintenance rebuilding (painting,
servicing overhauling, etc), washing aircraft, painting (acrylic paints) and aircraft washing
outside the garage.9 The methods of waste handling are similar to those used by Pacair.
Approximately 40 passenger aircraft below 6000 kg weight per year get major services by
this company.
The aircraft use Avgas and Jet Al fuels stored on site.7 Lubricating grease and hydraulic
fluids used for the aircrafts and support vehicles include Aeroshel and synthetic hydraulic
fluids (for brakes).8'9 In addition polyurethane paints, licathenes, paint thinners and other
organic solvents are used in the garage for different activities (washing, painting, etc).

Chapter 1 Introduction 7
The objective of this study is, therefore, to assess the pollution levels of the soil in different
parts of the airport area caused by:
• organic chemicals (pesticides) from the washing and maintenance of the crop
spraying aircrafts (area adjacent to the crop sprayer hangar and the drainage ditch)
• heavy metals from the body of the aircraft, the landing gear and tyre wear of the
aircraft (along the edges of the runway).

Chapter 2 Literature Review 8
CHAPTER 2
LITERATURE REVIEW
2.1 INTRODUCTION
Though pollution is strictly defined as any departure from purity, environmental pollution
means realistically a departure from a norm rather than a pure state. In the context of water
pollution, for instance, pure water will mean a state of water in which no substance is
present in sufficient concentration to prevent the water from being used for purposes
thought of as normal. Some of these uses would be recreation, potable water, agriculture
and industry. Hence water suitable for a particular use and therefore considered to be
unpolluted, may be considered as polluted when other uses are considered.11
Soil and groundwater pollution are not independent phenomena. Groundwater is polluted
commonly when liquid or solid wastes are disposed of or stored for a time on land.12 Soil
pollution can also be a hazard to human health when potentially toxic substances move
through the food chain or reach the groundwater used for drinking water supplies.13 The
pollutants in soil can further pollute groundwater if the condition of the soil above the
groundwater favours the mobility of the pollutants laterally. Hence, the pollution of soil or
groundwater has a potential pollution impact on the other.
Freshwater is fundamental to the survival of humans and most other land-based life forms.
About 96.5% of the earth's water is the salt water of the oceans and seas. Most of the
remaining 3.5% is in polar ice caps, glaciers, the atmosphere or underground and hard to
reach. Only 0.4% is available for use. Groundwater amounts to 1.7% of global water
reserves, and the freshwater from groundwater resources contains 30.1% of the total global
freshwater reserves.14 According to Alcock15 groundwater accounted approximately 15%
of the total water consumed in South Africa in 1980. Groundwater supply is maintained by
water evaporating from oceans and lakes and then falling to the earth as rain in a process
called the hydrological cycle.
Population growth, especially in the last 100 years, has increased economic and industrial
activity which, in turn, has increased the demand for freshwater. In addition, rapid

Chapter 2 . Literature Review 9
urbanisation is changing the patterns of consumption of water, and the pressure to increase
the area of productive land means there is greater demand for irrigation.
Groundwater is highly susceptible to contamination. Once contaminated, groundwater is
difficult to clean, requiring great expense and, in fact is sometimes impossible.17 Thus,
protecting groundwater from possible pollution sources makes sense economically. Some
groundwater is more susceptible to contamination because of the kind of soils and rocks
above it. In some cases the groundwater is so close to the surface that pollutants do not
have far to travel. In other cases, soils above the groundwater are porous and pollutants can
move quickly. Groundwater in karst areas (i.e. topography with sinkholes, caves, and
underground drainage that is formed in limestone, gypsum, or other rocks by dissolution)
becomes polluted more easily and in shorter time periods than water in non-karistic areas.18
On the other hand, poorly drained soils make it difficult for septic systems to perform well,
which may result in groundwater contamination. Hence it is important to know the fates of
pollutants in soil to determine their impact on the environment.
2.2 SOIL AND GROUNDWATER POLLUTION
2.2.1 Types of Soil and Groundwater Pollution
Water can be polluted in many different ways, and it is even possible that the same aquatic
system can be affected by more than one type of pollution. Depending on the behaviour of
the pollutants, water and soil pollution can be classified as arising from physical, chemical
and biological sources.18
Physical pollution affects the physical properties of groundwater and soil. It is caused by
variations in temperature, undissolved solid substances like silt, the colouring or
muddiness of the water and as a result of dyes and foam on the water from artificial
detergents.19 The resulting changes in physical properties of groundwater and soil may
then affect the biological and chemical processes in the ecosystem.
Biological pollution is caused by the presence of parasites, pathogenic bacteria and viruses.
Pollution of this kind comes mainly from infected human and animal wastes. Soils can be
contaminated with pathogenic organisms (bacteria, viruses and parasitic worm eggs) from
various sources, including the burial of dead animals, manures and sewage.13

Chapter 2 Literature Review 10
A large variety of illnesses arise from the microorganisms that pollute water. Some of
these microorganisms are parasites, which for part of their life-cycle use man as a host,
causing ill health. Water is a potential carrier of pathogenic microorganisms and can
endanger health and life. Historically, the prevention of water-borne parasitic diseases,
such as cholera, dysentery, typhoid and paratyphoid fever, was the primary reason for
water pollution control.11 Nevertheless, many people and animals, especially in the
agricultural sector, depend on drinking water from irrigation canals, often without it having
been treated beforehand. Hence, human beings as well as animals are infected by parasitic
diseases.
Chemical pollution encompasses a great number of different, naturally occurring and man-
made chemicals. Most of the chemicals in commercial use constitute potential toxic
hazards. Hence, many of these chemicals can cause pollution of soils as a result of leakage
during storage for future use in the environment and from their disposal either directly or
through wastes containing them.13 Chemical pollutants can be classified as biodegradable
and nonbiodegradable. Biodegradable pollutants are substances that can be broken down in
time by the action of aerobic or anaerobic bacteria. Nonbiodegradable pollutants are
materials that are not broken down by biological processes such as plastics, metals and
glass. Chemical pollution can be further categorised into two main forms, namely organic
and inorganic pollution.
2.2.1.1 Organic pollution
Most forms of organic pollution arise due to the release of human, plant and animal wastes
in one form or another, through man's activities in his environment. One of the major
sources of organic pollution is die effluent arising from sewage treatment works.20 Other
sources of organic pollution include industries such as breweries, dairies and food-
processing plants. Water run-off from hard surfaces and roads in towns, especially during
storm conditions can contribute a great deal towards organic pollution. Farm effluents have
become a particular problem, with the intensification of livestock rearing and
overwintering of animals in confined buildings as well as the increased use of silage to
feed them. The biological oxygen demand (BOD) of such silage run-off can be as much as
200 times greater than the normal settled sewage.20

Chapter 2 Literature Review 11
Usually organic waste matter ends up in the hydrosphere. Plant and animal remains, which
act as nutrients for a large variety of microorganisms and other forms of aquatic life, are
the main sources of this organic matter. Much of the oil pollution of water is from petrol
and oil washed from roads, together with illegal discharge of engine oil, transport accidents
and spillage from storage tanks.20 In cases where the pollution is limited, the polluted
water can be purified effectively using normal purification processes, which include
chemical dosing of the polluted water to coagulate the suspended colloidal particles using
flocculants, sedimentation of the large particles, filtration of fine particles and disinfection
using chlorine, hypochlorites or ozone.19 However, the decomposition of organic matter
utilises the available oxygen in the water. Hence, decomposition of large quantities of
organic matter depletes the oxygen content of the water which may become detrimental to
aquatic life.
Eutrophication, which is the artificial increase in nutrient levels of lakes or other water
bodies, usually causes an increase in the growth of aquatic animal and plant life.
Eutrophication sources include agricultural run-off and leaching of fertilizers, manure
washes from farms, and acid rain water from fossil fuel burning.20 According to Mason
50% of the nitrogen applied to crops is lost to water.20 Septic conditions can develop in
water bodies exposed to eutrophication, giving rise to bad smells and tastes in the water.
When this water reaches underground sources, it could pollute the drinking water in wells
and boreholes.
Many industries contribute towards the pollution of water sources. In fact, industry itself
can be its own pollution victim. The purification requirements for water affected with
organic salts prior to usage makes it less suitable for many purposes.19 In this case, the
greater any industry's pollution of water, the greater will be the cost to that industry of
purifying/treating this resource before it can be used or sent to waste disposal.
2.2.1.2 Inorganic pollution
This category of pollutants includes inorganic salts, mineral acids, and metals or metal
compounds. The presence of these pollutants in soil and groundwater may result in an
increase in acidity, salinity and toxicity of the soil and groundwater. Sources of acidity are
mainly acid mine drainage and industrial effluents. The sources of salinity are varied and

Chapter 2 Literature Review 12
include industrial effluents, irrigation, salt brines from mines or oil wells and ocean
salts."-14
Industry is creating an enormous range of new chemicals each year, most of which
eventually find their way into the aquatic environment. Little is known of their acute,
chronic or genetic toxicity to man, plant or animal.21 Certain inorganic substances are
extremely toxic and may destroy aquatic life completely. Compounds containing mercury,
lead, arsenic, cadmium, chromium and nickel appear to be the most toxic, persistent, and
abundant in the environment.11 These metals are known to accumulate in the bodies of
organisms, remain for long periods of time, and behave as cumulative poisons. For
instance, chromium from metal-plating industries is a well-known source of respiratory
hazard as an acid C'r( VI) mist and poisons microorganisms used to treat sweage, while
mercury discharge also receives a great deal of attention due to its bioaccumulation
potential in animal tissues.1'
Inorganic pollution is much more difficult to control, and potentially more hazardous, than
organic pollution because it is more difficult and expensive to treat.11 Natural purifying
processes are often ineffective, and desalination processes are often the only cost effective
way to treat this type of water pollution.
2.2.2 Sources of Soil and Groundwater Pollution
The sources of groundwater and soil pollution are from natural processes and human
(anthropogenic) activities in the environment. Natural pollution has been occurring since
the creation of earth and is still continuing. The major contributors to natural pollution are:
natural waste, soil erosion, and salts.19 Natural waste is generated through the
decomposition of plant and animal remains in the water sources and the land. The
decomposition products are washed from the land down to the water sources usually by
rainwater. This leads to a high degree of organic pollution, which gives the water bad
odour, colour and taste. Soil erosion, in general, occurs in the mountainous areas and semi-
deserts and significantly contributes to the amount of silt present in the water sources.
Water acquires its brown muddy colour from the silt, which is finally deposited onto the
riverbeds and the impoundments. The salts in the environment are of a geological origin.19

Chapter 2 Literature Review 13
Anthropogenic pollution is as old as man himself and gathered momentum through the
development of agriculture. The last 200-300 years, during which the industrial revolution
was accompanied by major population growth, have led to the greatest problems associated
with environmental pollution.22 With the increase in population, urbanisation and
industrialisation the anthropogenic sources of pollution also increased. These pollution
sources include municipal and industrial landfill leachate, leakage from septic tanks and
petroleum storage tanks, and agricultural (pesticides and fertilizers) leachate.16
Anthropogenic pollution of groundwater and soil is classified into two different types,
namely pollution originating from point sources and non-point (diffuse) sources. Point
sources of pollution are located at a specific point. Hence, it is often easy to control
pollution from such sources. Non-point sources, however, are not located at a specific
point and as a result pollution occurs over a broad area. Thus it is often not possible to
control or even measure pollution from such sources. Pollution arising from non-point
sources accounts for a majority of the contaminants in streams and lakes. Every time it
rains, the rainwater washes off driveways, roofs, parking lots, roads, agricultural fields,
construction sites, forestry operations, and other surfaces carrying with it contaminants to
the streams, lakes, oceans and groundwater. Generally, anthropogenic sources contribute
by far the largest proportion of pollution into groundwater and soils.23
The anthropogenic sources of pollution can also be categorised under the following
headings; agricultural, mining, industrial, municipal (urbanisation) and air deposition.18
2.2.2.1 Agricultural activities
Malpractices in agriculture, such as extensive grazing and wrong cultivation methods,
accelerate natural erosion and the leaching of salts. The storage and movement of
agricultural wastes and the application of fertilizers and pesticides also have large negative
impacts on groundwater quality.18
The application of fertilisers and pesticides generate wastes and salts, which often leach
into water environments.19 Fertilizers contain large amounts of nitrates and phosphates,
which when leached into water environments, over stimulate the growth of aquatic plants
and algae. Excessive growth of these types of organisms consequently clogs waterways,

Chapter 2 Literature Review 14
use up dissolved oxygen as they decompose, and block light to deeper waters. This, in turn,
proves very harmful to aquatic organisms as it affects the respiration of fish and
invertebrates that reside in water.
Intensive farming practices, such as poultry farming, are also important sources of
pollution. Nevertheless, systematic planning practices, such as anaerobic digestion of
animal wastes to produce bio-gas, may lead to such wastes being used to great benefit with
limited soil and water pollution."
The amount of agricultural wastes produced, in general, is much greater than the
municipal-industrial wastes. In the United States, for instance, agricultural waste is
produced at a rate of about six and half times that of municipal-industrial waste
production.2' Nevertheless, agricultural pollutants, which originate from agricultural
wastes, principally consist of biodegradable materials.
2.2.2.2 Mining
Mining and mineral processing provide the raw materials and energy resources needed to
sustain modern civilization. However, it also has an impact on the environment due to the
enormous amount of waste generated during the exploration, extraction and smelting of
ores.24
In non-fuel mining, the valuable portion of the crude ore is a small fraction of the total
volume of material that must be handled to obtain it. In copper mining, for instance, over
500 tonnes of solid waste is generated to produce one tonne of copper.21 However, this
enormous quantity of waste generated by mining is not evident as municipal-industrial
waste because the mining process takes place in remote areas. It has been estimated that
these wastes are generated at a rate of more than four and half times greater than that at
which municipal-industrial waste is produced. These types of wastes are largely
nonbiodegradable.21
Mining involves several stages.24 Removing the overburden and waste rock exposes the
ore. The ores are then extracted (mined) and transported to a nearby mill, where they are
beneficiated (concentrated or dressed). Beneficiation processes include physical and

Chapter 2 Literature Review 15
chemical techniques such as gravity concentration, magnetic separation, electrostatic
separation, floatation, ion exchange, solvent extraction, precipitation, and amalgamation.
Mining and beneficiation processes thus generate four types of large volume waste: mine
waste, tailings, dump and heap leach waste, and mine water. Mine wastes are produced in
the process of exposing the ore. In dump and heap leaching which often covers hundreds
of hectares, different chemicals such as acids and cyanide are added to the ores to dissolve
the required minerals.25 The low-grade ore then becomes a waste. Mine water, the water
that infiltrates the mine, must be removed to facilitate mining. This water is mineralised as
a result of the oxidation of the ore and rocks, and salt leach-out.19 Solution mining,
whereby water is pumped down an injection well to the deposit where it dissolves the
minerals and is then brought back to the surface through extraction wells, is a potential
contaminant for groundwater reservoirs.21 All these wastes produced from the mining
process can cause physical and chemical pollution to soils and groundwater.
Ore bodies generally include a range of minerals containing both economically exploitable
metals (in ore minerals) and uneconomic elements (in gangue minerals). The uneconomic
elements in the ore are left with the tailings since it is not profitable to extract these
elements. Though acids are discharged by a large variety of human activities, mining
operations and abandoned mines are the largest sources of acids.26 Coal and ore mines
produce acidic drainage, which includes typically 100 to 600 ppm sulfuric acid. Acid
mimng drainage is produced when the mineral pyrite (FeS2), commonly found in coal
seams, is exposed to air and water resulting in the formation of sulfuric acid and iron
hydroxide, as shown in equation 2.1.
4 FeS2 + 15 0 2 + 14 H20 -> 4 Fe(OH)3 + 8 H2S04 (2.1)
This is recognised as a serious environmental pollution problem because the mobility of
heavy metals such as Mn, Zn, Pb, Cu and Cd in mining effluents, is enhanced by
transformation of sulfides and a shift to more acidic conditions.27 Therefore, metalliferous
mining is an important source of contamination by a wide range of metals because most
mine sites are contaminated with several metals and accompanying elements such as
sulfur. In addition, wind blown tailings and ions in solution from the weathering of ore
minerals in tailings from heaps tend to be the major sources of pollution from abandoned

Chapter 2 Literature Review 16
metalliferous mine sites.13 In South Africa gold mining generates much of the wastewater
from the mining industry. This water is contaminated with toxic cyanide from the gold
leaching operations. Coal mining has also contributed substantially to the pollution of both
surface and groundwater resources.28
2.2.2.3 Industries
Industries produce a vast variety and large amounts of wastes during their processes. For
instance, a 1981 study 29 conducted in the United States showed that the wastes generated
by the industrial sector were 264 million tonnes, which was more than one tonne of waste
for every person. There has been increasing concern about the dumping of toxic wastes
onto landfill sites, particularly the large number of uncontrolled dump sites, and the threat
of contamination of groundwater as a consequence of leaching of toxic materials from the
soil into water courses.30
Rainwater, being the main medium of distribution of pollutants in the tropics, can contain
metals like Mn, Fe, Cu, Zn, Hg and Pb in considerable amounts from industrial and fossil
fuel combustion emissions.31 Industrial effluent that is released during production
processes can either be reused or discharged into existing water sources after purification.
In places where industrial sludge is stored, water pollution could develop due to the
leaching of pollutants out of the waste material and subsequent drainage into surface water
or groundwater.
Industrial wastes are complex mixtures of biodegradable and nonbiodegradable
components.21 The characteristics of industrial wastewaters can vary considerably. Most of
these wastes contain high concentrations of organic substances. The impact of industrial
discharges depends not only on their collective characteristics, such as biochemical oxygen
demand and the amount of suspended solids, but also on their specific inorganic and
organic substance contents. Industries that process basic raw materials are especially
responsible for the release of inorganic pollutants such as acids and dissolved mineral salts
in the water environment.
Chapter 2 Literature Review 17
The following types of industries are amongst those producing wastes that pollute the
water and soil environment.32
• Food and related products: these include meat and dairy products, beet sugar refining,
brewing, distilling, and canning. Wastes from these industries contain high XT.
concentrations of decomposable organic matter.
• Textile products: cooking the fibres and desizing the fabrics produces wastes which
have high BOD and are quite alkaline, requiring neutralisation and other treatment.
Nemerow, cited by Hodges, reported that the production of 1000 kg of wool leads to
1500 kg of impurities.32
• Paper and allied products: the effluent from paper and pulp mills is a complex mixture
of chemicals used in the process, stray wood chips, bits of bark, cellulose fibres, and
woody tissue carbohydrate (lignin). During the bleaching process of paper strong
oxidizing agents are used. The dyes, inorganic salts and chlorinated organic
compounds could be dangerous and poisonous to certain water organisms, even in low
concentrations, when discharged in the effluent and eventually in water
environments.19
• Chemical industry: a wide variety of chemicals are produced by chemical plants
manufacturing acids, bases, synthetic fabrics, pesticides, fertilizers, detergents and
many other organic and inorganic compounds.
• Petroleum industry: oil refineries and petrochemical industries produce great numbers
of different pollutants such as hydrocarbons, acids, alkalis, cyanides, phenolic
compounds, inorganic and organic sulfur compounds, and halogenated and
nitrogenated hydrocarbons.
• Rubber and Plastic industry: wastes from rubber production contain some of all the
materials used in the process such as butadiene, styrene, soap solution and acid-brine
solution. Wastes from plastic manufacturing include hydrocarbons and other organic
compounds, as well as various reagents.
• Metal industries: wastes from steel mills tend to be acidic and contain cyanogen,
phenol, ore, coke, limestone, alkali, oils, mill scale and fine suspended solids. Other
metal producing and metal finishing industries produce wastes which generally contain
the metal being produced or plated such as chromium, lead, nickel, cadmium, zinc,
copper and silver as well as acids, alkaline cleaners, grease, and oil.
Chapter 2 Literature Review 18
According to a 1992 Centre for Scientific and Industrial Research (CSIR) report33 on the
industrial waste of South Africa, a total of 418 804 998 tonnes of waste is produced by
industry annually, out of which 99% is solid waste and 1% is effluent. Mining waste, most
of which is inert tailings, overburden and spoil, accounts for 90% of the total industrial
waste. Excluding the mining and power generating wastes, the comparative waste
quantities generated by the manufacturing industries are: 1% from chemical products,
11.7% from building materials, 2.3% from food processing, 0.9% from textiles, 2.1% from
pulp and paper, 0.2% from metal processing and 81.8% from metallurgical industries such
as iron and steel refining mills.
In addition the report showed that 1 892 681 tonnes (0.5%) out of the total bulk waste
generated annually is regarded as hazardous. The contribution of each sector to toxic waste
is: chemical products 6.7%, electronics 0.1%, textiles 8.7%, building materials 0.1%, metal
processing 2.6% and metallurgical 81.8%.
2.2.2.4 Urbanisation
In urban areas, where thousands of people are concentrated, water pollution is expected.
Generally the urban areas comprise three main sources of pollution: residential, business
and streets. In residential areas pollution occurs as a result of the waste produced by pets,
pool backwash, the use of pesticides in and around the house and garden and the use of
manure and fertilizers. On business premises, such as garages, light and heavy industries,
the spillage of a great variety of pollutants takes place. Spillage and contamination with oil
and other pollutants in the streets, where vehicles are constantly moving, on sidewalks and
at airports and railway stations is another source of urban pollution. Highway
environments are relatively constant sources of anthropogenic organic matter as well as
heavy metals.34
From studies on the sources of hydrocarbon pollution by Latimer et al.35, it was shown that
industrial and highway sources are much greater than commercial and residential sources.
In addition, the primary source for the hydrocarbon content in run-off is from used
crankcase oil, originating from oil drops on road surfaces and parking areas, as well as
illegal dumping of waste crankcase oil.

Chapter 2 Literature Review 19
Waste disposal poses a considerable threat to the environment since the dispersal of the
disposed hazardous wastes is a key component in groundwater contamination.36 Domestic
wastes are disposed of mainly in sanitary landfill sites. Many common household products
(paint thinners, moth-balls, and drain and oven cleaners, to name few) contain toxic
ingredients. Sewage wastes, treated or untreated, are normally released into rivers and are
the source of plant nutrients such as phosphorous and nitrogen, which cause excess in
aquatic growth. Raw municipal wastewater contains high concentrations of organic
material, phosphorous, nitrogen, heavy metals, pathogenic bacteria and viruses.18
2.2.2.5 Precipitation of air particles
Air pollutants are emitted both from natural and anthropogenic sources to the atmosphere.
The natural emissions include volcanoes, sea spray and dust whilst the anthropogenic
sources include emissions from industries, the combustion of fossil fuel for energy and
motorised vehicles. These pollutants that are released from the anthropogenic and natural
sources are removed from the atmosphere by dry and wet mechanisms and are deposited at
the earth's surface (land and water bodies).37
Particulate air pollutants includes substances having a very diverse physical and chemical
properties, with their diameters ranging from O.01 to >100 /un. Most of the >2 jam
particles consist of pollutants which are natural in origin such as wind-blown soil and
marine aerosol. On the other hand, the major part of the aerosol having diameters < 2 Jim
contain man-made components such as lead from motor exhausts and ammonium sulfate
from atmospheric oxidation of sulfur dioxide. But, the major part (by mass) exists in the
0.1-10 fim range. This is because very fine aerosol particles grow rapidly by coagulation,
and large particles sediment rapidly under gravitational influence.37
Elimination of atmospheric pollutants down to ground level can happen either through dry
or wet deposition. Wet deposition can be accomplished by two distinct mechanisms, i.e.
rainout and washout.38 In the rainout mechanism, aerosol particles are incorporated into
cloud droplets before the raindrops are formed within the cloud. In the washout mechanism
the raindrops falling from higher altitudes scavenge airborne particles at lower altitudes by
impaction and coagulation. The overall efficiency of wet deposition is described by the
scavenging ratio W, as shown in equation 2.2.37

Chapter 2 Literature Review 20
Concentration in rainwater (mgkg-1) Concentration in air (mg kg-1)
_ vuuwiuuauuu m lamvYa^i y»ife«.fe ) , . J)
Higher values of W for a pollutant indicate that the efficiency of removal of that pollutant
by wet deposition is high. Although fogwater contains moderate volumes of water, the
scavenging of particles from the atmosphere by fogwater can be significant as compared
with rainwater because pollutant concentrations in fogwater are usually much greater than
in rainwater.37
Dry deposition involves the transfer and removal of gases and particles at land and sea
surfaces without the intervention of rain or snow and accounts for about 20% of the total
aerosol deposition.39 This sedimentation process is governed by Stokes' law (equation 2.3):
9 11
where V is the terminal settling velocity, r is radius of particle, g acceleration due to
gravity, p and pa density of the particle and air respectively, TI is the viscosity coefficient of
air.
The law predicts that the terminal settling velocity for particles in the micron and
sub-micron range will be less than 0.1 cm s"1, which is much less than the normal eddy
velocities associated with turbulence and mixing, and therefore, particles of this size would
be expected to remain in suspension.39 Chamberlain40, however, reported a greater
deposition efficiency for particles of this size on rough surfaces than previously suspected.
Hence, even in the absence of precipitation processes there still remains a route whereby
particles can be removed from the troposphere.
The overall dry deposition rate of a pollutant is usually expressed in terms of the
deposition velocity, Vg, where11
, j , _K Flux to surface (cm-2 s"1) V(cms ) = ^ '- (2 4)
Atmospheric concentration (cm 3)
Vg is influenced by Brownian diffusion for a particle diameter size of less than about
0.1 /«n, and gravity settling accelerates Vg for particles with diameters greater than 1.0 jtm.

Chapter 2 Literature Review 21
For particles in the diameter range of 0.1 /un tol.O Jim, Vg is nearly constant and only eddy
diffusion is regarded as an important deposition process.41
In general, dry deposition of atmospheric pollutants is a continuous process, while wet
deposition is an irregular process. Hence, only dry deposition may always be relied upon to
remove airborne pollutants and is always cleansing the atmosphere.41
Industrial emissions and the combustion of fossil fuels for energy emission contribute
considerable amounts of pollutants to the environment. Burning of coal for industrial,
domestic and power generation purposes is the major source for airborne pollutants such as
sulfates, nitrates and chlorides. Sulfur dioxide, one of the airborne pollutants, is set free in
the atmosphere where it dissolves in the moisture to form sulfuric acid. This results in acid
deposition, both in the form of "wet" precipitation (as acid rain or acid mist) and "dry"
deposition, where it is deposited on the surfaces such as the soil, plant leaves and water.19
2.2.3 Airport Pollution
Air transport plays an important role in the global economy as the demand for air travel is
rising in line with the prevailing global economic growth. Like any other economic
activity, air transport has an effect on the environment. This has created concern that the
industry's environmental impact is increasing in proportion to its growth.42
There are several activities in airports with potential to cause pollution if not controlled.
These activities are mainly aircraft servicing and maintenance facilities within the
airports.43 Some soil and groundwater pollution sources from airports are similar to the
pollution sources arising from highways. These include: vehicle pollution (e.g. leakage of
oil and lubricants, and tyre and brake linings wear), pavement wear (breakdown of asphalt
and/or concrete surfaces), maintenance operations (application of de-icing compounds,
pesticides, etc), and accidental spills.44
Almost all airport maintenance facilities clean and degrease soiled vehicle and aircraft
parts in small solvent baths using organic solvents.45 It is extremely difficult to clean the
exterior of aircraft because of their size and the fact that they are built of very sensitive,
lightweight, metal-composite materials. Part of the difficulty also comes from the
non-uniform shape of the aircraft. Hence aircraft bodies and engine parts that are too large
Chapter 2 Literature Review 22
to fit into the parts washers have to be hand cleaned using solvents such as
polychloroethylene (PCE).
Many of the service and maintenance vehicles at airports use petroleum-based hydraulic
fluid systems, including tractors, heavy trucks for clearing runways of snow and ice, and
other equipment. The release of petroleum-based hydraulic fluids can contaminate airport
land and the surrounding waterways. According to Hewitt and Candy, cited by Turer et a/.3*,
aircrafts and vehicles used in airports release aerosols from the combustion of
lead-containing gasoline.
Lubricating greases are used extensively in airport operations maintenance workshops. The
workshop maintains several large trucks used to remove snow and ice from runways and
aprons during winter operations. It also maintains several snowploughs and sweepers that
are attached to the trucks that use hydraulic systems. In addition, the maintenance
workshop is responsible for servicing the grass-cutting tractor and its accessory equipment.
Heavy-duty grease is needed to lubricate and protect all moving mechanical parts of this
equipment.
Another source of pollution from airport maintenance activities is spills from paints.
Vehicle, aircraft, runway and apron-marking paint are mostly oil-based.46 In addition,
aircraft and vehicle tyre wear are sources of pollutants such as Zn and Cd. Lead-acid
batteries are used in most vehicles and pump houses at airports. Batteries that sit unused
for long periods of time or where vehicles sit idling under a heavy load become flat since
crystallised sulfur molecules coat the lead plates. If not handled and recycled properly the
lead in the batteries may be washed away by water and find its way into the surrounding
soils and groundwater.
In conclusion, different sources from the different activities in the airport contribute to soil
and water pollution in the surrounding areas of the airport by heavy metals organic
chemicals and pesticides. Pesticides, herbicides, disinfectants applied to the airfield and
from the air-spraying activities; oils, paints, wastes from workshops facilities, leakage
from pipes and storage tanks, run-off from paved areas, heavy metals from the runway,
and aircraft and vehicles maintenance activities all contribute to water and soil pollution
near airports.43

Chapter 2 Literature Review 23
2.3 FATES OF ORGANIC CHEMICAL (PESTICIDE) AND HEAVY
METAL POLLUTANTS IN SOILS
2.3.1 Soil
Soil is made up of solid components, water and dissolved salts, and air.47 Soil solids have
two kinds of components: inorganic clay minerals derived from weathering of rocks and
organic mineral matter.48 The inorganic mineral matter, silicate and nonsilicate clays, is
made up mostly oxygen, silicon, aluminium and relatively small quantities of other metals,
and accounts, for 50-60% of soils.47 The organic matter, on the other hand, is derived
mostly from plants and microorganisms.48 The air in soils is composed of gases found in
the atmosphere but in different proportions.
Organic
matter
Figure 2.1 Average composition of soil material.47
2.3.1.1 The soil horizons
Soils are deposited in or developed into layers, called horizons, which have a distinct
structure and composition. The soil nearest the surface contains the most humus (plant and
animal materials). The further from the surface (one goes), the less humus and the more
rock particles there are. There might be as many as six different soil horizons, in which the
thickness of each horizon varies with location.49
The top layer is called the 'O' horizon. This layer consists of fresh or decaying organic
materials, such as leaves, dead plants and animal remains. The 'O' horizon is usually thick
in forest soils as these forest areas produce large amounts of organic waste. Other areas,
such as deserts, produce very little organic waste and therefore have very thin or even no
'O' layers. The 'O' horizon has a characteristic dark colour due to the humus formation by

Chapter 2 Literature Review 24
decomposition of organic matter. The layer directly below the 'O' horizon is called the
topsoil or 'A' horizon. This layer is the top most mineral horizon composed of dark
mixture of organic and mineral materials. It is generally darker than the lower horizons
because of greater amounts of decomposed organic matter. This layer is mainly mineral
material and contains most of the soil animals and plant roots. 'A' horizon is the surface
horizon in the absence of 'O' horizon.50
The third layer is called the 'E' horizon, a mineral horizon located under the 'A' horizon. It
is also known as the zone of eluviation because of the maximum leaching of soil
constituents such as humus, Fe and Al compounds occurs in this zone. The fourth layer is
the 'B' horizon, or subsoil. This layer is usually lighter coloured, denser, and lower in
organic matter than the "A' horizon. It is commonly the zone where leached materials
accumulate (illuviation zone). Hence, it contains silicate clay, iron, aluminum, humus and
many of the nutrients that have been washed down by the rain from the 'E' horizon.
Below the 'B' horizon is the ' C horizon. This layer consists of partially disintegrated
rocks and mineral particles, but has no organic material. The lowest horizon, the
' R' horizon, is bedrock. This parent material is the rock from which the minerals in the soil
are removed as well as the source of most of the rock particles found in the soil.
2.3.1.2 Clays
Clays are the active mineral portion of soils, mostly newly re-formed from the soluble
products of the primary minerals.51 Most of the clay minerals are aluminosilicates, with
oxygen, silicon and aluminium being the major elements in their structure.48 Clays are
divided in two major groups depending on the composition of the atoms, in the main
building blocks of the clay structure - silicate and nonsilicate.50
Silicate clay minerals consist of Si-O tetrahedron and Al-0 octahedron structures, where
the Si and Al atoms are surrounded by 4 and 6 atoms of oxygen respectively.47 The Si-O
tetrahedral and Al-0 octahedral structures form chains (sheets) by sharing oxygen atoms.
The Si-O tetrahedral and Al-0 octahedral sheets, in turn, are attached together by sharing
oxygen atoms, and form a unit layer which has definite and repeating arrangements of
atoms.51

Chapter 2 Literature Review 25
Silicate clay minerals can be classified into three groups depending on the ratio of
tetrahedral to octahedral sheets arrangement in a unit layer.47
• 1:1 clay: clays having one tetrahedral to one octahedral sheet, e.g. kaolin, nicrite.
• 2:1 clay: clay with two tetrahedral to one octahedral sheet, e.g. mica, pyrophylite.
• 2:2 clay: clay having two tetrahedral to two octahedral sheets, e.g. chlorite.
Some soils contain large quantities of clay size nonsilicate minerals which have some
similar properties to silicate clays.48 The nonsilicate clays constitute metal oxides and
hydroxides of aluminium, iron and manganese that are commonly found in soils often in
large quantities, and are also known as metal oxides.47'48 Metal oxides occur in soils as free
oxides, clay mineral coatings or clay edges.47
The charge and large surface area of clays are the two important properties to soil.
Substitution of Si and Al by cations of similar size but lower oxidation states, such as Fe2+
and Mg2+is a common occurrence during re-formation of clays from the soluble products
of the primary minerals.51 Substitution of Al and Si by atoms of lower oxidation state thus
gives clays a permanent negative charge.
Another way in which clays obtain charge is protonation and deprotonation of oxygen
atoms.48 The protonation and deprotonation of the oxygen atoms attached to the metal ion
renders a positive or negative charge. The charge obtained by protonation and
deprotonation of metal oxides depends on the pH of the soil solution.48 However, the
charge on clays obtained by isomorphous substitution is permanent. The protonation and
deprotonation reactions at different soil solution pH of Al oxide are shown in equation 2.5.
Aluminium oxides have a positive charge at lower pH (acidic solution), are neutral at
intermediate pH and have negative charge at higher pH (basic soil solution).
AlO" + H+ 5* AlOH + H+ ^ A10H2+ (2.5)
Negative Neutral Positive
2.3.1.3 Soil organic matter
The major portion of the natural organic matter in soils is the recalcitrant remains of
woody terrestrial plants.52 Humus, the degradation product of these plant residues, consists

Chapter 2 Literature Review 26
of 70-80% by weight of the organic matter found in most soils. These altered complex
organic substances are referred to as humic substances if they are soluble or extractable in
aqueous base, and humin if they are not.52 Both hum in and humic substances are made up
mostly of carbon, oxygen and hydrogen with some nitrogen and sulfur. Humin molecules
are larger than humic acid and they contain higher carbon content and lower oxygen
content.54 Humic substances are further subdivided into Julvic acids if they are soluble in
both acidic and basic solutions and humic acids if they are insoluble in acidic conditions
but are soluble at high pHs.
The important features of humic substances is firstly that they contain functional groups,
such as carboxyl (COOH), hydroxyl (OH) and carbonyl (C=0), and secondly their large
molecular size.47 Soil organic matter obtains pH dependent charges by protonation and
deprotonation of these oxygen-containing functional groups. In addition, humic substances
have the potential to form complexes with heavy metals due to the presence of these
oxygen containing functional groups in their structure. Moreover humic acids are more
polar than humin.55 This can be attributed to the higher oxygen content in humic acids.
2.3.1.4 Sorption
Different sorptive mechanisms may operate in soils, including ion exchange, cation
bridging, charge transfer, hydrogen bonding, and van der Waals interactions.56 These
sorptive mechanisms can be categorised into two broad types: physical and chemical
adsorption. Physical or van der Waals adsorption is due to: dipole-dipole, induced dipole
(polarisation or dispersion) and ion-dipole interactions. Chemical adsorption is due to
coulombic forces and results bond formation between the adsorbent (adsorbing specie) and
adsorbate (adsorbed specie). In general, physical adsorption results in a low heat of
adsorption (low binding strength), but chemical adsorption results in high heat of
adsorption (high binding strength).57
Ion-exchange is one form of sorption mechanism in soils. The electrically charged
colloidal surface of soils attracts ions of opposite charge in the soil solution.51 Hence, the
negative and sometimes positive charge site in soil clays and organic matter adsorbs ions
of opposite charge in an exchangeable and nonexchangable form.

Chapter 2 Literature Review 27
The negatively charged soil colloid surface repels anions in the soil solution away from its
surface. This separates cations, which are attracted by the negatively charged surfaces from
the anions in the soil solution. However, the exchangeable cations do not stick to the soil
colloid surface permanently, but dissociate momentarily from the adsorbing surface due to
the heat induced motion.58 The soluble cation in the soil solution can therefore, replace the
exchangeable cation by mass action, i.e. competition for the negative site because of the
large number of ions present.51 This exchange of one cation for another is known as cation
exchange, and takes place on the surface of clay and organic matter (humus) colloids
(equation 2.6). The amount of available charge sites for cation exchange is termed 'cation
exchange capacity' (CEC). The pH dependent sites contribute 10-40% of soil CEC, and
most of the CEC of soil organic matter is pH dependent.
MB ) + Ca2+ ^ V Sml k Ca ) + Mg2+
Unlike the cation exchange capacity, anion exchange capacity arises mainly from the pH
dependent positive charges that develop on soil colloidal surfaces, under strongly acidic
conditions.58 The positive charge on the soil colloids attracts a negatively charged ions
from the soil solution, by a mechanism similar to the cation exchange and this processes is
known as anion exchange.
Another mechanism of sorption is the complex formation of metal ions and charged
surfaces of the clays and organic matter.47 This reaction involves outer sphere
complexation, inner sphere complexation and water bridging. Outer sphere complexation
is the electrostatic attraction between metal ions in the soil solution and oxygen in the clay
or humic substance. This interaction is relatively weak and the cation can be exchanged by
other weakly bonding cations. An inner sphere complexation, on the other hand, is the
bond formation between charged surface containing at least two donor atoms and
unhydrated cation. This interaction is relatively strong, thus the cation can only be
exchanged by cations that are capable of forming inner sphere complexes. In water
bridging the metal ions are not directly complexed with the charged surface, but are
bridged to the charged surface by water molecules.

Chapter 2 Literature Review 28
Hydrophobic retention need not be regarded as an active adsorption mechanism and is
often considered as a partitioning between water and a non-specific organic phase.59
Partitioning is a processes in which the adsorbate dissolves or is spread into the network of
the organic phase. Therefore, partitioning is distinguished from adsorption by
homogeneous, non-specific distribution of the sorbed material throughout the entire
volume of the organic phase. Hydrophobic retention is related to the water solubility of the
adsorbing organic compound and is independent of pH, but does depend on the molecular
size of the adsorbing organic compound. In general, the greater the molecular size, the
greater the adsorption potential is.47
2.3.1.5 Soil pH and oxidation-reduction reactions
Soil solution pH is one of the important properties in soils as it influences the interaction
between soil colloids and soil solution components. Ions in the soil solution have the
potential to change their oxidation states. According to literature,47 iron may be present in
soil solution as FeaI) and Fe(ni), and manganese as Mn(III) and Mn(IV); and the physical and
chemical behavior of these elements depends upon their oxidation state. Moreover, sulfur
exists generally as a soluble sulfate (SOj") in its +6 oxidation state, but in its -2 oxidation
state it exists as S2', which is generally insoluble because of its tendency to form insoluble
covalent metal sulfides. Hence oxidation-reduction reactions affect the interactions of
elements with variable oxidation states as they change their oxidation state from a higher
to lower or vice versa.47
Soil-water pH is one of the soil properties affected by redox reactions. Reducing
conditions increase soil pH by deprotonation of soil water (equation 2.7), while oxidizing
conditions release H* ions from soil water and decrease soil pH (equation 2.8).47 For these
redox reactions to proceed, there should be a source and a sink for the electrons involved in
the reaction. In soils, 02 acts as a sink (electron acceptor) and plant organic residues act as
electron donors (source).47
1. Reducing conditions
2H20 + Mn02 + 2e" • Mn2+ + 40H" (2.7)
2. Oxidizing conditions
H20 + S + 3/2 0 2 • S042" + 2H+ (2.8)

Chapter 2 Literature Review 29
The hydrolysis reactions in soils tend to increase either the acidity or the basicity of the
soil solution depending on the kinds of hydrolysable materials in the soil.55 For instance
Al3+ hydrolysis increases the acidity of the soil solution, but CaCCh hydrolysis increases
basicity of the soil solution.
Al+ + H20 ^ AlOH + H* (2.9)
CaC03 + H20 ** Ca2+ + Off + HC03' (2.10)
In general, soils are complex mixtures of mineral particles of various shapes and sizes;
living and non-living organic materials including microorganisms, roots, and plant and
animal residues; air; and water. Soil is dynamic in nature, where closely interrelated
physical, chemical and biological reactions occur constantly. The physical and chemical
forms of the soil play an important role in influencing the nature of biological and
chemical reactions.
2.3.2 Fate of Organic Chemicals in Soil
Soil can receive a substantial quantity of organic pollutants that are either applied on
purpose or incidentally deposited from a variety of sources. These organic pollutants may
be agricultural chemicals, mainly pesticides, and industrial organics, mostly petroleum
by-products, plastics and resins.47 Following release into the soil surface, the parent
organic chemicals and their degradation products may be subjected to various fates. They
can enter into the soil or be transported to the aquatic environment by run-off into surface
waters and by erosion of contaminated soils into streams. When in the soil, the organic
pollutant can percolate through the top layer, then penetrate through the unsaturated zone,
and eventually reach groundwater in its original form or as a breakdown product.
The environmental fate-processes of organic pollutants in soil is governed by a variety of
complex and dynamic physical, chemical and biological processes.57 These include:
sorption-desorption, biological and chemical transformation, and movement, all of which
depend on the physical and chemical properties of both the soil and organic pollutant.
Sorption is a process of accumulation of a substance (organic pollutant) by adsorption,
surface precipitation and co-precipitation, and diffusion into the adsorbent.60 However,
since sorption processes are reversible, the sorbed organic pollutant can be released back

Chapter 2 Literature Review 30
into the solution by desorption. The sorption-desorption process largely influences the
other fate processes of the organic pollutant by controlling its availability in the soil
solution.
Although this subject has been studied intensively, sorption processes are still not yet fully
understood.60 However, the available information provides some understanding of the
factors affecting adsorption and its mechanisms, and lays the basis for assessing the
behaviour of pesticides in soil and in the environment. For instance, it is now evident that
soil chemical properties, which increase the sorption of organic pollutants, consequently
reduce their transport and therefore protect groundwater contamination.61
Organic pollutant transport processes determine their redistribution within the soil and
eventually into the environment, i.e. into the atmosphere, surface waters and living
organisms. Movement of pesticides within soils can occur by diffusion and mass flow, as
adsorbed on soil particles or by volatilisation. The movement of organic chemicals from
the soil to other parts of the environment (the atmosphere, biosphere and hydrosphere)
occurs by volatilisation, run-off, leaching, absorption and physical removal.
Biotic degradation is the most common process contributing to the disappearance of
organic chemicals from soils.57 The persistence of organic chemicals in the environment
has been shown to be directly related to the rate of its degradation processes.47 Persistence
of organic chemicals in the environment is of great concern since pesticide-residues
remaining in the soil longer than desired may affect the soil biosphere in several ways.
Organisms living in the soil can have their metabolic and reproductive activities affected
by the pesticides. The possibility of pesticide-transfer into other parts of the environment
will also be enhanced by their persistence.
In summary, fate processes can be divided into three major types: adsorption, which is the
binding of pesticides to mineral or organic matter; transfer processes that move pesticides
in the environment; and degradation processes that break down pesticides.
2.3.2.1 Adsorption of organic chemicals (pesticides)
Adsorption is the physicochemical process by which an organic chemical present in the
soil solution bind to the soil particles.57 It controls, directly or indirectly, all the other

Chapter 2 Literature Review 31
processes in the soil that affect organic chemicals by determining how much of the organic
chemical is solubilized and moves to the aqueous and gaseous phase, degrades, or is
consumed by organisms.57 Hence, it represents probably the most important mode of
interaction of organic pollutants with soil components.
a) Soil properties and adsorption
Soil solids provide both a sink for the retention of organic chemicals, and sites for a variety
of surface reactions as they possess a large and chemically varied surface area. The
adsorption behaviour of organic chemicals depends on soil properties such as the soil
moisture, organic matter content, clay content and pH.63 Soil organic matter and clay
content play an important role in adsorption of organic chemicals because they provide a
large number of sites onto which pesticides and other molecules can bind. Organic matter
has an adsorption capacity potential for organic chemicals that may act as cations as well
as for non-ionised organic chemicals that can be adsorbed by physical adsorption.58,64
Studies on the soil adsorption of some pesticides in Australia revealed that adsorption of
the pesticides increases with increase in the organic matter content of the soil, indicating
that the organic matter content of the soil has an influence on the adsorption of pesticides
on soil.64 It has been reported that organic matter is an important contributor to 2,4,5-T
adsorption, and adsorption of the herbicide tended to increase with increase in organic
content of the soil.65
Organic compound adsorption on soil organic matter can be accomplished in two ways.47
Ionic (charged) organic compounds adsorb on charged soil colloid surfaces due to
electrostatic attraction based on coulomb's law of attraction between unlike charges.66 The
adsorbing organic compound produces a positive charge by protonation and a cation
adsorption on soil organic matter occurs. On the other hand, because of the presence of
oxygens and nitrogens in its structure, soil organic matter is slightly more polar than
hydrocarbons, but not as polar as water. Thus, adsorption can occur by
hydrophobic-hydrophobic interactions between soil organic matter and the sorbing organic
compound, since soil organic matter offer a relatively nonpolar environment into which a
hydrophobic compound may escape without too much competition from water.47
Chapter 2 Literature Review 32
Soil pH, or the acid/base balance of the soil solution, has an impact on the chemical's
reactivity and certain soil functions such as microbial metabolism. Acidic and basic
organic compounds have acid dissociation constants, and thus have pH dependent
charges.47 Acidic organic compounds, such as compounds containing carboxylic acid
groups would be fully protonated at pH values approximately two units below their pKa,
and have no charges. However, at a pH approximately two units above their pKa, they
would be fully deprotonated and would be negatively charged. On the other hand, basic
organic compounds, such as amino-group containing pesticides would have no charge
when the pH equals their pKa. But when the pH is two units below their pKa, their
functional sites would be protonated and they would have a positive charge.
A study on the retention of the pesticides diquat and paraquat in soil show that both the
type and the content of clay minerals present in the soil are important for both sorption and
subsequent desorption of the pesticides.67 In addition, the sorption capacity of soils with
significant clay contents (>5%) was found to be very high for these pesticides.
The effect of inorganic ions (salts) on sorption of organic chemicals has been noticed in the
sorption of diquat and paraquat.67 The sorption of these two pesticides on bassendean sand
decreased significantly with increasing concentration of CaCh in the soil solution. This is
because the organic (herbicide) and inorganic (CaCh) cations compete for the sorption
sites. In addition, wet soils tend to adsorb less pesticide than dry soils, either because water
molecules will compete for the binding sites or some of the pesticide molecules will
remain dissolved in the soil water.68'69
Adsorption processes are exothermic and desorption processes are endothermic.'8 Hence,
an increase in temperature will reduce adsorption and enhance the desorption processes. A
temperature effect was observed for the adsorption of organophosphorous pesticides on
clays.70 This effect of temperature on adsorption was attributed to an increase in the
pesticide solubility with increasing temperature, or being an exothermic process, the fact
that adsorption will decrease with an increase in temperature.71 These two factors work
together and both lead to decreased adsorption as the temperature increases.72

Chapter 2 Literature Review 33
b) Organic chemical (pesticide) properties and adsorption
Had it been only the soil properties that govern the adsorption process, all organic
chemicals would have exhibited identical degrees of adsorption on the same type of soil.
But in fact, certain pesticides, even within the same family, appear to be more strongly
adsorbed than others, regardless of the type of colloid present.73 The tendency of different
organic chemicals to adsorb to soil varies with their chemical and physical characteristics,
such as shape, size, polarity and polarisability, acidity and basicity, charge distribution and
water solubility.47
Bailey et al.14 reported that the major factor that determines the extent of adsorption of
acidic and basic compounds on soil is their dissociation constant.74 In addition, there is
some evidence that, within a family of pesticides, there appears to be a relationship
between solubility and adsorption.58'73 Though the relationship between water solubility
and adsorption has been the subject of much controversy, it is widely accepted now that
water solubility may be related to adsorption only within a specific chemical group of
compounds. According to Bailey et al?4 and Leopold et al?s, within a chemical family or
an analogous series, the magnitude of adsorption is related to and governed by the degree
of solubility.
Nonpolar organic compounds are adsorbed on both soil organic matter and clay. However,
the adsorption of nonpolar compounds by organic matter is much greater than their
adsorption by clay. Nonpolar (hydrophobic) organic compounds can be sorbed on the
hydrophobic surfaces in the soil out of the polar aqueous phase through non-specific,
hydrophobic or partitioning processes. Predominant adsorption of nonpolar organic
compounds by soil organic matter has been reported in soils that have a clay content to
organic content ratio of less than 25." Most often, the pesticide Kj (linear distribution
coefficient [L kg"1]) values, which are mostly related to the soil organic content, are used to
describe pesticide adsorption capacity of each soil.47 The adsorption of pesticides by soil
increases with an increase in the pesticide's Kd value.
It has been reported that the soil organic matter, as a whole, is about twice as effective as
the humic acid at adsorption of relatively nonpolar organic chemicals.55 This implies that
the overall polarity of soil organic matter is lower than that of soil humic acid. Thus this

Chapter 2 Literature Review 34
lower polarity and greater sorption capacity for nonpolar organic compounds has been
ascribed to humin which constitutes the major part of soil organic matter.55 Polar organic
compounds show marked partition uptake by soil humic acid, while nonpolar compounds
show greatly reduced and nearly constant uptake by humic acids.
The organic pollutant may be subject to other processes that can affect retention, after it
has been adsorbed. Some chemicals may further react and become covalently and
irreversibly bound, while others are only physically trapped into the humic matrix.
Although limited evidence is available on their occurrence, van der Waals forces are
involved between soil humic substances and non-polar organic pollutants. Hence,
hydrophobic sorption processes vary from complete reversibility to total irreversibility.
The sorption of nonpolar organic compounds by soils has been shown to be highly
correlated with soil organic matter content, but other soil properties such as the type and
amount of clay, soil pH, and hydrous oxide content, have little effect except in low organic
matter systems.76 Because of its polar mineral surface, natural clay is not an effective
sorbent for non-ionic contaminants. But in low organic matter soils, the hydrophobic sites
associated with mineral surfaces are not covered by natural humus materials and hence
contribute to the sorption of nonpolar compounds.79
The effect of adsorption on pollutant migration in soil depends on whether the adsorption
occurs on insoluble, immobile fraction such as clay, humin and humic acids, or on the
dissolved or suspended mobile fraction, such as fu1 vie acids. Organic pollutant interaction
with immobile organic fractions may result in complete immobilisation of the pollutant.
Alternatively the pollutant can attach itself reversibly to the mobile organic soil fractions
and migrate with them. This constitutes a potential time delayed source of contamination
that might affect distant ground.78
2.3.2.2 Transfer of organic chemicals (pesticides)
Organic chemical transfer refers to the movement of organic pollutants from their site of
application. Once organic pollutants are incorporated into soil, they can move to surface
waters through run-off and erosion, to groundwater through leaching and to the atmosphere
through volatilisation. Retention, mass flow, biotransformation/degradation and plant

Chapter 2 Literature Review 35
uptake are processes which have a great influence on the transfer of organic pollutants to
groundwater.80
There are five processes that can move organic chemicals in the environment:
volatilisation, run-off, leaching, absorption and physical removal.
a) Volatilisation
Volatilisation, the movement of organic chemicals in the vapour phase from the soil to the
atmosphere, is an important pathway for the loss of organic pollutants from soil. Once
volatilised, a pesticide can move in air currents away from the treated surface, a
phenomenon known as vapour drift. Vapour drift differs from dust or spray drift in that it
occurs after the organic chemical has settled. The physicochemical properties of the
chemical and the soil, along with the prevailing weather conditions would determine the
extent of volatilisation.
The potential volatility of an organic chemical is dependant on its inherent vapour
pressure.62 However, the environmental conditions and all other factors that control the
behaviour of the organic chemical at the solid-air-water interface influence its actual
vaporisation rates. One of these environmental conditions is the type of soil (the soil
particle size and the soil porosity). The degree of volatilisation of an organic chemical
pesticide can change with a change in the soil composition. Gerritise et a/.81 reported that
approximately 90-98% of some organochlorine pesticides were lost through volatilisation
from a sandy soil within a week, whereas in silt loam soil, the loss ranged from only 9-
63%.
Harris and Lichtenstein82 found that the rate of aldrin volatilisation from the soil rose with
an increase in insecticide concentration, soil moisture, and temperature as well as the rate
of air movement over the soil surface, but lowered with increase in clay and organic matter
content. Similarly, Fang et al.69 observed significant correlation between the loss by
evaporation of the pesticide EPTC and soil moisture. The loss of volatile EPTC is
prevented by its adsorption by the soil particles, and its adsorption was higher in dry soils
than wet soils.68,69 This is because compounds with a very strong affinity to the soil are
strongly bound to soil particles and their concentration in the soil solution will be low,

Chapter 2 Literature Review 36
which implies the loss by volatilisation is low. Nevertheless, Spencer et a/.83 observed that
the moisture content had no effect on the vapour density (volatilisation) of dieldrin, until
the soil was dried to a water content corresponding to about a monolayer of water. A
decrease below this water content caused a steep drop in the vapour density, which may be
attributed to the competition between the water molecules and dieldrin for adsorption sites.
The results of volatilisation tests for 30 pesticides, with and without evaporation, reported
by Jury et a/.84 showed that volatilisation of the pesticides depends on the evaporation rate
of water. In general, the pesticide volatilisation rate is enhanced by evaporation,
independent of the chemical properties of the pesticide.
b) Run-off
Strongly adsorbed chemicals on sediments can be transported laterally when the sediments
are removed by erosion and run-off water. In addition, downward transport into the lower
soil may occur, mainly in aggregated soils characterised by macropores and cracks. The
run-off caused by rain or flowing water is an important mode of organic chemical transport
from soils to surface waters to another soil location. Thus, the associated movement of the
chemical may occur both on the adsorbed solute state or solution form.83 The ratio of the
chemical transported as solution to the amount adsorbed in the suspended particles is
dependent on the organic chemical partitioning between the solid and liquid phases. The
data on the transport of paraquat, atrazine and diphenamide, reported by Leonard et al}5,
showed that transport of atrazine and diphenamide was mainly in solute form whereas that
of the strongly adsorbed paraquat was only in the adsorbed form on sediments.
Though the concentrations of pesticides in sediments are often 2-3 orders of magnitude
higher than in the associated water, most pesticides are lost mainly in the water phase
simply because sediment is usually such a small fraction, by weight or by volume of run
off.86 In general, organic chemical losses in run-off are most likely when a heavy rainfall
occurs or excessive irrigation is applied shortly after a pesticide is applied to the soil
surface.

Chapter 2 Literature Review 37
c) Leaching
Leaching is the movement of water and dissolved chemicals through soil. The pesticide
leaching process can occur in two main mechanisms, diffusion and mass flow. Diffusion is
a process whereby a material moves from a higher concentration to a lower concentration,
at a rate proportional to the concentration, as a result of random movement of the
molecule. Generally, diffusion of organic chemicals in soils is affected by the diffusion
coefficients of the chemical in water and air, adsorption, soil water content, temperature,
and some soil physical properties such as porosity and bulk density. '
Mass flow is the movement of organic solutes associated with a net movement of water.
The mass transport of water in soil, along with the pesticides dissolved and adsorbed to
suspended particles, occurs through a network of pores of various forms, sizes and shapes.
Organic chemicals flowing through soils are subjected to different interactions such as
adsorption, degradation, volatilisation and plant uptake. However, the contact time
between solute and soil solid phase is often insufficient to reach equilibrium, and these
interactions have almost no effect on organic chemical movement.62
Adsorption of organic chemicals by soils and the rate of water flow are the main factors
influencing the transport of the chemical through soil by mass flow. The correlation and
regression analysis data obtained by Helling, showed that the pesticide mobility was
directly related to the water flow. Furthermore, an inverse relationship was observed
between the movement of non-ionic compounds and their adsorption.
Organic matter content of the soil affects leaching due to its impact on pesticide
adsorption. According to Holstein, cited by Bailey et al.,51 an increase in the organic
matter content of the soil results in an increase in adsorption of the organic pollutant to soil
colloids and leads to decreased leaching (mobility) of the pollutant to groundwater.
The mobility of dissolved non-aqueous-phase organic compounds in porous media is
influenced by non-ionic and anionic surfactants.89 Large organic macromolecules (e.g.
humic and fulvic acids, and commercial surfactants) are capable of increasing water
solubility of non-ionic organic compounds, by creating a nonpolar (relative to water),
micellar phase in water that is favourable for contaminant uptake by partition.90 Non-ionic

Chapter 2 Literature Review 38
organic compounds partition into this emulsified phase is in inverse proportion to their
aqueous (pure water) solubilities. Therefore, the presence of humic and fulvic acids, or
commercial surfactants, can increase the apparent water solubility of the solute and thus
increase their mobility. Moreover, anionic surfactant solutions can lower the interfacial
fluid tensions; as a result their downward mobility by gravity and viscous forces of the
organic contaminants increase. However, canonic surfactants are easily exchanged with
inorganic ions such as Ca2+ or Na+ at the mineral-water interface and increase significantly
the sorption of non-ionic organic compounds to the soil from water.89 Thus, the mobility of
non-ionic organic compounds is reduced.
In general, the effect of surfactants and humic material on mobility will be greatest for
nonpolar compounds since they show the greatest sorption and hence the least movement
in the absence of dissolved macromolecules.91 The solute transport of nonpolar organic
compounds is affected by the distribution of organic carbon in a soil-water system.
Immobile organic carbon resulting from the sorption of cationic surfactants, or the
existence of residual hydrocarbons, will provide a hydrophobic environment that increases
the sorption of nonpolar organic compounds from solution and thus decrease their
mobility. On the other hand, mobile organic carbon, such as colloidal organic carbon
dispersed in the solution, increases the mobility of the nonpolar organic compounds by
acting as the carriers of the compounds.92
In addition, the movement of organic chemicals in soils depends on the amount of water
moving through the soil, the chemical's solubility and its degree of adsorption by the soil.
Water flows from higher moisture to points of lower moisture potential, in any direction,
i.e. up, down or sideways, depending on the amount and frequency of the water applied
and the moisture potential of the soil.93,94 Chemicals in the soil solution, thus, move in all
directions with the soil solution. Chemicals that readily dissolve in the soil solution, such
as organophosphorous pesticides, are more susceptible to movement than the less soluble
chemicals in the soil solution such as chlorinated hydrocarbon compounds. The fact that
the aqueous solubility of organophosphorous pesticides, generally, is higher than the
chlorinated hydrocarbon compounds, would indicate that they are much more susceptible
to leaching than the chlorinated compounds.94

Chapter 2 Literature Review 39
d) Absorption (uptake) of organic chemicals (pesticides)
Absorption is the movement of organic chemicals into plants and animals. Absorption of
organic chemicals by organisms is influenced by species characteristics, environmental
conditions, and by the chemical and physical properties of both the organic chemical and
the soil. Once absorbed, organic chemicals may be broken down, passed through, or
remain inside the organism.
The terrestrial and aquatic organisms' uptake of organic chemicals can be higher especially
for hydrophobic or lipophilic organic chemicals. Such chemicals can bioaccumulate in the
food chain. The increase in concentration of a chemical in an organism resulting from
tissue absorption levels exceeding the rate of metabolism and excretion is known as
bioconcen tuition. The bioconcentration factor (BCF), the ratio of chemical concentration in
the organism to that in surrounding water, is often used to quantify the potential of this
phenomenon. The octanol/water partition coefficient (Kow), which quantifies the
lipophilicity or hydrophobicity of a chemical, is a good indication of the BCF.57 Kow can be
used as a measure of the chemical's affinity to the biota or an index of the ability of a
chemical to pass through the biological membrane of living organisms. Hence, chemicals
with high Kow values can pass through the biological membrane; as a result they can
accumulate in the biota. In general, chemicals with log KoW<3 are accepted as
non-bioaccumulating, whereas those with log Kow>3.5 are high-bioaccumulating
substances.95
e) Physical Removal of organic chemicals (pesticides)
When pesticide-treated plants or animals are removed from an area, any pesticide residues
they contain are removed with them. The ultimate fate of those residues is a function of
how the plant or animal is handled. Most harvested food commodities are subjected to
washing and processing that removes or degrades much of the remaining pesticide
residue.96 Plant materials such as turf grass clippings and tree or shrub prunings also may
contain detectable pesticide residues.97 However, composting and decomposition provide
an excellent environment for the degradation of these residues.

Chapter 2 Literature Review 40
2.3.2.3 Degradation of organic chemicals (pesticides)
Degradation of organic chemicals from soil can take place in a number of processes such
as chemical reaction, volatilisation, leaching, photodecomposition and uptake by plants.
Chemical and biological degradation of organic compounds usually involves reactions
such as hydrolysis, oxidation, reduction, alkylation, dealkylation, dehalogenation,
dehydrogenation, hydroxylation, ring cleavage, elher cleavage, condensation, conjugation
and isomerisation.62 Chemical reactions, which include biochemical reactions, however,
are the dominant processes of disappearance of organic chemicals from soil. The chemical
degradation of an organic compound can be either through non-biological or biological
transformation.
Organic chemicals are microbially transformed either directly through metabolic processes
or indirectly through secondary effects of microbial activity that alter soil pH and redox
conditions. The rate of degradation of an organic chemical depends on its chemical
properties, the soil environmental conditions and the microbial activity in the system.57
Organic matter, temperature, moisture and pH generally vary significantly with soil profile
and so does the associated microbial activity. Microbial activity in soils decreases with
depth in soil profile due to the decrease in the organic matter content."
Soil properties can affect the biological decomposition of organic compounds in many
ways.98 For instance, soil organic matter can affect degradation rates of organic compounds
in two opposing ways. On one hand, high organic matter supports the soil microbial
population so that it is accompanied by high degradation rates of organic compounds. But
on the other hand, organic compounds have high adsorptive affinity towards organic
matter, thus high amounts of organic matter in soil may make the organic compounds
unavailable for degradation processes and will lower their decomposition. Hence the
overall pattern of behaviour and the balance of factors will mainly depend on the
individual organic compound.
Depending upon the availability of a sorbed chemical, adsorption may either enhance or
decrease microbial degradation rates in soils.100 Organic chemicals, which are irreversibly
bound to soil organic matter, are isolated from the degrading organisms and thereby
protected from intracellular degradation. On the other hand, organic chemical degradation

Chapter 2 Literature Review 41
by microorganisms can be facilitated since the microorganisms themselves may be sorbed
on locations adjacent to the organic compound in the soil surface.
Soil moisture content, pH and temperature can affect pesticide degradation because these
factors have a direct influence on the microbial activity and pesticide availability
(adsorption) for enzymatic and chemical attack. Guenzi and Beard101 reported that both
temperature and moisture content influenced the chemical conversion of DDT to DDE. In
addition, the solubilities of certain elements found in soil systems are known to be pH
dependent. This may also be very important in determining the extent of biological
availability of pesticides.58 Furthermore, the degradation pathways of pesticides in soil
depend on the soil pH. This influence of soil pH on pesticide degradation pathways is
illustrated by sulfonylurea pesticides; whereby chemical hydrolysis dominates in acidic
conditions, but microbial degradation prevail in alkaline conditions.10
In general hydrolytic reactions, which can be mediated biologically and chemically, can
occur in the presence of H2O, H30+ and OH", and are termed neutral, acid or base
hydrolysis respectively. Therefore, the rate of hydrolysis is strongly pH-dependant and
hydrolysis can be the substantial transformation pathway in soil and water.
Hydrolysis can be a significant factor in the breakdown of certain organic compounds,
particularly below the surface zone where biological processes are often dominant. The
rate of a hydrolysis reaction depends strongly on pH and temperature.103 Humic substances
can catalyse some chemical degradation reactions including hydrolysis. This leads to the
formation of reaction intermediates and products having physical and chemical properties
different from the parent compound and behaving differently with respect to migration in
soil. However, though certain compounds are quite susceptible to hydrolysis, many
experience negligible breakdown by this reaction compared to microbiological
degradation.103
The rate of applications of pesticides to the environment also has an influence on its
degradation rate. Enhanced degradation of certain pesticides with their repeated use has
been observed frequently.104 This is because frequent use of some pesticides may result in
a build-up of a select group of microorganisms in soil, capable of degrading these
pesticides rapidly.57

Chapter 2 Literature Review 42
Soil organic carbon not only has a strong affinity for most non-ionic organic compounds
but it can also promote abiotic transformation.105 Clays with their large specific surface
areas can make equally important contributions. Catalytic effects of clay surfaces in abiotic
transformation of organic compounds (hydrolysis) have been observed on the degradation
of parathion on clays.106 These transformations are also affected by other soil conditions
such as pH, moisture content, exchangeable cations. Similarly, redox reactions can also be
biological or abiotic in nature. Oxidation is likely to be the more important pathway for the
soils in the well-aerated upper vadose zone, whereas in water, especially in groundwater
where oxygen is excluded, reduction is likely.47
Photolysis is another abiotic degradation pathway, in which pesticides are transformed due
to their exposure to radiation.37 Sunlight-induced photochemical transformations are
important pathways in the abiotic degradation of organic pollutants in the top layer of the
soil and waters.103 Photochemical transformations can be direct photolysis processes,
which are initiated by light directly absorbed by the organic pollutant or indirect
(sensitised) photolysis, which involve sunlight absorption by natural photosensitisers or
producers of photoreactants. Humic substances can strongly absorb sunlight and may
behave as initiators of photoreactions.78 Some of them involve secondary reaction products
that have important implications in accelerating, increasing or even determining light
induced transformation of non-absorbing, photochemically stable organic pollutants.
2.3.3 Fate of Heavy Metals in Soils
It is important to learn how the metals are distributed in the soil in order to understand and
predict the fate of these species in soil. The distribution of heavy metals released in soil
from different sources depends on the types and strengths of metal interaction with
individual soil components.107 These interactions of heavy metals with soil components
depend on the heavy metal, its speciation and concentration, as well as upon a range of soil
properties and conditions, including soil pH, redox potential, organic matter content and
composition, clay content and Fe, Mn, and Al oxide content.108
The occurrence of metals in soil can be classified into five physico-chemical forms:
exchangeable (adsorbed by clay minerals); bound to carbonates; bound to iron and
manganese oxides; strongly adsorbed/complexed by soil organic matter and residual

Chapter 2 Literature Review 43
(inorganic hydroxide and sulphide precipitates).109 Water soluble and exchangeable phases
are regarded as mobile and readily phytoavailable, whereas other forms are regarded as
relatively immobile.109'110
The secreted metabolic products of plant roots, such as CO2 and organic acids, can lower
the pH of the soil.111 In turn, the low pH of the soils can promote the release of metals from
their carbonate forms, as shown for the example in equation 2.11. Hence, the carbonate
fraction can be seen as a reservoir of potentially phytoavailable (mobile) metals.
CdC03 + 2H+ • Cd2+ + CO2 + H20 (2.11)
The fate processes of heavy metals in soil, in general, can be categorised into the
following: retention by soil components, transport (leaching) and plant (animal) uptake.
2.3.3.1 Heavy metal retention in soils
There is much concern that heavy metals will enter the food chain via plant uptake or
contaminate groundwater supplies by leaching through the soil. Whether this happens
depends to a large degree on the ability of the soil to retain the metals. Metal retention
mechanisms by soils include the following:108
a. Adsorption on the ion exchange sites of clay and organic matter,
b. Specific adsorption on oxides and hydroxides of iron (Fe), aluminium (Al) and
magnesium (Mg),
c. Chelation and complexation by different fractions of soil organic matter, and
d. Precipitation and co-precipitation as carbonates and sulfides.
a) Adsorption
Heavy metals generally have high affinities for the negatively charged adsorption sites
associated with organic matter and oxide surfaces.66 This is because organic matter and
hydrated oxides of Fe, Mn, Al and Si, retain metal cations by non-specific electrostatic
attraction. Nevertheless, the influence of clays on the total adsorption capacity of a natural
soil for metals is negligible compared to the contribution of organic matter.112

Chapter 2 Literature Review 44
In addition to the non-specific electrostatic attraction by silicate clay minerals, organic
matter and h yd rated oxides of Fe, Mn, Al and Si, cation exchange reactions are important
modes of metal adsorption.108 Generally, specific adsorption of heavy metals by soil
minerals is related to metal ion hydrolysis and the probability of specific adsorption of
heavy metals increases with an increase in the ability of metals to form
hydroxyl-complexes. Brummer113 lists the order of heavy metal hydrolysis as
Cd<Ni<Co<Zn«Cu<Pb<Hg and proposes that specific adsorption increases in the same
order. Similarly, Merrington and Alloway114 reported similar results on the flux of Cd, Cu,
Pb and Zn in mining-polluted soils. In addition, Kuo and Baker1 >s reported that Cu and Pb
have been preferentially sorbed over Cd and Zn.
The rates of adsorption/desorption process are strongly influenced by acidity (pH) and
redox potential. This is because of the influence of pH and redox potential on the amount
of charged sites available on clay and soil organic matter surfaces and the metal speciation.
Wilkens and Loch116 noted that decreasing the pH of soils decreased the retention of metals
by the oxide (aluminium, iron and manganese oxides) fraction. In addition, field studies
have shown that Zn is more available to plants under acid soil conditions than under basic
soil conditions.117 Hickey and Kittrick118, and Chlopecka109 reported that Cd, Cu, Pb and
Zn in natural soils are mainly bound to residual and oxide fractions. Under reducing soil
conditions, however, considerable amounts of metals from this stable fraction can be
released into solution.111*119
b) Complexation
Soil retention capacity is a complex function of soil system parameters and the chemistries
of the metals under existing conditions. One factor that complicates the interactions of
heavy metals in the soil environment is the presence of organic substances capable of
combining with the metals to form soluble complexes and chelates. Organometallic
complexes, which are formed by the interaction of metal ions and negatively charged
organic groups, have great stability.120 Even naturally occurring organic matter in some
soils is capable of complexing a substantial fraction of heavy metals, like Cu, which binds
strongly to organic ligands.121

Chapter 2 Literature Review 45
Within the soil profile, heavy metals tend to be concentrated in the humus-rich topsoil due
to the strong adsorptive capacity of humic compounds. The average stability of heavy
metals complexed with humic ligands decreases with the relative electronegativity of the
metal, i.e. Pb>Cu>Zn>Cd.122
c) Precipitation
Precipitation is another mechanism of heavy metal retention by soils. At high metal
loadings of alkaline and calcareous soils, precipitation of metal hydroxides or carbonates
may begin, which is unlikely in acid mineral soils and in organic soils. Under waterlogged
and reducing soil conditions, insoluble sulfides and carbonates, metal oxides, and
hydroxides of low solubility are formed. Thus, the mobility and possibly the availability of
heavy metals, is lowered.108
Precipitation of divalent heavy metals is not expected to be an important retention
mechanism, since most aqueous solutions are undersaturated with respect to the solubility
products involving this metals.66 However, heavy metals may precipitate when fertilizers
are added to soils containing heavy metals, and locally high concentrations of phosphates
or other salts are present. However, these precipitates would dissolve again upon uptake of
the nutrients from solution by plant roots.
It is difficult to distinguish whether metals are retained by adsorption or precipitation on
soil mineral surfaces, since both retention mechanisms may occur at the soil mineral
surfaces. Harter123 reported that adsorption and precipitation of Pb was pH related.
Adsorption occurred at pH<6, while the precipitation of lead carbonates occurring at
pH>6.
2.3.3.2 Heavy metal movement in soils
Transport of heavy metals in soils may occur:
• in dissolved or suspended form,
• through plant roots, or
• associated with soil (micro-)organisms.
The movement of the dissolved or suspended heavy metals may take place through the soil
solution (diffusion) or the moving soil solution (mass flow). In diffusion, the heavy metals

Chapter 2 Literature Review 46
move from a higher concentration gradient to a lower concentration gradient in the soil
solution. The movement of heavy metals in mass flow, on the other hand, is along with the
soil water in any direction due to either capillary flow or gravity. Moreover, leaching of
clay and organic matter results in the migration of the metals that are associated with these
particles.66
Physico-chemical processes, mainly precipitation/dissolution, control the concentration of
metal species in the soil solution.108 Precipitation-dissolution processes depend on the
solubility of definite compounds in relation to chemical reactions taking place in soils.
However, it is more likely that adsorption-desorption processes which determine the
concentration of an element in the soil solution in conditions where the trace element
content of a soil is lower and there are more sites available for high affinity adsorption.124
The mobility of heavy metals is usually governed by precipitation and organo-metallic
complex formation.125 Chloro-complexes may also have a great influence in determining
the heavy metal distribution in the environment since heavy metals can form chloride
complexes under certain conditions. Organo-metal ion complexes, which differ in their
degree of mobility, are formed in areas where organic matter accumulation takes place in
soluble or colloidal form. Organic ligands play a major role in soil water, and generally in
natural waters, because organic ligands may form stable soluble complexes with metal
ions. There are indications that dissolved heavy metal cations in soil solutions are often to
a large extent associated with organic ligands.121 Soluble organic compounds, found in
soils, that may coordinate with metal ions can be divided into:66
• low molecular organic substances, which include: polysaccharides, proteins,
peptides, amino acids, polyphenols and organic acids. These low molecular
organic substances comprise many ligands, such as citric acid and oxalic acid,
which are known to form stable chelates with metal cations,
• fulvie acids, and
• humie acids.
Leaching is more pronounced in areas with high rainfall. In the absence of large limestone
deposits, these areas will have a low pH value, which promote solubility of heavy metal

Chapter 2 Literature Review 47
compounds.125 However, in areas where high salinity and high pH values prevail,
formation of insoluble compounds is usually expected.
Though the relative mobilities of heavy metals through soils is quite variable, it should be
possible to qualitatively predict the migration of an element through soil on the basis of the
soil's effectiveness for heavy metal retention, which, in turn, is influenced by the physical
and chemical properties of the soil.126 These soil properties are: soil texture, surface area,
the content of hydrous oxides, organic matter and clay mineral content, pH and redox
potential.
Soil acidity and the redox potential have strong influences on the retention and mobility of
heavy metals in soils. According to Plant and Raiswell,127 many metals are relatively more
mobile under acid, oxidising conditions and are retained very strongly under alkaline and
reducing conditions. Acid precipitation, organic matter decomposition and plant root
uptake contribute to the soil acidification.108
Microorganisms may contribute to the transport of these species since heavy metals may
become incorporated in, or sorbed on, them. Earth-worm and other soil microorganisms
may help to translocate heavy metals by mechanical mixing of the soil or by incorporating
metals in their tissues. Although transport through plant roots and transport associated with
micro-organisms may be important under certain conditions, transport of heavy metals
through the liquid phase is the major way.66 This is because the majority of the heavy
metals enter the soil in dissolved or suspended form and virtually all interactions between
heavy metals and solid constituents of soil occur at the solid liquid interface.
Heavy metal deposition from anthropogenic inputs in soils occurs on the top layer of the
soil profile. Miller et al.U9 investigated the mobility and retention of heavy metals (Cd, Cu,
Zn and Pb) in sandy soils. The results revealed that all metals showed somewhat higher
concentration in the top 2.5 cm soil, indicating enrichment of metal in this layer. Acid
treatments of these soils did not cause significant metal translocation to lower horizons.
However, it is proposed that in urbanised areas, the long-term effects of land clearing,
profile disruption, and acid rainfall may increase mobilisation of metals present in these
soils. Boswell128 reported that little movement of any element was found beyond the 30 cm
depth even with high rates of element additions to the soil through sewage sludge.

Chapter 2 Literature Review 48
However, there is evidence that heavy metals are transported down the soil profile far
beyond 30 cm depth. Lund et a/.129, for instance, reported heavy metal enrichment to
depths as great as 3 m on soils below sewage disposal ponds.
2.3.3.3 Plant Uptake
The chemical forms of heavy metals influence their fate in terms of plant uptake or soil
profile migration. The movement and plant availability of several heavy metals was
observed to be greater from inorganic than organic sources such as sewage sludge.130 This
is because most of the metals, which were in a relatively less stable organically bound,
carbonate, and residual forms in the sewage sludge, shifted towards the most stable
residual form, when added to the soil.131
Bioavailability of heavy metals in soil is strongly affected by the pH of the soil solution.
Van der Watt et a/.132 found that heavy metal plant uptake in poultry waste-amended soils
was negatively correlated with soil pH. In highly alkaline soils, leaching of heavy metals
from the surface soil is negligible and their availability to plants is low.133 In general, the
absorption of a heavy metal cation is promoted as pH increases, and is inhibited by some
alkali and alkaline earth cations and by other heavy metals. Liming of the soil reduces the
plant uptake of heavy metal cations largely due to retention of the heavy metals by the soil
colloids.134
In conclusion, soil pollution by organic chemicals (pesticides) and heavy metals is
influenced by various physico-chemical interactions of the pollutant with the soil. The
forms and extent of these physico-chemical interactions largely depend on the nature and
composition of the soil, the physical and chemical properties of the pollutant, and
environmental factors such as climate.

Chapter 3 Materials and methods 49
CHAPTER 3
MATERIALS AND METHODS
3.1 INTRODUCTION
A number of analytical methods are available for testing soils. The quality of these soil
chemical analysis methods is, however, affected by several factors which include: the
quality of field sampling, pre-treatment and preservation of samples, and choice and
application of analytical methods.135 In general, selection of consistent and reliable
analytical methods should be done depending on ease of duplication, availability of
materials, and their facility for accuracy and speed. In this chapter the sampling and assay
methods used during the study will be discussed.
3.2 GENERAL
3.2.1 Sampling and Sample Preservation
Generally a chemical analysis is done on a small fraction of the material of interest,
known as a sample. Sampling is basically a process of acquiring a small fraction of the
material of interest, in which the composition of the small fraction is representative of the
whole material of interest.136 Since the quality of any analytical measurement result
depends on the sample analysed, the composition of the sample should be as close as
possible to the average composition of the material to be sampled.137
Materials that are homogeneous and quite stable in composition may be well represented
by a single sample. However, for inhomogeneous materials, such as ores and soils, which
have variable composition, composite samples obtained by mixing of a series of smaller
samples may average the variation in composition and minimise the cost and effort of
analysis.136
The samples should be stored in appropriate sample containers and suitable preservatives
added depending on the analysis sought. Soil samples for heavy metal analysis should be
stored in plastic containers whereas samples for organic analysis must be stored in glass
containers. This is because glass containers can adsorb some of the heavy metals and

Chapter 3 Materials and methods 50
samples for organic analysis can be adsorbed onto or contaminated by, the organic
constituents of plastic containers.136
3.2.2 Sample Drying and Grinding
Most soil samples contain water that is in equilibrium with the atmosphere. As a result,
their composition depends on the surrounding temperature and relative humidity at the
time it is analysed.137 To avoid this variation in composition, it is common practice to
remove the moisture content of the sample using a suitable method, such as oven drying
or air drying. For organic analysis, in order to render a soil matrix permeable to the
extracting solvent, the soil is either air-dried to remove water, or it is mixed with a drying
agent, such as anhydrous sodium sulfate, to sequester water prior to the placing of the
matrix in the extraction thimble since the extraction solvent is immiscible with water.138
Samples are ground to decrease their particle size to get a better homogeneity in mixing
and to make them suitable for chemical attack by reagents.137 However, the particles
should not be reduced more than required because grinding might cause appreciable
changes in the composition of the sample. Some of the factors that cause appreciable
change in the composition of the sample during grinding are: loss of volatile components
in the sample due to the heat generated during grinding, increased moisture absorption
due to enlarged surface area, and contamination of the samples from the wear and
abrasion of the grinding materials.137
3.2.3 Soil Texture
Soil texture (particle-size distribution) refers to the percentage of sand, silt, and clay
particles in a soil. Particle-size distribution is one of the most stable soil characteristics,
being little modified by human activities.139 Particle-size distribution analysis can be done
using different methods such as sieving and sedimentation procedures.
The sedimentation procedure, which includes the pipette and hydrometer method,
depends fundamentally on Stokes* law, which states that particles will fall out of
suspension at different rates over time, based on the particle size.

Chapter 3 Materials and methods 51
The Stoke's law is expressed as:
y 2g(p,-p r)r2 ( 3 1 )
9r,
where V = velocity of fall (m s"1)
g = acceleration due to gravity (9.81 m s'2)
p,= particle density (often assumed to be 2650 kg m"3)
p r = liquid density (1000 kg m"3)
r = particle radius (m)
x\ = viscosity of the liquid (pa s)
The hydrometer method is the most widely used and sufficient for many purposes, but
less accurate than the pipette method.140 The method is based on the fact that larger
particles fall more rapidly through a column of water than smaller particles, when a
soil/water slurry is placed in a graduated cylinder. The density of water is measured at
different time intervals to determine how much soil is remaining in suspension. Since
sand particles will fall out of suspension first, followed later by silt particles, the relative
amounts of sand, silt, and clay can be determined and the textural class calculated.
The usual methods of fractionation and particle-size analysis require that the particles be
dispersed in an aqueous solution, i.e. that they be detached from one another and
suspended in the liquid. Dispersion of the particles in an aqueous solution, except the
finest colloidal aggregates, can be sufficiently accomplished by shaking the soil in a
dilute alkaline solution of sodium metaphosphate. The adsorption of sodium found in the
dispersing agents in exchange for other cations causes strong electrical repulsive forces to
develop between the soil particles.140 In addition, shearing action or turbulent mixing,
using such devices as mechanical shakers or electric mixers, facilitates the separation of
the particles. However, the mixing should not be so vigorous that individual particles are
broken down in size.
3.2.4 Soil Organic Matter
Organic matter may be estimated from the more reliable determination of organic carbon.
The "organic matter" content is found by multiplying the "organic carbon" content by a
factor of 1.724; which is based on the assumption that soil organic matter contains

Chapter 3 Materials and methods 52
58% carbon.140 However, carbon may be present in soils as organic and inorganic
compounds, or elemental carbon (as in charcoal), and, when high temperature combustion
is used to determine the carbon content of soils, all these forms may contribute to the
measurement, resulting in a positive bias. To avoid the need for a preliminary separation
of non-organic forms of carbon, a wet oxidation method such as the Walkely-Black
method using dichromate as an oxidant is commonly used.141
The Walklcy-Black procedure is used for the determination of soil organic carbon since
plant residues and humus are oxidized but carbon present as graphite or charcoal is not.
Although between 90-95% of the total organic carbon in soil may be oxidized and
measured by the Walkley-Black method, commonly the amount is much less.
The Walkley-Black method involves the oxidation of organic matter with excess
potassium dichromate (K2Cr207) in the presence of acid and reduction of the unreacted
K;Cr:07 by a standard iron(II) ammonium sulfate solution.
The oxidation reaction may be represented by:
C6H1206 + 4K2Cr207+32H+ • 6C02 + 22H20 + 8Cr3++ 8K+ (3.2)
In this reaction, soil organic matter is represented by C6H12O6 and the oxidation number
of C changes from 0 to +4 during oxidation. The reduction reaction back-titration
between unreacted KjGiO? and iron(II) ammonium sulfate in the presence of acid may
be represented by:
CrjO/ - + 14H+ + 6Fe2+ > 2Cr3+ +6Fe3+ + 7H20 (3.3)
From the oxidation and reduction reactions, the number of moles of unreacted K2Cr207
(Y) can be calculated by:
YmolK2Cr207 = VpAS X C F A S (3.4) 6
where, VFAS and CFAS are the volume (dm3) and concentration (M) of iron(II) ammonium
sulfate consumed respectively. The number of moles of K2O2O7 consumed to oxidize the
soil organic matter (X) is then,
X m o l K . C r A = pKiCt^ x C K l Q i 0 J - YmolK2Cr207] (3.5)

Chapter 3 Materials and methods 53
where, VK & 0? and CKiCliQi are the total volume and concentration of K2Cr2C>7 used in
the determination. Since 1 mol K2Cr207 reacts with 1.5 mol carbon, the amount of
orgamc carbon oxidized is 1.5(X mol K2Cr207). As, lmol C = 12.01 g, then
C (mg) oxidized = (X mol K2Cr207)(l .5 xl2.01xl000)(l .33) (3.6)
where 1.33 is a correction factor since the method only recovers a proportion of the soil
organic carbon. The organic carbon content can then be converted to organic matter
content by multiplying it by the van Bemmlen factor (1.724). Therefore,
Organic matter (mg) = (Xmol K A P T X 1 .5 x 12.01 x lOOOXl.33Xl.724) (3.7)
% Organic matter = (Xm.lK,CtiO,)(1.5xl2.01X1000X1.33)(1.724)l00 mass of soil (mg)
3.3 HEAVY METALS
3.3.1 Acid Digestion
A number of analytical techniques, such as atomic absorption and atomic emission
spectrometry (AAS and AES), require dissolved samples when determining the
concentration of an element in an environmental sample.142 Acid digestion is the most
commonly used method for dissolution of the pollutants from the adsorbents especially in
cases where the pollutants are adsorbed on the various soil components.143
Many acid digestion and extraction methods, which make use of a variety of acid
mixtures, have been used for dissolution of metals. However, the ideal method of choice
is one having the combined features of accuracy, reproducibility, simplicity, speed and
safety. Nitric and nitric/perchloric acid digestion are the most commonly used methods
for the extraction of mineral components of organic and geochemical materials. However
care must be taken with perchloric acid, HCIO4, as solid perchlorates have explosive
characteristics. Kovacs et al.142 studied soil sample preparation methods for ICP-AES
analysis and reported that HNO3-H2O2 and HC1-H202 acid mixtures are the best reagents
for dissolution of total concentrations of heavy metals in soils.
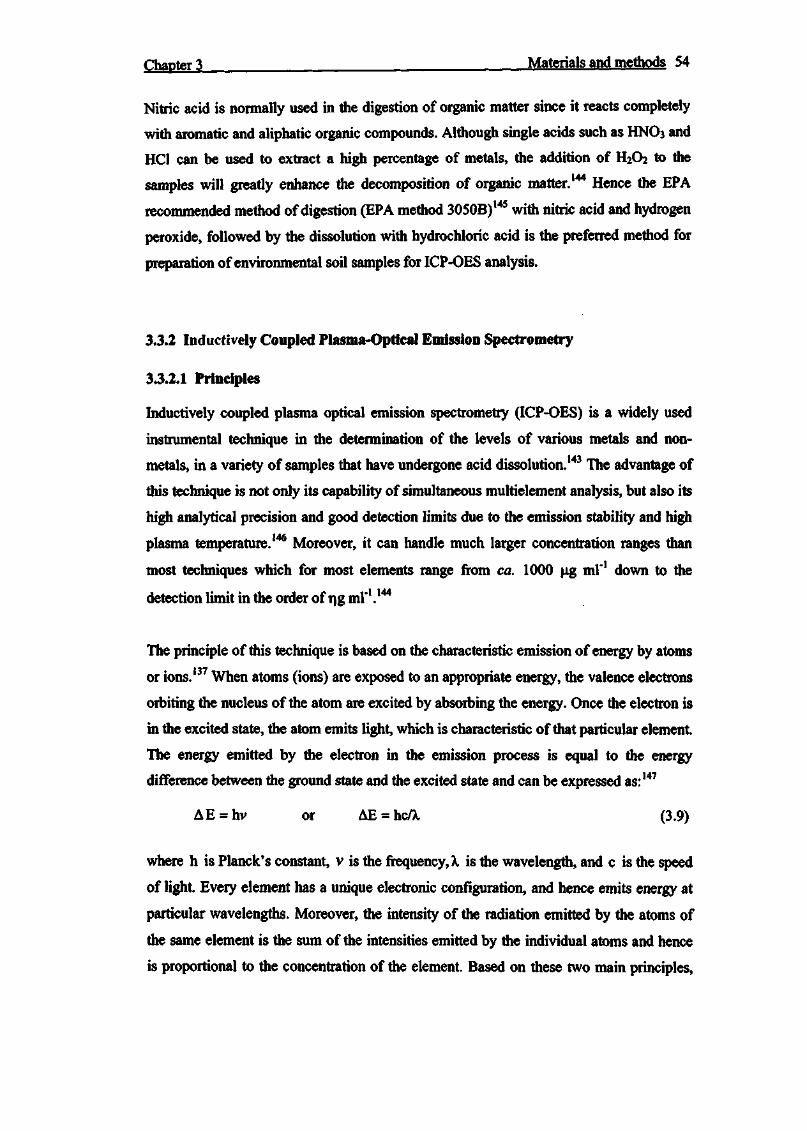
Chapter 3 Materials and methods 54
Nitric acid is normally used in the digestion of organic matter since it reacts completely
with aromatic and aliphatic organic compounds. Although single acids such as HNO3 and
HC1 can be used to extract a high percentage of metals, the addition of H2O2 to the
samples will greatly enhance the decomposition of organic matter.144 Hence the EPA
recommended method of digestion (EPA method 3050B)145 with nitric acid and hydrogen
peroxide, followed by the dissolution with hydrochloric acid is the preferred method for
preparation of environmental soil samples for ICP-OES analysis.
3.3.2 Inductively Coupled Plasma-Optical Emission Spectrometry
3.3.2.1 Principles
Inductively coupled plasma optical emission spectrometry (ICP-OES) is a widely used
instrumental technique in the determination of the levels of various metals and non-
metals, in a variety of samples that have undergone acid dissolution.143 The advantage of
this technique is not only its capability of simultaneous multielement analysis, but also its
high analytical precision and good detection limits due to the emission stability and high
plasma temperature.146 Moreover, it can handle much larger concentration ranges than
most techniques which for most elements range from ca. 1000 ug ml"1 down to the
detection limit in the order of r|g ml'1.144
The principle of this technique is based on the characteristic emission of energy by atoms
or ions.137 When atoms (ions) are exposed to an appropriate energy, the valence electrons
orbiting the nucleus of the atom are excited by absorbing the energy. Once the electron is
in the excited state, the atom emits light, which is characteristic of that particular element.
The energy emitted by the electron in the emission process is equal to the energy
difference between the ground state and the excited state and can be expressed as:147
AE = hv or AE = hcA. (3.9)
where h is Planck's constant, v is the frequency, X is the wavelength, and c is the speed
of light. Every element has a unique electronic configuration, and hence emits energy at
particular wavelengths. Moreover, the intensity of the radiation emitted by the atoms of
the same element is the sum of the intensities emitted by the individual atoms and hence
is proportional to the concentration of the element. Based on these two main principles,
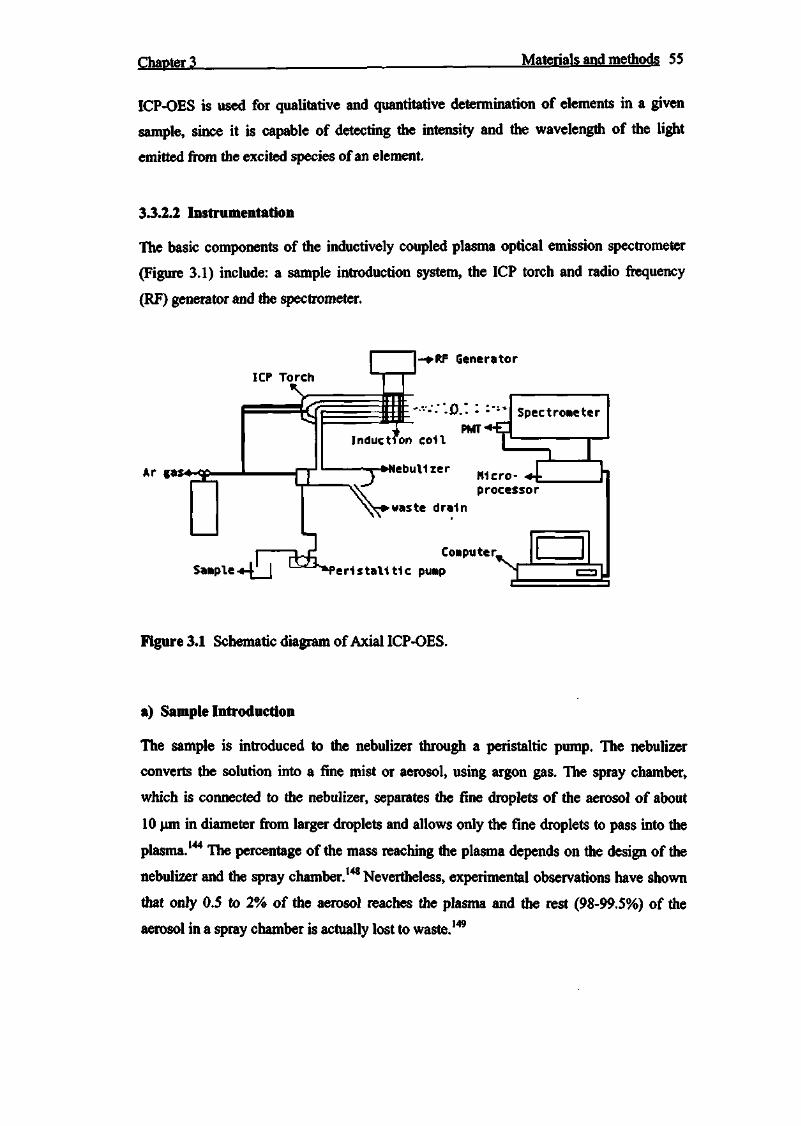
Chapter 3 Materials and methods 55
ICP-OES is used for qualitative and quantitative determination of elements in a given
sample, since it is capable of detecting the intensity and the wavelength of the light
emitted from the excited species of an element.
3.3.2.2 Instrumentation
The basic components of the inductively coupled plasma optical emission spectrometer
(Figure 3.1) include: a sample introduction system, the ICP torch and radio frequency
(RF) generator and the spectrometer.
Ar gas-4-cp
ICP Torch
Sa»ple<4_J
*
a
-*RF Generator
Induction coll
-•Nebulizer
PMT *fi SpectroMeter
T
LLZ^*Per-istall t1
Micro- - * t processor
waste drain
Lomputer .
C pump ^ i
Figure 3.1 Schematic diagram of Axial ICP-OES.
a) Sample Introduction
The sample is introduced to the nebulizer through a peristaltic pump. The nebulizer
converts the solution into a fine mist or aerosol, using argon gas. The spray chamber,
which is connected to the nebulizer, separates the fine droplets of the aerosol of about
10 \aa in diameter from larger droplets and allows only the fine droplets to pass into the
plasma.144 The percentage of the mass reaching the plasma depends on the design of the
nebulizer and the spray chamber.148 Nevertheless, experimental observations have shown
that only 0.5 to 2% of the aerosol reaches the plasma and the rest (98-99.5%) of the
aerosol in a spray chamber is actually lost to waste.149

Chapter 3 Materials and methods 56
There are three common types of nebulizers, the concentric (Meinhard), the cross flow
and V-groove types of pneumatic nebulizers. All these nebulizers use compressed gas to
aspirate the sample.150 The fine aerosol then emerges from the exit tube of the spray
chamber and is transported into the plasma torch via a sample injector.
b) The ICP torch and RF generator
The most commonly used ICP torches consist of three concentric quartz tubes, which are
transparent to radio frequency radiation, and are arranged to provide suitable gas flow
geometry.144 The fine aerosol sample is introduced into the plasma through the innermost
tube of the torch (the sample injector), while the argon gas that flows through the middle
tube (the intermediate gas flow) prevents the plasma from getting too close to the
nebulizer flow, and makes nebulizer injection easier. A tangentially flowing argon gas
through the outer tube of the torch, the outer flow, provides argon gas for initial plasma
ignition, and keeps the load coil cool from the immense heat.
The RF generator produces radio frequency power (an alternating current of 1-3 kW
oscillating at 27 or SO MHz), which is applied to the water-cooled induction coil (load
coil) wrapped two or three times around the ICP torch. The argon gas is made conductive
by seeding with electrons from a spark produced by a Tesla coil. The RF power is
transferred to the conductive plasma through a magnetic field generated by the alternating
current passing through the induction coil. The oscillation of the electrons due to the high-
frequency-induced alternating current results in an ohmic resistance that produces heat
with temperatures as great as 10000 K.137 The continual transfer of energy from the
induction coil to the plasma by the inductively coupled process thus sustains the
conductive plasma, which is used as the atomisation and excitation source.
The sample atoms have a 2 ms residence time in the plasma, with temperatures ranging
from 6000 to 10000 K.137 This high temperature ensures that most of the sample in the
plasma is completely atomised.
c) The Spectrometer
The atomic/ionic spectrum emitted by the analyte atoms is detected by the spectrometer.
The spectrometer constitutes a monochromator for a wavelength selection,

Chapter 3 Materials and methods 57
a photomultiplier tube (PMT) to enhance the signal and a photodetector to determine the
radiation intensity. The spectrometer is attached to a microprocessor and is controlled by
a computer. The emitted spectrum by the analyte has two important features; the
wavelength of the emitted spectrum helps to determine the elemental composition while
the intensity of the detected radiation is employed in determining the concentration of
each element in the sample. Attached to the computer is the printer, which prints the
results.
3.4 ORGANIC CHEMICALS (PESTICIDES)
3.4.1 Extraction and Cleanup
Organic pollutants in waters, soils, sediments, sludges, solid wastes, and other matrices
must be extracted into an appropriate organic solvent for their injection into a gas
chromatography (GC) column. Such extraction enables an increase in the concentration of
analytes in samples by several orders of magnitude for their detection at ppb level.
Depending upon the nature of sample matrices, various extraction techniques, such as
Soxhlet, ultrasonic and supercritical fluid extraction, may be effectively applied for
accurate and low level detection of organics in soil.138
Both the Soxhlet and ultrasonic extraction methods are intended for the complete
extraction of specified analytes or group of analytes from solvent-accessible solid
matrices.150 Soxhlet extraction involves the removal and recovery of organic analytes
from a permeable solid matrix by means of a solvent which is continually evaporated
from a still pot and condensed in such a manner that it falls into and permeates through
the matrix which itself is held in a permeable container in a siphonable chamber. In
Soxhlet extraction, the solvent is continuously purified and recycled and the extracted
material is concentrated in the still-pot.150 This method is applicable to the extraction and
concentration of thermally-stable, water-insoluble and slightly water soluble organics,
which subsequently are usually identified and quantified by chromatographic techniques.
Extraction solvents used for Soxhlet extraction need to be of sufficient purity that the
extract is able to be concentrated for subsequent steps without the impurities interfering
with the analysis.151 Hence environmental matrices require the use of high-grade purity

Chapter 3 Materials and methods 58
solvents. Usually Soxhlet extraction methods of analysis for organic analytes use
acetone-hexane (1:1) or dichloromethane-acetone (1:1) for soil/sediment matrices, and
dichloromethane or toluene-methanol (10:1) for other environmental matrices.150
Sulfur is found in many industrial wastes, marine algae, and sediment samples.138 Sulfur
may mask the region of the chromatogram of interest. Sulfur has solubility characteristics
similar to that of organochlorine and organophosphorous pesticides and its removal is
achieved by treating the extract with one of the following three substances: copper,
mercury, or a tetrabutyl ammonium-sodium sulfite reagent.
3.4.2 Gas Chromatograph-Mass Spectrometer (GC/MS)
3.4.2.1 Introduction
Gas chromatography-mass spectrometry (GC-MS) is a very powerful tool for qualitative
and quantitative analysis of complex mixtures of organic compounds. It combines the
high-performance separation method of gas chromatography with the high-performance
mass spectrometric detection technique. GC separates mixtures of organic compounds on
the basis of their affinities for the stationary phase and MS detects and identifies the
separated components from the mixture of organic compounds based on three-
dimensional information: time, mass to charge ratio (m/z) and intensity.136
GC and MS are highly compatible techniques since both techniques handle the sample in
vapour phase and both deal with about the same sample size (typically less than 1 ng).
When a packed column is used, however, there is a major incompatibility between the
two techniques in the pressure of the carrier gas they handle.153 This incompatibility is
solved by using interfacing devices that reduce the pressure of the carrier gas coming out
of the GC before entering the MS. In capillary column GC, on the other hand, the much
lower capillary flow rates (1-2 ml/min) mean that no special interfacing device is required
to get the pressure down to the MS operating range (approximately 10"6 torr).153
GC/MS can handle a wide variety of samples, including gas samples, biological samples
and soil samples. These samples may require sample preparation processes to make the
samples convenient to be handled by GC/MS, such as liquid-liquid and solid-liquid

Chapter 3 Materials and methods 59
extractions. Most of the results of these sample workup procedures, i.e. gas samples,
biological extract or soil sample extract can be directly injected into the head of the
column for subsequent GC/MS analysis. However, some samples require special
treatment or derivatization prior to injection to the head of the column.
3.4.2.2 Principles
The gas chromatography-mass spectrometry (GC/MS) technique is based on the
principles of chromatographic separation of the components of the mixture and mass
spectrometry identification and quantitation of the separated components.
Chromatographic separation is a dynamic process in which each solute component in a
mixture spends part of the time in the mobile phase and part of the time in the stationary
phase.147 The process is a continuous repetition of concentration equilibration caused by
adsorption and partitioning between a stationary phase and a mobile phase. For each
solute in the mixture, this equilibration can be quantitatively expressed by the partition
coefficient K:154
K = -^- (3.10)
where Cs and Cm are the solute concentrations in the stationary and mobile phases,
respectively.147 The proportion of each molecular species that is in the mobile phase at
any given time is a function of its vapour pressure, i.e. the molecules of the components
that exhibit higher vapour pressure remain largely in the mobile phase.154 But the
molecules of the components that exhibit lower vapour pressure remain largely in the
stationary phase. Hence the magnitude of K is governed by the compound, the nature of
the stationary phase and by the temperature. A high degree of interaction of the
compound with the stationary phase effectively reduces the vapour pressure of the solute
and increases K. Similarly, an increase in temperature increases the vapour pressure of
solutes and decreases K.
The sample mixture is injected and instantaneously vapourised at the column inlet and is
then carried through the column by the carrier gas. While passing through the column,
each component in the sample is adsorbed or is partitioned to the stationary phase
according to its characteristic partition coefficient (K). As a result, the difference in the
partitioning coefficient of the sample components causes differences in the rate of

Chapter 3 Materials and methods 60
movement for each component within the column. The components therefore elute
separately from the column outlet and are separated in time and space.
The components of a sample mixture are effectively separated when there is a difference
in their partition coefficient. The degree of separation is expressed in the relative retention
05 154
a = K,
(3.11)
where K: is the partition coefficient of the more retained compound.
The mass spectrometrie identification of the separated components of a sample mixture is
done by ionisation of the sample components and analysis of the mass spectrum
produced. Identification of a compound based on its mass spectrum relies on the fact that
every compound has a unique fragmentation pattern, caused by the bombardment of the
molecule with electrons or reagent gas ions.152 The ionised sample components are
accelerated to the mass analyser, which separates the particles according to mass to
charge ratio. The pattern of the mass spectrum acquired is then used as a fingerprint for
identification and the intensity for quantification of the compound.
3.4.2.3 Instrumentation
The main components of a GC/MS instrument are: the carrier gas, injector, column, mass 152. spectrometer and control computer, and are shown in Figure 3.2.
A C O L
PC control and data system
Electronics
DetectoA
Pneumatic controls Detector
© o o
© © 0 O O O
F=D Iniector
Column oven
Mass analyser Column passes directly inlo the ion source
Detector
Temperature controls
Figure 3.2 Schematic diagram of a GC/MS.
Chapter 3 Materials and methods 61
a) Carrier gas
The carrier gas is a gas constituting the mobile phase and most commonly consists of
argon, helium, hydrogen or nitrogen.147 The purpose of the carrier gas is to transport the
sample through the column to the detector, hence it must be inert and should not react
with either the sample or the column.156 Impurities in the carrier gas, such as air or water
may cause sample decomposition and deterioration of both the column and the
detector.147 Therefore, the purity of the carrier gas should be at least 99.995%.156
b) Injector
The function of the sample injection system is to receive the sample, vaporise it
instantaneously and deliver the vapourised material to the head of the analytical column
with minimum initial band width.155,156 To accomplish this, the injector has small inlet
volume and is equipped with heating system for adequate vaporisation of the sample.156
The injector system maintains the pressure and the flow through the analytical column
during the injection process and prevents air from entering into the column.155
The injection of liquid samples into GC is usually done by means of a microliter syringe
through a self sealing silicone septum.156 There are three major GC injection techniques:
split, splitless, and on-column. The most common type of GC injector is a combined
split/splitless, which can be used in two modes; splitless mode for trace analysis (very low
concentration of analyte) but split mode for major component analysis (high
concentration of analyte).156 In the splitless mode the sample injected is vaporised in a
heated chamber and passes directly into the capillary column, after a pre-determined time
the split vent is opened to allow excess solvent vapour to escape thus preventing column
overload by the solvent.155 When used in the split mode, however, the carrier gas enters
the chamber and can leave by three different routes, the column, split vent and septum
purge.155 The septum purge flow prevents septum bleed components entering the column
system. The injected sample vaporises rapidly to form a mixture of carrier gas, solvent
vapour and vaporised solutes, a portion of which passes onto the column while the greater
volume leaves through the split vent. The ratio of the split flow to column flow rate is
called the split ratio. Split ratios vary from 10 to 1000:1 .,57

Chapter 3 Materials and methods 62
The split injection mode is the best way for dealing with samples containing high
concentrations of analyte since it prevents column overloading. Splitting, however can be
the source of two major problems, poor detection limits due to small sample size and
non-representative samples due to discrimination at the time of injection.156
c) Column
Open tubular capillary columns can be divided into two classes: wall coated open tubular
columns (WCOT) and support coated open tubular (SCOT) columns. The wall coated
open tubular columns are by far the most common, comprising a silica, (or sometimes
glass or stainless steel) tube with an internal diameter in the range 0.1 -0.5mm and a length
of 15-30m.1"" Fused silica columns, coated with a polyamide to protect them from
atmospheric oxidation, are flexible and easy to install and to handle compared with glass
and steel tubes. The bonded phase silica column, in which the stationary phase is
chemically bonded onto the silica column, is the most common high-resolution column,'ss
and has a considerably higher maximum operating temperature, low bleed and a much
longer life compared with film coated columns.156
The column in GC/MS is heated by an accurately temperature-controlled fan blown oven
with adequate space to accommodate several columns and with an even temperature
distribution throughout the oven.155 Therefore, chromatograms can be performed under
isothermal or temperature programmed conditions. Limitations of isothermal GC/MS
analysis are that compounds with a high boiling point temperature in unknown samples
may go undetected or will give very low, broad peaks that are difficult to accurately
quantify.156
Program mod- tempera t u re GC is therefore preferred for its improved detection limits and
precision of peak measurement, and reduced analysis time.156 Moreover, chemical
transformations of unstable sample materials are minimised and the required speed of
injection is not as fast as for isothermal methods. Care must be taken that the initial
temperature in programmed temperature GC/MS should be lower than the boiling point
temperature of the lowest-boiling components in the sample.

Chapter 3 Materials and methods 63
d) Mass Spectrometer
The tremendous versatility of MS is in large part due to the wide variety of mass
analysers that are available.132 The different types of mass spectrometers are usually
characterised on the basis of the physical property they employ to separate ions of
different mass-to-charge ratio (m/z).
• In a time-of-flight (TOF) instrument, ions are separated on the basis of their different
velocities down a flight tube.
• In a magnetic sector instrument, ions are separated on the basis of their different
curvatures through a magnetic field.
• In a quadrupole mass spectrometer and a quadrupole ion trap, ions are separated on
the basis of their stability in the presence of a radio frequency (RF) electric field.
According to Story, cited by March,158 quadrupole and ion trap mass spectrometers
comprise more than 75% of all mass spectrometers; most likely because these particular
mass analysers provide the best combination of sensitivity, performance, size, ease of use
and cost. With respect to sensitivity there are minor differences between the detection
limits of various mass spectrometers used in GC/MS instruments. Selectivity can be
enhanced through the use of selective ionisation techniques and/or more specific MS scan
modes.152
The MS consists of an ionising source, an accelerating system, an analyser with an ion
collector, a vacuum system and computer controlled data management system.156
Chemical alteration of the analyte occurs in the ionisation chamber by various means,
including electron ionisation (EI) and chemical ionisation (CI).156 EI is the most generally
used ionisation source, consisting of tungsten or rhenium filament heated by electric
current to a temperature at which electrons are emitted.156 The electrons are accelerated in
a potential field of 5-100 V and attain energies in the 50-100 eV range, but most
instruments have standardised on 70 eV electrons, so that spectra can be compared with
computerised libraries of spectra.156 High vacuum is maintained in the ion source to
minimise reaction between the ions formed and other ions or radicals.156

Chapter 3 Materials and methods 64
EI is the most common ioni sat ion mode, typically employing 70 eV electrons to "knock"
an electron off a sample molecule and produces a positively charged ion by the following • 152
reactions:
M + e" — M+* + 2e- (3.12)
M-+* — M+ (3.13)
M'+* — A+ + B- (3.14)
M . + . _ > c + + D ( 3 1 5 )
This process results in an ion population with a distribution of energies which can
subsequently undergo collisional or vibrational deactivation to form the molecular ion
M+, fragmentation to form the ion A+ and radical B", or rearrangement to form the ion C +
with a loss of neutral molecule D. The result is a mass spectrum that includes a wide
range of fragment ions that can serve as a fingerprint for that compound.
CI is the next most common ionisation technique. It is typically employed to provide an
increased molecular ion signal from which a compound's molecular weight can be
deduced. The major reactions associated with CI are illustrated below, when methane is
used as a CI reagent gas.I52
CIL, + e' — CH4+ + 2e" (3.16)
CH4+ + CH4 — CH5+ + CH3- (3.17)
M + CH5+ — MH+ + CH4 (3.18)
Methane is preferentially ionised by an EI process to form the ion CH4'+. when the
pressure of the methane reagent is significantly greater than that of the sample molecule
M. This cation then undergoes a proton transfer reaction with neutral methane molecule
to produce the reagent ion CHs+, which in turn undergoes another proton transfer reaction
with the sample molecule M to form a protonated molecule MH+.
Most of the positive ions formed will carry a single charge since it is much more difficult
to remove further electrons from an already positive ion. These positive ions are

Chapter 3 Materials and methods 65
persuaded out into the mass analyser by the ion repeller, another metal plate carrying a
slight positive charge, and the ions are accelerated into a finely focused beam.
The quadrupole ion trap mass analyser (Figure 3.3) consists of three hyperbolic
electrodes: the ring electrode, the entrance endcap electrode and the exit endcap
electrode.158 These electrodes, when held at appropriate potentials, cause the formation of
a pseudo potential cavity in which it is possible to trap (confine) ions for a long period of
time. Both endcap electrodes have a small hole in their centres through which the ions can
travel.
Ring electrode Fundamentals
M O T 7
** B̂— -̂*
Endcap XL jO\ I Electrode ^"^
Auxiliary RF
Figure 3.3 Schematic diagram of quadrupole ion trap.
Ions produced from the ion source enter the trap through the inlet focussing system and
the entrance endcap electrode. Various voltages are applied to the electrodes to trap and
eject ions according to their mass-to-charge ratios. The ring electrode RF potential, an a.c.
potential of constant frequency and variable amplitude, is applied to the ring electrode to
produce a 3-dimensional quadrupolar potential field within the trapping cell.158 This will
trap ions in a stable oscillating trajectory confined within the trapping cell.
When the amplitude of the RF potential applied to one of the ion trap electrodes is
changed, it produces instabilities in the ion trajectories and thus ejects ions of a particular
mass-to-charge ratio in the axial direction.158 Hence, mass selective ejection of ions is
done by changing the amplitude of the RF potential in a linear fashion. The ions ejected in

Chapter 3 Materials and methods 66
order of increasing mass-to-charge ratio are focused by the exit lens and detected by the
ion detector system.
The principal difference between a quadrupole and an ion trap ioniser is that ions are
filtered in quadrupole analyser in an oscillating electromagnetic path, whereas an ion trap
confines the ions with the oscillating electromagnetic field.159 The ion trap analyser is
more sensitive but less precise for quantitative analysis than quadrupole mass analysers.
When an ion hits the metal box in the detector, an electron jumping from the metal onto
the ion neutralises its charge. This leaves a space amongst the electrons in the metal, and
the electrons in the wire shuffle along to fill it. A flow of electrons in the wire is detected
as an electric current, which can be amplified and recorded.
e) Computer
GC/MS instruments have computers equipped with data systems so as to enable both
instrument control and to handle the raw data flow, which is hundreds of times more than
other detectors in GC. Some major functions of the GC/MS computer include:156
• optimisation and controlling the mass-scanning voltages, ionisation source,
accelerator and ion collector,
• monitoring the entire system, providing error messages and taking corrective action,
• comparing chosen spectra with tens of thousands of spectra in the library,
• tabulating the relative intensities of the strongest lines in chosen spectra, and
• filing, retrieving, scaling and displaying both chromatograms and spectra.

Chapter 4 Heavy Metals: Experimental, Results and Discussion 67
CHAPTER 4
HEAVY METALS: EXPERIMENTAL, RESULTS AND
DISCUSSION
4.1 INTRODUCTION
Soil and ground water heavy metal pollution from activities of aircraft on the runway are
generally similar to the pollution on and around highways. Several studies have reported
that soils close to a highway are contaminated by heavy metal pollutants, such as cadmium,
lead, chromium and zinc, which come mainly from the fuel combustion emissions and tyre
and metal platings on car parts.36,165'161,162 Likewise, soils close to an airport runway can be
contaminated by different heavy metal pollutants originating from different aircraft related
sources.
A study on the heavy metal levels of soils adjacent to the runway was thus carried out to
assess the impact of the aircraft activities on the soils in the vicinity of the runway.
4.2 MATERIALS AND METHODS
4.2.1 Sampling
The runway in the airport was expected to be the point source from which heavy metals,
which arise from the tyre wear through friction with the runway asphalt, brake lining wear
and aircraft body abrasion can contaminate the surrounding soil. Hence, sampling points
for heavy metals on the airport were chosen along the sides of the runway.
The runway extends 1580 meters from south to north and has a 30-meter width. Samples
were taken at every 100 meters starting from the south end of the runway, on the east and
west side of the runway (Figure 4.1). However, in places where pronounced tyre wear
indications (i.e. skid marks) were observed, samples were taken at distances of 50 meters
apart. Each sample was taken 2 meters away from the adjacent edge of the runway.

Chapter 4 Heavy Metals: Experimental. Results and Discussion 68
Legend
• Sample points 100
Scale 1 :6000 100 200 300 400 Meters
N
Figure 4.1 Sampling site and sampling points for heavy metal analysis. The map is compiled,
georeferenced and mosaiced from four aerial photographs.163

Chapter 4 Heavy Metals: Experimental. Results and Discussion 69
The soil samples were taken using a bucket auger from the top 0-15 cm of the soil. Three
sub-samples, 1 meter apart, were taken from each sampling point and mixed to get a
representative sample of every sampling point. At least 1 kg of the composite sample was
taken for each sampling point. The samples were collected in polyethylene bags, the bags
were labelled and a site description was also recorded for each sampling point.
4.2.2 Sample Drying and Grinding
The samples were spread over a plastic sheet laid in cardboard boxes and air-dried at room
temperature (approximately 25 °C) for 2-3 days. Stones and plant materials were removed
from the soil samples and the soil sample was mildly crushed using a mortar and pestle.
The soil sample was then divided into three portions and the portions were sieved
sequentially using sieves with mesh sizes of 2.0 mm, 1.0 mm and 0.5 mm (Laboratory test
sieve BS410/1986, Serial No. 311641, Endecotts, London, England) for analysis of soil
texture, heavy metals and organic matter. The soil that passed through the 1.0 mm size
sieve was collected in a properly labelled plastic bag and was ready for analysis.
4.2.3 Texture and Colour
The soil samples from the east and west sides of the runway were grouped into three
categories, based on their colours as shown in Table 4.1. One representative sample from
each category was taken for texture and colour analysis. The colour of the soil was
determined by comparing against the colours in the Munsell chart (Munsell Soil Colour
Charts, 1992, Macbeth, New York).
Table 4.1 Soil samples grouping according to their colour.
Group
1
2
3
Samples
E-102-E-107,E-111-E-115, W-102 - W-107, W-l 11 - W-l 15
E-108-E-110.W-108-W-110
E-100,E-101,E-116-E-118, W-100,W-101,W-116,W-117
Soil colour
Brown
Yellowish Brown
Dark Brown
Representative sample for texture analysis
E-105
E-109
E-117
The texture (particle size) of soil samples was determined using the hydrometer method.139
A 50 ml aliquot of calgon solution (40.0g sodium hexametaphosphate and 9.1 g sodium

Chapter 4 Heavy Metals: Experimental, Results and Discussion 70
carbonate dissolved in one litre of hot distilled water) was added to a stirrer cup which
contained 50 g of air-dried soil sample, that had passed through a 2.0 mm sieve. About 500
ml of distilled water was added to the stirrer cup and the mixture was stirred for 5 minutes
in a stirrer. After allowing the cup to stand for 1 min, the suspension was poured carefully
into a 1 litre sedimentation cylinder. The cup was then rinsed with distilled water to ensure
that all the soil material was transferred to the sedimentation cylinder. The volume of the
suspension was then raised to 1000 ml by adding distilled water. The temperature of the
suspension was measured using a thermometer and was used to determine the time
required for the sand and silt to settle (Ri and R2) from the table given in the method.
After removing the thermometer from the cylinder, the soil suspension was mixed
thoroughly and carefully using a plunger. The plunger was then removed and the timing
for the first reading was started immediately. At approximately 30 s before the first reading
(Ri), the hydrometer was lowered carefully into the suspension, causing as little turbulence
as possible. After taking the first reading, the hydrometer was removed from the cylinder
and the cylinder was kept covered with a watch glass until the time for the second reading.
A second hydrometer reading (R2) was taken at the corresponding time by lowering the
hydrometer in the suspension as described for the first reading. A blank reading (Rb) was
taken using the same procedure described for the samples, but with no soil in the cylinder.
The moisture content of the air-dried soil samples was determined by taking about 10 g of
the air-dried sample in a pre-weighed 100 ml beaker. The soil was then oven-dried
overnight at 105 °C, allowed to cool in a dessicator and weighed. The percentage of
moisture content was then calculated using the loss in mass of the soil. The % sand, silt
and clay contents of the soil samples were then determined using Rj, R2, Rb and the
moisture content. Finally, the texture of the soil was determined from the texture chart
using the % sand, silt and clay contents of the soil samples.
4.2.4 Organic Matter Content and pH
The organic matter content of the soil was determined by the Walkley-Black oxidation
procedure140 using an air-dried soil sample sieved to pass the 0.5 mm sieve. 10 ml of a
standard 0.017 M potassium dichromate (Saarchem) solution was added to 0.50 g of the
soil sample in a 500 ml Erlenmeyer flask and was mixed by swirling. Then, 20 ml

Chapter 4 Heavy Metals: Experimental. Results and Discussion 71
concentrated H2SO4 (98% Set Point Instruments) was added carefully, the solution was
mixed gently in a fume cupboard for 1 minute, and was left to stand for 20 minutes. A
170 ml aliquot of ultra-pure water, 10 ml of concentrated H3PO4 (85 % Saarchem), 0.2 g
of NaF (AnalaR 99%, BDH) and 5 drops of ferroin indicator (BDH) were added. A blank
sample was run following the same procedure, omitting only the soil.
Iron(II) ammonium sulfate (FAS) (99%, Saarchem) was used as titrating solution for the
sample. The blank sample was titrated first to standardize the iron(II) ammonium sulfate
and to recognise the titration endpoint more easily when the solution is titrated. The
volume of iron(II) ammonium sulfate used to turn the blank sample gradually from golden
brown to dark green then to bright green and finally to brownish black was noted and used
to determine the concentration of FAS used. The volume of FAS consumed by the soil
sample solution to turn to a dark brownish black was also noted. The percentage of organic
matter is calculated using equation 3.8, given in chapter 3.
The pH of the soil samples was determined in a 1:2.5 soil:water ratio suspension on a mass
basis.140 A 10 g air-dried soil (that had passed the 2.0 mm sieve) sample was weighed in a
50 ml beaker and 25 ml of distilled water was added. The sample was stirred rapidly for
5 seconds with a glass rod then allowed to stand for 50 minutes. The solution was stirred
again and allowed to stand for another ten minutes. The pH of the supernatant liquid was
then measured and recorded with a glass electrode and a pH meter (Crison micropH 2000
microprocessor controlled pH meter). The pH meter was calibrated with standard buffer
solutions of pH = 4.00 and pH = 7.00 prior to sample pH measurements.
4.2.5 Acid Digestion
Sample preparation of the soil samples from the runway area for heavy metal analysis by
ICP-OES was done by an acid digestion method (EPA-3050-B).145 A 10 ml aliquot of 1:1
HNO3 (65% pesticide grade, Fluka) was added to 1.00 g of soil sample (that had passed the
1.0 mm sieve) in a 100 ml digestion vessel. The resulting solution was covered with a
watch glass and heated in a water bath for 15 min in a fume hood. After allowing the
solution to cool, 5 ml of cone. HNO3 was added and the solution was refluxed for 30 min
in a water bath after covering the digestion vessel with a watch glass. This step was

Chapter 4 Heavy Metals: Experimental. Results and Discussion 72
repeated until no more brown fumes were given off. Then the solution was heated for 2 h,
without boiling, by covering the digestion vessel with a watch glass.
The solution was then allowed to cool, and 2 ml of water (ultra pure) and 3 ml of 30%
H2O2 (chemically pure, Saarchem) was added. The solution was again heated until the
effervescence subsided and then allowed to cool. A 1 ml aliquot of 30% H2O2 was
continually added with warming until the effervescence was minimal. The total amount of
30% H2O2 was limited to about 10 ml. Then the sample was heated for two hours.
After allowing the solution to cool, it was refluxed for 15 min after first adding 10 ml of
HC1 (30%, Fluka) and covering the digestion vessel with a watch glass. The solution was
then diluted to 100 ml with ultra pure water in a volumetric flask. Finally, the solution was
filtered using Whatman filter paper No. 41, collected in a polyethylene plastic container
and stored in a refrigerator until it was analysed using ICP-OES.
4.2.6 Operating Conditions of ICP-OES
The analytical wavelengths recommended in method 3120-b of the Standard Methods for
the Examination of Water and Wastewater164 were used to select the working wavelength.
The instrument detection limit, the wavelength, and the peak search window of each
analyte used in the analysis are given in Table 4.2. The selection of the working
wavelength from the alternative wavelengths was based on their freedom from spectral
interferences from the other elements.
Table 4.2 Wavelength, calculated instrument detection limit (dl) and peak search window
used in the ICP-OES analysis of heavy metals.
Element dl (/ig/1) Wavelength (nm) Peak Search window (nm) Cd Co Cr Mn Pb Zn
1.5 5 4 0.3 14 0.9
214.438 228.616 267.716 257.610 220.353 213.856
0.027 0.027 0.040 0.040 0.027 0.27
dl: three times the standard deviations of seven replicate results of a blank.
The specifications and operating conditions of the ICP-OES (Figure 4.2) used in the
analysis of the total concentration of the heavy metals are given in Table 4.3.

Chapter 4 Heavy Metals: Experimental Results and Discussion 73
Figure 4.2 Varian Liberty 150 AX Turbo ICP-OES Instrument used in this research.
Table 43 ICP-OES Instrument specification and operating conditions used for analysis.
Instrument
Integration time
Replicates
Power
Plasma
Auxiliary
Sample uptake rate
Nebulizer (Pneumatic)
Stabilisation time
Rinse time
Sample delay
PMT (Photomultiplier)
Correlation coefficient limit
Hg line reslope
Monochromator type
Tubing
Liberty 150 AX Turbo (Ser. 95081574), Varian Australia
PtyLtd.
1.00 sec
3
1.00 kW
15.0L/min
1.5L/min
2.2ml/min
240 kPa
15 s
10 s
30 s
800 V
0.995
every 4 hours
Air
Nalgene™ 180 PVC Metric tubing

Chapter 4 Heavy Metals: Experimental. Results and Discussion 74
4.2.7 Calibration Curve
ICP ready-to-use standard solutions (Fluka) were used to prepare the standard solutions for
the ICP-OES calibration curves. These solutions contain 1.000 g/1 of the respective heavy
metal analytes each. From these standard solutions, a mixed stock standard solution
(1000 ppm) containing all the target analytes was prepared. The working standards were
then prepared by diluting the stock solution. The respective volume of stock solution was
pipetted into a 100 ml volumetric flask and made up to the mark using 0.1 M UNO;
(65% pesticide grade, Fluka) solution. The concentrations of the working standards are
given in Table 4.4. A 0.1 M HNO3 solution was used as a blank.
Table 4.4 Concentration of standard solutions (ppm) used for ICP-OES calibration.
Standard Standard Standard Standard Standard Standard Standard Analyte
Cd
Co
Cr
Mn
Pb
Zn
1
0.005
0.05
0.05
0.05
0.05
0.05
2
0.05
0.5
0.5
0.5
0.5
0.5
3
0.01
1.0
1.0
1.0
1.0
1.0
4
0.25
2.5
2.5
2.5
2.5
2.5
5
0.50
5.0
5.0
5.0
5.0
5.0
6
1.00
10.0
10.0
10.0
10.0
10.0
7
2.00
20.0
20.0
20.0
20.0
20.0
Initially the instrument was switched on and allowed to warm for at least 30 minutes
before starting the analysis. Then it was aspirated for at least 60 seconds with a blank
solution to eliminate any carryover from the previous sample (or standard) run. The blank
and standard solutions were then run, starting with the blank and followed by the standard
with the lowest concentration, in the order of increasing concentrations.
The correlation coefficients of the first order calibration curves obtained from the analysis
of the standard solutions were >0.995 for Cd, Co, Cd, and Mn, but were <0.995 for Pb and
Zn. Hence, the standards were run in second order calibration curves, in which correlation
coefficients >0.995 were obtained. The graphs of calibration curves constructed by plotting
concentration versus intensity of the standards are shown in Figure 4.3.

Chapter 4 Heavy Metals: Experimental, Results and Discussion 75
Oi Cbonttnani (nin) Co Concentration (pom)
5 10 IS Cr Cbactntration (ppm)
jH.70»ltfx42.43*10'
R?-<X9996
20
Mi Concentration (ppn)
y~8«&2+5.44ntfx-5.O5*10i!
5 10 IS 20
Pb Concentration (ppm)
lAKf-
uwef-
«wrf-
shy
S 60xlrf-• —
4MCf-
20UOf-
Q0<
y~XT\*to?+722>Vf#S7S
tf=Q9»J
c — • — i — i — i — i — i — i — i — i
s » Zn
15
(pan)
3D
Figure 4.3 Standard calibration curves for cadmium, cobalt, chromium, manganese, lead and zinc.

Chapter 4 Heavy Metals: Experimental Results and Discussion 76
4.2.8 Statistical Analysis.
Genstat®-Release 4.2165 was used to run all statistical calculations and the graphs are
constructed using the computer statistical package, Microsoft® Excel 2000.
4.3 RESULTS
4.3.1 Texture and Colour
The results of the texture and colour analysis of the representative samples from each
group are given in Table 4.5.
Table 4.5 Texture and colour analysis results of the representative samples.
Moisture content E-105 E-109 E-117
Mass of empty beaker 48.20 Mass of beaker + soil 58.32 Mass of air dry soil (Ma) 10.12 Mass of beaker + soil after oven drying 5 8.00 Mass of oven dry soil (Md) 9.80 % Mass moisture content= ((Ma-Md)/Md)*100 3.27
50.69 60.71 10.02 60.56 9.87 1.52
49.24 59.25 10.01 59.05 9.81 2.04
Texture Analysis E-105 E-109 E-117 Mass of air dry soil (g) 50.0 Equivalent mass of oven dry soil (Mod) (g) 48.4 Temperature for first reading 22.0 Hydrometer reading Rb (g/1) 1.0 First hydrometer reading Rl (g/1) 19.0 Rl corrected for blank = Rl - Rb (g/1) 18.0 Temperature for second reading 22.0 Second hydrometer reading R2 (g/1) 8.0 Silt + Clay = ((Rl - Rb)*100)/ Mod (g/lOOg soil) 37.2 Clay = ((R2 - Rb)* 100)/ Mod (g/1 OOg soil) 14.5 Silt = (Silt + Clay) - Clay (g/lOOg soil) 22.7 Sand = 100 - (Silt - Clay) (g/lOOg soil) 62.8
50.0 49.2 22.0 1.0 14.0 13.0 22.0 6.0 26.4 10.2 16.2 73.6
50.0 49.0 22.0 1.0
29.0 28.0 22.0 14.5 57.2 27.6 29.6 42.8
Soil Texture from texture triangle Sandy loam Sandy loam Clay loam Colour Brown Yellowish Brown Dark Brown

Chapter 4 Heavy Metals: Experimental. Results and Discussion 77
4.3.2 Organic Matter Content and pH
The organic matter content obtained from the analysis of the soil samples collected for
heavy metal analysis using the Walkley-Black oxidation procedure (section 4.2.4) are
given in Table 4.6.
Table 4.6 Organic matter contents (%) of soil samples from the runway.
Sample
No.
100 101 102 103 104 105 106 107 108 109 110 111 112 113 114 115 116 117 118
Distance from south end of
runway (m)
0 100 255 353 444 542 640 735 830 928 1018 1093 1143 1193 1293 1343 1473 1573 1603 Fpr l.s.d s.e
% Organic
East
4.0 3.7 1.2 0.65 0.96 1.4 0.69 0.55 0.72 0.52 1.0 0.34 0.52 0.96 1.0 0.86 5.3 4.4 4.4 <.001 0.35 0.12
matter
West
1.5 2.0 0.86 1.1 1.2 1.2 1.4 1.1 0.90 1.1 2.1 1.0 1.6 1.5 0.76 1.0 4.0 3.8 -
<.001 0.15 0.05
Figure 4.4 shows the trends of organic matter contents of soil samples from the east and
west sides of the runway. From the table it can be seen that the organic matter of the soil is
generally higher for sampling points close to the two ends (south and north) of the runway.
In addition, sampling points E-105 and W-110 show relatively higher organic matter
contents than the neighbouring sampling points.

Chapter 4 Heavy Metals: Experimental. Results and Discussion 78
Organic matter - East side of the runway
i 4 09
E
a E? o
J? 2
200 400 600 800 1000 1200 1400
Distance from the south end of the runway (m)
1600 1800
Organic matter - West side of the runway
200 400 600 800 1000 1200 1400
Distance from the south end of the runway (m)
1600 1800
Figure 4.4 Organic matter contents (%) of soil samples from the east and west sides of the runway.

Chapter 4 Heavy Metals: Experimental. Results and Discussion 79
Higher pH ranges were obtained in soils from the east side of the runway than soils from
the west side. The pH values of the soils (Table 4.7) varied from 5.55 to 6.95 in the east
side and 5.92 - 6.20 in the west side.
Table 4.7 pH analysis results of the soil samples from the runway.
Sample No.
100 101 102 103 104 105 106 107 108 109 110 111 112 113 114 115 116 117 118
Distance from
runway (m) 0
100 255 353 444 542 640 735 830 928
1018 1093 1143 1193 1293 1343 1473 1573 1603 Fpr l.s.d s.e
pH
East
6.89 6.95 6.60 6.73 6.46 6.07 6.30 6.71 6.20 6.47 6.57 6.62 6.74 6.03 6.13 6.40 5.95 5.83 5.55
<.001 0.184 0.062
West
6.10 6.10 6.34 6.51 6.52 6.41 6.21 5.92 6.29 6.25 6.39 6.13 6.13 6.29 6.51 6.51 6.26 6.15
-
<.001 0.153 0.051
The pH values of the soil samples from the east and west side of the runway are
graphically shown in Figure 4.5.

Chapter 4 Heavy Metals: Experimental. Results and Discussion 80
pH-East side of the runway
200 400 600 800 1000 1200 1400 1600 1800
Distance from the south end of the runway (m)
pH -West side of the runway
8
7.5
7
6.5
5.5
5
4.5
4
200 400 600 800 1000 1200 1400 1600 1800
Distance from the south end of the runway (m)
Figure 4.5 pH values of the soil samples from the east and west side of the runway.

Chapter 4 Heavy Metals: Experimental. Results and Discussion 81
4.3.3 ICP-OES Analysis Results of Heavy Metals
The total concentrations of the heavy metals Cd, Co, Cr, Mn, Pb and Zn in the soil samples
from the east and west side of the runway, expressed as mg per kilogram of soil, are
presented in Tables 4.8 and 4.9. The mean concentrations are calculated from the values
obtained from four replicate measurements for every sample.
Variance analysis of the results showed that there is significant difference (P = 0.05) in the
results with the given least significant difference (l.s.d.) and standard error (s.e.) values for
all the heavy metals of interest.
Table 4.8 Heavy metal concentrations of samples east of the runway.
mple No.
E-100 E-101 E-102 E-103 E-104 E-105 E-106 E-107 E-108 E-109 E-110 E-lll E-112 E-113 E-114 E-115 E-116 E-117 E-118
Distance from south end of runway (m)
0 100 255 353 444 542 640 735 830 928
1018 1093 1143 1193 1293 1343 1473 1573 1603
Fpr
l.s.d. s.e
Mn
4110 6410 4500 4490 7150 5270 4000 2380 4700 2100 2240 1140 4450 4980 2960 2430 1440 1950 2470
<0.001 522 185
Mean concentration (mg/kg) [i
Cr
126 114 103 82 155 100 83 66 58 49 52 48 76 98 69 56
115 119 136
<0.001 17 6.1
Zn
60 50 67 74 76 60 58 78 83 85 77 87 78 76 70 79 57 31 44
<0.001 3.8 1.4
Cd
3.6 4.2 3.6 3.4 4.4 3.3 2.9 2.8 3.2 2.7 2.6 2.5 3.9 4.0 3.1 3.0 2.3 2.5 2.6
<0.001 0.20 0.07
a* = 4]
Co
60 91 51 45 72 55 40 29 41 27 23 22 40 53 32 26 23 30 36
<0.001 3.4 1.2
Pb
51 63 50 43 54 44 37 31 36 28 28 24 49 54 34 38 62 35 51
<0.001 7.8
2.75 *: number of replicate samples

Chapter 4 Heavy Metals: Experimental. Results and Discussion 82
Table 4.9 Concentrations of the heavy metals in samples west of the runway.
Sample No.
W-100 W-101 W-102 W-103 W-104 W-105 W-106 W-107 W-108 W-109 W-110 W-lll W-112 W-113 W-114 W-115 W-116 W-117
Distance from south end of runway (m)
0 100 255 353 444 542 640 735 830 928
1018 1093 1143 1193 1293 1343 1473 1573 FOT
l.s.d. s.e
Mn
3860 6490 6920 5860 4480 4670 4420 2470 2410 2740 3840 5100 4000 4370 5290 3900 2230 2510
O.001 418 170
Mean concentration (mg/kg) [
Cr
137 128 83 124 113 115 120 86 65 85
143 141 93
112 103 109 91 98
0.001 17 5.9
Zn
63 53
109 86 79 64 55 72 67 67 60 61 66 75 71 59
167 38
0.001 7.8 2.8
Cd
3.6 4.4 3.7 4.3 3.7 3.5 3.1 2.6 2.6 2.7 3.2 3.3 3.0 3.4 3.4 2.9 2.1 2.3
0.001 0.22 0.08
n* = 4]
Co
57 97 45 55 40 49 42 27 24 23 39 43 32 35 41 35 26 28
0.001 4.5 1.6
Pb
58 69 37 50 41 41 38 30 24 34 29 47 39 36 34 37 154 33
O.00 12 4.3
': number of replicate samples
In Figures 4.6- 4.9, the mean concentrations for each heavy metal in the sample from both
the east side and west side of the runway are plotted against distance of the sampling point,
by taking the south end of the runway (sampling points E-100 and W-100) as a reference
point. Figures 4.6 and 4.7 show that samples E-104 and E-113 have higher Cd, Co, Cr, Mn
and Pb concentrations compared to their surrounding sampling points. Similarly, Cd, Co,
Mn and Pb show higher concentrations at points E-101 and E-108. In general, Cd, Co and
Cr show similar trends in the graphs for samples from the west side of the runway. The
"box" in the plots represents the 95% confidence interval for each set of results and the
ends of the "whiskers" represent the maximum and minimum values obtained. The mean is
given alongside each box.
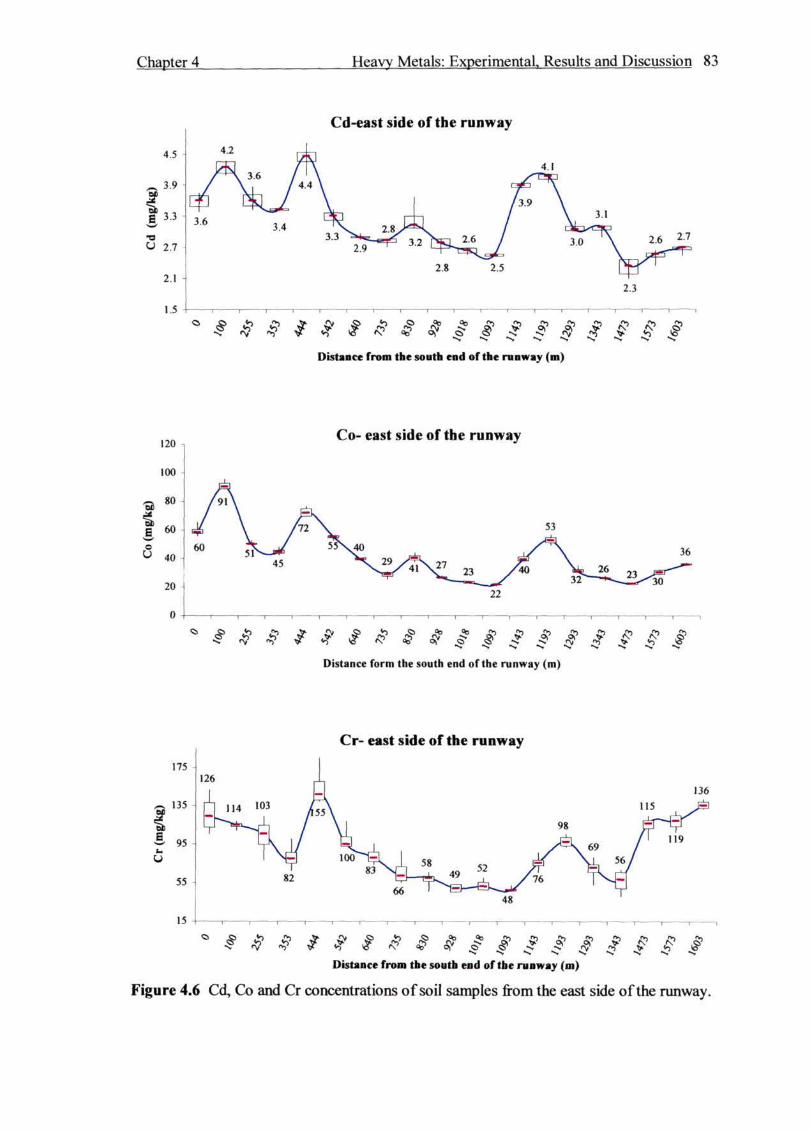
Chapter 4 Heavy Metals: Experimental Results and Discussion 83
4.5
S 2.7
2.1 H
1 5
Cd-east side of the runway
* $ $ £ , ' -i 1 1 r-i i
* ? # £ $ J J? | Distaace from the south end of the raaway (m)
120
too -
Q 8 0 " -i
a 60 J
3 40^
20
0
An
60
1
sN 45
/72
T
Co- east side of the runway
55\40 J
22
53
3?"
1
26 23 ^30
36
Distance form the south end of the runway (m)
175
135
-S 95 la
u 55
15
Cr- east side of the runway
- i ( 1 1- T 1 1 1
Distance from the south end of the niaway (m)
Figure 4.6 Cd, Co and Cr concentrations of soil samples from the east side of the runway.

Chapter 4 Heavy Metals: Experimental Results and Discussion 84
Mn-East side of the runway
-3
1 I 1
9000 1 8000 -7000 6000 -5000 J 4000 3000 2000 -1000 J
7150 6410 i
/ \ 4 5 0 0 / V X **—"=? 527b\
' T .« 'W90 -.n&v 4110 400(\ .
4700 4450
. / \ 2240 /
2 & ° 2100 \ y 1140
1 1 1 1 1 1
4980
\ k 2 4 3 ° 1950 2 9 6 0 ^ ^ J*HA10
1440 1 1 1 1 1 1
Distance from the south end of the runway (m)
Pb-East side of the runway
80
70
60
a 40
- 3<> —
20
10
0 -i 1 1 r-
Distance from the south end of the runway (m)
Zn-East side of the runway
100 90 X0 70 60 50 40 30 H 20 10
- I 1 1 1 -
* 4? # # * • ?*&$$$ f g g g f S 6 f Distance from the south end of the runway (m)
Figure 4.7 Mn, Pb and Zn concentrations of soil samples from the east side of the runway.

Chapter 4 Heavy Metals: Experimental. Results and Discussion 85
Cd-West side of the runway
4
3 1.5 i
0.5 H _, , , , r- "T 1 1 1 1 1 r-
Distance from the south end of the runway (m)
Co-West side of the runway
120
100
80
f 60 w O
<-> 4 0
20
Distance from the south end of the runway (m)
Cr-West side of the runway
180
160
140 -
? 120 -
100 -
B 80
U 60
40
20
0
143
$ # # * # # # # f g g $ f $ $ Distance from the south end of the runway (m)
Figure 4.8 Cd, Co and Cr concentrations of soil samples from west side of the runway.

Chapter 4 Heavy Metals: Experimental, Results and Discussion 86
Mn-West side of the runway 8000 7000
-a 6000
e* 5000
8 4000
fl 3000 * 2000
1000 0
649J_i / ^ M O S , - 5100 5300
H 4480 ^ \ j y tp ' *«t 3860 X? 7 0 | ™y^ 4001 3901^
^~2410
1 1 1 1 1 1 1 1 1 1 1 1 1 1 1 T
2230 , ^+"~2510
1 1
^w "V "V *N "̂» ^*
Distance from the south end of the runway (m) f $
180 160 140
_2 120 "a 100 -E 80
60
40
20
0
-cu
58
1
69
37
1 ,
50
i r
Pb-West side of the runway
-» -J !_ . 30 34 29 A -*r ~it-~^^2^*^r47
1 1 1 1 1 1 1 1
39
r
36
1
34
P
37
r
154
33
^v **v Nr *Sr **v *N "N
Distance from the south end of the runway (m) £
250 n
200
ft | ,50
^ 100
50
Zn-West side of the runway 167
^** %f *** "S *N
Distance from the south end of the runway (m) •ST 4 ?
Figure 4.9 Mn, Pb and Zn concentrations of soil samples from west side of the runway.

Chapter 4 Heavy Metals: Experimental. Results and Discussion 87
4.4 DISCUSSION
It is evident that the soil in the runway area had been disturbed during the construction of
the runway. It is highly probable that the majority of the soil, close to the runway where
samples were taken, is either new to the area or the topsoil has been removed, and
therefore is quite different from the soil in the surrounding area. Consequently, it was not
practical to take a soil sample to be used as control from the surroundings of the runway,
which is not affected by the runway activities.
The soil texture analysis results of the representative samples for the soil samples show
that soils at sampling points 100, 101, 116, 117 and 118 on both sides of the runway are
clay loam, while soils at sampling points 102-115 are sandy loam. This suggests that the
background concentrations of these two groups of soils could be different. In addition, the
colour of the clay loam soils, at both the south and north of the runway, is darker than that
of the sandy loam soils found in the middle parts of the runway, which indicate that the
clay loam soils have higher organic matter contents than the sandy loam soils. This
suggestion agrees with the results obtained from the organic matter analysis of the soil
samples.
Soils at both south and north ends of the runway showed higher organic matter content and
clay contents. The organic matter content of the soils in the east was found to be higher
than their corresponding west side samples, for the clay loam type of soils (samples 100,
101, 116 and 117). However, most of the sandy loam type of soils (samples 102-115),
exhibited higher organic matter contents in the west side soils than the east side soils. East
side samples showed a wide range of pH values (5.55-6.95) as compared to the west side
samples (5.92-6.52). Moreover, the samples for east side of the runway exhibited a
decreasing trend in pH values from the south end to the north end, but the pH values of the
west side samples appear to be less variable.
The results of the analyses carried out on the soil samples and the baseline values on South
African soils reported by Herselman et al,m for the heavy metals are summarised in Table
4.10 and Figure 4.10 shows a comparison of these summarised results graphically.
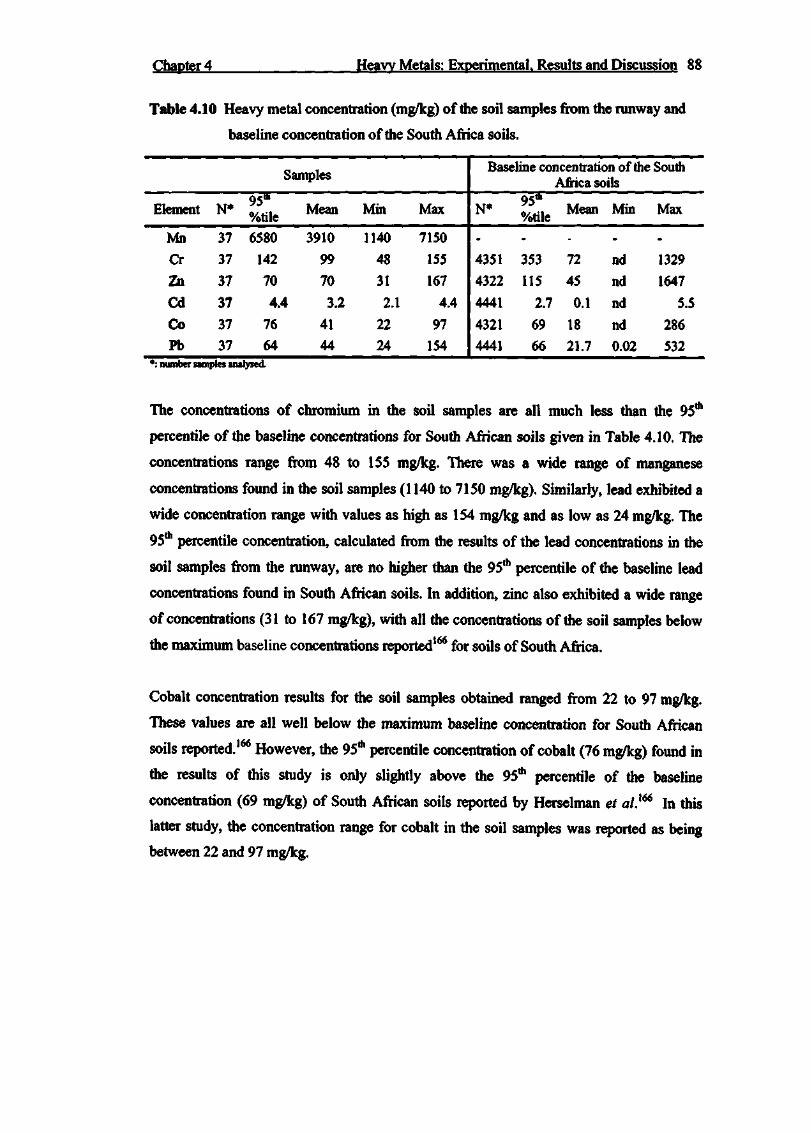
Chapter 4 Heavy Metals: Experimental. Results and Discussion 88
Table 4.10 Heavy metal concentration (mg/kg) of the soil samples from the runway and
baseline concentration of the South Africa soils.
Samples
Element
Mn Cr
Zn
Cd
Co
Pb
N*
37
37
37
37
37
37
95"' %tile 6580
142 70
4.4
76
64
Mean
3910
99
70
3.2
41
44
Mm
1140 48
31
2.1
22
24
Max
7150
155
167
4.4
97 154
Baseline concentration of the South Africa soils
N*
-
4351
4322
4441
4321 4441
95* %tile -
353
115
2.7
69
66
Mean
-72
45
0.1
18
21.7
Mm
-
nd
nd
nd
nd
0.02
Max
-
1329
1647
5.5
286 532
*: number samples analysed.
The concentrations of chromium in the soil samples are all much less than the 95
percentile of the baseline concentrations for South African soils given in Table 4.10. The
concentrations range from 48 to 155 mg/kg. There was a wide range of manganese
concentrations found in the soil samples (1140 to 7150 mg/kg). Similarly, lead exhibited a
wide concentration range with values as high as 154 mg/kg and as low as 24 mg/kg. The
95th percentile concentration, calculated from the results of the lead concentrations in the
soil samples from the runway, are no higher than the 95th percentile of the baseline lead
concentrations found in South African soils. In addition, zinc also exhibited a wide range
of concentrations (31 to 167 mg/kg), with all the concentrations of the soil samples below
the maximum baseline concentrations reported166 for soils of South Africa.
Cobalt concentration results for the soil samples obtained ranged from 22 to 97 mg/kg.
These values are all well below the maximum baseline concentration for South African
soils reported.166 However, the 95* percentile concentration of cobalt (76 mg/kg) found in
the results of this study is only slightly above the 95* percentile of the baseline
concentration (69 mg/kg) of South African soils reported by Herselman et a/.166 In this
latter study, the concentration range for cobalt in the soil samples was reported as being
between 22 and 97 mg/kg.

Chapter 4 Heavy Metals: Experimental Results and Discussion 89
Gd O G>
6
5
4
9
a 2
1
0
—
_
1400
1200
1000
800
e 600
400
200
0 H
350
300
250
6o200
B 150
100
50
Samples Baseline Sanies Baseline Samples Baseline
Pb / n
w>
6001
500-
400-
300-
200
100
0
&
5
mpl cs ft tM'li ne
-95th percentile
- M a n
1800 -I
1600
1400
1200-
M1000
f 800
600
400
200
n u
a Samples
i -
Bi tscli 1
ne
Figure 4.10 Comparison of the heavy metal concentrations of the sample and the baseline
concentrations for South African soils.166 The boxes in the graph represent
the range of values.

Chapter 4 Heavy Metals: Experimental. Results and Discussion 90
The results for cadmium concentrations varied from 2.1 to 4.4 mg/kg, with all the samples
having concentrations below the maximum of the cadmium baseline concentrations in
South African soils (5.5 mg/kg), found by Herselman et al.m (Table 4.10). Nevertheless,
the concentrations for 73% of the soil samples from the runway are above the
95th percentile of the cadmium baseline concentrations reported.166
There are some distinct patterns in the concentrations of Cd, Cr, Co, Mn and Pb on the east
side of the runway (Figures 4.6 and 4.7). Generally the results of Cr, Cd, Mn and Pb
concentrations for the samples on the east side of the runway show a decrease from south
to north along the runway up until sampling point E-111. On the other hand Cr
concentration increases from south to north for the rest of the sampling points. This
increasing and decreasing trend of heavy metals follows the slope of the runway, which
slopes down from a point close to the middle to the south and north ends. Hence, the
increase in the heavy metal concentration down the slope can be attributed to the transport
and deposition of these metals by rainwater. Moreover, the trends are similar to the trends
exhibited by the clay and organic matter contents of the soil, on which heavy metals are
readily adsorbed. This indicates that the organic matter and clay content have a significant
contribution to the accumulation of these heavy metals in the soils.
Similar results have been observed in several studies. Li and Shuman167 observed the
accumulation of Pb and Cd on top soils that have relatively high levels of organic matter,
and attributed the accumulation of these metals in the top soils to the binding of the metals
to soil organic matter. Miller et a/.168 also reported the increase in accumulation of Cd and
Pb with the increase in clay and organic matter content of soils. Similarly, Lu et al.m
found significant and positive correlations between organic carbon content of soils and Cr,
Pb and Zn concentrations. However, in contrast to the results obtained in this study, they
reported that Zn and Pb were inversely correlated to soil clay content.
The trend for zinc on the east side of the runway is different from those of the other metals.
It showed low concentrations at both the south and north ends of the runway, where the
organic and clay contents of the soil are relatively higher than the rest of the soils close to
the runway. It also showed higher but relatively constant levels in the in the sandy loam
soils, a trend contrary to that exhibited by the rest of the heavy metals in the east side of the
runway.

Chapter 4 Heavy Metals: Experimental, Results and Discussion 91
Three sampling points have noticeably higher concentrations than their neighbouring
sampling points and appear to fall out of the general trend in the east side of the runway.
These sampling points with highest concentrations of all the heavy metals, except Zn,
compared with the rest of the sampling points were found at approximately 400 meters
from the south and north ends (sampling point E-104 and E-113) and the central part
(sampling point E-108) of the runway. These points correspond to the runway areas where
a considerable number of tyre wear marks are observed, which indicates the points where
the aircraft tyres make the first contact with the runway during landing.
The trends of the heavy metal concentrations on the west side of the runway are different
from the trends observed on the east side of the runway. The concentrations of chromium,
cadmium and manganese showed more or less similar trends. Generally, the concentration
of these metals decreased from the south end towards the north up to sampling point
W-110. The concentrations, then increase up until sampling point W-114 and again
decrease towards the north end of the runway. On the other hand, the results showed higher
concentrations for Pb at sampling points W-101 and W-116. Similarly Zn showed higher
concentrations at sampling points W-102 and W-116. However, relatively constant
concentrations were found in the rest of the samples. The unusually high concentrations of
both lead and zinc, approximately 4 fold and 2 fold of their mean concentration
respectively, suggests that it is highly probable mat this was due to the contamination of
this particular area from sources other than the routine activities of the runway.
Soil and ground water pollution sources from airports are generally similar to the pollution
sources in highways. Several studies have reported that soils close to a highway are
contaminated by heavy metal pollutants, such as cadmium, lead, chromium and zinc,
which come mainly from the fuel combustion emissions and tyre and metal platings on car
parts.37,160,161,162 Likewise, soils close to a runway can be contaminated by different heavy
metal pollutants originating from different aircraft related sources. These sources of
pollutants are the fuel combustion products, the tyre wear and other aircraft body abrasion.
Cd, Co, Cr, Mn, Pb and Zn were expected to contaminate the soils around the runway since
they are related to the aircraft in one or the other of the following uses:
• Most forms of fuel contain some heavy metals. Hence the combustion produces
aerosol emissions that contain heavy metals such as Pb and Zn.

Chapter 4 Heavy Metals: Experimental. Results and Discussion 92
• Tyres, brake linings and lubricant oils are other sources of heavy metal
contaminants such as Zn, Cr, Co and Cd.
• Mn is used not only in dry cell batteries, but also as an additive to improve the
regeneration of diesel exhaust filters and as an antiknock agent.
• The galvanized metals used in making aircraft are coated with chromium.
In general, fuel combustion, tyre and brake linings wear, lubricant oil spill and other
aircraft body abrasion and wear are the possible sources of the heavy metals of interest in
the soils close to the runway. Nevertheless, the trends and levels of the heavy metal
contaminants are different in the east and west side of the runway. This difference may be
due to the effect of the topography and climatic conditions (wind direction) on the
movement of the medium of transport, such as water and air, of these heavy metal
contaminants on the surface of the soil.160 Moreover, the percolation of water down the
profile is slow since the soils are made compacted for obvious construction reasons. This
will facilitate the horizontal transport of heavy metals especially areas where there is
significant sloping of the surface of the soil.
Pearson's correlation coefficients165 were used to examine any relationships between the
levels of the heavy metals in the different sampling points to find out if the heavy metals
are originating from the same source. The correlations were calculated in two ways:
• including all sampling points and
• excluding sampling points at the south and north ends of the runway (sampling
points E-100, E-101, E-l 16, E-l 17 and E-l 18),
The second option was chosen because, as mentioned before, the soil properties (such as
texture and organic matter) were different at the extreme ends of the runway. Also, any
aircraft activity would be different at the ends of the runway compared to the central part
of the runway. The correlation matrixes for the heavy metals calculated using the
concentration of these metals obtained from the analysis results are given in Tables 4.11
and 4.12.
The correlation coefficients (Table 4.11) show that Cd, Co and Mn are highly correlated in
samples from the east side of the runway (r > 0.84). In addition, Pb showed high
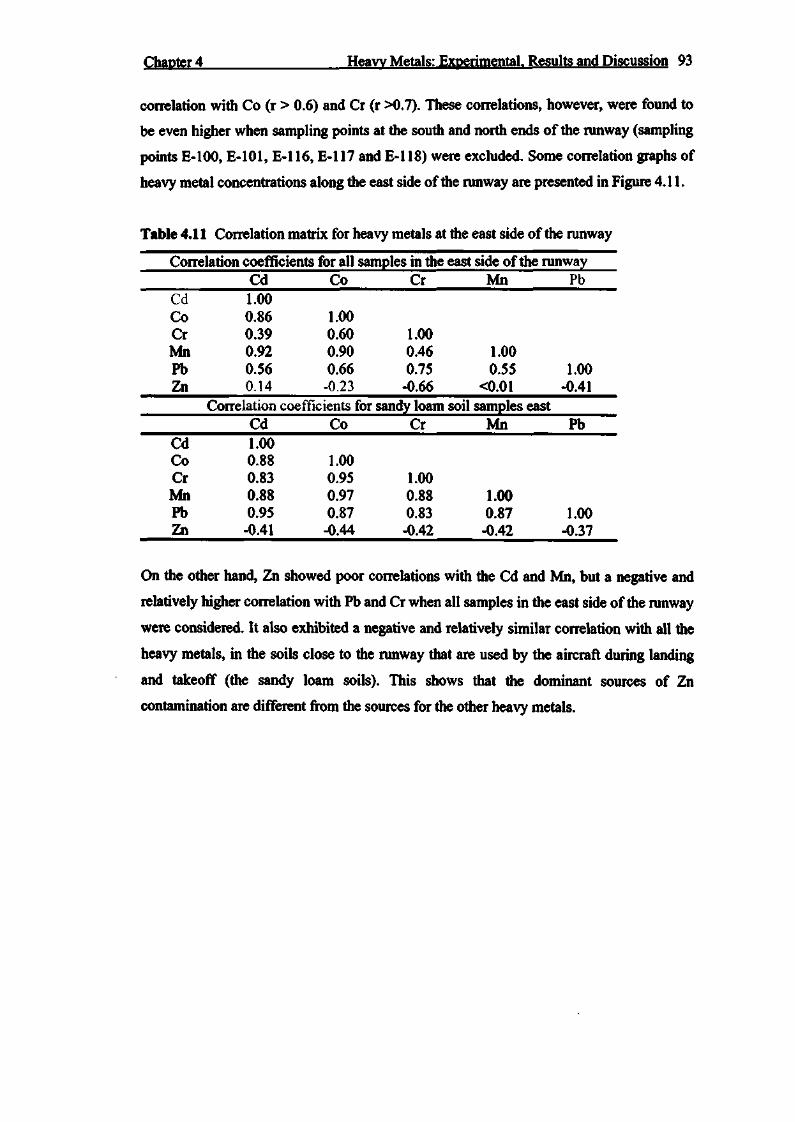
Chapter 4 Heavy Metals: Experimental. Results and Discussion 93
correlation with Co (r > 0.6) and Cr (r >0.7). These correlations, however, were found to
be even higher when sampling points at the south and north ends of the runway (sampling
points E-100, E-101, E-116, E-117 and E-118) were excluded. Some correlation graphs of
heavy metal concentrations along the east side of the runway are presented in Figure 4.11.
Table 4.11 Correlation matrix for heavy metals at the east side of the runway
Correlation coefficients for all samples in the east side of the runway Cd Co Cr Mn Pb
Cd 1.00 Co 0.86 1.00 Cr 0.39 0.60 1.00 Mn 0.92 0.90 0.46 1.00 Pb 0.56 0.66 0.75 0.55 1.00 Zn 014 -0.23 -0.66 <0.01 -0.41
Correlation coefficients for sandy loam soil samples east Cd Co Cr Mn Pb
Cd 1.00 Co 0.88 1.00 Cr 0.83 0.95 1.00 Mn 0.88 0.97 0.88 1.00 Pb 0.95 0.87 0.83 0.87 1.00 Zn -0.41 -0.44 -0.42 -0.42 -0.37
On the other hand, Zn showed poor correlations with the Cd and Mn, but a negative and
relatively higher correlation with Pb and Cr when all samples in the east side of the runway
were considered. It also exhibited a negative and relatively similar correlation with all the
heavy metals, in the soils close to the runway that are used by the aircraft during landing
and takeoff (the sandy loam soils). This shows that the dominant sources of Zn
contamination are different from the sources for the other heavy metals.

Chapter 4 Heavy Metals: Experimental. Results and Discussion 94
Cd Vs Pb (all points) Cd Vs Pb (end side samples excluded)
15 20 25 30 35 40 45 50
Cd(mg/Kg) IS 20 25 30 35 40 45 50
Cd (ing/Kg)
mo
160
HO
no 100
so 60
40
20
0
CdVsCr (all points)
« ( • •
• • •
• • r = 0.39
Cd(»g/Kg) IS 20 25 30 33 40 45 50
Cd Vs Cr (end side samples excluded)
15 20 25 30 35 40 45
(dims/Kg)
Figure 4.11 Correlations of Cd with Pb and Cr for all sampling points and sandy soil samples from the east side of the runway.
The correlation matrix for heavy metals at the west side of the runway, Table 4.12, reveal
that there is significant correlation between Cd, Co and Cr. Similarly, Mn exhibited a good
correlation with Cd and Co. However, lead and zinc showed poor correlation with Cd, Co,
Cr and Mn, when all sampling points were considered.
Table 4.12 Correlation matrix for heavy metals at the west side of the runway.
Correlation coefficients for all samples in the west side of the runway Cd Cd Co 0.83 Cr 0.56 Mn 0.88 Pb -0.16 Zn -0.19
Co Cr
0.59 0.73 0.42 0.12 0.03
-0.20 -0.31
Mn Pb
-0.13 -0.6 0.77
Correlation coefficients for sandy loam soil samples West Cd Cd Co 0.90 Cr 0.48 Mn 0.84 Pb 0.74 Zn 0.54
Co Cr
0.63 0.84 0.36 0.75 0.55 0.29 -0.33
Mn Pb
0.64 0.59 0.17

Chapter 4 Heavy Metals: Experimental Results and Discussion 95
When sampling points at the south and north end of the runway were excluded, the
correlation coefficients increased considerably for all the samples, except for correlations
of manganese with Cr and Cd, and the correlation of Cd with Cr that showed a relatively
small decrease. Graphical representation (some) of the correlation between the heavy
metals in the west side of the runway is given in Figure 4.12.
The correlation between Zn and Pb showed a marked decrease in the sandy soils (when the
end side samples are excluded) compared to the correlation of these metals found for the
whole sampling area. This suggests that the correlation of these metals is high in the clay
loam soils rather than in the sandy loam soils.
Co VsPb (all points) Co Vs Pb (end side samples excluded)
15 20 25 30
Co(«g/kg)
50
40
TO
20
10
0
• •
•
# # •
r=0.75
15 20 25 30 35
Co (mg/kg)
Cd Vs Co (all points)
100
Jf *° 8 *° O 40 0
20
0 1 1 1 1
•
• r = 0.79
Cd (mg/kg)
Cd Vs CO (end side samples excluded)
s 3 0
e 20 U
10
r • • * * r = 0.90
IS 20 25 30 35 40 43 50
Cd (rag/kg)
Figure 4.12 Correlations of Co with Cd and Pb for all sampling points and sandy soil
samples from the westside of the runway.
In general, the correlation matrices between the heavy metals indicate that all the heavy
metals, except zinc, come from the same source, in this case the activities of the aircraft on
the runway. Though aircraft activities produce pollutants that contain zinc, the trends of the
levels of zinc and correlation coefficient results of zinc with the other metals suggests that
the dominant source of zinc pollution in the soils close to the runway is independent from
the aircraft activities on the runway.

Chapter 4 Heavy Metals: Experimental. Results and Discussion 96
Comparison of the results with the South African guidelines for the maximum permissible
contents of these metals in soils n o shows that Cd and Co concentrations of all samples and
the Pb and Zn concentrations of 86% of the samples were above these guidelines (2 mg/kg
Cd, 20 mg/kg Co, 6.6 mg/kg Pb and 46.5 mg/kg Zn). In addition, the concentration of Cr
was significantly above these guidelines (80 mg/kg Cr ) in 51% of the samples. These
results confirm that the soils adjacent to the runway are contaminated by the heavy metals.

CHAPTER 5 Organic Chemicals (Pesticides): Experimental. Results and Discussion 97
CHAPTER 5
ORGANIC COMPOUNDS (PESTICIDES):
EXPERIMENTAL, RESULTS AND DISCUSSION
5.1 INTRODUCTION
There is much concern about the possible contamination of the surrounding soils and
groundwater by pesticides and fuel oils used by the tenant companies at the airport in
Pietermaritzburg. This is because some of the effluents containing pesticides and fuel oils
used in the day-to-day activities of these tenant companies find their way to the soil in
waste water flow or are flushed by rainwater into nearby water courses.
A study was thus carried out to qualitatively assess the contamination of the soils in the
vicinity of these tenant companies, particularly in the crop sprayers ditch and maintenance
hangers drain which are highly susceptible to contamination by the organic chemicals used
in the maintenance and crop sprayer hangars.
5.2 EXPERIMENTAL: MATERIALS AND METHODS
5.2.1 Sampling
Samples for determining the level of organic pollutants, from the activities of the crop
sprayer and aircraft maintenance organisations, were taken over two areas (Figure 5.1).
• First, samples were taken along the ditch that extends from the aircraft maintenance
and the crop sprayers' hangars down to the fence. From this sampling area
11 samples were taken along the ditch at distances between IS and 25 meters
(Table 5.1) where there is sufficient soil for sampling using a bucket auger.
• The other sampling area was the downward-sloping side adjacent to the drain
opening on the aircraft washing area next to the Oribi Flying Services Maintenance
hangar. From this sampling area two samples were taken, at 2 meters and 30 meters
from the drain opening along the down slope.
To get a representative sample of every sampling point, three sub-samples, 1 meter apart
(where it was possible), were taken from the top 0-15 cm of the soil using a bucket auger

CHAPTER 5 Organic Chemicals (Pesticides): Experimental. Results and Discussion 98
and subsequently mixed. Approximately 1 kg of the composite sample was taken for each
sampling point. The samples were collected in glass bottles. The bottles were then covered
by putting aluminium foil between the bottles and the lid to prevent possible adsorption of
analytes on the plastic lid. Each sample was labelled and its site description recorded.
Table 5.1 Sampling points description
Sample Distance from crop Sampling point description
No. sprayer hangar (m)
At outlet of the crop sprayer hangar drainage pipe (left)
Crop sprayer ditch, outlet of hangar drainage pipe (right)
Crop sprayer ditch
Crop sprayer ditch, 5 m up from junction with runway ditch
Runway ditch, 5 m up from junction with crop sprayer ditch
Crop sprayer ditch
Crop sprayer ditch
Control sample, 10 meter from sampling point 302
Crop sprayer ditch, 2 meter from die fence
Crop sprayer ditch 2 meter from the fence
4 m from drain outlet of the maintenance hangar (Pacair)
At outlet of drain from maintenance hangar apron (Oribi Flying
Services) 5 m from tarmac.
50 m from tarmac apron in front of the maintenance hangar (Oribi
Flying Services)
• Sample 303 and 313 an; taken as a control for samples from the crop sprayer and Pacair maintenance hangars, and for sample from
Oribi Flying Services maintenance hangar and washing apron respectively.
' Samples taken from very shallow topsoil on shale. 1 Samples taken from very wet, waterlogged ground.
310
309*
308
307
306
3051
304
303*
302
301
311
-
5
25
40
45
60
75
-
95
120 .
312
313"

Chapter 5 Organic Chemicals (Pesticides): Experimental. Results and Discussion 99
lAlrtmtt Iwtihing
I*!"**
I Aircraft ' maintenance
WA hangar
^ a a a a a a a a a a a a a a .
Aircraft l < i O B h • hingir £ p* ^ ^ " " s .
• Sample points /^Drainage ditch
Scale 1 : 3000
0 50 100 200 Meters
Figure 5.1 Sampling site and sampling points for organic chemicals.
CHAPTER 5 Organic Chemicals (Pesticides): Experimental. Results and Discussion 100
5.2.2 Sample drying and grinding
Most of the samples were wet; hence, they were spread over cardboard boxes and air-dried
at room temperature (approximately 25 °C) for 4-5 days. Stones, foreign materials and
plant materials were removed from the soil samples and they were then ground using a
mortar and pestle. Two portions of the soil were taken for each sample and were sieved
using a 1.0 mm and 0.5 mm pore size sieves (Laboratory test sieve BS410/1986, Serial No.
311641, Endecotts, London, England) for soxhlet extraction and organic matter
determination respectively. The soil that passed the 1.0 mm and 0.50 mm size sieves was
collected in a properly labelled glass bottles, and was covered by putting aluminium foil
between the bottle and the lid.
5.2.3 Organic matter determination
The air dried soil samples that had been sieved using the 0.50 mm sieve were used for
organic matter determination in the samples using the Walkley-Black oxidation procedure
as described in chapter 4 (section 4.1.4).
5.2.4 Soxhlet extraction
10 g of the dried soil sample that passed through the 1.0 mm sieve was blended with 10 g
of anhydrous sodium sulfate and men placed in a porous extraction thimble (Whatman
Cellulose extraction thimbles single thickness, inside diameter 28 mm x 80 mm external
length). The extraction thimble was then placed in the sample holding siphonable chamber
of the soxhlet extractor apparatus (Figure 5.2). An extraction solvent was prepared by
mixing equal volumes of acetone (BDH, HiPerSolv for HPLC) and n-hexane (BDH,
HiPerSolv). 300 ml of the extraction solvent was placed in a 500 ml round bottom flask
containing two clean boiling chips.
The flask was placed on the heating mantle (electrothermal, UK, serial No. 10609162-3),
and then attached to the sample holding siphonable chamber and the condenser
(Figure 5.2). The power in the heating mantles was set such that the solvent was and
condensed at 4-6 cycles/hour. Each sample was extracted for 16-24 h.

CHAPTER 5 Organic Chemicals (Pesticides): Experimental Results and Discussion 101
Figure 5.2 The soxhlet extractor apparatus set-up (A), and the extraction thimble (white) inside the siphonable chamber of the soxhlet extractor apparatus (B).
5.2.5 Sample drying and concentration
The extract was dried, by passing it through a drying column containing about 10 cm of
sodium sulfate. Both the extractor flask and the drying column were washed with 100 ml
of extraction solvent (1:1 acetone/n-hexane) to ensure the complete transfer of the extract.
A Kuderna-Danish (K-D) concentrator was assembled, by attaching a 10 ml concentrator
tube to a 500 ml evaporation flask. The dried sample was collected in the K-D
concentrator. After adding two clean boiling chips to the K-D concentrator, it was attached
to a three-ball Snyder column pre-wetted with about 1 ml of hexane through the top of the
column.
The K-D apparatus was placed on a hot water bath (80-85 °C) so that the concentrator tube
was partially immersed in the hot water and the hot vapour bathed the entire lower rounded
surface of the concentration flask. The vertical position of the apparatus and the water
temperature were adjusted in such a way that the concentration processes was completed in
10-20 min. at a distillation rate at which the balls of the column actively chattered, but
the chambers did not flood.

CHAPTER 5 Organic Chemicals (Pesticides): Experimental. Results and Discussion 102
The K-D apparatus was removed from the water bath when the apparent volume of the
liquid reached 1 - 2 ml, and it was allowed to drain and cool for at least 10 min. The
Snyder column was then removed and the flask and the lower joints of the concentrator
were rinsed with 1 - 2 ml of hexane.
5.2.6 Sulfur cleanup and nitrogen blow down
Sulfur has solubility characteristics similar to organochlorine and organophosphorus
pesticides and can cause analytical interferences in the GC/MS analysis of these pesticides.
To eliminate sulfur from an extract and prevent the masking of the pesticides in GC/MS
analysis, a sulfur cleanup was done for the sample extracts using the EPA method 3600.153
A tetrabutylammonium (TBA) sulfite reagent was prepared by dissolving 3.39 g
tetrabutylammonium hydrogen sulfate in 100 ml organic-free reagent water (ultra-pure
water). 25 g of sodium sulfite was then added to the solution and stored in an amber bottle.
Each sample solution extracted and concentrated using EPA method 3500151 was
transferred to a 50 ml clear glass bottle, 1.0 ml of TBA sulfite reagent and 2 ml of
2-propanol were added, and the bottle was shaken for at least 1 min after capping the bottle
with a glass stopper. This was followed by the addition of 5 ml organic-free reagent water
(ultra-pure water) and then shaking the solution for at least 1 min. The mixture was then
allowed to stand for 10 min, during which time the solution separated into two phases.
The hexane layer (top) containing the sulfur-cleaned sample, was then collected in a 50 ml
conical flask and placed in a warm water bath (approximately 35 °C) and its volume was
reduced to approximately 1.5 ml using a gentle stream of clean and dry nitrogen to
evaporate the solvent. Finally the extract obtained was transferred to a properly labelled
vial with a PTFE-lined screw cap, and stored in a refrigerator for future analysis of the
target analytes using gas chromatography/mass spectroscopy (GC-MS).

CHAPTER 5 Organic Chemicals (Pesticides): Experimental. Results and Discussion 103
5.2.7 GC/MS
5.2.7.1 Standards
The qualitative determination of the organic chemicals in soils around the crop sprayer and
maintenance hangars was done for the pesticides and fuel that were amenable to GC
analysis. Standard solutions of these compounds were prepared from pesticide solutions
that were used by die crop sprayer company and fuels used by die aircraft. These
compounds are:
• Pesticides
• Amistar™ (Azoxystrobin 250 g/1, Syngenta, South Africa),
• Kemprin 200 EC (Cypermethrin 200 g/1, KEMPTON CHEMICALS, Kempton
Park, South Africa),
• Decis® (Deltamethrin 25 g/1, Aventis CropScience South Africa),
• IMPACT® (Flutriafol 125 g/1, Cheminova, Denmark),
• Fusillade (Fluazifop-p-butyl 125 g/1, Zeneca Agrochemicals SA, South Africa),
and
• Punch-xtra® (Flusilazole 125 g/1 and Carbendazim 250 g/1, DuPont, USA).
• Fuels
• Av gas and
• JetAl
The concentration and solvent used to prepare die standards used in the qualitative
determination of die organic chemicals by GC/MS are given in Table 5.2. Pesticide grade
solvents (acetone BDH, HiPerSolv) and n-hexane (BDH, HiPerSolv) were used to prepare
all the standard solutions.
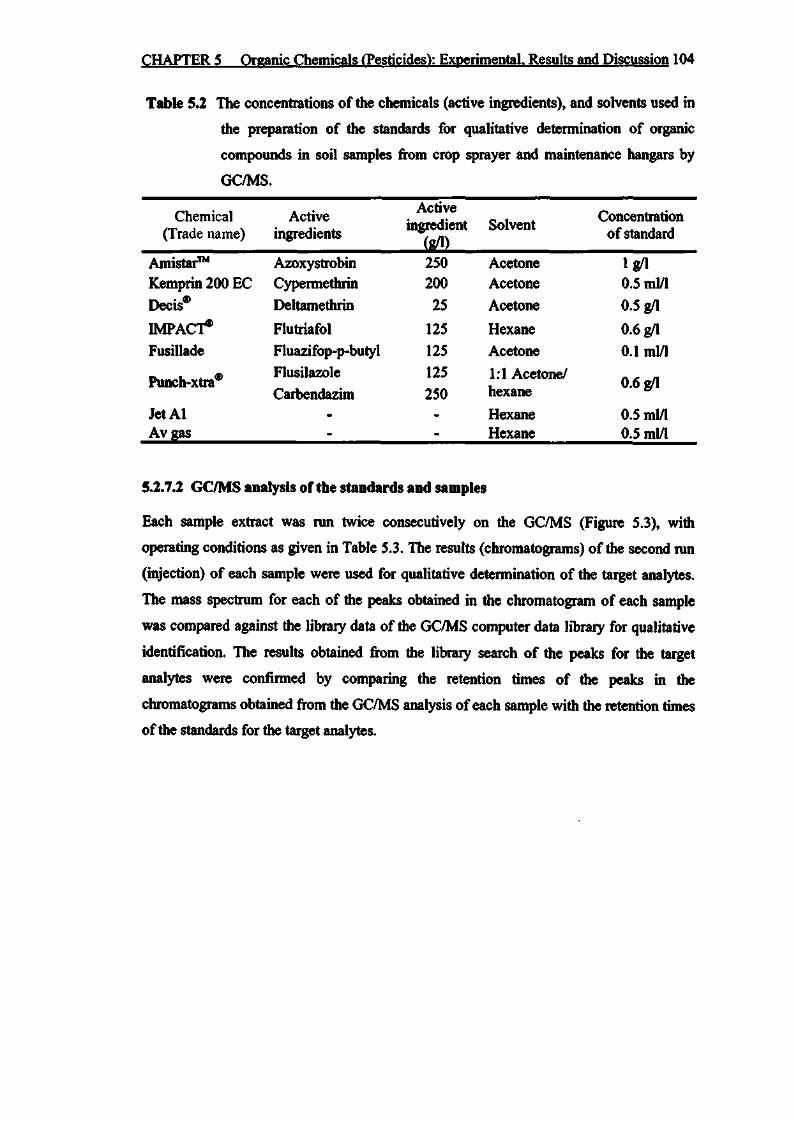
CHAPTER 5 Organic Chemicals (Pesticides): Experimental, Results and Discussion 104
Table 5.2 The concentrations of the chemicals (active ingredients), and solvents used in
the preparation of the standards for qualitative determination of organic
compounds in soil samples from crop sprayer and maintenance hangars by
GC/MS.
Chemical (Trade name)
Amistar™ Kemprin 200 EC Decis®
IMPACT® Fusillade
Punch-xtra®
JetAl Avgas
Active ingredients
Azoxystrobin Cypermethrin Deltamethrin
Flutriafol Fluazifop-p-butyl Flusilazole Carbendazim
--
Active ingredient
(g/1) 250 200 25
125 125 125 250
-
-
Solvent
Acetone Acetone Acetone
Hexane Acetone
1:1 Acetone/ hexane
Hexane Hexane
Concentration of standard
lg/1 0.5 ml/1
0.5 g/1
0.6 g/1 0.1 ml/1
0.6 g/1
0.5 ml/1 0.5 ml/1
5.2.7.2 GC/MS analysis of the standards and samples
Each sample extract was run twice consecutively on the GC/MS (Figure 5.3), with
operating conditions as given in Table 5.3. The results (chromatograms) of the second run
(injection) of each sample were used for qualitative determination of the target analytes.
The mass spectrum for each of the peaks obtained in the chromatogram of each sample
was compared against the library data of the GC/MS computer data library for qualitative
identification. The results obtained from the library search of the peaks for the target
analytes were confirmed by comparing the retention times of the peaks in the
chromatograms obtained from the GC/MS analysis of each sample with the retention times
of the standards for the target analytes.

CHAPTER 5 Organic Chemicals (Pesticides): Experimental. Results and Discussion 105
Table 5.3 The operating conditions and instrument specifications of the GC/MS used in
the qualitative analysis of organic chemicals.
Instrument
Injector
Split mode
Split flow (ml/min)
Sp lit less time (min)
Injected volume (ji\)
Washing solvent
Pre injection solvent cycle
Post injection solvent cycle
Carrier gas
Carrier gas flow (ml/min)
Column
Length (m)
Internal Diameter
Film thickness (jtai)
Column Oven
Initial temperature (°C)
Hold time (min)
Final temperature (°C)
Rate (°C/min)
Equilibration time (min)
Mass Spectrometer
Source temperature (°C)
Damping gas flow (ml/min)
Micro scans
Max Ion time (ms)
Polarity
Ionisation mode
Scan mode
Mass range (amu)
ThermoFinnigan, Model K07300OOO0O008O, S. No. 20031445, Milan, Italy.
Splitless
50
0.75
1.0
Acetone
2
2
Helium (99.995%, AFROX, South Africa)
2.0
EC-5, Serial No.306187, Alletech Associates, USA. (5% phenyl, 5% methyl polysiloxane)
30
0.32
1.00
60
20
300
10
0.5
Trace GC 2000, PolarisQ Al/AS 3000.
200
0.3
3
25
Positive
EI
Full scan
50.0-600.0

CHAPTER 5 Organic Chemicals (Pesticides): Experimental Results and Discussion 106
Figure 5.3 ThermoFinnigan GC/MS apparatus Model K07300000000080 used in the analysis of the organic chemicals.
5.3 RESULTS
5.3.1 Organic matter
The results of the organic matter content analysis of the soil samples, obtained from the
Walkley-Black oxidation procedure, are given in Table 5.4. The results show a wide range
in the organic matter content (3.8-9.4%) of the soil samples. The highest organic matter
content was found in sample 310, which was taken from the outlet of the crop sprayer
hangar drainage pipe. Sample 305 showed the lowest organic matter content. The statistical
analysis results show that there is a significant difference in the organic matter contents of
the soil samples at 95% confidence level (Fpr < 0.001) with a least significant difference
(l.s.d) of 0.39%. The % organic matter content results of the soil samples are shown
graphically in Figure 5.4.

CHAPTER 5 Organic Chemicals (Pesticides): Experimental, Results and Discussion 107
Table 5.4 Organic matter content (%) of soil samples from the crop sprayer and
maintenance hangars.
Sample No. Distance from the crop sprayer's hangar (m)
% Org matter
310 309 308 307 306 305 304 303 302 301 311 312 313
5 25 40 45 60 75
95
120
9.4 6.5 4.8 6.1 7.5 3.8 7.0 6.7 4.4 6.8 5.5 6.3 4.6
Fpr l.s.d s.e
<0.001 0.4 0.2
J I
1 I O
lO-i
9
8
7
6
5
4
3
2
1
0
311 310 309 308 307 306 305
Sample number
304 303 302 301
Figure 5.4 Organic matter content of the soil samples from the crop sprayer and maintenance hangars.

CHAPTER 5 Organic Chemicals (Pesticides): Experimental Results and Discussion 108
53.2 GC/MS analysis results for standards
The target analytes and retention times of the peaks for the active ingredients of the
pesticides are given in Table 5.5. Figures 5.5, 5.6 and 5.7 show typical chromatograms of
the standards obtained from the GC/MS analysis of the standard solutions, prepared as
described in Table 5.2. The labels (numbers) in the chromatograms show the retention
times of the peaks for the respective standards in the chromatograms.
Table 5.5 Retention times for the active ingredients of the pesticides used as standards.
Chemical (Trade name) Active ingredients R, (mini
Amistar™
Kemprin 200 EC
Decis®
Fusillade
Punch-xtra®
Azoxystrobin
Cypermethrin
Deltamethrin
Fluazifop-p-butyl
Flusilazole
31.77
27.60,27.75 and 27.94
30.58 and 31.12
22.23
22.10 *: Retention time of the active ingredient in the pesticide.
Azoxystrobin (Amistar™)
is
o io
'1 1
0
5
10 IS 20 2S 30
(min)
35 40 45 50
80 70
— 20 10 0 -I > t . 1
22 24
Cypermethrin
26 28
time (min)
30 32
Figure 5.5 Chromatograms of the pesticides Amistar™ and Cypermethrin used as standards for qualitative analysis of organic chemicals.

CHAPTER 5 Organic Chemicals (Pesticides): Experimental. Results and Discussion 109
I
12
10
8
6
4
2
O P 12
Deltamethrin
i i
17 22 27
time (mini
32
70
60
ir 10 0
12 16
Fusilade
I I I I I 20
t ime (min)
•22.23
UL-JL-LJL 24 28
70 n
"2 so
* | 30
J2°1 10 o
Flusilazole (Puncb-xtra)
22.10
,.., .11—-—"* 10 20 30
time (min)
40 50
Figure 5.6 Chromatograms of the pesticides Deltamethrin, Fusilade and Punch-xtra® used as standards for qualitative analysis of organic chemicals.

CHAPTER 5 Organic Chemicals (Pesticides): Experimental Results and Discussion 110
3
2.5 -I
° 2
& 1.5
1
0.5
I)
I 10
AVGas
• ' - ' • _AM *Jk*/tnfmi0mirm*mi m i l iwmi
15 20 25 30
time (m in )
35 40 45 50
•lot A l
"b 1.5
* l
1 0.5 UojJliL «_l 1 L
10
- V ^n^i i f tmif inmiiwiin i H;IIHI» —
15 20 25 30
time (min) 35 40 45 50
Figure 5.7 Chromatograms of the fuels Jet Al and Av gas used as standards for
qualitative analysis of organic chemicals.
533 GC/MS analysis results for samples
Punch-xtra® (Flusilazole) and Fusillade (Fluazifop-p-butyl) are the only pesticides that
were detected. However, these two pesticides were not detected in all the soil samples from
the crop sprayer and maintenance hangars. The results of the qualitative determination of
the target analytes in the samples, using GC/MS, are given in Table 5.6.
The chromatograms obtained from the GC/MS analysis of the samples and the peaks for
target analytes are shown in Figure 5.7 and 5.8. The chromatograms given in Figures 5.8

CHAPTER 5 Organic Chemicals (Pesticides): Experimental. Results and Discussion 111
and 5.9 include only the chromatograms for the soil samples where the pesticides were
detected. Two chromatograms for a single soil sample are presented in the figures; one
showing the whole chromatogram (left) and a second (right) extract from the
chroma tog ram enlarged to show the peaks of the target analyte and its retention time.
Table 5.6 Analytes detected, their retention times in the standard and samples.
,, , Standard's <, i • ti XT
p Chemical name Active ingredient retention time J , \ Prob. (%) No. ^ , . . tune (mm) v ' (nun) v '
22.09 88.86
22.08 22.09
22.10 22.23
22.09 22.23
22.11
83.42 90.77
92.14 86.78
89.33 95.37
90.24
Prob (%): A probability factor based on the differences between the adjacent best matches found during the library search (hits). The hits
are arranged in order of how well they match the library spectrum.
301 302 303 304 305 306 307 308
309
310
311
---
Punch-xtra® --Punch-xtra® Punch-xtra®
Punch-xtra® Fusillade
Punch-xtra® Fusillade
Punch-xtra®
---Flusilazole --Flusilazole Flusilazole
Flusilazole Fluazifop-p-
Flusilazole Fluazifop-p-
Flusilazole
butyl
butyl
---
22.10 --
22.10 22.10
22.10 22.23
22.10 22.23
22.10

CHAPTER 5 Organic Chemicals (Pesticides): Experimental Results and Discussion 112
50 45 40
"© 35 * 30 £25 S 20
I", 10 5
Sample 304
0 5 10 15 20 25 30 35 40 45 50 time (min)
M
12 -
I 4 -
2 •
Sample 3 04
22.09
I l Flusilazole
\ f\ A-.
/ V V v w ^ 215 22
t ine (mini 22 5
25
20
~ 1 5
a 10
*iu
Sample 307
-1 r -
10 15 20 25 30 35 40 45
time (min)
5(1
I ff 5 •
I
Sample 3 0 7
22 08
Flusilazole
JLuwJ* 19 7 20.5 213 22.1
t i n e ( B i n )
70
60
•o 50
a 30
| 20
10
0
Sample 308
j \j0hb*Hlmmm 5 10 15 20 25 30 35 40 45 50
time (min)
15
12
1: 0
Sample 308
22
/ V W A / W
09
Flusilazole
2LS 217 21.9 22.1 22.3 22.5
lime (min)
Figure 5.8 GC/MS chromatograms for samples 304,307 and 308.
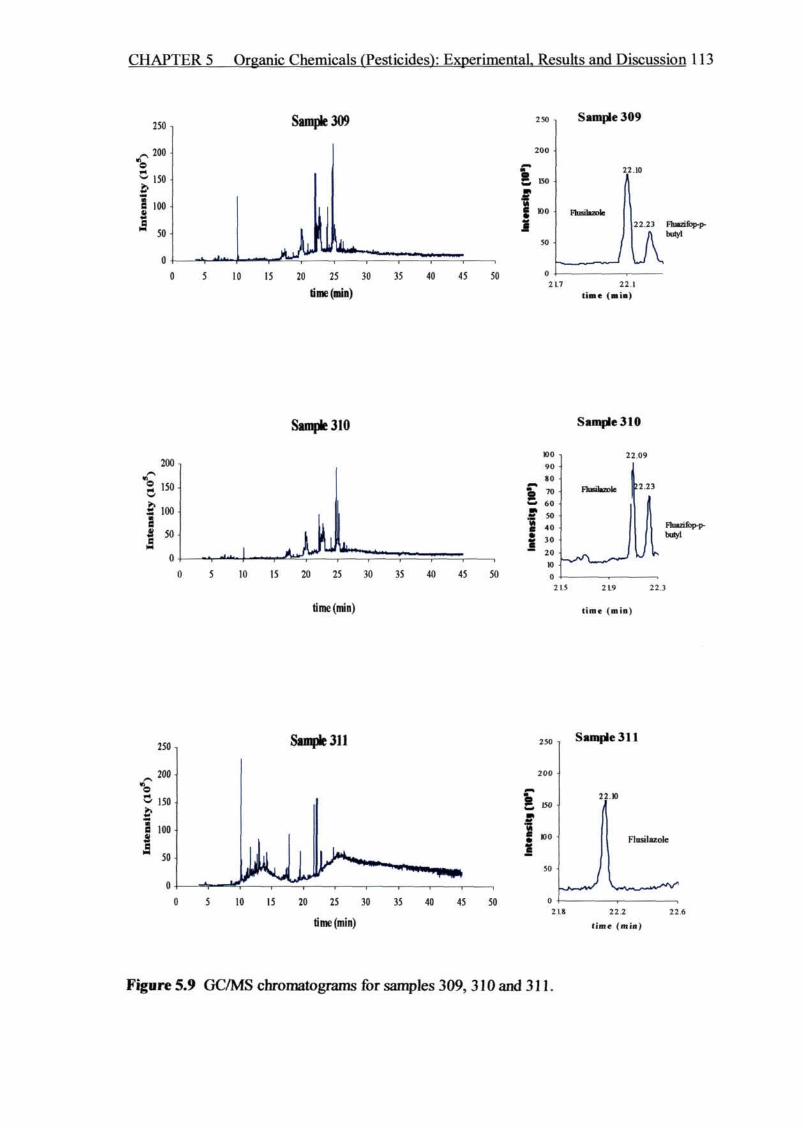
CHAPTER 5 Organic Chemicals (Pesticides): Experimental Results and Discussion 113
250-
^ 2 0 0
* 150-
I 100 -
" 50-
0
Sample
V-^—
m
J^M*-
2so , Sample 309
200
I f
0 5 10 15 20 25 30 35 40 45 50
time (min)
22 10
HusiUrole \22.23 Fhnzifop-p-
butyi
2L7 22.1 time (min)
200
*2 iso w
=• 100
a S 50 &
0
. I , •!•*.
Sample 310
• • . . • J L W f c ^ 0 5 10 15 20 25 30 35 40 45 50
time (min)
Sample 310
90
to
— 6 0
] 4 0
~ 3 0
" " 2 0
10
0
2 2 0 9
Fkmlezok 2.23
Hutafop-p-butyl
215 2L9 22.3
lime (min)
250
200
"o
* 150
I ioo
K 0
Sampk3U
. JMW—-• * r * * ^ " ™ ^ 1 1 1 1 1 i r-
2 0 0
•=
g 150
5 MO
2 0 5 10 15 20 25 30 35 40 45 50
time (min)
Sample 311
2 10
Flusilazole
~j^**y
218 22 2
lime (min)
2 2 6
Figure 5.9 GC/MS chromatograms for samples 309,310 and 311.

CHAPTER 5 Organic Chemicals (Pesticides): Experimental. Results and Discussion 114
5.4 DISCUSSION
The organic matter results obtained show that the soil samples have significantly different
amounts of organic matter, at 95% confidence level. These differences in the organic
matter content of the soil samples may be due to the difference in the soil texture (type) of
the soil samples collected. Sample 305 exhibited the lowest amount of organic matter
(3.8%) since this soil sample contained a large amount of coarse-textured soil and gravel.
Sample 310, on the other hand, showed the highest organic matter content (9.4%). This
sampling point was a small drain hole located immediately next to the crop sprayer hangar,
where the spray aircraft and the pesticide-mixing vessel are washed. Thus, the
accumulation of organic chemicals in the pesticides (solvents, surfactants, active
ingredients, etc), plus the lubricating and fuel oils from the pesticide mixing vessel and
spraying aircraft washing effluents might be the reason for the high organic matter content
of the soil from this sampling point.
From the pesticides used by the crop sprayer, Azoxystrobin (Amistar™), Cypermethrin
(Kemprin 200 EC), Deltamethrin (Decis®), Flutriafol (IMPACT®), Fluazifop-p-butyl
(Fusillade) and Flusilazole (Punch-xtra®) were chosen for the analysis since these
pesticides require only solvent extraction prior to analysis by GC/MS. Ethephone and
glyphosate were excluded from the analysis since they require derivitization prior to
analysis by GC/MS.171,172 Furthermore, the library (NIST/EPA/NIH mass spectral
library)173 of the GC/MS computer used in the analysis did not include the data for
Flutriafol, thus identification (confirmation) of the peak and the retention time of Flutriafol
was not possible.
Azoxystrobin, Cypermethrin and Deltamethrin were not detected in any of the soil
samples. This may be due to the rate of degradation of the pesticides. The persistence of
organic chemicals in the environment has been shown to be directly related to the rate of
their degradation processes.47 Thus, the results obtained may be attributed to the
contribution of different degradation mechanisms, such as photodecomposition, hydrolysis,
volatilisation and microbial degradation, to the selective disappearance of these pesticides
from the sampling area.
Cypermethrin can be classified as a non-persistent pesticide in the environment
(soil). According to The Royal Chemical Society, cited by Verschueren174, the half-life of

CHAPTER 5 Organic Chemicals (Pesticides): Experimental. Results and Discussion 115
Cypermethrin in soil is between 4 and 12 days. Similarly, several studies have shown that
Deltamethrin is readily and quickly degraded in the soil, depending on the nature of the
soil and temperature, and its half life generally ranges from 11 to 72 days.175,176,177 It has
been shown that Azoxystrobin is very susceptible to photolysis and degrades rapidly (soil
half-life of less than two weeks), with photolysis being its major degradation pathway
followed by microbial degradation.178,179
The continual input of the effluents to the soils in the sampling area may also result in a
build-up of a select group of microorganisms in soil, capable of degrading these pesticides
rapidly, thus resulting in enhanced degradation rates of the pesticides.104 In addition, the
dilution of the pesticides by the large volume of water used during washing has an impact
on lowering the concentrations of these chemicals.
Another factor that influences the disappearance of the pesticides from the soil is the
application rate (amount of pesticide applied in a given period of time). As more pesticide
is used, the usage and washing of the pesticide mixing vessel and the spray aircraft
increases, and so does the amount of the pesticide in the effluents from the crop sprayer
hangar. In addition, the time of sampling in relation to the time of usage of these pesticides
has a great impact on the detection of these pesticides, since the longer the time difference
the more the pesticides will be degraded from the soil to concentrations below the
detection limit of the GC/MS instrument. However, no properly documented data on the
time of usage of these pesticides by the crop sprayers from the airport was available.
The relatively low usage of Cypermethrin and Deltamethrin (Table 5.7) suggests that they
will consequently have a lower concentration in the washing effluents and they are less
likely to be found at concentrations above the detection limit of the GC/MS. In contrast to
the results obtained, Azoxystrobin was expected to have a relatively higher concentration
in the effluents due to its relatively higher usage, and therefore expected to be detected in
the soil samples. However, Azoxystrobin was not detected in any of the samples, and this
may be attributed to its relatively short half-life (soil half-life of less than two weeks).

Azoxystrobin Cypermethrin Deltamethrin Fluazifop-p-butyl Flusilazole
12 000 750 750
2 000 12 000
2.5 1 3 1 2.5
CHAPTER 5 Organic Chemicals (Pesticides): Experimental. Results and Discussion 116
Table 5.7 Usage of the pesticides and concentration of the ingredients.
_, . ,. Usage Concentration of Pesticide Active ingredient „.. .e . .. . , m _ (litres/year) active ingredient (g/1) Amistar™ Kemprin 200 EC Decis® Fusillade Punch-xtra® ___^ ___^
Note: "usage" refers to the amount of pesticide used by the crop sprayers from the airport.
The results of the GC/MS qualitative analysis of the soil samples confirmed the presence
of Fluazifop-p-butyl (Fusilade, half-life 15 days180) in two samples (310 and 309) at
locations close to the crop sprayers hangar. Flusilazole (Punch-xtra®, half life 251 days181),
on the other hand, was detected in six samples (311, 310, 309, 308, 307 and 304)
indicating it was spread over a wider area than is Fluazifop-p-butyl. The detection of
Flusilazole in six of the samples can be ascribed to its longer half-life in soil (251 days),
besides its high amount of usage. These results are in accordance with their usage as
expected.
Considering the proximity of the sample location to the source of the pesticide effluents, it
was expected that pesticides would be detected at sampling locations close to the effluent
source (the crop sprayer hangar) rather than sampling locations at distances further from
the point source. Flusilazole (Punch-xtra®), however, was detected in sample 304 but not
detected in sample 305, which was located nearer to the pesticide effluent source. This can
be attributed to the lower organic matter and clay contents exhibited by sample 305, and
hence decreased adsorption of the pesticide on the soil. Several studies showed similar
results on the effects of organic matter contents on pesticide adsorption. O'Connor et al.6S
reported that adsorption of 2,4,5-T tended to increase with an increase in organic content of
the soil, suggesting that organic matter is an important contributor to the pesticide
adsorption. Adams et a/.63 have reported that the organic carbon content determined the
amount of lindane adsorption on soil.
The GC/MS chromatograms for all soil samples did not contain peaks characteristic of the
fuel oils JET Al and Av gas, which indicates that the concentration of these fuel oils in the
soil samples was below the detection limit of the GC/MS. This can be attributed to the low
number of aircraft getting serviced (ca. 64 aircraft/year ,̂ and hence there would be a low

CHAPTER 5 Organic Chemicals (Pesticides): Experimental, Results and Discussion 117
quantity of wastewater generated by aircraft maintenance activities in the maintenance
hangars. In addition, the proper housekeeping and waste handling methods employed in
both maintenance hangars have proved to be effective in reducing the concentration of the
fuel oils in the effluent produced from the maintenance activities in the hangars.

Chapter 6 Conclusions and Recommendations 118
CHAPTER 6
CONCLUSIONS AND RECOMMENDATIONS
Analysis of the total heavy metal content of the soils adjacent to the runway of
Pietermaritzburg Airport (Oribi Airport) revealed that all samples contained significantly
higher concentrations of Cd and Co than the mean baseline concentration of these metals in
soils of South Africa as reported by Herselman era/.166. Moreover, 89% of the samples
showed considerably higher concentration of Pb and Zn and 62% of the samples had Cr
concentrations significantly above the baseline concentrations of these metals reported.I66
Similarly, Cd and Co concentrations of all samples and the Pb and Zn concentrations of
86% of the samples were above the South African guidelines for the maximum permissible
contents of these metals (2 mg/kg Cd, 20 mg/kg Co, 6.6 mg/kg Pb, 46.5 mg/kg Zn) in
soils.170 In addition, the concentration of Cr was significantly above these guidelines
(80 mg/kg Cr) in 51% of the samples. These results confirm that the soils adjacent to the
runway are contaminated by the heavy metals.
Pearson's correlation coefficients between most of the heavy metals, a similarity in trends
of the heavy metal concentrations in the east side of the runway and the noticeably higher
concentrations of all the heavy metals at sampling points which correspond to the runway
areas with a considerable number of tyre wear marks suggest that these heavy metals are
originating from the different aircraft related activities. These include fuel combustion
products, the tyre wear and other aircraft body abrasion (attrition). The trends in the levels
of zinc and the correlation coefficients of zinc with the other metals suggest that the
dominant source of zinc pollution in the soils close to the runway is independent from the
aircraft activities on the runway.
The pesticides azoxystrobin, cypermethrin and deltamethrin, and the fuel oils Jet Al and
Av gas were not detected in any of the soil samples. This indicates that the effluents from
the aircraft servicing activities at the two maintenance hangers and the crop sprayer's
hangar did not contain significant amounts of these fuel oils or these organic chemicals
were degraded by various degradation mechanisms in the soil. Fluazifop-p-butyl was
detected only in two of the samples, both of which were taken close to the crop sprayer

Chapter 6 Conclusions and Recommendations 119
hangar. However, flusilazole was detected in 6 of the samples. The results show therefore
that soils in the sampling area are contaminated by flusilazole.
Generally the housekeeping procedures put in place at both maintenance hangers in the
airport are effective in controlling the fuel oils Av gas and Jet Al. However, pesticide
contamination is occurring and better methods of control should be established.
This study was focused on the levels of heavy metals adjacent to the runway. Investigating
the forms of occurrence of these heavy metals in the soil becomes an important aspect to
predict the potential mobility of these heavy metals to ground water from soil. In addition,
further studies on the levels of these metals in soils at the environs of the airport should be
done to assess the extent of distribution of the heavy metals originating from the activities
of aircraft in the airport.
Also, investigations need to be done on the availability of the pesticides surveyed in this
study over a longer period of time. Moreover, further studies should also be conducted to
quantify the pesticides detected in this study as well as to assess the levels of ethephone,
glyphosate and flutriafol in the soils.

Rpifpiffinrfis 120
REFERENCES
1. JE Hardoy, D Mitlin and D Satterthwaite, Environmental Problems in Third World cities,
Earthscan, London, 1992, p. 63-69.
2. Ministry of Energy and Mines, Mineral Prospects of the State of Eritrea: Ministry of Energy
and Mines, Ministry of Energy and Mines, Asmara, 1997.
3. Government of Eritrea, The National Environmental Management Plan (NEMP) for Eritrea,
1995.
4. Development Consultants International, Country Environmental Problem: Eritrea, Final report
presented to the head of Environment and Sustainable Development Unit, African
Development Bank, June 1997.
5. The World Gazetteer, Current Population of Cities and Towns of South Africa, 2004,
http://www.World-gazetteer.eom/t/t za.htm. Accessed on April 14,2004.
6. Pietermaritzburg Tourism, City in the Country: Pietermaritzburg Tourism, Pietermaritzburg,
2001.
7. Personal communication, Ms Esmaralda Barnes, Turnaround Management, Pietermaritzburg
Airport Manager, April 23,2003.
8. Personal communication, Alfie Paterson, Pacair, Pietermaritzburg Airport, Pietermaritzburg,
April 23,2003.
9. Personal communication, Hans van der Pol, Oribi Flying Services, Pietermaritzburg Airport,
Pietermaritzburg, June 12,2003.
10. Personal communication, Mitch Spall, Crop Sprayer Co., Pietermaritzburg Airport,
Pietermaritzburg, April 23,2003.
11. HS Stoker and SL Seager, Environmental Chemistry: Air and Water pollution, Glenview,
Foresman, 1972.
12. American Chemical Society, Committee on environmental improvement, Cleaning our
Environment: A Chemical Perspective, 2nd edition, American Chemical Society, Washington
D.C., 1978.
13. BJ Alloway, Soil Pollution and Contamination, p. 318-339. In: Pollution, Causes, Effects and
Control, Roy M Harrison (ed.), V* edition, Royal Society of Chemistry, Cambridge, 1996.
14. LA Shiklomanov, World Freshwater Resource. In: Water In Crises, PH Gleick (ed), Oxford
University Press, New York, 1993.
15. PG Alcock, A Water Resources and Sanitation Systems Source Book with special reference to
KwaZulu-Natal: Part 3, WRC Report No 384/3/99, p. 326.
16. JE Andrews, P Brimblecombe, TD Jickells and PS Liss, An Introduction to Environmental
Chemistry, Black well Science, Oxford, 1996, p. 109.

Refprenr-pg . 121
17. GS Gladwell, Groundwater Quality Management: A Multi-Dimensional Problem, p. 19-36. In:
Groundwater Contamination: Use of Modelling in Decision Making, G Jousma, J Bear, YY
Haimes and F Walter (eds.), Kluwar, Dordrecht, 1989.
18. F Kacarogulu, Review of Groundwater Pollution and Protection in Karst Areas, Water, Air,
and Soil Pollution, 1999,113,337-356.
19. South Africa Department of Environment Affairs, Pollution of Inland Water in South Africa,
South Africa Department of Environment Affairs, July 1990.
20. CF Mason, Water Pollution Biology, p. 66-92. In: Pollution, Causes, Effects and Control, R M
Harrison (ed.), 3ri edition, Royal society of chemistry, Cambridge, 1996.
21. JM Mo ran, MD Morgan and JH Wiersma, Introduction to Environmental Science, Freeman,
San Francisco, 1980.
22. FW Fifield, Contaminated Land Sites, p. 369. In: Environmental Analytical Chemistry, FW
Fifield and PJ Haines (eds.), Blackie, London, 1995.
23. PGC Campbell, PM Stokes and JN Galloway, The Effect Of Atmospheric Deposition on the
Geochemical Cycling and Biological Availability of Metals, p. 760-763. In: Heavy Metals in
the Environment, Vol. 2, Heidelberg international conference, CEP consultants, Edinburgh,
1983.
24. SL McGowen and NT Basta, Heavy Metal Solubility and Transport in Soil Contaminated by
Mining and Smelting, p 89-107. In: Heavy metals release in soils, H M Selim and D L Sparks
(eds.), Lewis Publishers, Boca Raton, 2001.
25. RC Wilmoth, SJ Hubbard, JO Burckle and JF Martin, Production and Processing of Metals:
Their Disposal and Future Risks, ppl9-65. In: Metals and their Compounds in the
Environment, Ernest Merian (ed), VCH Verlagsgesellschaft, Wienheim, 1991.
26. GH Burke, BR Singh and L Theodore, Handbook of Environmental Management and
Technology, 2nd edition, Wiley Interscience, New York, 2000.
27. U Forstner, C Colombi and R Kistler, Dumping of Wastes, p 333-359. In: Metals and their
Compounds in the Environment, Ernest Merian (ed.), VCH verlagsgesselschaft, Weinheim,
1991.
28. JW Funke, The Water Requirements and Pollution Potential of South African Gold and
Uranium Mines, Water Research Commission, Kv 9/90,1990.
29. BA Goldman, JA Hulme and C Johnson, Hazardous Risk Management: Reducing the Risk,
Island Press, Washington D.C., 1986.
30. Environmental Monitoring Group, Clean Production, Western Cape, 1993.
31. KS Patel, A Shukla, AN Tripathi and P Hoffman, Heavy Metal Concentrations Of Precipitation
in East Madhya Pradesh of India, Water, Air, and Soil Pollution, 2001,130,463-468.
32. L Hodges, Environmental Pollution: A Survey Emphasizing Physical and Chemical Principles,
Holt, Rinehart and Winston, New York, 1973.

33. RG Noble (ed.), Hazardous Waste in South Africa, Vol. 1: Situation Analysis, Report prepared
for the department of Environmental Affairs, CSIR, Pretoria, 1992.
34. JS Latimer, EJ Hoffman, G Hoffman, JL Fasching and JG Quinn, Sources of Hydrocarbons in
Urban Runoff, Water, Air, and Soil Pollution, 1990,52,1-21.
35. TW Assmuth and T Strandberg, Groundwater Contamination at Finnish Landfills, Water, Air,
and Soil Pollution, 1993,69,179-199.
36. D Turer, JB Maynard and JJ Sansalone, Heavy Metal Contamination in Soils of Urban
Highways: Comparison between Runoff and Soil Concentrations at Cincinnati, Ohio, Water,
Air, and Soil Pollution, 2001,132,293-314.
37. RM Harrison, Important Air Pollutants and their Chemical Analysis, p. 127-131. In: Pollution
Causes, Effect And Control, 2nd edition, RM Harrison (ed.), Royal Society of Chemistry,
Cambridge, 1990.
38. BB Hicks and WB Johnson, Transport and Deposition of Air Pollutants in Terrestrial
Vegetation and Soils, p.253-261. In: Air pollutants and their Effects on the Terrestrial
Ecosystem, AH Legge and SV Krupa (eds.), Willey, New York, 1986.
39. JD Butler, Air Pollution Chemistry, Academic Press, London, 1979, p. 100-107.
40. AC Chamberlain, Radio-active Aerosols and Vapours, Contemp Phys, 1967,8,561-581.
41. GA Sehmel, Particle and Gas Dry Deposition: A Review, Atmos Environ 1980,14,983-1011.
42. LATA, Aviation and the Environment: A Message from the World's Airlines, May 2000.
http://wwwl.iata.org/Whip/ Files/Weld 0140/Aviation&the%20Environment.pdf.2000.
Accessed on March 1,2003.
43. Aviation TDM, TDM Encyclopedia, Victoria Transport Policy Institute, Updated December
17,2003. http://www.vtpi.org/tdm/tdm77.htm. Accessed on March 4,2003.
44. NR Thomson, EA McBean, W Snodgrass and IB Monstrenko, Highway Stormwater Runoff
Quality: Development of Surrogate Parameter Relationships, Water, Air, and Soil Pollution,
1997,91,307-347.
45. Navy Environmental Fact Sheet, Do You Manually Clean Aircraft Parts or Engine Parts, June
1998. http://www.afcee.brooks.af.mil/eq/recvcling/bio.pdf. June 1998. Accessed on March 4,
2003.
46. S Ardeleanu, Loranger, G Kennedy, G Eesperance and J Zayed, Emission Rates and
Physico-Chemical Characteristics of Mn Particles Emitted by Vehicles using
Methylopentadienyl Manganese Tricarbonyl (MMT) as an Octane Improver, Water, Air, and
Soil Pollution, 1999,115,411-427.
47. V P Evangelou, Environmental Soil and Water Chemistry: Principles and Applications, John
Wiley, Toronto, 1998.
48. MJ Singer and DN Munns, Soils: An Introduction, Macmillan, New York, 1987.
49. J Gerrard, Fundamentals of Soils, T J International, London, 2000.

Rflffiffinnfis 123
50. KH Tan, Environmental Soil Science, Marcel Dekker, New York, 1994, p. 6-7.
51. RW Miller and DT Gardiner, Soils in Our Environment, 8* edition., Prentice Hall Upper
Saddle River, N.J., 1998, p. 145-172.
52. M Schnitzer and SU Khan, Humic Substances in the Environment, Dekker, New York, 1972.
53. M Schnitzer, Binding of Humic Substances by Soil Mineral Colloids. In M Huang and M
Schnitzer, ed., Interaction of Soil Minerals with Natural Organics and Microbes, Special
Publication No. 17, Soil Science Society of America, Madison, WI, 1986. p. 77-101.
54. JA Rice, Contaminant Binding to the Humin Fraction of Soil Organic Matter, The Great
Plains/Rocky Mountain Hazardous Substance Research center (HSRC),
http://www.engg.ksu.edu/HSRC/contarnin.html. January 2, 2004. Accessed on February 28,
2004.
55. CT Chiou, DE Kile and RL Malcolm, Sorption of Vapours of Some Organic Liquids on Soil
Humic Acid and its Relation to Partitioning of Organic Compounds in Soil Organic Matter,
Environ. Sci. Technol., 1988,22,298-303.
56. RS Kookana, S Baskaran and R Naidu, Pesticide Fate and Behaviour in Australian Soils in
Relation to Contamination and Management of Soil and Water: A Review, Aust J. Soil. Res.,
1998,36,715-764.
57. GB Bailey and JL White, Review of Adsorption and Desorption of Organic Pesticides by Soil
Colloids, with Implication Concerning Pesticide Bioavailability, J. Agric. Food Chem., 1964,
12,324-333.
58. RE White, Principles and Practice of Soil Science: The Soil as a natural Resource, 3rd ed.,
Blackwell Science, Oxford, 1997, p. 126-147.
59. CT Chiou, PE Porter and DW Schmedding, Partition Equilibria of Non-Ionic Organic
Compounds between Soil Organic Matter and Water, Environ. Sci. Technol, 1983,17,227-231.
60. AM Scheidegger and DL Sparks, A Critical Assessment of Sorption-Desorption Mechanisms
at the Soil Mineral/Water Interface, Soil Science, 1996,161,813-831.
61. NT Basta, Pesticide Adsorption and Leaching in Soil: An ELISA Laboratory Experiment, J.
Nat. Resour. Life Sic. Edu., 1995,24,23-26.
62. S Saltzman and B Yaron (eds.), Pesticides in Soil, Van Nostrand Reinhold, New York, 1986.
63. RS Jr. Adams and Paulina Li, Soil Properties Influencing Sorption and Desorption of Lindane,
Soil Sci. Soc. Amer. Proc., 1971,35,78-81.
64. GG Briggs, Adsorption of Pesticides by some Australian Soils, Aust. J. Soil Res., 1981,19,61-
68.
65. GA O'Connor and JU Anderson, Soil Factors Affecting Adsorption of 2,4,5-T., Soil Sci. Soc
Amer. Proc., 1974,38,433-436.
66. K Harmsen, Behaviour of Heavy Metals in Soils, Wageningen, Netherlands, 1977.

Rfife.rfinr.p,s 124
67. RS Kookana and LAG, Alymore, Retention and Release of Diquat and Paraquat Herbicides in
Soil, Aust. J. Soil. Res., 1993,31,97-109.
68. FM Ashton and TJ Sheets, The Relationship of Soil Adsorption of EPTC to Oats Injury in
Various Soil Types, Weeds, 1959,7,88-90.
69. SC Fang, P Theisen and VH Freed, Effects of Water Evaporation, Temperature and Rate of
Application on the Retention of ethyl N,N-Di-n-propylthiolcarbamate in Various Soils, Weeds,
1961,9,569-574.
70. Z Gerstl and B Yaron, Adsorption and Desorption of Parathion by Attapulgite as Affected by
the Mineral Structure, J. Agric. Food Chem., 1978,26,569-573.
71. B Yaron, Some Aspects of Surface Interaction of Clays with Organophosphorous Pesticides,
SoilSci., 1978,125,211-216.
72. CI. Harris and GF Warren, Adsorption and Desorption of Pesticides by Soil, Weeds, 1964,12,
120-126.
73. FM Ashton, Movement of Herbicides in Soil with Simulated Furrow Irrigation, Weeds, 1961,
9,612-619.
74. GW Bailey, JL White, and T Rothberg, Adsorption of Organic Pesticides by Montmorillonite:
Role of pH and Chemical Character of Adsorbate, SoilSci. Soc. Am. Proc., 1968,32,222-234.
75. AC Leopold, P Van Schaik and M Neal, Molecular Structure and Herbicide Adsorption,
Weeds, 1960,8,48-54.
76. CT Chiou, LI Peters and VH Freed, A Physical Concept of Soil-water Equilibrium for
Non-ionic Organic Compounds, Science, 1979,206,831-832.
77. RE Green and SW Karickhof, Sorption Estimates for Modelling, p. 80-101. In HH Cheng (ed.)
Interactions between Herbicides and the Soil, Academic Press, New York, 1990.
78. N Sensi, Organic Pollutant Migration in Soils As Affected by Soil Organic Matter, p.48-49. In:
Migration and Fate of Pollutants in Soils and Subsoils, D Petruzelli and FG Helfferich (eds.),
NATO ASI Series, Vol. 32, Springer-Verlag, Berlin, 1993.
79. FJ Stevenson, Organic Matter Reactions Involving Pesticides in Soil, ACS Symp. Ser., 1976,
29,180-207.
80. S Shukla, S Mostaghimi and AC Bruggemen, A Risk-based Approach for Selecting Priority
Pesticides for Groundwater Monitoring Programs, Transactions oftheASAE, 39,1379-1390.
81. RG Gerritse, JA Adeney and ML Sharma, Henry's Law and the Mobility of Organochlorine in
Soils. In: Modeling the Fate of Chemicals in the Environment, ID Moore (ed.), CRES, ANU:
Canberra, 1991, p. 61-6.
82. CR Harris and EP Lichtensen, Factors Affecting the Volatilisation of Insecticidal Residues
from Soils, J. Econ. Entomol.,\96\, 54,1038-1045.

Rpferpnr.es _ 1 2 5
83. WF Spencer, MM Cliath and WJ Farmer, Vapour Density of Soil-applied Dieldrin as Related
to Soil-water Content, Temperature and Dieldrin Concentration, Soil Sci. Soc. Am. Proc, 1969,
33,509-511.
84. WA Jury, WJ Fanner and WF Spencer, Behaviour Assessment Model for Trace Organics in
Soil: II Chemical Classification and Parameter Sensitivity, J. Environ. Qual., 1984, 13,
573-579.
85. RA Leonard, GW Longdate and WG Fleming, Herbicide Runoff from Upland Piedmont Water
Sheds: Data and Implications for Modeling Pesticide Transport, J. Environ. Qual., 1979, 8,
223-229.
86. RD Wauchope, The Pesticide Content of Surface Water Draining from Agricultural Fields: A
Review, J. Environ. Qual., 1978,7,459-472.
87. IJ Graham-Bryce, Diffusion of Organophosphorous Insecticides in Soil, J. Sci. Food Agric.,
1969,20,489-494.
88. CS Heeling, Pesticide Mobility in Soils, HI. Influence of Soil Properties, Soil Sci. Soc. Amer.
Proc, 1971,35,743-748.
89. RA Baker, Organic Substances and Sediments in Water, Vol. 1, Humins and Soils, Lewis
Publishers, Chelsea, 1991.
90. G Caron, IH Suflet and T Belton, Effect of Dissolved Organic Carbon on the Environmental
Distribution of Nonpolar Organic Compounds, Chemosphere, 1985,14,993-1000.
91. CT Chiou, DE Kile, TI Brinton, RL Malcolm, JA Lenheer and P MacCarthy, A Comparison of
Water Solubility Enhancements of Organic Solutes by Aquatic Humic Materials and
Commercial Humic Materials, Environ. Sci. Technol, 1987,21,1231-1234.
92. DC Bouchard, CG Enfield and MD Piwoni, Transport Process Involving Organic Chemical,
p.349-371. In BL Sawhney and K Brown (eds.), Reactions and Movement of Organic
Chemicals in Soil, SSSA and SAS, Madison, 1989.
93. JB Weberand and CT Miller, Organic Chemical Movement Over and Through Soil, p.305-334.
In: BL Sawhney and K Brown (eds.), Reactions and Movement of Organic Chemicals in Soil,
SSSA and SAS, Madison, 1989.
94. AR Swoboda and GW Thomas, Movement of Parathion in Soil Columns, J. Agric. Food
Chem., 1968,16,923-927.
95. M Vighi, and A DiGuardo, Predictive Approaches for the Evaluation of Pesticide Exposure,
p. 73-100. In: Pesticide Risk in Groundwater, M Vighi and E Funari (eds.), CRC Press, Lewis
Publishers, Boca Raton, 1995.
96. CA Edwards, Persistent Pesticides in the Environment, 2od edition, CRC Press, Boca Raton,
1973, p. 112-113.
97. GR. Conway and JN Pretty, Unwelcome Harvest: Agriculture and Pollution, Earthscan,
London, 1991, p. 128-139.

PftfelTMlCftg . . , 1 2 6
98. JW Hamaker, Decomposition: Quantitative Aspects, p. 253-320. In: Pesticides in the
Environment, Vol. I, CAI Goring and JW Hamaker (eds.), Marcel Dekker, New York, 1972.
99. RS Kookana and LAG Alymore, Estimating Pollution Potential of Pesticides to Groundwater,
Aust. J. Soil. Res., 1994,32,1141-55.
100. AV Ogram, RE Jessup, LT Ou and PSC Rao, Effect of Sorption on Biological Degradation
Rates of (2,4-Dichlorophenoxy) acetic acid in Soils, App. Enviro. Microbiol., 1985, 49,
582-587.
101. WD Guenzi and WE Beard, The Effects of Temperature and Soil Water on Conversion of
DDT to DDE in soil, J. Environ. Qual., 1976,5,243-251.
102. AK Samarah, RS Kookana and AM Alston, Fate and Behaviour of Sulfonylurea Herbicides
in Soil Environment: A Review, Aust. J. Agric. Res., 1998,49,775-790.
103. RL Valentine, Non-biological Degradation in Soil, p. 223-243. In: Vadose Zone Modeling of
Organic Pollutants, SM Hern and S Meloncon (eds.), Lewis Publishers, Chelsea, 1986.
104. IJ Graham-Bryce, The Behaviour of Pesticide in Soil, p. 621-670. In: The Chemistry of Soil
Processes, DJ Greenland and MHB Hayes (eds.), John Wiley, Chichester, 1981.
105. FJ Stevenson, Organic Matter Reactions Involving Pesticides in Soil, p. 403-19. In: Humus
Chemistry: Genesis, Composition and Reactions, FJ Stevenson (ed), Wiley, New York, 1982.
106. U Mingelgrin and S. Saltzman, Surface Reactions of Parathion on Clay, Clays and Clay
Minerals, 1979,27,72-78.
107. JE Bittel and RJ. Miller, Lead, Cadmium and Calcium Selectivity Coefficients on
Montmorillonite, Mite, and Koalinite,J. Environ. Qual, 1974,3,250-253.
108. SM Ross (ed.), Toxic Metals in Soil-Plant System, John Wiley, Chichester, 1994.
109. A Chlopecka, Forms of Trace Metals from Inorganic Sources in Soils and Amounts Found in
Spring Barley, Water, Air and Soil Pollution, 1993,69,127-134.
110. S Dudka and A Chlopecka, Effect of Solid Phase Speciation on Metal Mobility and
Phytoavailability in Sludge-amended Soil, Water, Air and Soil Pollution, 1990,51,153-160.
HI. X Xian, Effects of Chemical Forms of Cadmium, Zinc and Lead in Polluted Soils on their
Uptake by Cabbage Plants, Plant and Soil, 1989,113,257-264.
112. ACM Bourg, Metals in Aquatic and Terrestrial Systems: Sorption, Speciation, and
Mobilization, p.3-32. In: Chemistry and Biology of Solid Waste, W Salmons and U Forstner,
(eds.), Springer-Verlag, Berlin, 1988.
113. GW Brummer, Heavy Metal Species, Mobility and Availability in Soils, p. 169-192. In: The
Importance of Chemical Speciation in Environmental Processes, M Bernhard, FE Brinckman
and PJ Sadler, (Eds.), Springer-Verlag, Berlin, 1986.
114. G Merrington and BJ Alloway, The Flux of Cd, Cu, Pb and Zn in Mining Polluted Soils,
Water, Air, and Soil Pollution, 1994,73,333-344.

Bftfftrpncffg 127
115. S Kuo and AS. Baker, Sorption of Copper, Zinc, and Cadmium by Some Acid Soils, Soil Sci.
Soc. Am. J., 44,969-974.
116. BJ Wilkens and P.G. Loch, Accumulation of Cadmium and Zinc from Diffuse Immision on
Acid Sandy Soils as a Function of Soil Composition, Water, Air and Soil Pollution, 1997,95,
1-16.
117. WJ Miller, WE Adams, R Nussbaumer, RA McCreery and HF Perkins, Zinc Content of
Coastal Bermuda grass as Influenced by Frequency and Season of Harvest, Location, and
Level of N and Lime, Agron. J., 1964,56,198-201.
118. MG Hickey and A Kittrick, Chemical Partitioning of Cadmium, Copper, Nickel, and Zinc in
Soils and Sediments Containing High Levels of Heavy Metals, J. Environ. Quai, 1984,13,
372.
119. WP Miller, WW McFee and JM Kelly, Mobility and Retention of Heavy Metals in Sandy
Soils, J. Environ. Qual., 1983,12,579-584.
120. G Taylor, Heavy Metals Pollute Nature, May Reduce Productivity, AMBIO, 1972,1,52-59.
121. JF Hodgson, WL Lindsay and JF Trierweiler, Micronutrient Cation Complexing in Soil
Solution: II Complexing of Zinc and Copper in Displaced Solution from Calcareous Soils,
Soil Sc. Soc. Amer. Proc, 1966,30,723-730.
122. G Tyler, AM Balsberg, G Bengtsson, E Baath and L Trannk, Heavy Metal Ecology of
Terrestrial Plants, Microorganisms and Invertebrates. A review, Water, Air and Soil
Pollution, 1989,47,189-215.
123. RD Harter, Adsorption of Copper and Zinc by Ap and B2 Horizons of Several North Eastern
United States Soils, Soil Sci. Soc. Am. J., 1979,43,679-683.
124. G Brummer, KG Tiller, U Menus and PM Clayton, Adsorption-desorption and or
Precipitation-dissolution Process of Zinc in Soils, Geoderma, 1983,31,337-354.
125. HCH Hahne and W Kroontje, Significance of pH and Chloride Concentration on Behaviour
of Heavy Metal Pollutants: Mercury (II), Cadmium (U), Zinc (U) and Lead (IT), J. Environ.
Quai, 1973,2,444-450.
126. NE Korte, J Skopp, WH Fuller, EE Niebla and BA Alesii, Trace Element Movement in Soils:
Influence of Soil Physical and Chemical Properties, Soil Sci., 1976,122,350-359.
127. JA Plant and R Raiswell, Principles of Environmental Geochemistry, p. 1-39. In: Applied
Environmental Geochemistry, I Thornton (ed.), Academic press, London, 1983.
128. FC Boswell, Municipal Sewage Sludge and Selected Element Application to Soil: Effect on
Soil and Fescue, J. Environ. Qual., 1975,4,267-273.
129. LJ Lund, AL Page, and CO Nelson, Movement of Heavy Metals below Sewage Disposal
Ponds, J. Environ. Quai, 1976,5,330-334.
130. PM Giordano and JJ Mortvedt, Nitrogen Effect on Mobility and Uptake of Heavy Metals in
Sewage Sludge Applied to Soil Columns, J. Environ. Qual., 1976,5,165-168.

R pfprpnrfr<f 128
131. WE Emmerich, LJ Lund, AL Page, and AC Chang, Solid Phase Forms of Heavy Metals in
Sewage Sludge-treated Soils,/. Environ. Qual., 1982,11,178-181.
132. van der H.v.H. Watt, ME Sumner, and ML Cabrera, Bioavailability of Copper, Manganese
and Zinc in Poultry Litter, J. Environ. Qual., 1994,23,43-49.
133. B Cartwright, RH Merry and KG Tiller, Heavy Metal Contamination of Soils around a Lead
Smelter at Port Pirie, South Australia, Aust. J. Soil Res., 1976,15,69-81.
134. LHP Jones and SC Jarvis, The Fate of Heavy Metals, p.593-620. In: The Chemistry of Soil
Processes, DJ Greenland and MHB Hayes (eds), Willey, Chichester, 1981.
135. GE Rayment and FR Higginson, Australian Laboratory Handbook of Soil and Water
Chemical Methods, Inkata Press, Melbourne, 1992, p. 2.
136. M Csuros, Environmental Sampling and Analysis Lab Manual, Lewis Publishers, Boca
Raton, 1997.
137. DA Skoog, DM West and FJ Holler, Fundamentals of Analytical Chemistry, 6* Edition,
Saunders College, Fort Worth, 1992.
138. P Patnaik, Handbook of Environmental Analysis: Chemical Pollutants in Air, Water, Soil,
and Solid Wastes, Lewis Publishers, Boca Raton, 1997.
139. PR Day, Particle Fractionation and Particle-size Analysis, p. 545-567. In: Methods of Soil
Analysis, Part I: Physical and Mineralogical Properties, CA Black (ed), Agronomy No. 9,
American Society of Agronomy, Madison, WI, 1965.
140. Soil Science 212/217 Practical notes, School of Applied Environmental Sciences, University
of Natal, Pietermaritzburg, 2003.
141. GL Kerven, NW Menzies and MD Geyer, Soil Carbon Determination by High Temperature
Combustion - A Comparison with Dichromate Oxidation Procedure and the Influence of
Charcoal and Carbonate Carbon in the Measured Value, Commun. Soil Sci. Plant Anal.,
2000,31,1935-1939.
142. B Kovaes, P Prokisch, Z Gyori, AB Kovdcs and AJ Palencsar, Studies on Soil Preparation
for Inductively Coupled Plasma Atomic Emission Spectrophotometer Analysis, Commn. Soil
Sci. Plant Anal, 2000,31,1949-1963.
143. BA Zarcinas, MJ Laughlin and MK Smart, The Effect of Acid Digestion Technique on the
Performance of Nebulization Systems Used in Inductively-Coupled Plasma Spectrometry,
Commn. Soil Sci. Plant Anal, 1996,27,1331-1354.
144. R Smith, Evaluation of Various Techniques for the Pre-treatment of Sewage Sludges Prior to
Trace Metal Analysis by Atomic Absorption Spectrophotometry, Water SA, 1983,9,31-36.
145. US Environmental Protection Agency (EPA), SW-846 on-line: Test Methods for Evaluating
Solid Wastes: Physical/Chemical Methods, (3000 series Method 3050B),
http://www.epa.gov/epaoswer/hazwaste/test/main.htm January 7,2003. Accessed on March
03,2003.
RfiffiTfinrifis 129
146. G M Pierzynski, Past, Present and Future Approaches for Testing Metals for Environmental
Concern and Regulatory Approaches, Commn. Soil Sci. Plant Anal., 1998,29,1523-1536.
147. SE VI an ah an. Quantitative Chemical Analysis, Brooks/Cole, Monterey, 1986.
148. BL Swhaney and DE StUwell, Dissolution and Elemental Analysis of Minerals, Soils and
Environmental Samples, p. 49-82. In: Quantitative Methods in Soil Mineralogy, SSSA
Miscellaneous Publications, JE Amonette and LW Zelazny (eds.), SSSA, Madison,
Wisconsin, 1994.
149. Smith and Browner, Measurement of Aerosol Transport Efficiency in Atomic Spectroscopy,
Anal. Chem., 1982,54,533-537.
150. GRB Webster, Soxhlet and Ultrasonic Extraction ofOrganics in Solids, p. 3397-3410. In:
Encyclopedia of Analytical Chemistry: Applications, Theory and Instrumentation, RA
Meyers (ed.), Vol. 4, John Wiley, Chichester, 2000.
151. US Environmental Protection Agency (EPA SW-846 on-line: Test Methods for Evaluating
Solid Wastes: Physical/Chemical Methods, (3000 series Method 3540C,Method 3660B),
http://www.epa.eov/epaoswer/hazwaste/test/main htm January 7,2003. Accessed on May 25,
2003
152. PT Palmer, Gas Chromatography/Mass Spectrometry, p. 11728-11745. In: Encyclopedia of
Analytical Chemistry: Applications, Theory and Instrumentation, RA Meyers (ed.), Vol. 13,
John Wiley, Chichester, 2000, p. 3398-3401.
153. FA Settle (ed.), Handbook of Instrumental Techniques for Analytical Chemistry, Prentice
Hall, Upper Saddle River, N.J., 1997.
154. W Jennings, Analytical Gas Chromatography, Academic Press, Orlando, 1987.
155. LA Fowlis, Gas Chromatography, 2nd edition, John Wiley, Chichester, 1995.
156. RL Grob, Modern Practice of Gas Chromatography, 2nd edition, John Wiley, Chichester,
1985.
157. HF Linskens and JF Jackson (eds.), Modern Methods of Plant Analysis, Vol. 3: Gas
Chromatography/Mass Spectrometry, Springer-Verlag, Berlin, 1986.
158. RE March, Quadrupole Ion Trap Mass Spectrometer, p. 11848-1854. In: Encyclopedia of
Analytical Chemistry: Applications, Theory and Instrumentation, RA Meyers (ed.), Vol. 13,
John Wiley, Chichester, 2000.
159. AJ Simpson, School of Applied Environmental Sciences, University of KwaZulu-Natal
(Pietermaritzburg), South Africa, 2004.
160. RL Bertholf, Gas Chromatography and Mass Spectrometry in Clinical Chemistry, p. 1314-
1318. In: Encyclopedia of Analytical Chemistry: Applications, Theory and Instrumentation,
RA Meyers (ed.), Vol. 2, John Wiley, Chichester, 2000.
161. C Pagotto, N Remy, M Legret and P Le Cloirec, Heavy Metal Pollution of Road Dust and
Roadside Soil near a Major Rural Highway, Environmental Technology, 2001,22,307-319.

Rfiffirencfts 130
162. JA Markus and AB McBratney, An urban soil study: heavy metals in Glebe, Australia, Aust.
J. Soil Res., 1996,34,453-65.
163. US Environmental Protection Agency, Polluted Runoff (Nonpoint Source pollution), EPA,
http://www.epa.gov/owow/nps/MMGI/aiapter4/ch4-7f.html. Accessed on April 26,2004.
164. E Greenberg, LS Clesceri and AD Eaton (eds.), Standard Methods for the Examination of
Water and Wastewater, 18th edition, American Public Health Association, Washington, D.C.,
1992.
165. GenStat for Windows Release 6.1,6* Edition, VSN International Ltd, Oxford, 2002.
166. JH Herselman, CE Steyn and MV Fey, Baseline Concentration of 7 Trace Elements in
Surface Soils of South Africa and Implications for Environmental Management, Article
submitted to S.Afr. J. Sci., June 2003.
167. Z Li and LM Shuman, Heavy Metal Movement in Metal-contaminated Soil Profile, Soil Sci.,
161,656-666.
168. WP Miller, WW McFee and JM Kelly, Mobility and Retention of Heavy Metals in Sandy
Soils, J. Env. Qual, 1983,12,579-584.
169. Y Lu, Z Gong, G Zhang and W Burghardt, Concentrations and Chemical Speciations of Cu,
Zn, Pb and Cr of Urban Soils in Ninjing, China, Geoderma, 2003,115,101-111.
170. Water Research Commission, Permissible Utilization and Disposal of Sewage Sludge, 1*
edition, WRC, Pretoria, 1997, p. 7.
171. Pickering Laboratories, Glyphosate and AMP A Analysis in Crops, Method abstract for
post-column liquid chromatography 206,2003,
http://www.pickeringlabs.com/support/apDnotes/MA206.pdf. Accessed on May 28,2004.
172. S Tseng, P Chang and S Chou, A Rapid and Simple Method for the Determination of
Ethephon Residue in Agricultural Products by GC with Headspace Sampling, Journal of
Food and Drug Analysis, 2000,8(3), 213-217.
173. The NIST Mass Spectral Search Program for the NIST/EPA/NIH Mass Spectral Library,
Version 2.0 a, build Jul 1,2002.
174. K Verschueren, Handbook of Environmental Data on Organic Chemicals, 3rd edition, Van
Nostrand Reinhold, New York, 1996.
175. RA Chapman and CR Harris, Persistence of four Pyrethroid Insecticides in a Mineral and an
Organic Soil, J. Environ. Sci. Health, 1981, B16,605-615.
176. RA Chapman, CM Tu, CR Harris and C Cole, Persistence of five Pyrethroid Insecticides in a
Sterile and Natural, Mineral and Organic Soil, Bull. Environ. Contamin. Toxicol., 1981, 26,
513-519.
177. EZ Zhang, SU Khan, MH Akhtar and KC Ivarson, Persistence, Degradation, and Distribution
of Deltamethrin in an Organic Soil under Laboratory Conditions, J. Agric. Food Chem.,
1984,32,1207-1211.

Rftffirftnr.fis 131
178. Extension Toxicology Network (EXTOXNET), Pesticide Information Profile: Azoxystrobin,
http://pmep.cce.comell.edu/profiles/extoxnety24H^^tan/̂ r>yYstrobin^xt.html. 12/18/2001.
Accessed on May 27,2004
179. Syngenta Crop Protection, Envirofacts: Azoxystrobin, The Active Ingredient in Quadris9 and
Abound*, http://www.svngentacropprotection-us.corn/enviro/futuretopics/AzoxvJulvl7.pdf.
2003. Accessed on May 27,2004.
180. WH Ahrens (ed.), Herbicide Handbook of the Weed Science Society of America, Weed
Science Society of America, II lions. 1994.
181. Pesticide Management Group, Pesticide Residues in Food and the Environment, JMPR:
Evaluations of Pesticide Residues in Food (Flusilazole), FAO, 1993, page 536.
http://ww.fao.org/WAICENT/FAOI>n?0/^
ad/93/flusil.pdf. Accessed on June 09,2004.