an affinity-based method for the purification of ...nathan.instras.com/mydocsdb/doc-759.pdf · an...
TRANSCRIPT

An Affinity-Based Method for the Purification of Fluorescently-LabeledBiomolecules
Trung Nguyen, Neel S. Joshi, and Matthew B. Francis*
Department of Chemistry, University of California, Berkeley, California 94720-1460, and Materials Sciences Division,Lawrence Berkeley National Labs, Berkeley, California 94720. Received May 22, 2006;Revised Manuscript Received June 17, 2006
Due to the difficulty of separating mixtures of labeled and unlabeled biomolecules, a general new method for theaffinity purification of modified proteins has been developed. A Sepharose-based solid support bearingâ-cyclodextrin groups was used to capture chromophore-modified proteins selectively, while unmodified proteinsremained in solution. After isolation of the resin, the modified proteins were released by treating the sample witha competitive cyclodextrin binder, such as adamantane carboxylic acid. This procedure was demonstrated forseveral dyes displaying a wide range of spectral characteristics and diverse chemical structures. Preliminary studieshave shown that this method can also be used to enrich modified peptide fragments present in proteolytic digests.This technique is anticipated to accelerate the development of new protein modification reactions and could providea useful tool for proteomics applications.
The attachment of chromophores to biomolecules is acommon practice in chemical biology, affording fluorescentprobes that can track protein localization (1a), detect the bindingof substrates (1b), and measure distances through fluorescenceresonance energy transfer (FRET) (1c,d). Typically these labelsare introduced through the reaction of lysine residues with NHS-esters, isocyanates, or isothiocyanates, or through the modifica-tion of cysteine residues with maleimides or iodoacetamides(2). However, these reactions commonly do not reach fullconversion, yielding inseparable mixtures of labeled andunlabeled proteins. Although this is acceptable in some in-stances, many applications (such as FRET studies) would benefitfrom the removal of unreacted proteins from the sample.Unfortunately, no general method exists to achieve this separa-tion under conditions mild enough to maintain the folded, nativestructure of the protein targets. To address this, we report hereina general affinity-based method that can isolate biomoleculesthat are labeled with small organic chromophores.
Numerous strategies have emerged for the formation of host-guest complexes through molecular recognition events (3). Ofthese, complexes formed with cyclodextrins and their derivativesare arguably the most general (4). A wide range of organicmolecules has been found to form complexes with cyclodextrinswith binding constants that span 6 orders of magnitude (5), and,as a result, cyclodextrins have found use in applications rangingfrom the solubilization of pharmaceutical compounds (6) tochiral chromatography (7). Several studies have established theability of cyclodextrins to form host-guest complexes withfluorescent chromophores (7b, 8, 9); in contrast, we have foundthat they have little-to-no affinity for most proteins. Weenvisioned using biocompatible resins functionalized withcyclodextrins to sequester labeled biomolecules selectively,while leaving unlabeled species in solution, Figure 1b. Afterisolation of the resin, it was anticipated that the captured proteinscould be released through the addition of a competitive binder,such as3.
A solid support suitable for this purpose was prepared throughthe exposure of commercially available NHS-ester functional-ized Sepharose resin to amine-functionalizedâ-cyclodextrin (9)
(1a), yielding resin2a, Figure 1a. The efficiency of the couplingreaction was monitored by UV analysis of the released NHS,indicating that a loading of 8.7µmol of â-cyclodextrin/mL ofdry resin was obtained. Following hydrolysis of any remainingNHS-esters using ethanolamine, the resin was thoroughly rinsedwith water and stored in solution at 4°C until use (10).
In light of the high cost of1a, we have also developeda more practical route for the preparation of the resin. Acti-vation of inexpensiveâ-cyclodextrin with carbonyl diimid-azole followed by treatment with excess propylenediamineafforded carbamate1b with only minimal amounts of doublycoupled product. This mixture was used to prepare resinanalogue2b, which performed equivalently in the studiesdescribed below.
The ability of the cyclodextrin resin to purify labeledbiomolecules was evaluated in the context of a typical lysinemodification experiment. After exposure of a solution ofmyoglobin to 1 equiv of Oregon Green NHS-ester (yieldingconjugate4) and subsequent removal of the small moleculesusing gel filtration, 320µL of the resulting 1 mg/mL solutionwas exposed to 37 mg of resin2a for 5 min. UV-vis analysisindicated the complete disappearance of the Oregon Greenabsorbance from the supernatant (λmax ) 495 nm), whileunlabeled myoglobin (λmax ) 410 nm) remained in solution,Figure 2a. SDS-PAGE analysis of the supernatant indicatedthat no fluorescent protein remained (Figure 2b, lane 2), andESI-MS confirmed that virtually all of the labeled protein hadbeen captured (Figure 2c,d). After isolation via filtration, it wasfound that the resin could be washed with several portions ofwater without releasing the bound protein.
Several competitive binders have been used to liberate themodified protein from the resin. Adamantane carboxylic acid(3, 10 mM in 100 mM ammonium chloride, pH 7) has beenparticularly useful in this regard, resulting in nearly completerelease in under 1 min, Figure 2a,b. ESI-MS analysis of theresulting solution confirmed that>90% of the eluted proteinhad been modified, Figure 2e (11). Under saturating conditions,UV-vis analysis indicated that 100 mg of resin was able tocapture 40 nmol (0.67 mg, in this case) of labeled protein.
869Bioconjugate Chem. 2006, 17, 869−872
10.1021/bc060130i CCC: $33.50 © 2006 American Chemical SocietyPublished on Web 07/01/2006

In terms of buffers, we have found that efficient capture oflabeled proteins can be achieved in 50-100 mM HEPES (pH7), although the use of increased amounts of resin wassometimes required to improve the amount of captured protein(Table 1, entries 2, 9). Other buffers, including phosphate, tris,and acetate, consistently afforded 60-90% yields of modifiedprotein. The technique was also effective for chymotrypsinogenA labeled with FITC (5) in a variety of buffers (entries 8-12)and for subtilisin Carlsberg (entry 13). In all cases, MS analysis
indicated that the fractions eluted with3 contained only labeledproteins. Importantly, the chymotrypsinogen A was found topossess similar levels of proteolytic activity before and afterthe purification process (12). This technique has also beenapplied to the purification of TAMRA- (6), Cascade Blue- (7),and coumarin-labeled (8) proteins, Table 1, entries 15-17.
Consistent with cyclodextrin-dependent binding, resin pre-washed with3 was unable to capture either labeled or unlabeledprotein. However, we have observed in several cases that
Figure 1. A general strategy for the purification of chromophore-labeled proteins. (a) The solid support used in this approach is prepared byreacting Sepharose-NHS resin with amino-substitutedâ-cyclodextrin1a or 1b. (b) This resin can then be used to capture chromophore-labeledproteins selectively, allowing facile removal of unmodified protein via filtration. The captured proteins can be eluted from the resin using a competitivecyclodextrin binder, such as adamantane carboxylic acid (3).
Figure 2. Purification of Oregon Green labeled myoglobin. (a) UV analysis of supernatants during the purification process. Blue) crude labelingsolution. Cyan) supernatant after exposure to resin2a. Red) protein fraction released from isolated resin after treatment with3. The absorbanceat 410 nm is due to the myoglobin heme group. The composition of each fraction was also verified using (b) SDS-PAGE and (c-e) ESI-MSanalysis.
870 Bioconjugate Chem., Vol. 17, No. 4, 2006 Nguyen et al.

protein-chromophore conjugates bind the resin stronger thana single dye alone; thus, secondary interactions between theprotein and the solid support are also functioning. This isadvantageous, as modified proteins can be isolated from crudelabeling reactions that still contain excess reagents.
In initial experiments, the ability of this method to collectlabeled biomolecules from mixtures has also proven useful forthe analysis of proteolytic digests. As an example, a sample ofmyoglobin modified with TAMRA-NHS (yielding6) wasdenatured before incubation with trypsin. The resulting peptidemixture was exposed to resin2a, and the solid support wasisolated and rinsed. After elution of the peptides into a minimalvolume of the solution of3 described above, LC-ESI-MSindicated enrichment in the modified peptides relative to digestedsamples that had not been exposed to resin2a (See Figure S8in Supporting Information). A particular advantage of thismethod is its ability to isolate the modified fragments fromunmodified peptides, denaturants, and peptide contaminantsarising from trypsin autoproteolysis. The design of specificdigest “tags” with improved cyclodextrin binding affinity is inprogress.
In conclusion, a new general procedure has been developedfor the isolation of modified proteins and peptides. Thistechnique features mild conditions for the capture and releaseof biomolecular targets, ease-of-use, and the potential to purifya large number of synthetic modification products. It isanticipated that this method will also find use as a tool forproteomic analysis and will facilitate the development of newprotein modification reactions. Current efforts are exploring theuse of this strategy to separate singly labeled proteins frommultiply labeled proteins, as well as the adaptation of thistechnique to afford continuous flow LC-based methods.
ACKNOWLEDGMENT
We would like to thank the NIH for financial support(GM072700-01), as well as the University of California,Berkeley, Chemistry Department. N.S.J. acknowledges theSaegebarth family for generous fellowship support.
Supporting Information Available: Experimental details. Thismaterial is available free of charge via the Internet at http://pubs.acs.org.
LITERATURE CITED
(1) For examples using fluorescent bioconjugates, see: (a) Straight,A. F., Cheung, A., Limouze, J., Chen, I., Westwood, N. J., Sellers,J. R., and Mitchison, T. J. (2003) Dissecting Temporal and SpatialControl of Cytokinesis with a Myosin II Inhibitor.Science, 299,1743-1747. (b) Pickup, J. C., Hussain, F., Evans, N. D., Rolinski,O. J., and Birch, D. J. S. (2005) Fluorescence-based glucose sensors.Biosensors Bioelectronics 20, 2555-2565. (c) Borsch, M., Diez, M.,Zimmermann, B., Reuter, R., and Graber, P. (2002) Stepwise rotationof theγ-subunit of EF0F1-ATP synthase observed by intramolecularsingle-molecule fluorescence resonance energy transfer.FEBS Lett.527, 147-152. (d) Wallrabe, H., and Periasamy, A. (2005) Imagingprotein molecules using FRET and FLIM microscopy.Curr. Opin.Biotechnol. 16, 19-27.
(2) For an excellent review of common bioonjugation techniques, seeG. T. Hermanson, (1996)Bioconjugate Techniques, Academic Press,San Diego.
(3) An entire issue ofChemical ReViews has been devoted to thistopic: (1997)Chem. ReV. 97, 1231-1734.
(4) Connors, K. A. (1997) The Stability of Cyclodextrin Complexesin Solution.Chem. ReV. 97, 1325-1358.
(5) Connors, K. A. (1995) Population characteristics of cyclodextrincomplex stabilities in aqueous solution.J. Pharm. Sci. 84, 843-848.
Table 1. Recovery of Modified Protein after Resin Pulldowna
entry proteinb dye buffer mg of resin % fluorescencec
1 myoglobin 4 none 15 852 myoglobin 4 100 mM HEPES 45 913 myoglobin 4 25 mM phosphate 45 724 myoglobin 4 50 mM phosphate 45 655 myoglobin 4 100 mM phosphate 45 696 myoglobin 4 100 mM Tris 45 707 myoglobin 4 100 mM acetate 45 678 chymotrypsinogen a 5 none 15 759 chymotrypsinogen a 5 50 mM HEPES 15 7410 chymotrypsinogen a 5 50 mM phosphate 45 5311 chymotrypsinogen a 5 50 mM Tris 45 7212 chymotrypsinogen a 5 50 mM acetate 15 5913 subtilisin Carlsberg 4 none 15 98d
14 myoglobin 5 none 15 7515 myoglobin 6 none 15 9516 myoglobin 7 none 15 9717 myoglobin 8 none 15 98
a For detailed procedure see Supporting Information.b Each experiment was carried out with 100µL of protein solution at 50µM in the indicated bufferat pH 7.c Total fluorescence eluted from the resin with3 as a percentage of all detected fluorescence in bound and unbound fractions (based on SDS-PAGEanalysis). Mass spectrometry and UV-vis spectroscopy indicated that samples eluted with3 possessed only modified protein.d Sample quantitation wascarried out by UV analysis.
Communications Bioconjugate Chem., Vol. 17, No. 4, 2006 871

(6) Del Valle, E. M. M. (2004) Cyclodextrins and their uses: a review.Process Biochem. 39, 1033-1046.
(7) For a recent review, see: (a) Ward, T. J. (2000) Chiral separations.Analytical. Chem. 72, 4521-4528. (b) Li, S., and Purdy, W. C.(1992) Cyclodextrins and their applications in analytical chemistry.Chem. ReV. 92, 1457-1470.
(8) (a) Politzer, I. R., Crago, K. T., Hampton, T., and Joseph, J. (1989)Effect of â-cyclodextrin on the fluorescence, absorption and lasingof rhodamine 6G, rhodamine B and fluorescein disodium salt inaqueous solutions.Chem. Phys. Lett. 159, 258-262. (b) Flamigni,L. (1993) Inclusion of fluorescein and halogenated derivatives inR-, â-, and γ-cyclodextrins: a steady-state and picosecond time-resolved study.J. Phys. Chem. 97, 9566-9572.
(9) Hamasaki, K., Ikeda, H., Nakamura, K., Ueno, A., Toda, F. Suzuki,I., and Osa, T. (1993) Fluorescent sensors of molecular recognition.
Modified cyclodextrins capable of exhibiting guest-responsivetwisted intramolecular charge-transfer fluorescence.J. Am. Chem.Soc. 115, 5035-5040. This compound is also commercially avail-able.
(10) Resin samples have been stored at 4°C for months with no lossin activity.
(11) Comparison of the heme absorbance at 409 nm to the OregonGreen absorbance at 495 nm was consistent with this observation.Control experiments have also confirmed that unlabeled protein hasno affinity to resin2a or 2b (see Supporting Information FigureS10).
(12) See Supporting Information for details.
BC060130I
872 Bioconjugate Chem., Vol. 17, No. 4, 2006 Nguyen et al.

S1
An Affinity-Based Method for the Purification of Fluorescently-Labeled Biomolecules
Trung Nguyen, Neel S. Joshi and Matthew B. Francis*
Department of Chemistry, University of California, Berkeley, CA 94720-1460, and
Materials Sciences Division, Lawrence Berkeley National Labs, Berkeley, CA 94720
Supporting Information
General Procedures. Unless otherwise noted, all chemicals were obtained from
commercial sources and used without further purification. All small molecule reactions
were carried out under a nitrogen atmosphere in oven dried glassware unless otherwise
noted. All organic solvents were removed under reduced pressure using a rotary
evaporator. Pyridine was distilled under an inert atmosphere from calcium hydride.
Water (ddH2O) used in biological procedures or as a reaction solvent was deionized using
a NANOpureTM purification system (Barnstead, USA). Myoglobin (M 1882) from horse
heart, Subtilisin Carlsberg protease (P5380) from Bacillus licheniformis, and α-
chymotrypsinogen A (P 5380) from bovine pancreas were purchased from Sigma (St.
Louis, USA) and used without further purification. Size exclusion chromatography was
performed using NAPTM 5 columns from Amersham Biosciences. MicrospinTM G-25
columns were purchased from Amersham Biosciences. The pre-packed Sephadex resin
was discarded and the columns were thoroughly washed prior to use. Dyes used for
protein labeling experiments were purchased from Invitrogen and used without further
purification. Samples were mixed using a Barnstead Thermolyne Labquake® Shaker
Rotisserie. NHS-activated SepharoseTM 4 Fast Flow resin (17-0906-01) was purchased
from Amersham Biosciences. 6-monodeoxy-6-monoamino-β-cyclodextrin (M 2314) and
β-cyclodextrin hydrate (856088) were obtained from Aldrich Chemical Company.

S2
Instrumentation and Sample Analysis Preparations. UV-Vis spectroscopic
measurements were conducted on a Tidas-II benchtop spectrophotometer (J & M,
Germany).
Matrix assisted laser desorption-ionization time-of-flight mass spectrometry
(MALDI-TOF MS) was performed on a Voyager-DETM system (PerSeptive Biosystems,
USA). All samples were co-crystallized using either an α-cyano-4-hydroxycinnamic acid
or a sinapinic acid solution (10 mg/mL in 1:1 MeCN:ddH2O with 0.1% TFA).
Electrospray LC/MS analysis was performed using an API 150EX system (Applied
Biosystems, USA) equipped with a Turbospray source and an Agilent 1100 series LC
pump. Protein mass reconstruction was performed on the charge ladder with Analyst
software (version 1.3.1, Applied Biosystems). Prior to MS analysis, biological samples
were desalted and/or separated from small molecule contaminants using �C18 ZipTip®
pipet tips (Millipore, USA), NAP-5TM columns (Amersham Biosciences, USA), Strata C-
18ETM reversed-phase columns (Phenomenex, USA), or 3500 molecular weight cutoff
Slide-A-Lyzer® Dialysis Cassettes (Pierce Biotechnology, Inc., USA) as indicated
below. Intact protein chromatography was performed using a Jupiter 5u C5 300Å
reversed phase column (2.0 mm x 150 mm) with a ddH2O:MeCN gradient mobile phase
containing 0.1% formic acid (250 �L/min). An Agilent Zorbax 3.5 µm 300SB-C8
reversed phase column (2.1 mm x 50 mm) was used for the analysis of trypsin digest
fragments.
For protein analysis, sodium dodecyl sulfate-polyacrylamide gel electrophoresis
(SDS-PAGE) was accomplished on a Mini-Protean apparatus (Bio-Rad, USA), following
the general protocol of Laemmli.1 Crude reaction mixtures were diluted by a factor of 5

S3
(v/v) in ddH2O and combined 1:1 (v/v) with gel loading buffer containing SDS, DTT, and
bromophenol blue. Samples were then loaded onto the gel without heating. After
removal of the completed gels from their cassettes, the bottom portions containing free
dye were excised promptly, after which the gels were submerged in water for rinsing and
imaging. Commercially available markers (Bio-Rad, USA) were applied to at least one
lane of each gel for calculation of apparent molecular weights. Fluorescence
visualization of gels was obtained by UV transillumination at 302 nm. Visualization of
protein bands was accomplished by staining with Coomassie® Brilliant Blue R-250 (Bio-
Rad, USA). Gel imaging was performed on an EpiChem3 Darkroom system (UVP,
USA).
General procedure for fluorescent labeling of proteins. In a typical procedure, 3.5 mL
of a 0.1 mM myoglobin solution in 0.1 M NaHCO3 pH 8.3 aqueous buffer was
transferred to a centrifuge tube. An amine reactive fluorophore (~1 mg) in 20-40 µL of
DMF was then added. The solution was stirred on a laboratory mixer for 2.5 h and then
quenched with 0.1 M H2NOH pH 7.2 (80 µL, 8.0 µmol) aqueous solution. The reaction
was then mixed overnight at room temperature. For specific examples of protein labeling
reactions refer to Table 1. A portion of the crude reaction was purified by size exclusion
chromatography. The purified solution was analyzed by UV-vis spectroscopy, MALDI-
TOF-MS or ESI-MS, and SDS-PAGE. The sample used for many of the experiments
presented in the supporting information will be referred to as S1 (see Table S1)

S4
Table S1. Fluorescent labeling of myoglobin with amine reactive dyes. Dye/fluorophore Conjugate
# Eq. of dye
added Conjugates detected1
Oregon Green 488 carboxylic acid SE 4 1.0 Unmod, +1, +2 TAMRA-NHS 6 5.0 +2, +3, +4, +5 Cascade Blue acetyl azide 7 5.0 Unmod, +1, +2 Alexa Fluor 350 carboxylic acid SE 8 5.0 +2, +3, +4, +5 Oregon Green 488-X-succinimidyl ester S1 5.0 Unmod, +1, +2, +3 1Extent of labeling was determined by MALDI-TOF or ESI-LC MS. Only predominant species present in the spectra were reported. Quantification of sepharose resin coupling reaction. In order to quantify the degree
of modification to the NHS-activated sepharose resin the Amersham literature procedure
was employed. To analyze the amount of NHS hydrolyzed during a coupling
experiment, a calibration curve was formed by monitoring the absorbance at 260 nm for
serial dilutions of a 30 mM NHS aqueous solution in 0.2 M NaHCO3/0.5 M NaCl pH 8
buffer. For coupling reactions to the NHS-activated resin, Amersham Biosciences
literature values predicted concentrations of released NHS to be from 16-23 µmol/mL of
resin.
Synthesis of ββββ-cyclodextrin modified sepharose resin (2a). NHS-activated resin was
transferred to a fritted column as a slurry and filtered to dryness. The resin occupied a
volume of 17.5 mL. A solution of 6-monodeoxy-6-monoamino-cyclodextrin (0.44 g) in
10 mL 0.2 M NaHCO3/0.5 M NaCl pH 8 aqueous buffer was added to the resin. The
column was then capped and agitated on a laboratory shaker for 2 h. The reaction tube
was drained and the eluting solvent was collected for subsequent analysis. Afterwards,
the resin was subjected to the following series of washes:
• 3 washes of 0.2 M NaHCO3/0.5 M NaCl pH 8 aqueous buffer (10 mL portions) • 3 washes of 0.5 M ethanolamine/0.5 M NaCl pH 8.3 aqueous buffer (10 mL
portions)
S5
• 3 washes of 0.1 M acetate/0.5 M NaCl pH 4 aqueous buffer (10 mL portions) • 1 wash of H2O (10 mL portions) • 2 washes of 25 mM phosphate buffer pH 7 (10 mL portions) • 3 washes of H2O (200 mL portions)
The resin was then stored as a slurry in H2O at 4 oC.
The eluting fraction from the coupling reaction was determined to contain 153
µmol of NHS. This corresponds to a cyclodextrin loading of 8.7 µmol/mL of dry resin.
Expected values for NHS release during this reaction were 280-403 µmol according to
Amersham loading values.
Synthesis of amino �-cyclodextrin derivative (1b). �-cyclodextrin monohydrate was
placed in a flask as a solid and dried under vacuum at 50 ºC overnight. The dry
cyclodextrin (1.0 g, 0.86 mmol) was transferred to a new flask and dissolved in freshly
distilled pyridine (3.0 mL). A solution of carbonyldiimidazole (140 mg, 0.86 mmol)
dissolved in 1 mL of freshly distilled pyridine was added to the reaction mixture
dropwise over 2 minutes while stirring. The activation reaction was allowed to proceed
at rt for 2 h. After this time, the activated cyclodextrin solution was added dropwise to a
flask containing 1,3-diaminopropane (360 �L, 4.32 mmol) while stirring. After 1 h, the
cyclodextrin mixture was precipitated by adding the reaction solution dropwise to a flask
containing 500 mL of CH2Cl2 with vigorous stirring. The flaky white precipitate was
isolated via suction filtration through filter paper, then placed under vacuum overnight.
The cyclodextrin mixture was analyzed by MALDI-TOF mass spectrometry (Figure S1)
and used without further purification.

S6
Figure S1. MALDI-TOF spectrum of 1b using �-cyano-4-hydroxycinnamic acid matrix. Expected mass for �-cyclodextrin [M+Na]+ = 1158.0. Other peaks correspond to additions of the 100 Da carbamate fragment (see Figure 1 in main text). Synthesis of �-cyclodextrin modified Sepharose resin (2b). Sepharose-NHS resin
slurry (0.5 mL) was placed in a fritted tube and filtered. To the dry resin was added a
solution of 1b (75 mg in 1.5 mL of NaHCO3 (0.1 M), NaCl (0.5 M), pH 8). The resulting
slurry was agitated overnight. The resin was then subjected to the following rinses:
• 3x 1 mL of 0.5 M ethanolamine/0.5 M NaCl pH 8 • 3x 1 mL 0.1 M acetic acid/0.5 M NaCl pH 4 • 2x 20 mL H2O
The resin was stored at 4 oC as a slurry in water.
General procedure for resin capture of proteins. First, the crude protein solution was
purified by size-exclusion chromatography using a NAPTM 5 column into pure H2O or
into the appropriate buffer solution. To a microcentrifuge tube containing 10-20 mg of
dry CD modified sepharose resin, the
purified protein (100-200 µL of 60 µM solution) was added. Additional water was added
to the heterogeneous solution to ensure proper mixing of the resin and protein solution.
The solution was then agitated on a laboratory mixer for approximately 5 min. The
heterogeneous solution was then transferred to a fritted microspin column and spun dry.
800 1240 1680 2120Mass (m/z)
1159.3
1259.4
1359.41236.8
1469.6
unmodified �-cyclodextrin + Na+
+1 carbamatefragment + Na+
+2 carbamatefragments + Na+
+1 carbamatefragment + H+
800 1240 1680 2120Mass (m/z)
1159.3
1259.4
1359.41236.8
1469.6
unmodified �-cyclodextrin + Na+
+1 carbamatefragment + Na+
+2 carbamatefragments + Na+
+1 carbamatefragment + H+

S7
The eluting solvent was collected in microcentrifuge tubes. It was observed that the color
of the protein solution had been transferred to the resin. Water (0.5 mL) was then added
to the column and mixed by manual inversion for 1 min. The resin was rinsed with
additional amounts of H2O. To elute the protein, 0.5 mL of 10 mM adamantane
carboxylic acid/100 mM NH4Cl pH 7 was added to the resin and inverted by hand for 1
min. The color of the eluting solution resembled that of the beginning protein solution.
Additional washes with the eluting solvent mixture were performed to achieve higher
levels of protein recovery. The eluting fractions were analyzed by UV-vis spectroscopy
(Figure S2), and SDS-PAGE (Figure S3).
Figure S2. UV-vis spectrum of resin 2b capture of S1: before exposure to resin (blue), flow through after resin exposure (green), H2O washes of resin (orange), elution off of resin with 10 mM adamantane carboxylic acid, 100 mM NH4Cl, pH 7 (red).
200 300 400 500 600 700Wavelength (nm)
Abs
orba
nce
200 300 400 500 600 700Wavelength (nm)
Abs
orba
nce

S8
Figure S3. SDS PAGE analysis of eluting fractions for a) TAMRA labeled myoglobin b) Oregon Green labeled myoglobin c) Alexa Fluor 350 labeled myoglobin d) Cascade Blue labeled myoglobin.
SDS-PAGE quantification of modified protein recovery. SDS-PAGE analysis was
used to quantify the amount of modified protein recovered by the resin. The values in the
“% fluorescence” column of Table 1 were calculated in the following manner:
Using the fluorescent images of the gels in Figure S3 as an example,
% fluorescence = 100*(sum of fluorescence in elution lanes)/(sum of fluorescence in all lanes)
The fluorescence in each lane was quantified using ImageJ 1.34s, an image processing
and analysis program available free from the NIH website
(http://rsb.info.nih.gov/ij/download.html).
Unb
ound
Fra
ctio
n
H2O
was
hes
Elu
tion
with
A
da-C
O2H
Unb
ound
Fra
ctio
n
H2O
was
hes
Elu
tion
with
A
da-C
O2H
H2O
was
hes
Unb
ound
Fra
ctio
n
H2O
was
hes
Elu
tion
with
A
da-C
O2H
Unb
ound
Fra
ctio
n
H2O
was
hes
Elu
tion
with
A
da-C
O2H
H2O
was
hes
Unb
ound
Fra
ctio
n
H2O
was
hes
Elu
tion
with
A
da-C
O2H
Unb
ound
Fra
ctio
n
H2O
was
hes
Elu
tion
with
A
da-C
O2H
Unb
ound
Fra
ctio
n
H2O
was
hes
Elu
tion
with
A
da-C
O2H
H2O
was
hes
Unb
ound
Fra
ctio
n
H2O
was
hes
Elu
tion
with
A
da-C
O2H
H2O
was
hes
Unb
ound
Fra
ctio
n
H2O
was
hes
Elu
tion
with
A
da-C
O2H
Unb
ound
Fra
ctio
n
H2O
was
hes
Elu
tion
with
A
da-C
O2H
Unb
ound
Fra
ctio
n
H2O
was
hes
Elu
tion
with
A
da-C
O2H
H2O
was
hes
Unb
ound
Fra
ctio
n
H2O
was
hes
Elu
tion
with
A
da-C
O2H
H2O
was
hes
a) b)
c) d)
S9
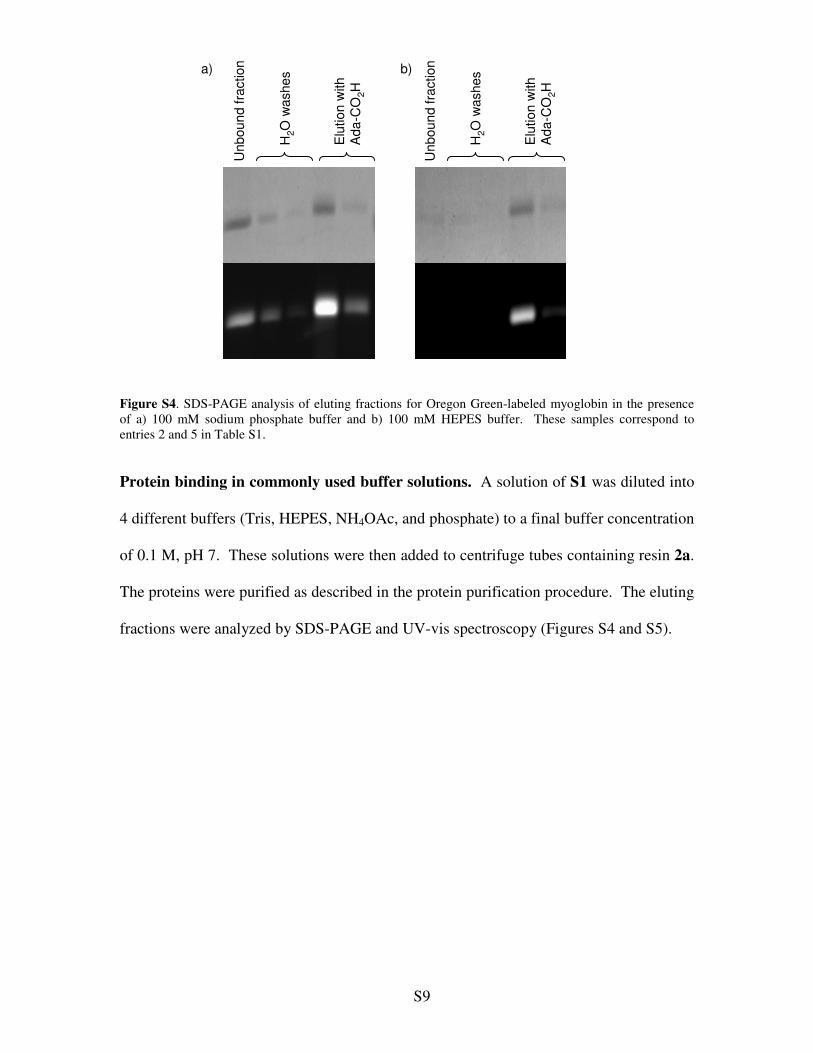
Figure S4. SDS-PAGE analysis of eluting fractions for Oregon Green-labeled myoglobin in the presence of a) 100 mM sodium phosphate buffer and b) 100 mM HEPES buffer. These samples correspond to entries 2 and 5 in Table S1.
Protein binding in commonly used buffer solutions. A solution of S1 was diluted into
4 different buffers (Tris, HEPES, NH4OAc, and phosphate) to a final buffer concentration
of 0.1 M, pH 7. These solutions were then added to centrifuge tubes containing resin 2a.
The proteins were purified as described in the protein purification procedure. The eluting
fractions were analyzed by SDS-PAGE and UV-vis spectroscopy (Figures S4 and S5).
Unb
ound
frac
tion
H2O
was
hes
Elu
tion
with
A
da-C
O2H
Unb
ound
frac
tion
H2O
was
hes
Elu
tion
with
A
da-C
O2H
a) b)

S10
Figure S5. UV-vis spectra of Oregon Green-labeled myoglobin binding to resin 2a in commonly used buffers (each 0.1 M, pH 7) a) sodium phosphate b) NH4OAc c) Tris d) HEPES.
Adamantane effects on protein binding. Resin 2a (71.4 mg) was suspended in 500 µL
of 10 mM adamantane carboxylic acid/100 mM NH4Cl pH 7 and then agitated for 15 min
by a laboratory mixer. The solution was transferred to separate microspin columns and
spun dry. A solution of S1 (250 µL) was diluted to 1 mL and added to the respective
resin in a centrifuge tube. The heterogeneous solution was mixed for 5 min. Afterwards,
the solution was transferred to microspin column and spun dry. The eluent was analyzed
by UV-vis spectroscopy. The resin was then washed with 500 µL H2O (2x). The
collected washes were analyzed by UV-vis spectroscopy. A final wash was performed
with 500 µL 10 mM adamantane carboxylic acid/100 mM NH4Cl (2x). The collected
washes were also analyzed by UV-vis spectroscopy (Figure S6).
0
0.2
0.4
0.6
0.8
1
1.2
250 350 450 550 650
Wavelength (nm)
Abs
orba
nce
0
0.2
0.4
0.6
0.8
1
1.2
250 350 450 550 650
Wavelength (nm)
Abs
orba
nce
Labeled myoglobin in sodium phosphatePhosphate flowthrough
Ada-CO2H/NH4Cl washWater wash
Labeled myoglobin in sodium phosphatePhosphate flowthrough
Ada-CO2H/NH4Cl washWater wash
0
0.2
0.4
0.6
0.8
1
1.2
250 350 450 550 650
Wavelength (nm)
Abs
orba
nce
0
0.2
0.4
0.6
0.8
1
1.2
250 350 450 550 650
Wavelength (nm)
Abs
orba
nce
0
0.2
0.4
0.6
0.8
1
1.2
250 350 450 550 650
Wavelength (nm)
Ab
sorb
ance
0
0.2
0.4
0.6
0.8
1
1.2
250 350 450 550 650
Wavelength (nm)
Ab
sorb
ance
0
0.2
0.4
0.6
0.8
1
1.2
250 350 450 550 650
Wavelength (nm)
Ab
sorb
ance
0
0.2
0.4
0.6
0.8
1
1.2
250 350 450 550 650
Wavelength (nm)
Ab
sorb
ance
Labeled myoglobin in NH4OAcNH4OAc flowthrough
Ada-CO2H/NH4Cl washWater wash
Labeled myoglobin in NH4OAcNH4OAc flowthrough
Ada-CO2H/NH4Cl washWater wash
Labeled myoglobin in TrisTris flowthrough
Ada-CO2H/NH4Cl washWater wash
Labeled myoglobin in TrisTris flowthrough
Ada-CO2H/NH4Cl washWater wash
Labeled myoglobin in HEPESHEPES flowthrough
Ada-CO2H/NH4Cl washWater wash
Labeled myoglobin in HEPESHEPES flowthrough
Ada-CO2H/NH4Cl washWater wash
a) b)
c) d)

S11
Figure S6. UV-vis spectra of S1 exposed to resin 2a pre-washed with 10 mM adamantane carboxylic acid/100 mM NH4Cl pH 7 solution. MALDI-TOF MS analysis of the resin. To resin 2a (33.2 mg), 50 µL of myoglobin
conjugate 4 and 250 µL of H2O were added. After mixing for 5 min, the heterogeneous
solution was spun dry in a microspin column. The resin was then washed with 500 µL of
H2O and a small portion of the dry resin was cocrystallized with sinapinic acid on a
MALDI plate for analysis. The remaining resin was washed with 500 µL of 10 mM
adamante carboxylic acid/100 mM NH4Cl pH 7 buffer. The aqueous fractions were then
analyzed by MALDI-TOF MS (Figure S7).
0
0.2
0.4
0.6
0.8
1
1.2
1.4
1.6
1.8
2
200 250 300 350 400 450 500 550 600 650Wavelength (nm)
Abs
orba
nce
Myoglobin solutionCD modified resin flow throughWater washesAdaCO2H/NH4Cl washes
0
0.2
0.4
0.6
0.8
1
1.2
1.4
1.6
1.8
2
200 250 300 350 400 450 500 550 600 650Wavelength (nm)
Abs
orba
nce
Myoglobin solutionCD modified resin flow throughWater washesAdaCO2H/NH4Cl washes
Myoglobin solutionCD modified resin flow throughWater washesAdaCO2H/NH4Cl washes

S12
Figure S7. MALDI-TOF spectrum of a) Oregon Green labeled myoglobin b) aqueous flow through solution c) cyclodextrin modified sepharose resin after exposing to a solution of Oregon Green labeled myoglobin d) the eluting solution from the 10 mM adamantane carboxylic acid/100 mM NH4Cl pH 7 wash Procedure for enrichment of modified trypsin digest fragments. 50 mL of a solution
of myoglobin conjugate 6 (1 mg/mL) was combined with 50 �L of acetonitrile. DTT was
added to the resulting solution to a final concentration of 10 mM. The protein was
denatured at 65 ºC for 1 h. The denatured protein solution was diluted by the addition of
0.45 mL of 50 mM NH4HCO3, pH 7.8. Trypsin (Promega Sequencing Grade) was then
added to the myoglobin solution in a 1:100 (w/w) ratio. After 5 hours of incubation at 37
ºC, the proteolysis solution was lyophilized overnight. The peptide mixture was
dissolved in 200 µL of water and divided into two 100 µL portions. To one portion was
added 5 mg of dry resin 2a. The heterogeneous mixture was agitated for 5 min before
being transferred to an empty MicroSpinTM (Amersham) column and centrifuged at
14,500 rpm for 30 s. The dry resin, which appeared brown due to the capture of modified
peptides, was washed twice with 200 �L aliquots of H2O. The resin was then washed
with one 100 �L aliquot of 10 mM adamantane carboxylic acid, 100 mM NH4Cl, pH 7.
���������� ����� ����� ����� ��������� ��
���������
�����
�������� ��������
���� ������
����� ����� ����� ����� ����� ��������� ��
��������� �� ��
�����
����� ����� ����� ����� ����� ��������� ��
��������� �����
������
�����������
����� ����� ����� ����� ����� ��������� ��
���������
�����
������
�����
�������� ��
�����
���������� ����� ����� ����� ��������� ��
���������
�����
�������� ��������
���� ������
����� ����� ����� ����� ��������� ��
���������
�����
�������� ��������
���� ������
����� ����� ����� ����� ����� ��������� ��
��������� �� ��
�����
����� ����� ����� ����� ����� ��������� ��
��������� �� ��
�����
����� ����� ����� ����� ����� ��������� ��
��������� �����
������
�����������
����� ����� ����� ����� ����� ��������� ��
��������� �����
������
�����������
����� ����� ����� ����� ����� ��������� ��
���������
�����
������
�����
�������� ��
�����
����� ����� ����� ����� ����� ��������� ��
���������
�����
������
�����
�������� ��
�����

S13
The brown color was transferred from the resin to the solution. Aliquots from before and
after the resin capture procedure were both analyzed by LC-ESI MS (Figures S8).
Figure S8. LC-MS analysis of modified trypsin fragments from digestion of TAMRA modified myoglobin: amass spectrum of trypsin fragments before resin capture. Starred masses represent unmodifed trypsin digest fragments. bmass spectrum of trypsin fragments after elution from 2a with adamantane-CO2
- solution. Modified N-terminal fragment (GLSDGEWQQVLNVWGK) expected m/2 = 1115.5.
Before resin capture
After resin capture
a)
700 900 1100 1300m/z, amu
1115.3b)
700 800 900 1000 1100 1200 1300 1400m/z, amu
1115.3
*
*
*
* *
**
*
*
*
*
Before resin capture
After resin capture
a)
700 900 1100 1300m/z, amu
1115.3b)
700 800 900 1000 1100 1200 1300 1400m/z, amu
1115.3
*
*
*
* *
**
*
*
*
*

S14
Activity assay of resin captured chymotrypsinogen. After a typical resin capture
procedure was performed on chymotrypsinogen modified with 5, the eluted fractions
were assayed for chymotryptic activity. 20 uL of the released protein was treated with
2.9 uL of a 0.4 mg/mL trypsin solution in 50 mM acetic acid. The activation of the
zymogen was allowed to proceed for 10 min at room temperature before the addition of
80 uL of 0.5 mM chymotrypsin substrate I, colorometric (Suc-GGF-pNA, Calbiochem
230912) in 50 mM Tris, 20 mM CaCl2 buffer, pH 7.6. The hydrolysis of p-nitroaniline
from the tripeptide substrate occurred at room temperature for 30 min. The progress of
the hydrolysis reaction was followed by monitoring the absorbance at 390 nm (Figure
S9).
0
0.2
0.4
0.6
0.8
1
1.2
1.4
300 400 500 600 700Wavelength (nm)
before resin captureafter resin capturep-nitroanilineChymo FITC unactivated
Abs
orb
ance
Figure S9. Normalized spectra for chymotrypsin activity assay. Absorbance at 380 nm indicates the hydrolysis of p-nitroaniline from the assay substrate. The intact assay substrate has an absorbance maximum at 305 nm. Chymotrypsin shows similar levels of activity before (blue) and after (pink) resin capture.

S15
Additional figures.
Figure S10. Complete recovery of unmodified myoglobin was obtained in the supernatant after exposure to resin 2a, confirming that the protein does not bind in the absence of the fluorescent label.
Figure S11. UV/vis spectra of modified protein resin capture: starting mixture (blue), flow through (green), water washes of resin (orange), elution with 10 mM adamantane carboxylic acid, 100 mM NH4Cl, pH 7 (red). (a) Chymotrypsinogen modified with FITC. (b) Subtilisn Carlsberg modified with Oregon Green-succinimidyl ester. 1 Laemmli, U. K. Nature 1970, 227, 680.
300 400 500 600 700Wavelength (nm)
Abs
orba
nce
a)b)
300 400 500 600Wavelength (nm)
700
Abs
orba
nce
300 400 500 600 700Wavelength (nm)
Abs
orba
nce
a)b)
300 400 500 600Wavelength (nm)
700
Abs
orba
nce
0
0.2
0.4
0.6
0.8
1
1.2
1.4
1.6
1.8
200 250 300 350 400 450 500 550Wavelength (nm)
Abs
orb
ance
Myoglobin solutionMyoglobin solution after exposing to CD modified resin
0
0.2
0.4
0.6
0.8
1
1.2
1.4
1.6
1.8
200 250 300 350 400 450 500 550Wavelength (nm)
Abs
orb
ance
Myoglobin solutionMyoglobin solution after exposing to CD modified resin
Myoglobin solutionMyoglobin solution after exposing to CD modified resin