amtek auto: analysis of financial statements · 2019-10-24 · amtek auto: analysis of financial...
TRANSCRIPT

PREVIEW
Amtek Auto: Analysis of Financial Statements
Case
Author: Varun Dawar
Online Pub Date: May 08, 2017 | Original Pub. Date: 2017
Subject: Financial Statement Analysis, Corporate Finance
Level: Basic | Type: Indirect case | Length: 2738 words
Copyright: © Varun Dawar 2018
Organization: Amtek Auto | Organization size: Large
Region: Southern Asia | State:
Industry: Manufacture of basic metals
Originally Published in:
Publisher: SAGE Publications: SAGE Business Cases Originals
DOI: http://dx.doi.org/10.4135/9781526427205 | Online ISBN: 9781526427205

PREVIEW
© Varun Dawar 2018
This case was prepared for inclusion in SAGE Business Cases primarily as a basis for classroom discussion or self-study, and is not meant to illustrate either effective or ineffective management styles. Nothing herein shall be deemed to be an endorsement of any kind. This case is for scholarly, educational, or personal use only within your university, and cannot be forwarded outside the university or used for other commercial purposes. 2019 SAGE Publications Ltd. All Rights Reserved.
This content may only be distributed for use within CQ PRESS. http://dx.doi.org/10.4135/9781526427205
SAGE© Varun Dawar 2018
SAGE Business Cases
Page 2 of 13Amtek Auto: Analysis of Financial Statements
PREVIEW
Abstract
Rajesh Vyas, a financial advisor at a brokerage firm in Mumbai, is tasked with assessing the financial performance and future of Amtek Auto, an integrated automotive component manufac-turer headquartered in New Delhi, India. Recently, Amtek Auto had defaulted on its INR 800 crore worth of bond payment to its lenders on account of its inability to refinance maturity oblig-ations. As instructed by his reporting manager, Rajesh was required to evaluate the financial position of the firm on the basis of information embedded in current financial statements (income statement, balance sheet, and cash flows) so as to enable his firm’s clients to devise a rationale for their investment decisions with regards to their existing holdings in Amtek Auto. The case assesses the usefulness of financial ratio analysis in assessing various aspects of a firm’s per-formance, including liquidity, profitability, working capital, capital structure, efficiency, and return on investment, to inform investor options.
Case
Learning Outcomes
By the end of this case study, students should be able to:
• understand the significance of various types of financial ratios used to assess financial risk profiles; • discuss and calculate liquidity and working capital ratios, profitability ratios, capital structure ratios,
and return on investment ratios; • evaluate the overall financial position of a firm using trend analysis to devise a rationale for future
investment decision making.
Introduction
December 30, 2015 was a late evening for Rajesh Vyas, a financial advisor at one of the prominent brokerage firms operating out of the Bandra Kurla Complex, Mumbai. Rajesh was examining the latest financial infor-mation from Amtek Auto Limited (Amtek Auto), an integrated automotive component manufacturer headquar-tered in New Delhi, India. Some of his firm’s clients held equity shares in Amtek Auto and had approached Rajesh’s reporting manager for future investment advice on the company. Rajesh was instructed by his man-ager to evaluate the financial position of the firm to enable his firm’s clients to make rational investment deci-sions with regards to their holdings in Amtek Auto.
On September 20, 2015, Amtek Auto had defaulted on the INR 800 crore worth of bond payment to its lenders on account of its inability to refinance maturity obligations (Nair & Adajania, 2015). This incident represented one of the biggest corporate bond defaults in years wherein debt and equity lenders were caught completely unaware that the company faced significant deterioration in its financial position. For a company like Amtek, which was one of the largest integrated automotive component manufacturers in India with a strong global presence, bond payment default had come as a rude jolt. From a high of INR 156 per share in July 2015, Amtek’s stock declined to INR 45 per share in October 2015, resulting in an equity market value of just under INR 10,000 million.
To enable his firm’s clients to decide whether their investments in Amtek were justified, Rajesh decided to con-duct a close scrutiny of the financial statements (income statement, balance sheet and cash flow). He knew
SAGE© Varun Dawar 2018
SAGE Business Cases
Page 3 of 13Amtek Auto: Analysis of Financial Statements
PREVIEW
that equity investors used the information contained in financial statements (profit and loss account, balance sheet, and cash flow) to assess the future earnings and cash flows generation ability of a firm, while lenders used it to assess the creditworthiness or debt paying capacity. In either case, Rajesh knew it was important to understand and interpret the large amount of data that these financial statements contained. He planned to assess the underlying weakness in profitability and status of Amtek’s various financial parameters for the preceding years to develop a rationale for investors. However, such an analysis required an understanding of various aspects of the firm’s performance, including its liquidity, profitability, working capital, capital structure, and financial risk. Before Rajesh could move on to conduct the financial evaluation of Amtek Auto, he needed to find the best way to carry out a financial risk assessment of Amtek Auto in light of the company’s current fi-nancial statements. What would be the basis for calculating and deciphering various financial ratios including trend and impact analysis? Would this financial assessment provide useful insights for his clients to develop rationales for their investment decisions?
Indian Automotive Component Industry
The Indian automotive component industry, estimated to be around USD 38 billion (ACMA, 2015–16) in terms of turnover (includes sales to original equipment manufacturers, aftermarket sales, and exports), has grown tremendously over the past decade on the back of increased indigenization/localization and attractiveness of India as a preferable designing and manufacturing base. According to the Auto Components Manufacturing Association of India (ACMA), India’s auto component industry was expected to see a compounded annual growth rate (CAGR) of 14% over 2013–2021 (ACMA, 2015–16). With the growing demand and scale of auto-motive components in India, manufacturers had been able to keep the costs 10–25% lower relative to oper-ations in Europe and Latin America. This cost savings and annual growth had been possible because of the availability of a large pool of skilled and semi-skilled workers and low input costs (India being the third largest steel producer globally) (Mazumdar, 2016). According to ACMA (2015–16a), the Indian automotive compo-nent industry can be primarily divided into six major segments:
a. engine parts; b. driver transmission and steering parts; c. electrical parts; d. equipment; e. suspension and braking parts; and f. body and chassis.
Of the above segments, engine and driver transmission parts constituted almost 50% of the total auto com-ponent industry production followed by suspension and braking parts (12%), body and chassis (12%), equip-ment (10%), and electrical parts (9%)
In terms of performance, in the financial year 2014–2015, the Indian automotive component industry regis-tered a growth of 11% in turnover compared to the previous year. A major contributor to this growth had been the export of auto components to various countries, such as Europe, North America, Africa, and Latin Ameri-ca. As a result of low-cost manufacturing advantages, technologically advanced products, and the substantial depreciation of the rupee over the last few years, India’s export of auto components had witnessed an im-pressive growth. According to the IBEF (India Brand Equity Foundation), the Indian automotive components industry was expected to record a turnover of US$ 115 billion by the financial year 2021, at which time exports would comprise approximately US$30 billion (IBEF, 2015).
Amtek Auto
Amtek Auto, incorporated in 1985, rose to become one of the largest integrated automotive component man-
SAGE© Varun Dawar 2018
SAGE Business Cases
Page 4 of 13Amtek Auto: Analysis of Financial Statements
PREVIEW
ufacturers in India with a strong global presence across Europe and North America.
With significant expertise in forging, grey and ductile iron casting, gravity and high-pressure aluminum die casting, and machining and sub-assembly, the company manufactured products such as connecting rod assemblies, flywheel ring gears and assembly, steering knuckles, crankshaft assemblies, and torque links (NDTV profit, n.d.). Besides this, Amtek Auto also catered to the demand (domestic and exports) for non-au-to sectors such as the railways, specialty vehicles, aerospace, agricultural, and heavy earth moving equip-ment (Business Standard, n.d.). Amtek Auto had been a key beneficiary of expansion of global OEMs (orig-inal equipment manufacturers) in India on account of its significant investment in capacity and acquisitions over the last few years to achieve scale. In terms of group structure, Amtek Auto’s promoters hold a stake of 48.98% in Amtek Auto, the flagship company. Within domestic subsidiaries, the company holds a 71.2% stake in Amtek India, 64.8% in Ahmednagar Forgings, and 71.7% in JMT Auto. In terms of overseas subsidiaries, the company holds 100% in Tekfor (as a part of Amtek global technologies) and Kuepper (engaged in iron castings for turbocharger housings) (see Figure 1).
Figure 1: Amtek Auto Group structure.
SAGE© Varun Dawar 2018
SAGE Business Cases
Page 5 of 13Amtek Auto: Analysis of Financial Statements
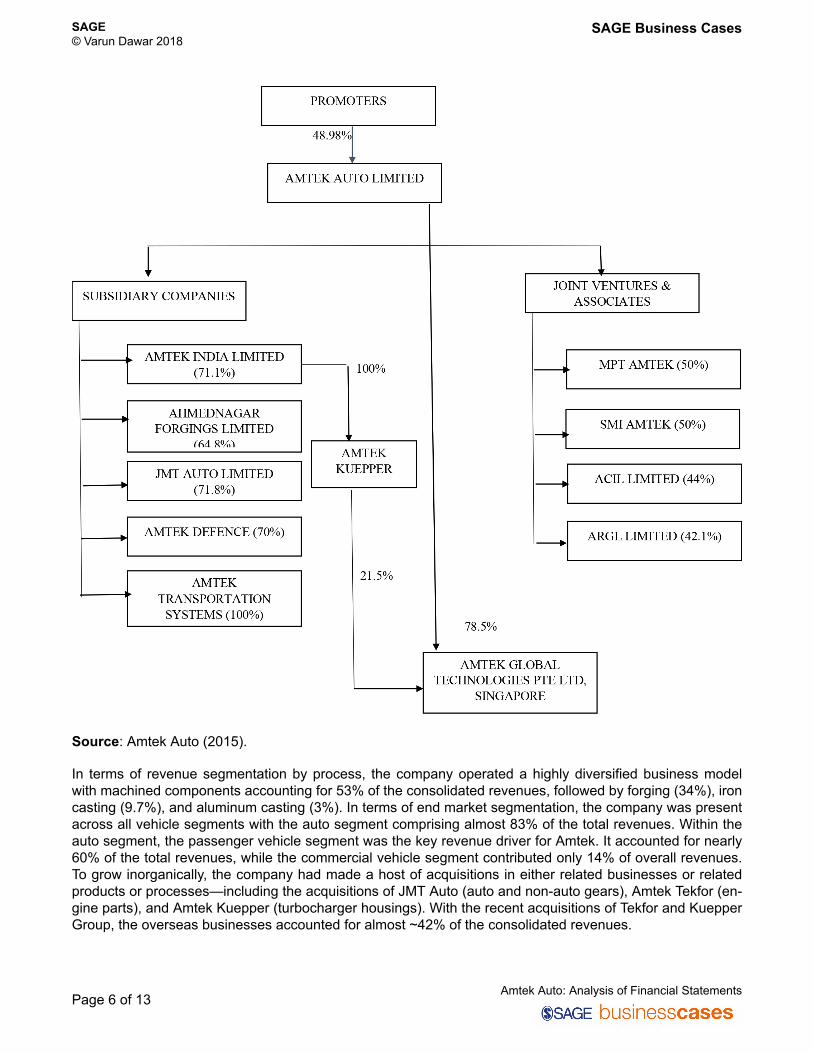
PREVIEWSource: Amtek Auto (2015).
In terms of revenue segmentation by process, the company operated a highly diversified business model with machined components accounting for 53% of the consolidated revenues, followed by forging (34%), iron casting (9.7%), and aluminum casting (3%). In terms of end market segmentation, the company was present across all vehicle segments with the auto segment comprising almost 83% of the total revenues. Within the auto segment, the passenger vehicle segment was the key revenue driver for Amtek. It accounted for nearly 60% of the total revenues, while the commercial vehicle segment contributed only 14% of overall revenues. To grow inorganically, the company had made a host of acquisitions in either related businesses or related products or processes—including the acquisitions of JMT Auto (auto and non-auto gears), Amtek Tekfor (en-gine parts), and Amtek Kuepper (turbocharger housings). With the recent acquisitions of Tekfor and Kuepper Group, the overseas businesses accounted for almost ~42% of the consolidated revenues.
SAGE© Varun Dawar 2018
SAGE Business Cases
Page 6 of 13Amtek Auto: Analysis of Financial Statements

PREVIEW
Financial Performance and Management Outlook
To understand the current state of financial affairs at Amtek Auto and the management outlook for the future, Rajesh examined excerpts from the “Director’s Report” and “Management Discussion and Analysis” sections of the Amtek Auto annual report 2014–15 (Amtek Auto, 2015). For the 2014–2015 financial year, aggregate sales of Amtek Auto registered a decline of 5.6% compared to 27% growth in the previous financial year of 2013–2014. On account of declining revenues (due to subdued performance of global economy) and rising expenditures (due to increase in raw material cost), the company recorded a loss of INR 1,157 million in the 2014–2015 year, compared to a profit of INR 3,234 million in the previous 2013–2014 year. Due to losses in-curred, the company did not recommend any dividend on the equity shares for the 2014–2015 financial year.
During 2014–2015, the company acquired German-based Scholz Edelstahl GmbH through its 100% Singa-pore-based subsidiary Amtek Precision Engineering Pte. Ltd. The acquisition of Scholz—a company that also engaged in the special steel trading business—enabled backward integration with all of Amtek Group’s in-ternational business. Through its overseas subsidiary, Amtek also acquired various companies engaged in iron casting, forging, and machining from Japan-based Asahi Tec Corporation. The acquired companies had various manufacturing facilities located in Japan, Thailand, and China that had long standing relationships with the blue chip OEM. The objective of the above acquisitions were to increase access to state of the art technologies, growth markets, new customers, and several strategic cross selling opportunities. Besides this, the expansion through acquisitions was supposed to bring backward integration and realise key financial syn-ergies benefits.
Looking ahead, the management forecasted an increasing demand from overseas subsidiaries for products that were manufactured only at Amtek’s India-based facilities, including for camshafts, crankshafts, cylinder blocks, and cast turbo charger housing. The management believed that the cross selling opportunities were substantial and expected to yield benefits in the near term. Further, the acquisitions overseas provided Amtek Auto with access to state of the art technologies, growth markets, new customers, and several strategic cross selling opportunities.
Data for Financial Analysis
Rajesh decided to conduct the financial ratio analysis of Amtek Auto by using the audited financial statements (profit and loss statement and balance sheet) of the company for the previous four years (see Tables 1 and 2).
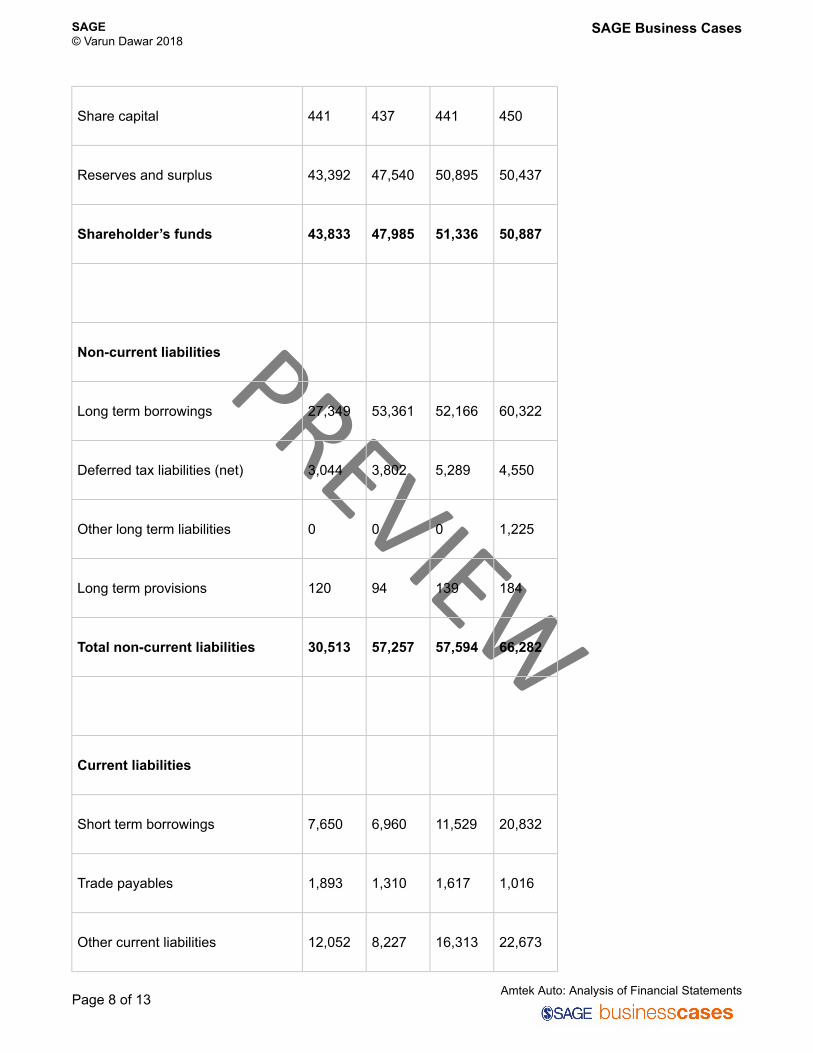
Table 1 : Amtek Auto Balance Sheet
Amtek Auto Ltd. Balance Sheet
(in INR-Million)
FY 2012 FY 2013 FY 2014 FY 2015
Equity and liabilities
SAGE© Varun Dawar 2018
SAGE Business Cases
Page 7 of 13Amtek Auto: Analysis of Financial Statements
PREVIEW
Share capital 441 437 441 450
Reserves and surplus 43,392 47,540 50,895 50,437
Shareholder’s funds 43,833 47,985 51,336 50,887
Non-current liabilities
Long term borrowings 27,349 53,361 52,166 60,322
Deferred tax liabilities (net) 3,044 3,802 5,289 4,550
Other long term liabilities 0 0 0 1,225
Long term provisions 120 94 139 184
Total non-current liabilities 30,513 57,257 57,594 66,282
Current liabilities
Short term borrowings 7,650 6,960 11,529 20,832
Trade payables 1,893 1,310 1,617 1,016
Other current liabilities 12,052 8,227 16,313 22,673
SAGE© Varun Dawar 2018
SAGE Business Cases
Page 8 of 13Amtek Auto: Analysis of Financial Statements
PREVIEW
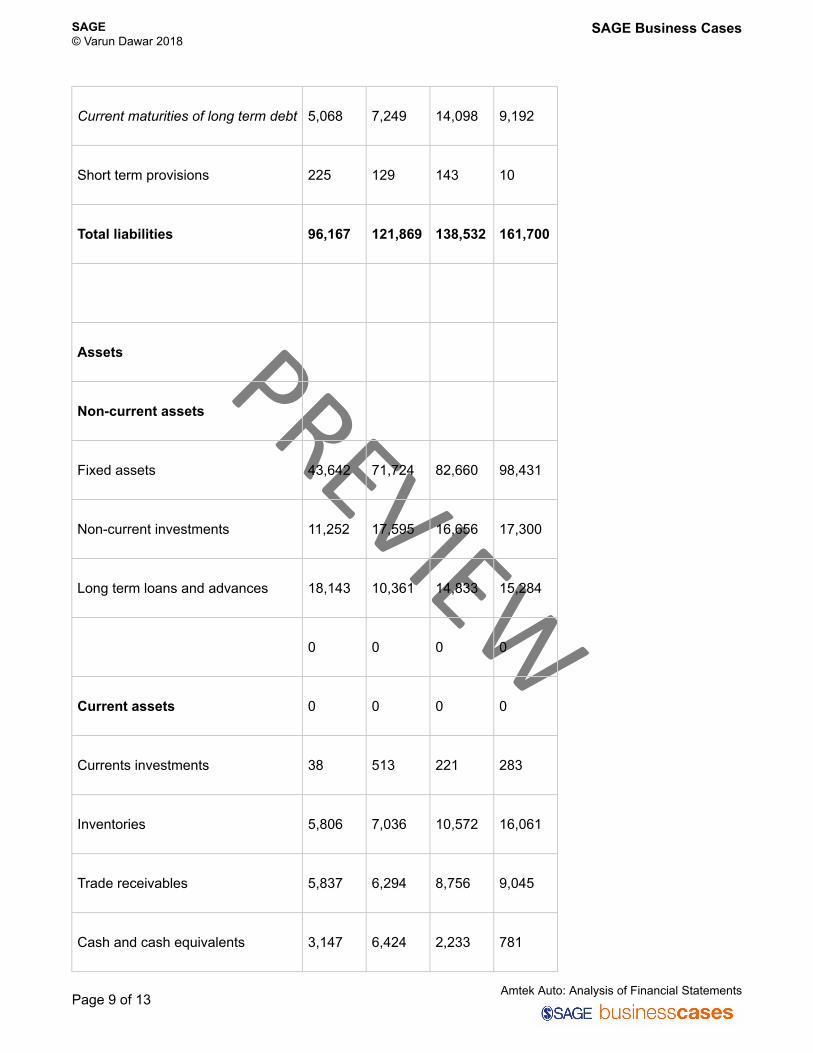
Current maturities of long term debt 5,068 7,249 14,098 9,192
Short term provisions 225 129 143 10
Total liabilities 96,167 121,869 138,532 161,700
Assets
Non-current assets
Fixed assets 43,642 71,724 82,660 98,431
Non-current investments 11,252 17,595 16,656 17,300
Long term loans and advances 18,143 10,361 14,833 15,284
0 0 0 0
Current assets 0 0 0 0
Currents investments 38 513 221 283
Inventories 5,806 7,036 10,572 16,061
Trade receivables 5,837 6,294 8,756 9,045
Cash and cash equivalents 3,147 6,424 2,233 781
SAGE© Varun Dawar 2018
SAGE Business Cases
Page 9 of 13Amtek Auto: Analysis of Financial Statements
PREVIEW
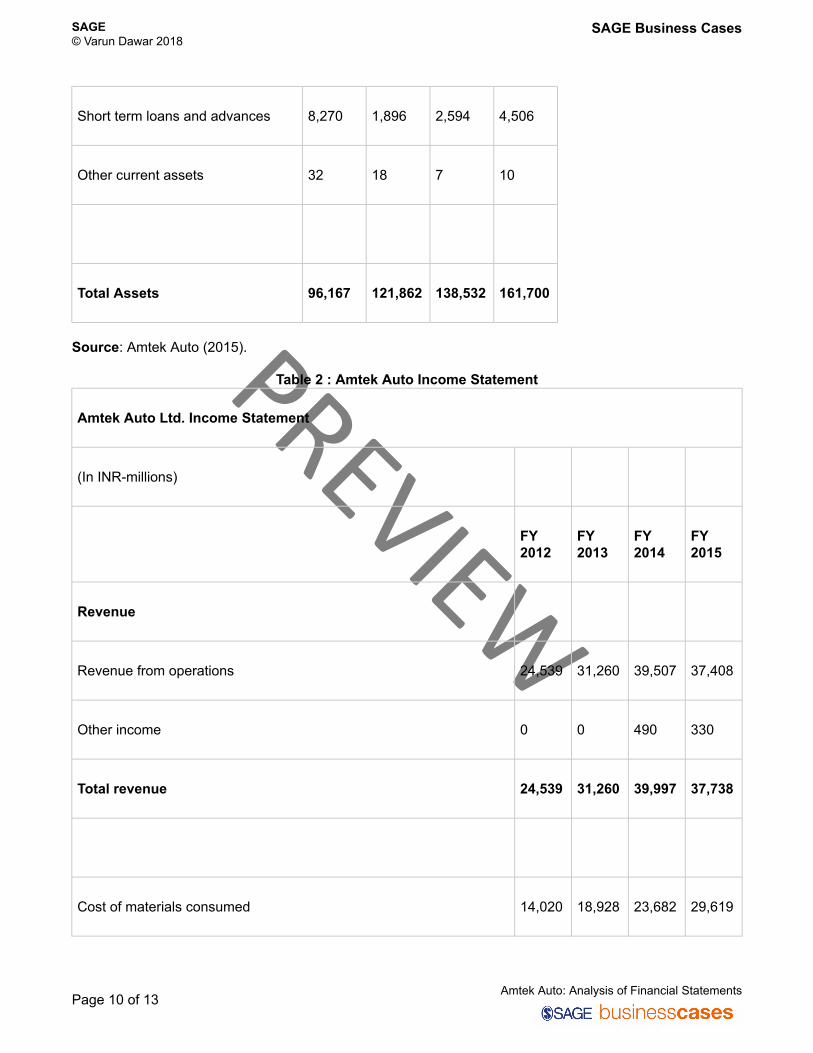
Short term loans and advances 8,270 1,896 2,594 4,506
Other current assets 32 18 7 10
Total Assets 96,167 121,862 138,532 161,700
Source: Amtek Auto (2015).
Table 2 : Amtek Auto Income Statement
Amtek Auto Ltd. Income Statement
(In INR-millions)
FY 2012
FY 2013
FY 2014
FY 2015
Revenue
Revenue from operations 24,539 31,260 39,507 37,408
Other income 0 0 490 330
Total revenue 24,539 31,260 39,997 37,738
Cost of materials consumed 14,020 18,928 23,682 29,619
SAGE© Varun Dawar 2018
SAGE Business Cases
Page 10 of 13Amtek Auto: Analysis of Financial Statements
PREVIEW
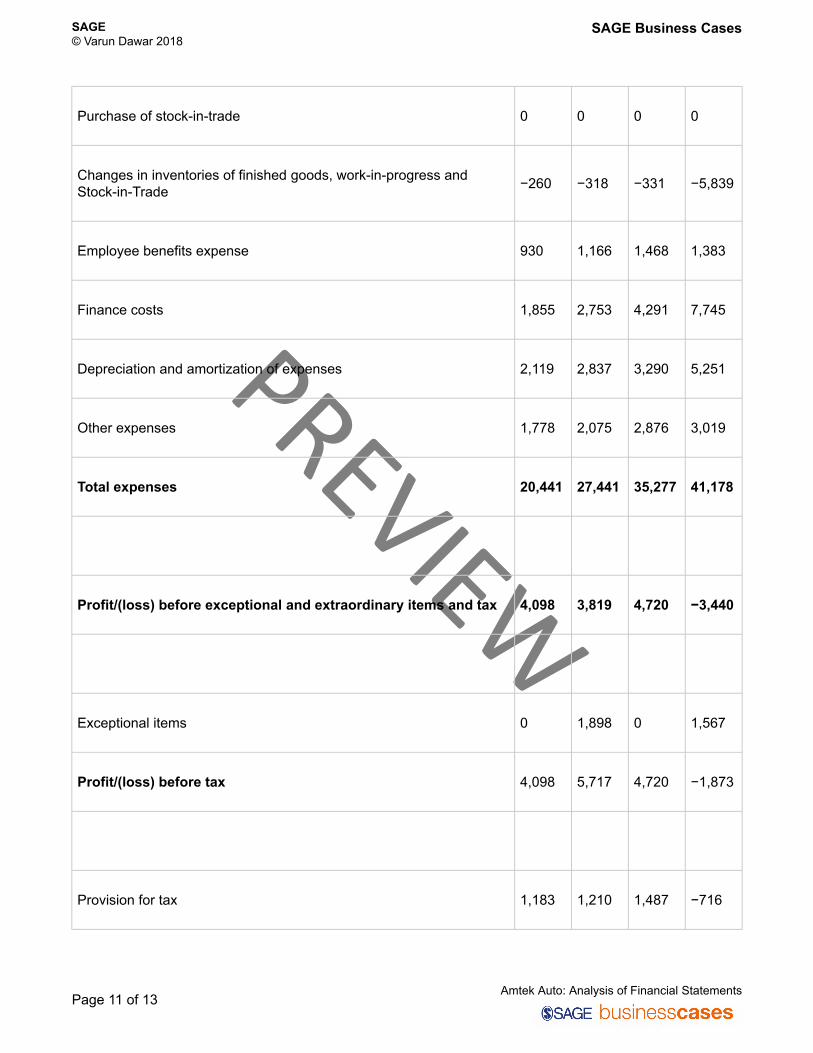
Purchase of stock-in-trade 0 0 0 0
Changes in inventories of finished goods, work-in-progress and Stock-in-Trade
−260 −318 −331 −5,839
Employee benefits expense 930 1,166 1,468 1,383
Finance costs 1,855 2,753 4,291 7,745
Depreciation and amortization of expenses 2,119 2,837 3,290 5,251
Other expenses 1,778 2,075 2,876 3,019
Total expenses 20,441 27,441 35,277 41,178
Profit/(loss) before exceptional and extraordinary items and tax 4,098 3,819 4,720 −3,440
Exceptional items 0 1,898 0 1,567
Profit/(loss) before tax 4,098 5,717 4,720 −1,873
Provision for tax 1,183 1,210 1,487 −716
SAGE© Varun Dawar 2018
SAGE Business Cases
Page 11 of 13Amtek Auto: Analysis of Financial Statements
PREVIEW
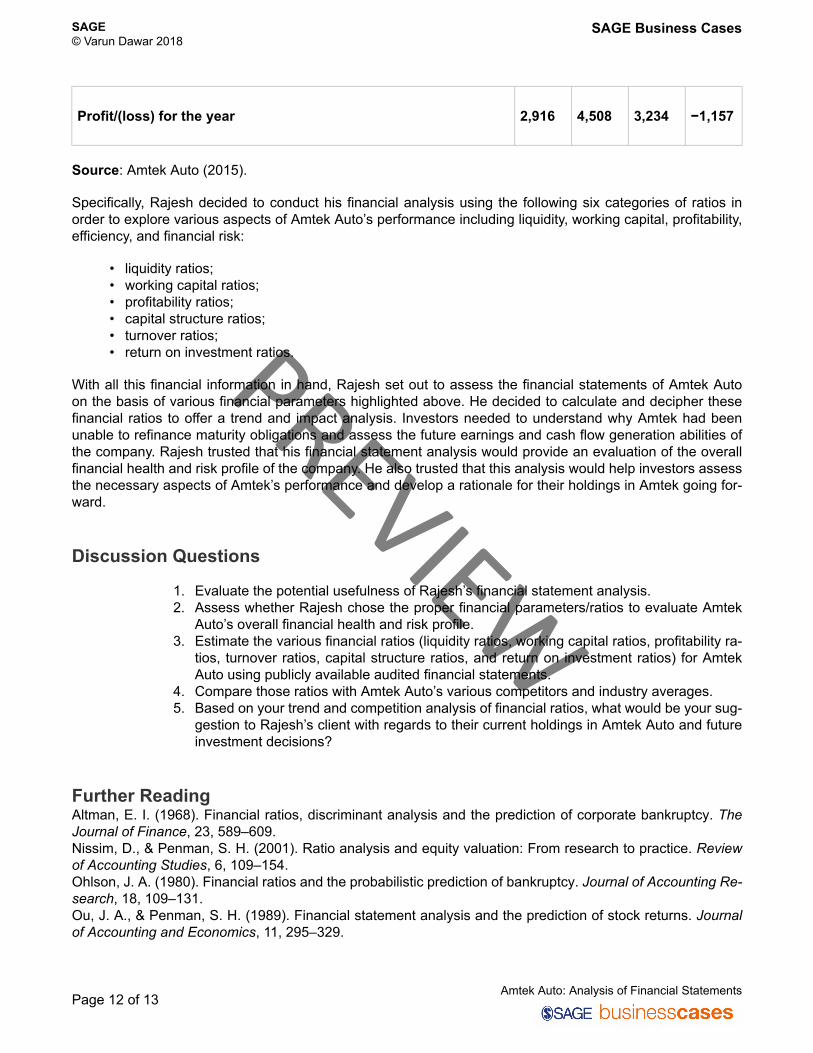
Profit/(loss) for the year 2,916 4,508 3,234 −1,157
Source: Amtek Auto (2015).
Specifically, Rajesh decided to conduct his financial analysis using the following six categories of ratios in order to explore various aspects of Amtek Auto’s performance including liquidity, working capital, profitability, efficiency, and financial risk:
• liquidity ratios; • working capital ratios; • profitability ratios; • capital structure ratios; • turnover ratios; • return on investment ratios.
With all this financial information in hand, Rajesh set out to assess the financial statements of Amtek Auto on the basis of various financial parameters highlighted above. He decided to calculate and decipher these financial ratios to offer a trend and impact analysis. Investors needed to understand why Amtek had been unable to refinance maturity obligations and assess the future earnings and cash flow generation abilities of the company. Rajesh trusted that his financial statement analysis would provide an evaluation of the overall financial health and risk profile of the company. He also trusted that this analysis would help investors assess the necessary aspects of Amtek’s performance and develop a rationale for their holdings in Amtek going for-ward.
Discussion Questions
1. Evaluate the potential usefulness of Rajesh’s financial statement analysis. 2. Assess whether Rajesh chose the proper financial parameters/ratios to evaluate Amtek
Auto’s overall financial health and risk profile. 3. Estimate the various financial ratios (liquidity ratios, working capital ratios, profitability ra-
tios, turnover ratios, capital structure ratios, and return on investment ratios) for Amtek Auto using publicly available audited financial statements.
4. Compare those ratios with Amtek Auto’s various competitors and industry averages. 5. Based on your trend and competition analysis of financial ratios, what would be your sug-
gestion to Rajesh’s client with regards to their current holdings in Amtek Auto and future investment decisions?
Further Reading Altman, E. I. (1968). Financial ratios, discriminant analysis and the prediction of corporate bankruptcy. The Journal of Finance, 23, 589–609. Nissim, D., & Penman, S. H. (2001). Ratio analysis and equity valuation: From research to practice. Review of Accounting Studies, 6, 109–154. Ohlson, J. A. (1980). Financial ratios and the probabilistic prediction of bankruptcy. Journal of Accounting Re-search, 18, 109–131. Ou, J. A., & Penman, S. H. (1989). Financial statement analysis and the prediction of stock returns. Journal of Accounting and Economics, 11, 295–329.
SAGE© Varun Dawar 2018
SAGE Business Cases
Page 12 of 13Amtek Auto: Analysis of Financial Statements

PREVIEW
References ACMA. (2015–16). Industry statistics. Retrieved from http://www.acma.in/docmgr/ACMA_Industry_Data/In-dustry-Statistics.pdf ACMA. (2015–16a). ACMA presentation. Retrieved from http://www.acma.in/docmgr/ACMA_Presentation/ACMA_Presentation.pdf Amtek Auto. (2015). Amtek Auto annual report 2014–15. Retrieved from http://www.amtek.com/aal.php Business Standard. (n.d.) Amtek Auto Ltd. history. Retrieved from http://www.business-standard.com/compa-ny/amtek-auto-1255/information/company-history IBEF. (2015, August). Auto components. Retrieved from http://www.ibef.org/download/Auto_Components_-_August_2015.pdf Mazumdar, R. (2016, January 26). India emerges as third largest steel producer in the world. The Economic Times. Retrieved from http://economictimes.indiatimes.com/industry/indl-goods/svs/steel/india-emerges-as-third-largest-steel-producer-in-the-world/articleshow/50718627.cms Nair, V., & Adajania, K. E. (2015, September 22). Amtek Auto fails to meet bond redemption deadline. Live Mint. Retrieved from http://www.livemint.com/Companies/xLaYZudVbvOnIxBEtH1RKK/Amtek-Lenders-still-in-discussion-on-additional-funds-as-bon.html NDTV profit. (n.d.). Amtek Auto Ltd. history. Retrieved from http://profit.ndtv.com/stock/amtek-auto-ltd_amtekauto/reports http://dx.doi.org/10.4135/9781526427205
SAGE© Varun Dawar 2018
SAGE Business Cases
Page 13 of 13Amtek Auto: Analysis of Financial Statements