aluminium electrolytic capacitors - vsb.czhomen.vsb.cz/.../studijni_opory/appnotes_cap_bhc.pdf ·...
TRANSCRIPT
AluminiumElectrolytic
Capacitors
Application Notes

, now part of the Evox Rifa Group, is one
of Europe’s leading manufacturers of Large Can Aluminium
Capacitors. The Evox Rifa Group is a major global capacitor
manufacturer, offering a wide range of technologies and styles
from production facilities in Sweden, UK, Finland, China and
Singapore.
The ISO9001 approved BHC production plant at Weymouth in
the South of England has been successfully manufacturing
Aluminium Electrolytic Capacitors for the most demanding
applications since 1968.
BHC prides itself on its ability to provide a flexible design service
for unique customer requirements. The company has a history of
working alongside design teams, providing the exact solution to
a particular problem, and unrivalled support in the subsequent
application. BHC recognises that its success depends on the future
of its customers and sees itself not only as a supplier of
technologically superior products but as a partner, mutually
striving with our customers for competitive advantage.
The product development and customer service provided by
BHC is backed by a totally integrated, real time information
system that plays an important role in quality, design, and in all
phases of production from planning to control.
The control offered by the use of information systems over the
manufacturing process is only a part of the quality system that
pervades at every level. Quality is the responsibility of every
member of our team with the emphasis placed on “right first time”
and “continuous improvement”. Quality is the link that bonds us
to our customers. We are committed to not only satisfy customers’
current needs, but to improve and develop products in
anticipation of their future requirements.
In formal recognition of this BHC has achieved approval to BS EN
ISO 9001.
Manufacturing competitively priced products of the highest
quality is the cornerstone of our success. If you wish to share in
that success then contact us and see for yourself how we can
provide a solution to satisfy your needs without having to make
do with the closest standard available.
Introduction
This document contains five separate technical articles written to give the equipment designer detailed
information on the application of BHC Components aluminium electrolytic capacitors. It augments the
information already available within the standard product catalogue.
The technical support team at BHC Components are more than happy to offer any additional support that may
be required if the information cannot be found in these notes. To obtain a feasibility of a capacitor for a
particular application, the form at the back of the document should be completed, with as much information
as possible, and faxed to BHC Components.
Balancing Resistors for Voltage Sharing Use of balancing resistors to control the voltage sharing across
each aluminium electrolytic capacitor when they are
connected in series.
Reliability and Failure Rates Guidance on the reliability of the standard product ranges
manufactured by BHC Components Ltd and provide failure
rate data for use in reliability calculations.
Life Expectancy and Thermal Characteristics Explanation of the relationships between ESR, ripple current,
hot-spot temperature and life. Also provides data and
formulae to enable the calculation of life expectancy under
a variety of operating conditions.
Life Expectancy and Rated Ripple Current Details of life expectancy as related to ripple current.
Provides data to enable life expectancy to be calculated with
regard to operating voltage, temperature and ripple current. Flammability Characteristics Details of the tests undertaken by BHC Components with
regard to flammability on both the external and internal
construction of aluminium electrolytic capacitors.
2-4
5-6
7-28
29-41
42-44
Section Page
Balancing Resistors for Voltage Shararing
Introduction
When aluminium electrolytic capacitors are
connected in series it is advisable to use balancing
resistors in order to control the voltage sharing
across each device.
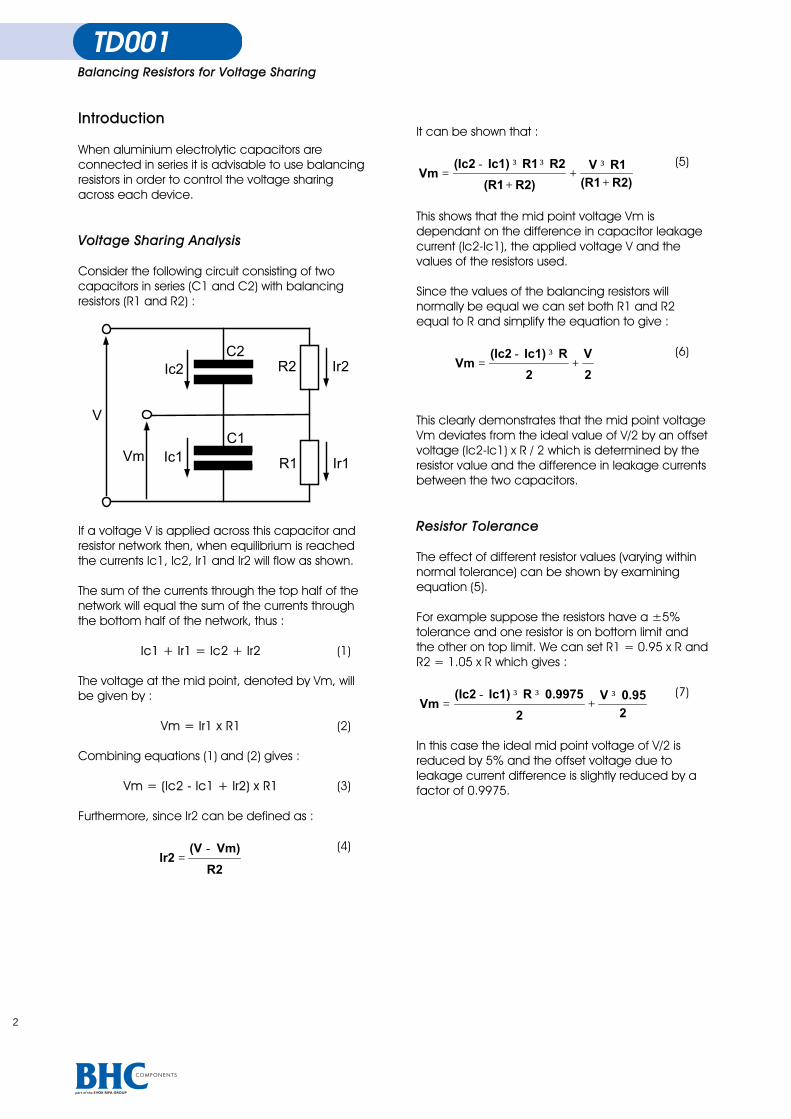
Voltage Sharing Analysis
Consider the following circuit consisting of two
capacitors in series (C1 and C2) with balancing
resistors (R1 and R2) :
C1
C2
R1
R2
Ic1
Ic2
Ir1
Ir2
Vm
V
If a voltage V is applied across this capacitor and
resistor network then, when equilibrium is reached
the currents Ic1, Ic2, Ir1 and Ir2 will flow as shown.
The sum of the currents through the top half of the
network will equal the sum of the currents through
the bottom half of the network, thus :
Ic1 + Ir1 =Ic1 + Ir1 = Ic2 +2 + Ir2 2 (1)
The voltage at the mid point, denoted by Vm, will
be given by :
Vm = I = Ir1 x R1 (2)
Combining equations (1) and (2) gives :
Vm = (Ic2 - Ic1 + Ir2) xVm = (Ic2 - Ic1 + Ir2) x R1 R1 (3)
Furthermore, since Ir2 can be defined as :
R2
Vm)(VIr2
-=
(4)
It can be shown that :
Vm(Ic2 Ic1) R1 R2
(R1 R2)
V R1
(R1 R2)=
- ³ ³
++
³+
(5)
This shows that the mid point voltage Vm is
dependant on the difference in capacitor leakage
current (Ic2-Ic1), the applied voltage V and the
values of the resistors used.
Since the values of the balancing resistors will
normally be equal we can set both R1 and R2
equal to R and simplify the equation to give :
Vm(Ic2 Ic1) R
2
V
2=
- ³+
(6)
This clearly demonstrates that the mid point voltage
Vm deviates from the ideal value of V/2 by an offset
voltage (Ic2-Ic1) x R / 2 which is determined by the
resistor value and the difference in leakage currents
between the two capacitors.
Resistor Tolerance
The effect of different resistor values (varying within
normal tolerance) can be shown by examining
equation (5).
For example suppose the resistors have a ±5%
tolerance and one resistor is on bottom limit and
the other on top limit. We can set R1 = 0.95 x R and
R2 = 1.05 x R which gives :
Vm(Ic2 Ic1) R 0.9975
2
V 0.95
2=
- ³ ³+
³ (7)
In this case the ideal mid point voltage of V/2 is
reduced by 5% and the offset voltage due to
leakage current difference is slightly reduced by a
factor of 0.9975.
2
Balancing Rlancing Resistors for Voltage Shararing
Choice of Resistor Value
Equation (6) can also be rearranged to determine
the value of balancing resistor necessary for a given
set of conditions, thus :
Ic1)(Ic2
V) Vm (2R
-
-³=
(8)
To calculate the maximum resistor value required,
set V to the value of applied voltage and set Vm
to the maximum acceptable mid point voltage,
usually the rated voltage of the capacitor.
The difference in leakage current (Ic2-Ic1) will
depend on the capacitor in use, the temperature
of operation and the eventual voltage that each
capacitor settles to.
If the capacitor leakage currents are measured at
an identical voltage then there will usually be some
difference between the values, one will be higher
than the other.
When placed in the circuit it is important to note
that initially the capacitor with the higher leakage
current will have a lower voltage across it. Since the
leakage current is proportional to the applied
voltage (the lower the voltage the lower the
leakage current), this capacitor will tend to settle to
a lower leakage current.
The opposite will be true for the capacitor with the
higher voltage across it. Since this will reduce the
difference between the leakage currents the mid
point voltage Vm will move closer to V/2.
For practical purposes the difference in leakage
currents at rated temperature can be estimated as :
mA 2000
VCr0.003 ³³
(9)
where Cr is the rated capacitance in µF, and V is
the applied voltage across the pair of capacitors.
The following table gives examples using this
approach.
Cap
µF
Rated
voltage
Ic2-Ic1
mA
V Vm R
3300 450 3.96 800 450 25 kW
2200 400 2.31 700 400 43 kW
470 400 0.53 750 400 95 kW
470 400 0.49 700 400 202 kW
1000 200 0.58 385 200 26 kW
2200 400 2.31 700 400 43 kW
3300 350 2.97 600 350 34 kW
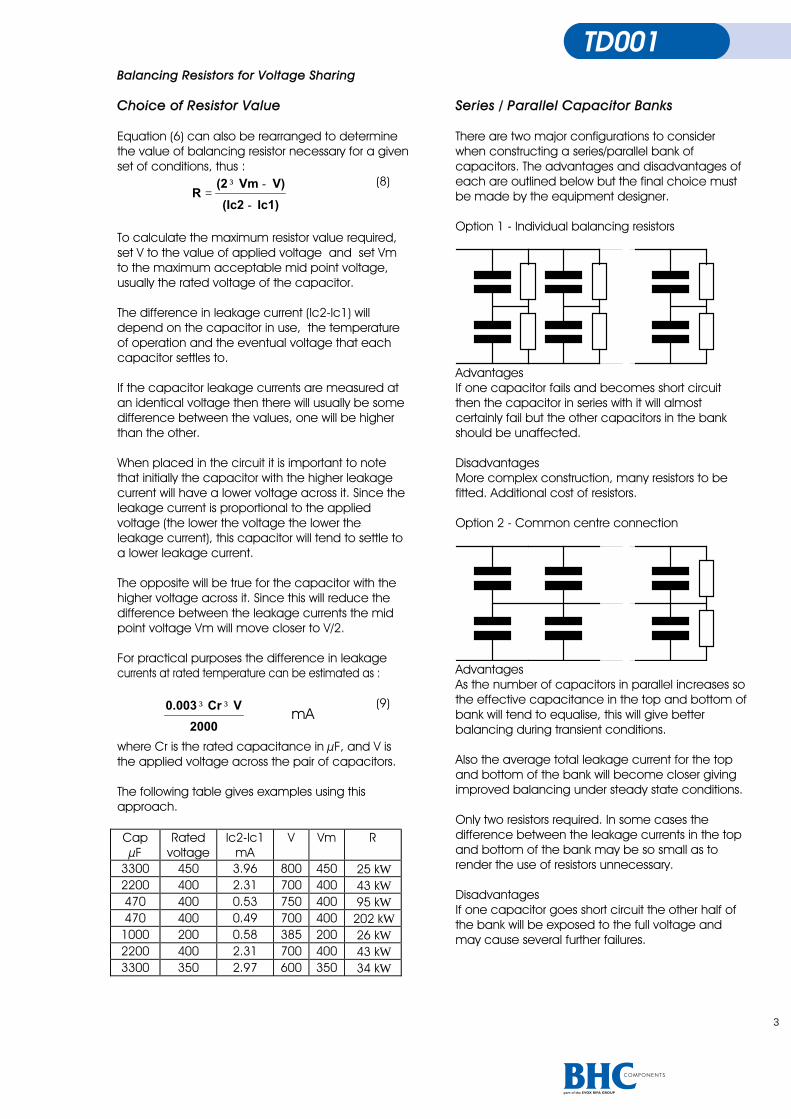
Series / Parallel Capacitor Banks
There are two major configurations to consider
when constructing a series/parallel bank of
capacitors. The advantages and disadvantages of
each are outlined below but the final choice must
be made by the equipment designer.
Option 1 - Individual balancing resistors
Advantages
If one capacitor fails and becomes short circuit
then the capacitor in series with it will almost
certainly fail but the other capacitors in the bank
should be unaffected.
Disadvantages
More complex construction, many resistors to be
fitted. Additional cost of resistors.
Option 2 - Common centre connection
Advantages
As the number of capacitors in parallel increases so
the effective capacitance in the top and bottom of
bank will tend to equalise, this will give better
balancing during transient conditions.
Also the average total leakage current for the top
and bottom of the bank will become closer giving
improved balancing under steady state conditions.
Only two resistors required. In some cases the
difference between the leakage currents in the top
and bottom of the bank may be so small as to
render the use of resistors unnecessary.
Disadvantages
If one capacitor goes short circuit the other half of
the bank will be exposed to the full voltage and
may cause several further failures.
Balancing Resistors for Voltage Sharing
Introduction
Voltage Sharing Analysis
Ic1 + Ir1 = Ic2 + Ir2
Vm = Ir1 x R1
Vm = (Ic2 - Ic1 + Ir2) x R1
Resistor Tolerance
3
Balancing Resistors for Voltage Shararing
Revision to TD001 : Balancing resistors for voltage sharing Leakage current difference
The article TD001 has been in use for many years
and over that period a few users have expressed
the opinion that the resistor values are sometimes
on the low side. This is on the safe side as far as
balancing is concerned but does lead to higher,
and possibly unnecessary levels of power dissipation
in the resistors.
The key factor in determining the resistor values is
the difference in leakage current between two
series connected capacitors. The equation (9) given
for this was based on analysis of empirical data and
as such is a good guide to the difference at the
same voltage - we still believe this to be the case.
However, the value required in equation (8), Ic2-Ic1,
represents the difference in leakage currents after
equilibrium has taken place - i.e. at different
voltavoltageses dependant on the final balancing voltage
In other words, we need to know the likely difference
in leakage currents for the same applied voltage
and then adjust this figure according to the level of
offset voltage after the circuit has settled. The final
voltage is unknown, we are trying to calculate it, but
we do know that the change of leakage current vs
voltage follows an exponential curve. So, for
example, a 5% increase in voltage will cause more
than a 5% increase in leakage current and vice
versa. This leads to a self balancing situation
whereby any voltage offset will reduce the leakage
current difference, which in turn reduces the voltage
offset.
For any two capacitors we have defined the max
leakage current difference as equation (9), the
minimum difference is clearly 0. It is impossible to
be precise but we believe that after settling the
difference in leakage current should at least halve
leading to a revised equation (9) as shown below.
Leakage current difference = 0.0015 x Cr x V / 0.0015 x Cr x V / 2000 mA. 2000 mA. Capacitors in banks
When capacitors are used in banks (series/parallel)
with a common centre connection the balancing
resistors can be adjusted in value to account for the
averaging effect on leakage current. In essence the
total leakage current difference between the top
and bottom banks of parallel capacitors will
determine the balance point. The more capacitors
placed in parallel the better the balancing since
individual leakage values become less critical.
For banks of capacitor used in this way we would
recommend using the following equation for the
leakage current difference :
Leakage current difference = 0.0015 x Cr x V / Cr x V / 2000 / Õn mA. n mA.
Where n is the number of capacitors in parallel.
4

Reliability and Faillity and Failure Ratesure Rates
Introduction
The purpose of this technical data sheet is to give
guidance on the reliability of the standard product
ranges manufactured by BHC Components Ltd by
providing failure rate data for use in reliability
calculations.
It is not the intention to describe the mechanisms
which contribute towards the failure of components
nor to discuss the mathematical theory of the
statistics and probability employed.
Many articles have been written on the subject of
reliability and these and other sources should be
consulted for further information.
Reliability
The reliability of a component can be defined as
the probability that it will perform satisfactorily under
a given set of conditions for a given length of time.
Since in practice it is impossible to predict with
absolute certainty how any individual component
will perform, we must utilise probability theory. It is
also necessary to clearly define the level of stress
involved (e.g. operating voltage, ripple current and
temperature) and the duration of time involved.
Finally, the meaning of satisfactory performance
must be defined by specifying a set of conditions
which determine the end of life of the component.
Reliability as a function of time, R(t), is normally
expressed as :
R(t) = e-lt (1)
where R(t) is the probability that the component will
perform satisfactorily for time t, and l is the failure
rate.
Failure Rate
The failure rate is the number of components failing
per unit time. The failure rate of most electronic
components follows a characteristic pattern as
shown in figure 1.
Region (a) is the early failure period, sometimes
called infant mortality, these failures are removed
during the manufacturing process.
Region (b) is the operational or service life, this
period is characterised by an essentially constant
failure rate.
Region (c) is the wearout period and is
characterised by a rapidly increasing failure rate.
The failure rate is normally specified in failures per
hour, e.g. 1 failure per 1 million hours can be stated
as :
1 x 10⁻⁶ failures per hour or 0.1 % per 1000 Hours.
Assessment of Failure Rates
Many years of routine endurance testing have
generated millions of component test hours. Most of
these tests are carried out at rated temperature with
full rated voltage and ripple current applied.
Extensive analysis of this data has enabled failure
rates to be established for most product ranges. The
rates are given with a 60% confidence level and
the end of life definition is given below.
End of Life Definition
Catastrophic failure - short circuit, open circuit or
operation of the safety vent.
Parametric failure - capacitance change of more
than ±10%, leakage current greater than specified
limit or ESR increase of more than two times initial
value.
5
Reliablity and Failure rates
Failure Rate Values Voltage Derating
o = x Ku
MTBF = 1 /
Figure 2. Failure Rate vs Core Temperature l
Reliablity and Failure rates
Failure Rate Values
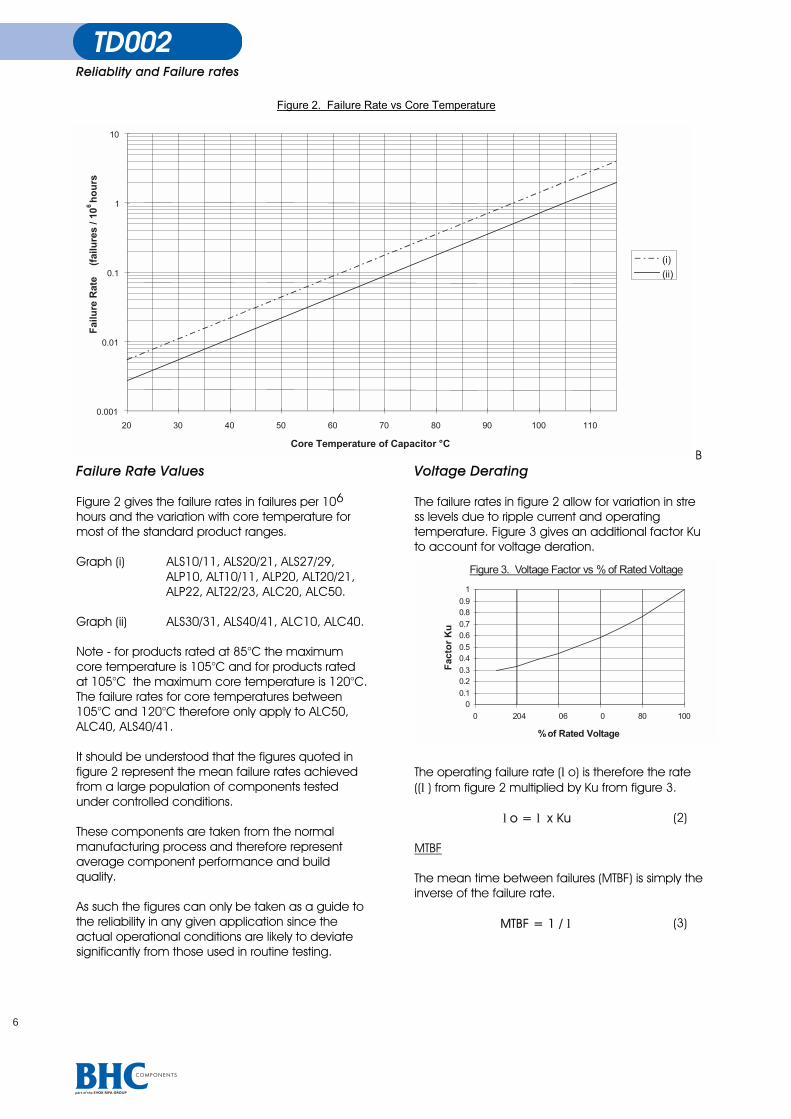
Figure 2 gives the failure rates in failures per 106
hours and the variation with core temperature for
most of the standard product ranges.
Graph (i) ALS10/11, ALS20/21, ALS27/29,
ALP10, ALT10/11, ALP20, ALT20/21,
ALP22, ALT22/23, ALC20, ALC50.
Graph (ii) ALS30/31, ALS40/41, ALC10, ALC40.
Note - for products rated at 85°C the maximum
core temperature is 105°C and for products rated
at 105°C the maximum core temperature is 120°C.
The failure rates for core temperatures between
105°C and 120°C therefore only apply to ALC50,
ALC40, ALS40/41.
It should be understood that the figures quoted in
figure 2 represent the mean failure rates achieved
from a large population of components tested
under controlled conditions.
These components are taken from the normal
manufacturing process and therefore represent
average component performance and build
quality.
As such the figures can only be taken as a guide to
the reliability in any given application since the
actual operational conditions are likely to deviate
significantly from those used in routine testing.
Voltage Derating
The failure rates in figure 2 allow for variation in stre
ss levels due to ripple current and operating
temperature. Figure 3 gives an additional factor Ku
to account for voltage deration.
The operating failure rate (lo) is therefore the rate
((l) from figure 2 multiplied by Ku from figure 3.
lo = o = l x Ku (2)
MTBF
The mean time between failures (MTBF) is simply the
inverse of the failure rate.
MTBMTBF = 1 / = 1 / l (3)
Core Temperature of Capacitor C
l
B
Figure 3. Voltage Factor vs % of Rated Voltage
0
0.1
0.2
0.3
0.4
0.5
0.6
0.7
0.8
0.9
1
0 20 40 60 80 100
% of Rated Voltage
Fa
cto
r K
u
6

Life Expectancy and Thermal Chararacacteristics
Introduction
This technical data sheet gives details of the thermal
properties and life expectancy of aluminium
electrolytic capacitors. The relationships between esr,
ripple current, hot-spot temperature and life are
explained, and the data and formulae included will
enable the calculation of the life expectancy under a
variety of operating conditions.
A further technical data sheet, TD004, is also available
which gives details of life expectancy related to the
rated ripple current.
A key aspect of life expectancy calculation is the core
temperature of the capacitor. It is essential to
determine this operating core temperature either by
calculation or by measurement.
In order to simplify matters BHC Components Ltd will
perform life expectancy calculations if full operating
conditions are provided.
Figure 1 gives an over view of the elements involved in
attempting to calculate the life expectancy for a
specific set of conditions.
The first stage is to obtain the operating conditions, i.e.
the ripple currents, voltage, temperature and thermal
conditions.
The thermal resistance from core to ambient is
calculated from factors given later in the article
related to the known conditions inside the equipment.
The esr and ripple current are then used together with
the thermal resistance value to calculate the core
temperature rise. The core temperature may also be
measured directly by means of an internal
thermocouple.
CONSTRUCTION
METHOD (physical style)
CALCULATE Rha
(Thermal resistance from
core to ambient)
THERMAL
CONDITIONS AND
AIRFLOW RATE
Rha
ESR VALUES (for each frequency at
core temperature)
CALCULATE Tr
(Core temperature rise)
APPLIED RIPPLE
CURRENTS (at each frequency)
RATED RIPPLE
CURRENT
Tr MEASURE Tr (internal thermocouple)
LIFE FACTORS (related to product
specification and size)
CALCULATE Le
(Life Expectancy)
AMBIENT
TEMPERATURE Ta
Le END OF LIFE
CRITERIA
RATED VOLTAGE Vr CALCULATE Kv
(Voltage factor)
APPLIED VOLTAGE
Vop
LIFE
EXPECTANCY
FIG 1
7
Life Expectancy and Thermal Chararacteristics
The calculated core temperature is particularly useful
in the early design stage in order to specify the
quantity and type of capacitor required. However,
measurement of the core temperature in the final
equipment provides a useful cross check and is
recommended for all high stress applications.
Finally, using the appropriate factors and end of life
criteria the life expectancy can be calculated. If
desired the effect of any voltage derating can also be
taken into account by multiplying by the voltage
factor.
NOTE - Data regarding the esr of capacitors at various
temperatures and frequencies is not included, but will
be furnished as required. Alternatively the relevant esr
values may be measured directly by the user at the
temperatures and frequencies of interest.
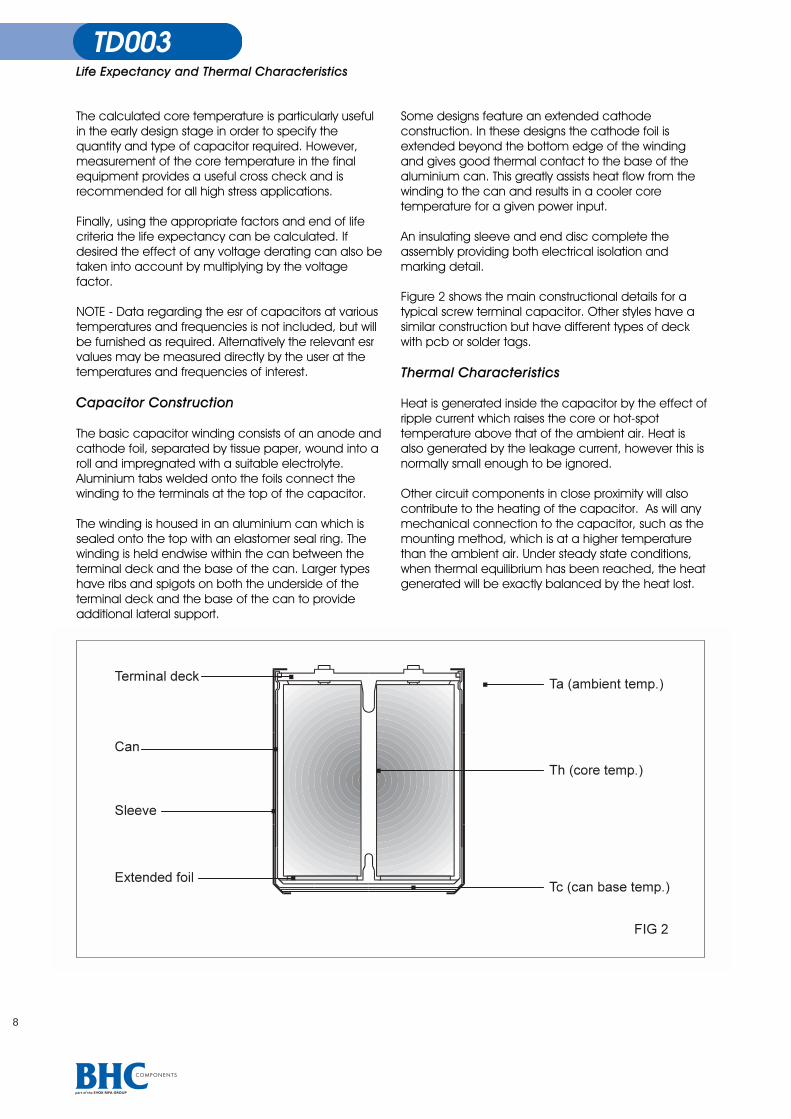
Capacitor Construction
The basic capacitor winding consists of an anode and
cathode foil, separated by tissue paper, wound into a
roll and impregnated with a suitable electrolyte.
Aluminium tabs welded onto the foils connect the
winding to the terminals at the top of the capacitor.
The winding is housed in an aluminium can which is
sealed onto the top with an elastomer seal ring. The
winding is held endwise within the can between the
terminal deck and the base of the can. Larger types
have ribs and spigots on both the underside of the
terminal deck and the base of the can to provide
additional lateral support.
Some designs feature an extended cathode
construction. In these designs the cathode foil is
extended beyond the bottom edge of the winding
and gives good thermal contact to the base of the
aluminium can. This greatly assists heat flow from the
winding to the can and results in a cooler core
temperature for a given power input.
An insulating sleeve and end disc complete the
assembly providing both electrical isolation and
marking detail.
Figure 2 shows the main constructional details for a
typical screw terminal capacitor. Other styles have a
similar construction but have different types of deck
with pcb or solder tags.
Thermal Characteristics
Heat is generated inside the capacitor by the effect of
ripple current which raises the core or hot-spot
temperature above that of the ambient air. Heat is
also generated by the leakage current, however this is
normally small enough to be ignored.
Other circuit components in close proximity will also
contribute to the heating of the capacitor. As will any
mechanical connection to the capacitor, such as the
mounting method, which is at a higher temperature
than the ambient air. Under steady state conditions,
when thermal equilibrium has been reached, the heat
generated will be exactly balanced by the heat lost.
8
Life Expectancy and Thermal Chararacacteristics
Transfer of heat from the winding to the case is mainly
by conduction. The extended foil ensures good
thermal contact of the winding to the base ribs of the
can, whilst the connecting tabs further aid heat flow
via the terminals.
Heat loss from the capacitor case is by convection,
conduction and radiation with the relative proportions
of each being dependant on the mounting method
and ambient conditions.
Radiated heat is governed by the temperature, area
and emissivity of the outer surface of the case. The
convected heat varies with case temperature and
area and can be considerably improved by the use of
forced air cooling.
The conducted heat depends on the mounting
method. Clamp or stud mounting to a suitable plate
or heat sink will give a useful improvement and the use
of heavy bus bars connected to the terminals will also
assist heat loss.
Thermal Equivalent Circuit
Taking into account all the heat transfer mechanisms
described above leads to a rather involved thermal
equivalent circuit for the capacitor, which is far too
complex for practical use.
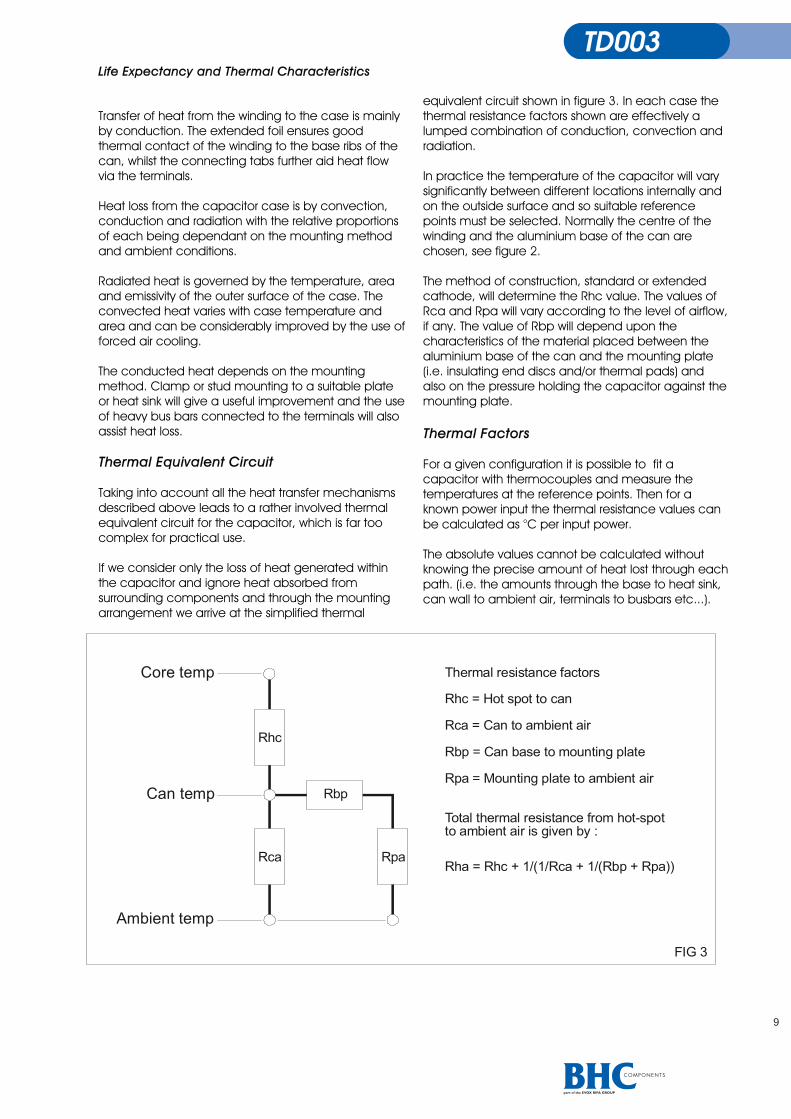
If we consider only the loss of heat generated within
the capacitor and ignore heat absorbed from
surrounding components and through the mounting
arrangement we arrive at the simplified thermal
equivalent circuit shown in figure 3. In each case the
thermal resistance factors shown are effectively a
lumped combination of conduction, convection and
radiation.
In practice the temperature of the capacitor will vary
significantly between different locations internally and
on the outside surface and so suitable reference
points must be selected. Normally the centre of the
winding and the aluminium base of the can are
chosen, see figure 2.
The method of construction, standard or extended
cathode, will determine the Rhc value. The values of
Rca and Rpa will vary according to the level of airflow,
if any. The value of Rbp will depend upon the
characteristics of the material placed between the
aluminium base of the can and the mounting plate
(i.e. insulating end discs and/or thermal pads) and
also on the pressure holding the capacitor against the
mounting plate.
Thermal Factors
For a given configuration it is possible to fit a
capacitor with thermocouples and measure the
temperatures at the reference points. Then for a
known power input the thermal resistance values can
be calculated as °C per input power.
The absolute values cannot be calculated without
knowing the precise amount of heat lost through each
path. (i.e. the amounts through the base to heat sink,
can wall to ambient air, terminals to busbars etc...).
Core temp
Can temp
Ambient temp
Rhc
Rca
Rbp
Rpa
Thermal resistance factors
Rhc = Hot spot to can
Rca = Can to ambient air
Rbp = Can base to mounting plate
Rpa = Mounting plate to ambient air
Total thermal resistance from hot-spotto ambient air is given by :
Rha = Rhc + 1/(1/Rca + 1/(Rbp + Rpa))
FIG 3
9

Life Expectancy and Thermal Characteristics
Although the individual thermal factors are very difficult
to determine exactly, it is very easy to measure the
core temperature and ambient temperature and
calculate the overall thermal resistance Rha.
Tables 1,2 and 3 show the Rha values for capacitors in
still air and for a selection of airflow rates
The values quoted are based on capacitors in air with
minimal conducted heat loss through electrical
connections and mounting.
ALS30/31 and ALS40/41 products all have extended
cathode construction.
Table 1 Thermal resistance values for ALS (screw terminal) products, no heat sink.
Dia Len Thermal resistance values Rha °C/W
mm mm <1m/s 1.0 m/s 1.5 m/s 2.0 m/s 2.5 m/s 3.0 m/s 3.5 m/s 4.0 m/s 4.5 m/s 5.0 m/s
36 49 11.2 9.91 9.23 8.68 8.27 7.95 7.69 7.50 7.39 7.34
36 52 10.7 9.47 8.82 8.29 7.90 7.60 7.35 7.17 7.06 7.01
36 62 9.57 8.47 7.89 7.42 7.06 6.79 6.57 6.41 6.32 6.27
36 75 8.53 7.55 7.03 6.61 6.30 6.06 5.86 5.72 5.63 5.59
36 82 8.12 7.19 6.69 6.29 5.99 5.77 5.58 5.44 5.36 5.32
36 105 7.09 6.27 5.84 5.49 5.23 5.03 4.87 4.75 4.68 4.64
36 115 6.77 5.99 5.58 5.25 5.00 4.81 4.65 4.54 4.47 4.43
51 62 7.56 6.69 6.23 5.86 5.58 5.37 5.19 5.07 4.99 4.95
51 75 6.5 5.75 5.36 5.04 4.80 4.62 4.47 4.36 4.29 4.26
51 82 6.06 5.36 4.99 4.70 4.47 4.30 4.16 4.06 4.00 3.97
51 105 5.09 4.50 4.19 3.94 3.76 3.61 3.50 3.41 3.36 3.33
51 115 4.79 4.24 3.95 3.71 3.54 3.40 3.29 3.21 3.16 3.14
51 140 4.3 3.81 3.54 3.33 3.17 3.05 2.95 2.88 2.84 2.82
66 67 5.2 4.60 4.28 4.03 3.84 3.69 3.57 3.48 3.43 3.41
66 75 4.75 4.20 3.91 3.68 3.51 3.37 3.26 3.18 3.14 3.11
66 82 4.4 3.89 3.63 3.41 3.25 3.12 3.02 2.95 2.90 2.88
66 98 3.84 3.40 3.16 2.98 2.83 2.73 2.64 2.57 2.53 2.52
66 105 3.64 3.22 3.00 2.82 2.69 2.58 2.50 2.44 2.40 2.38
66 115 3.4 3.01 2.80 2.64 2.51 2.41 2.34 2.28 2.24 2.23
66 140 3 2.66 2.47 2.33 2.21 2.13 2.06 2.01 1.98 1.97
73 115 2.97 2.63 2.45 2.30 2.19 2.11 2.04 1.99 1.96 1.95
77 67 4.3 3.81 3.54 3.33 3.17 3.05 2.95 2.88 2.84 2.82
77 75 3.94 3.49 3.25 3.05 2.91 2.80 2.71 2.64 2.60 2.58
77 82 3.65 3.23 3.01 2.83 2.69 2.59 2.51 2.45 2.41 2.39
77 98 3.16 2.80 2.60 2.45 2.33 2.24 2.17 2.12 2.09 2.07
77 105 3 2.66 2.47 2.33 2.21 2.13 2.06 2.01 1.98 1.97
77 115 2.79 2.47 2.30 2.16 2.06 1.98 1.92 1.87 1.84 1.83
77 140 2.38 2.11 1.96 1.84 1.76 1.69 1.64 1.59 1.57 1.56
77 146 2.29 2.03 1.89 1.77 1.69 1.63 1.57 1.53 1.51 1.50
77 180 1.9 1.68 1.57 1.47 1.40 1.35 1.31 1.27 1.25 1.24
77 220 1.4 1.24 1.15 1.09 1.03 0.99 0.96 0.94 0.92 0.92
91 67 3.5 3.10 2.88 2.71 2.58 2.49 2.40 2.35 2.31 2.29
91 75 3.2 2.83 2.64 2.48 2.36 2.27 2.20 2.14 2.11 2.10
91 98 2.55 2.26 2.10 1.98 1.88 1.81 1.75 1.71 1.68 1.67
91 146 1.85 1.64 1.52 1.43 1.37 1.31 1.27 1.24 1.22 1.21
91 180 1.55 1.37 1.28 1.20 1.14 1.10 1.06 1.04 1.02 1.02
91 220 1.2 1.06 0.99 0.93 0.89 0.85 0.82 0.80 0.79 0.79
10
Life Expectancy and Thermal Chararacacteristics
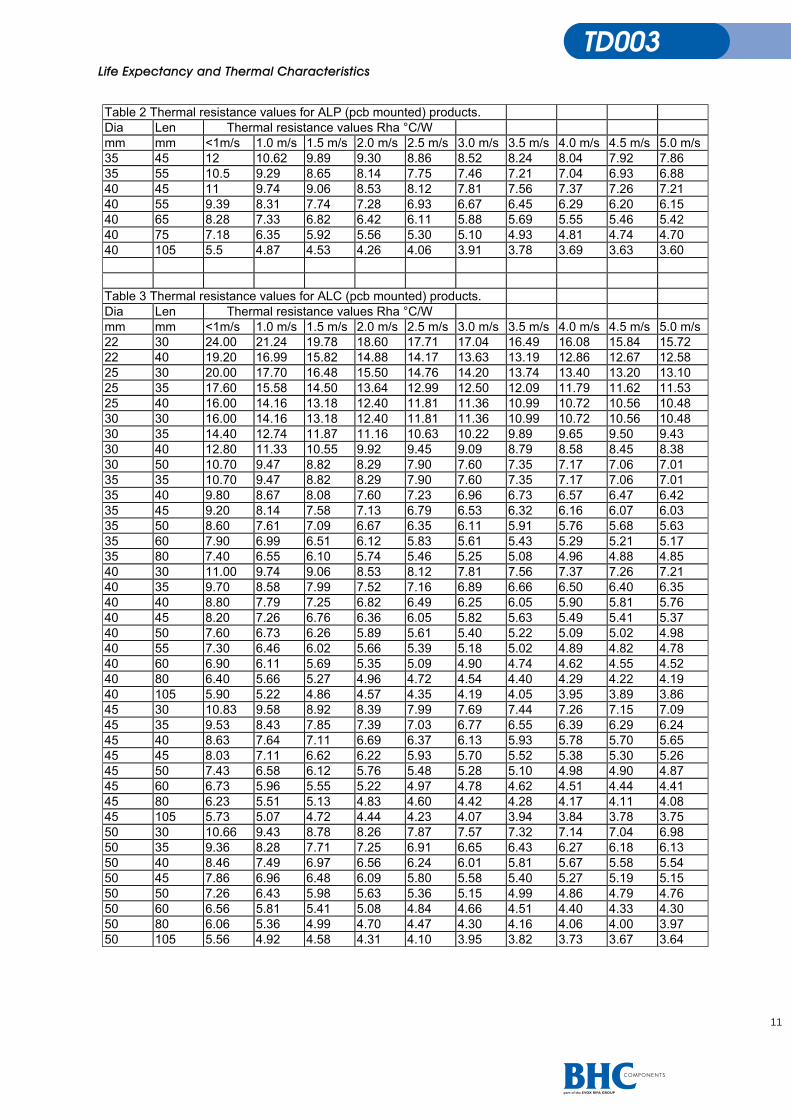
Table 2 Thermal resistance values for ALP (pcb mounted) products.
Dia Len Thermal resistance values Rha °C/W
mm mm <1m/s 1.0 m/s 1.5 m/s 2.0 m/s 2.5 m/s 3.0 m/s 3.5 m/s 4.0 m/s 4.5 m/s 5.0 m/s
35 45 12 10.62 9.89 9.30 8.86 8.52 8.24 8.04 7.92 7.86
35 55 10.5 9.29 8.65 8.14 7.75 7.46 7.21 7.04 6.93 6.88
40 45 11 9.74 9.06 8.53 8.12 7.81 7.56 7.37 7.26 7.21
40 55 9.39 8.31 7.74 7.28 6.93 6.67 6.45 6.29 6.20 6.15
40 65 8.28 7.33 6.82 6.42 6.11 5.88 5.69 5.55 5.46 5.42
40 75 7.18 6.35 5.92 5.56 5.30 5.10 4.93 4.81 4.74 4.70
40 105 5.5 4.87 4.53 4.26 4.06 3.91 3.78 3.69 3.63 3.60
Table 3 Thermal resistance values for ALC (pcb mounted) products.
Dia Len Thermal resistance values Rha °C/W
mm mm <1m/s 1.0 m/s 1.5 m/s 2.0 m/s 2.5 m/s 3.0 m/s 3.5 m/s 4.0 m/s 4.5 m/s 5.0 m/s
22 30 24.00 21.24 19.78 18.60 17.71 17.04 16.49 16.08 15.84 15.72
22 40 19.20 16.99 15.82 14.88 14.17 13.63 13.19 12.86 12.67 12.58
25 30 20.00 17.70 16.48 15.50 14.76 14.20 13.74 13.40 13.20 13.10
25 35 17.60 15.58 14.50 13.64 12.99 12.50 12.09 11.79 11.62 11.53
25 40 16.00 14.16 13.18 12.40 11.81 11.36 10.99 10.72 10.56 10.48
30 30 16.00 14.16 13.18 12.40 11.81 11.36 10.99 10.72 10.56 10.48
30 35 14.40 12.74 11.87 11.16 10.63 10.22 9.89 9.65 9.50 9.43
30 40 12.80 11.33 10.55 9.92 9.45 9.09 8.79 8.58 8.45 8.38
30 50 10.70 9.47 8.82 8.29 7.90 7.60 7.35 7.17 7.06 7.01
35 35 10.70 9.47 8.82 8.29 7.90 7.60 7.35 7.17 7.06 7.01
35 40 9.80 8.67 8.08 7.60 7.23 6.96 6.73 6.57 6.47 6.42
35 45 9.20 8.14 7.58 7.13 6.79 6.53 6.32 6.16 6.07 6.03
35 50 8.60 7.61 7.09 6.67 6.35 6.11 5.91 5.76 5.68 5.63
35 60 7.90 6.99 6.51 6.12 5.83 5.61 5.43 5.29 5.21 5.17
35 80 7.40 6.55 6.10 5.74 5.46 5.25 5.08 4.96 4.88 4.85
40 30 11.00 9.74 9.06 8.53 8.12 7.81 7.56 7.37 7.26 7.21
40 35 9.70 8.58 7.99 7.52 7.16 6.89 6.66 6.50 6.40 6.35
40 40 8.80 7.79 7.25 6.82 6.49 6.25 6.05 5.90 5.81 5.76
40 45 8.20 7.26 6.76 6.36 6.05 5.82 5.63 5.49 5.41 5.37
40 50 7.60 6.73 6.26 5.89 5.61 5.40 5.22 5.09 5.02 4.98
40 55 7.30 6.46 6.02 5.66 5.39 5.18 5.02 4.89 4.82 4.78
40 60 6.90 6.11 5.69 5.35 5.09 4.90 4.74 4.62 4.55 4.52
40 80 6.40 5.66 5.27 4.96 4.72 4.54 4.40 4.29 4.22 4.19
40 105 5.90 5.22 4.86 4.57 4.35 4.19 4.05 3.95 3.89 3.86
45 30 10.83 9.58 8.92 8.39 7.99 7.69 7.44 7.26 7.15 7.09
45 35 9.53 8.43 7.85 7.39 7.03 6.77 6.55 6.39 6.29 6.24
45 40 8.63 7.64 7.11 6.69 6.37 6.13 5.93 5.78 5.70 5.65
45 45 8.03 7.11 6.62 6.22 5.93 5.70 5.52 5.38 5.30 5.26
45 50 7.43 6.58 6.12 5.76 5.48 5.28 5.10 4.98 4.90 4.87
45 60 6.73 5.96 5.55 5.22 4.97 4.78 4.62 4.51 4.44 4.41
45 80 6.23 5.51 5.13 4.83 4.60 4.42 4.28 4.17 4.11 4.08
45 105 5.73 5.07 4.72 4.44 4.23 4.07 3.94 3.84 3.78 3.75
50 30 10.66 9.43 8.78 8.26 7.87 7.57 7.32 7.14 7.04 6.98
50 35 9.36 8.28 7.71 7.25 6.91 6.65 6.43 6.27 6.18 6.13
50 40 8.46 7.49 6.97 6.56 6.24 6.01 5.81 5.67 5.58 5.54
50 45 7.86 6.96 6.48 6.09 5.80 5.58 5.40 5.27 5.19 5.15
50 50 7.26 6.43 5.98 5.63 5.36 5.15 4.99 4.86 4.79 4.76
50 60 6.56 5.81 5.41 5.08 4.84 4.66 4.51 4.40 4.33 4.30
50 80 6.06 5.36 4.99 4.70 4.47 4.30 4.16 4.06 4.00 3.97
50 105 5.56 4.92 4.58 4.31 4.10 3.95 3.82 3.73 3.67 3.64
11
Life Expectancy and Thermal Characteristics
Heat Sinking
Substantial improvements in power dissipation can be
achieved by the use of heat sinking at the base of the
capacitor, particularly for designs with extended
cathode.
Table 4 shows some examples of the reduction in Rha
for extended cathode screw terminal capacitors
mounted on a heatsink with a thermal resistance of
0.3°/W.
Note that for condition (d) the aluminium can is in
direct contact with the heatsink and this gives the best
heat transfer but series connected capacitors
cannot then be used on the same heatsink.
(a) No heat sink
(b) With heat sink, standard end disc
(c) With heat sink, thermal end disk
(d) Directly on heat sink, no end disc
Table 4 Effect of heat sinking on Rha
Dia Len (a) (b) (c) (d)
77 105 3 2.34 1.89 1.86
77 146 2.29 1.5 1.1 1.05
Life Expectancy
During the life of the capacitor certain physical and
parametric changes occur. These changes eventually
render the capacitor unusable, either due to thermal
run-away leading to catastrophic failure, or excessive
parametric drift. At higher temperatures degradation
of encapsulation materials may accelerate these
effects.
The reasons behind these changes are many and
complex, and are beyond the scope of this article.
Also, some performance aspects cannot be
predicted and so evaluation of a product’s long term
behaviour must be determined by endurance
testing.
When ripple current is applied to a capacitor the most
important parameter in relation to the life expectancy
is the esr. The value of esr will slowly increase
throughout the life of the capacitor, leading to a
gradual increase in power loss and hence core
temperature rise.
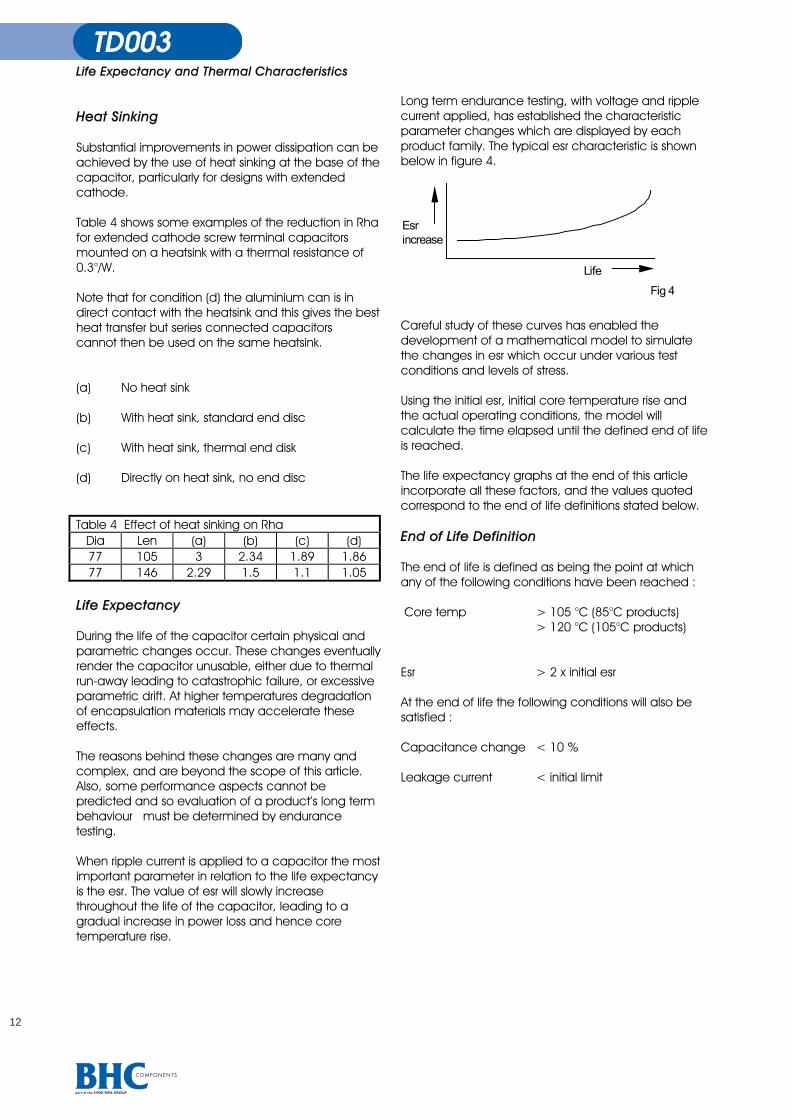
Long term endurance testing, with voltage and ripple
current applied, has established the characteristic
parameter changes which are displayed by each
product family. The typical esr characteristic is shown
below in figure 4.
Esr
increase
Life
Fig 4
Careful study of these curves has enabled the
development of a mathematical model to simulate
the changes in esr which occur under various test
conditions and levels of stress.
Using the initial esr, initial core temperature rise and
the actual operating conditions, the model will
calculate the time elapsed until the defined end of life
is reached.
The life expectancy graphs at the end of this article
incorporate all these factors, and the values quoted
correspond to the end of life definitions stated below.
End of Life Definition
The end of life is defined as being the point at which
any of the following conditions have been reached :
Core temp > 105 °C (85°C products)
> 120 °C (105°C products)
Esr > 2 x initial esr
At the end of life the following conditions will also be
satisfied :
Capacitance change < 10 %
Leakage current < initial limit
12

Life Expectancy and Thermal Chararacacteristics
Basic Formulae
CAPACITOR POWER LOSS
P = I2 x R Watts
I = applied ripple current (A rms)
R = initial typical esr at same frequency (Ohms)
For complex wave forms, sum the individual
power losses at each frequency to give the
total power loss.
i.e. Total power loss for n frequencies is :
P =I(1)2 x esr(1) + I(2)2 x esr(2) + ...
... + I(n)2 x esr(n) Watts
THERMAL RESISTANCE
Capacitor in air :
Rha = Rhc + (Ka x Rca)
Capacitor mounted on heat sink :
Rha = Rhc +1
(Ka x Rca)+
1
(Rbp + Ka x Rpa)
1
èêé
øúù
-
°C/Watt Rhc = thermal resistance of hot-spot to can
Rca = thermal resistance of can to ambient air
Rbp = thermal resistance of can base to mounting plate
Rpa = thermal resistance of mounting plate to ambient air
Ka = Airflow factor
Tables 1, 2 and 3 show calculated values of Rha for a
selection of airflow rates.
CORE TEMPERATURE RISE
Tr = Rha x P °C
CORE TEMPERATURE
Tc = Ta + Tr °C
Ta = ambient air temperature
LIFE EXPECTANCY
Life = Kv x Le (at Ta and Tr) Hours
Le=value from appropriate graph TD003
Kv = voltage deration factor (if used )
Calculation of Life Expectancy
In order to evaluate the life expectancy it is essential
to determine the core temperature accurately, there
are two basic methods :
MeMethod 1 - By calculation of core temper temperature
This method requires detailed knowledge of the
electrical and thermal properties of both the
capacitor and the application.
1 Obtain esr characteristics (esr v temp. and
frequency) by direct measurement or from BHC
Components Ltd.
2 Estimate the core temperature. An approximate
value is required at this stage in order to establish
an esr value.
3 Look up the esr value for the appropriate
temperature and ripple current frequency.
NOTE - Using the typical esr value the typical life will
be calculated, using the max esr the minimum life
will be calculated. The max esr can be taken as 1.2
x typical esr.
4 Calculate the power loss using equation.
5 Lookup the overall thermal resistance of the
capacitor Rha from tables 1, 2 and 3.
6 Calculate the core temperature rise using
equation.
7 Calculate the core temperature using equation.
8 If the calculated core temperature is very different
from the estimated value used initially then repeat
the calculations until the calculated core
temperature and that used in step 3 are similar.
9 Refer to the appropriate graph in TD003 to obtain
the life expectancy.
10 If the capacitor is being operated at a reduced
voltage multiply the life figure by the corresponding
factor Kv (refer to graph in TD003).
MeMethod 2 - By me measurement of core temper temperature
There are many occasions when the capacitor ripple
current cannot easily be defined, or when the thermal
conditions inside the equipment are unknown or too
difficult to specify clearly.
In these cases the accuracy of the calculated core
temperature may have an unacceptably high level of
uncertainty. Under these circumstances the direct
13
Life Expectancy and Thermal Characteristics
measurement of the capacitor core temperature is
recommended, and for this purpose BHC
Components Ltd can supply sample capacitors with
specially fitted internal thermocouples.
1 Using suitable capacitors fitted with thermocouples,
measure the actual core temperature during
operation.
2 Refer directly to the appropriate graph in TD003 to
obtain the life expectancy.
3 If the capacitor is being operated at a reduced
voltage multiply the life figure by the corresponding
factor Kv from the graph in TD003.
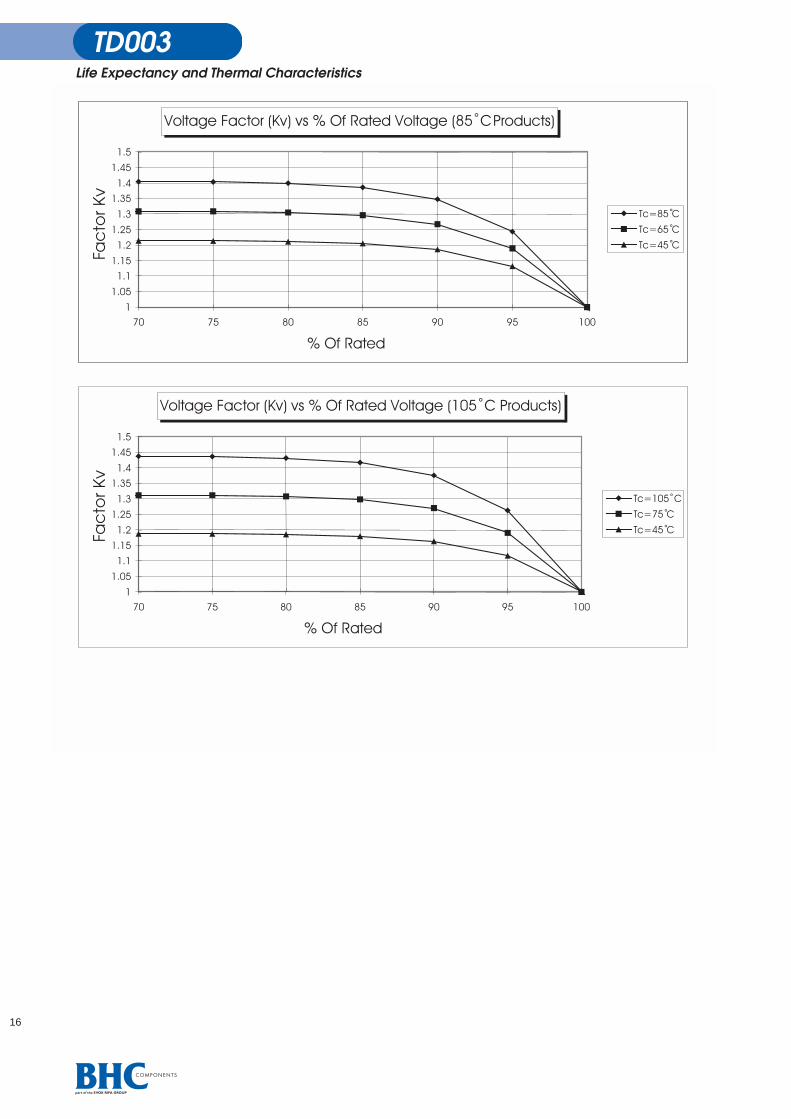
Voltage Derating
If capacitors are operated at a voltage below their
rated value then the reduced stress and lower
leakage current will give an improvement in the
service life.
Since leakage current increases with temperature the
benefit of a reduced operating voltage is more
pronounced at higher temperatures. The graphs in
TD003 show values of Kv for products with rated
temperatures of 85°C and 105°C.
Note - the operating voltage should be taken as the
mean d.c. value plus the peak a.c. ripple voltage.
Temperature Measurement of Capacitors
Using suitable samples install the capacitors inside the
equipment. Operate the equipment under the
conditions of interest and allow to stabilise. Measure
both the core temperature Tc and the ambient air
temperature inside the equipment Ta.
Note - when several capacitors are used in a bank it is
quite common for some items to run hotter than
others simply due to their physical position within the
bank.
The ambient air temperature can also show large
variations depending on the position and it may be
necessary to determine the hottest component by
experimentation.
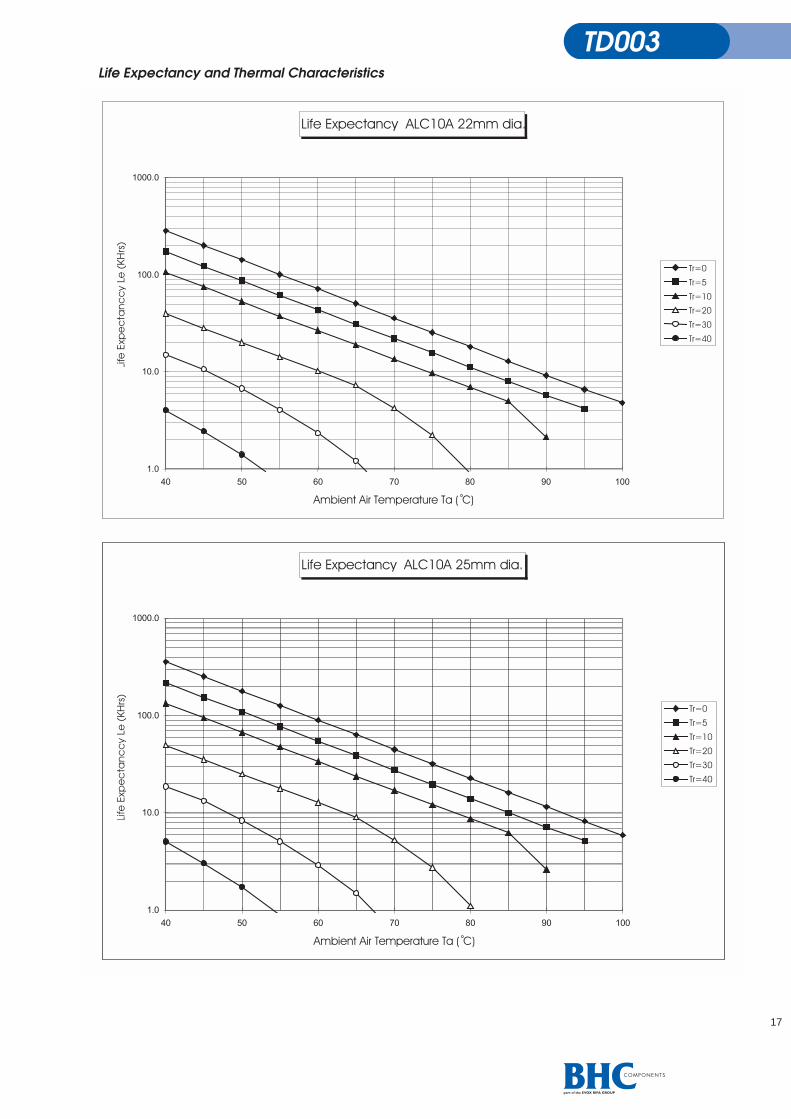
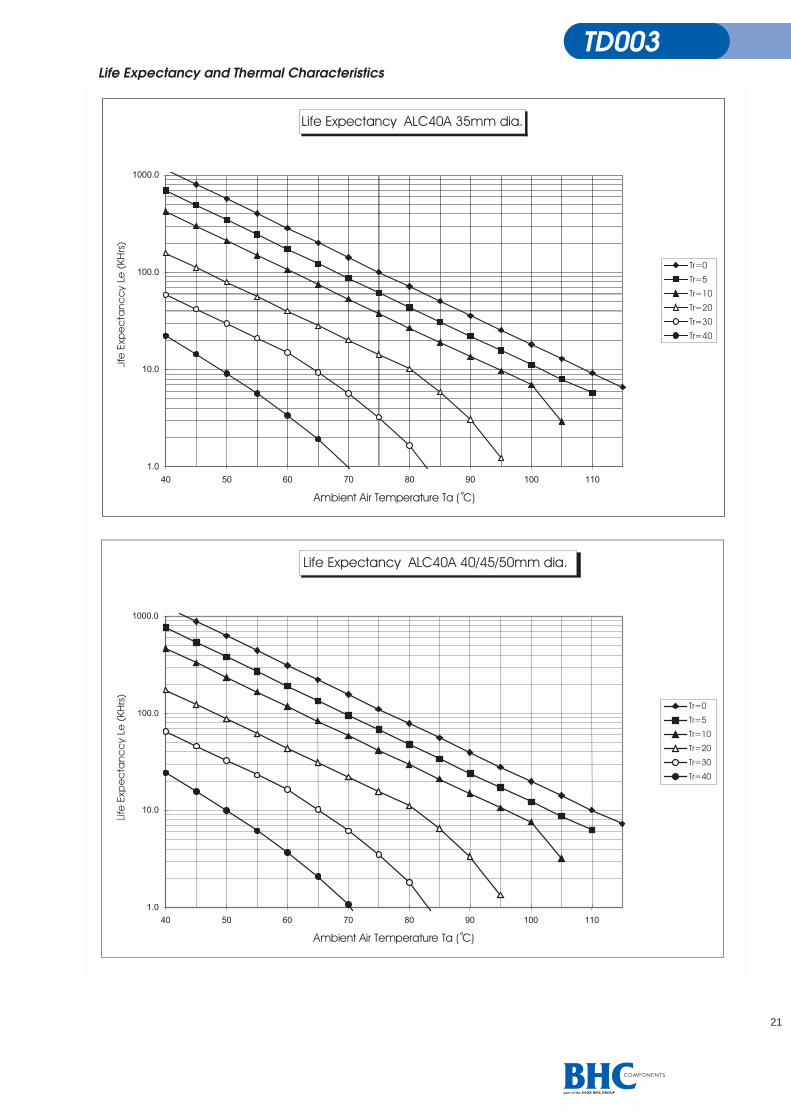
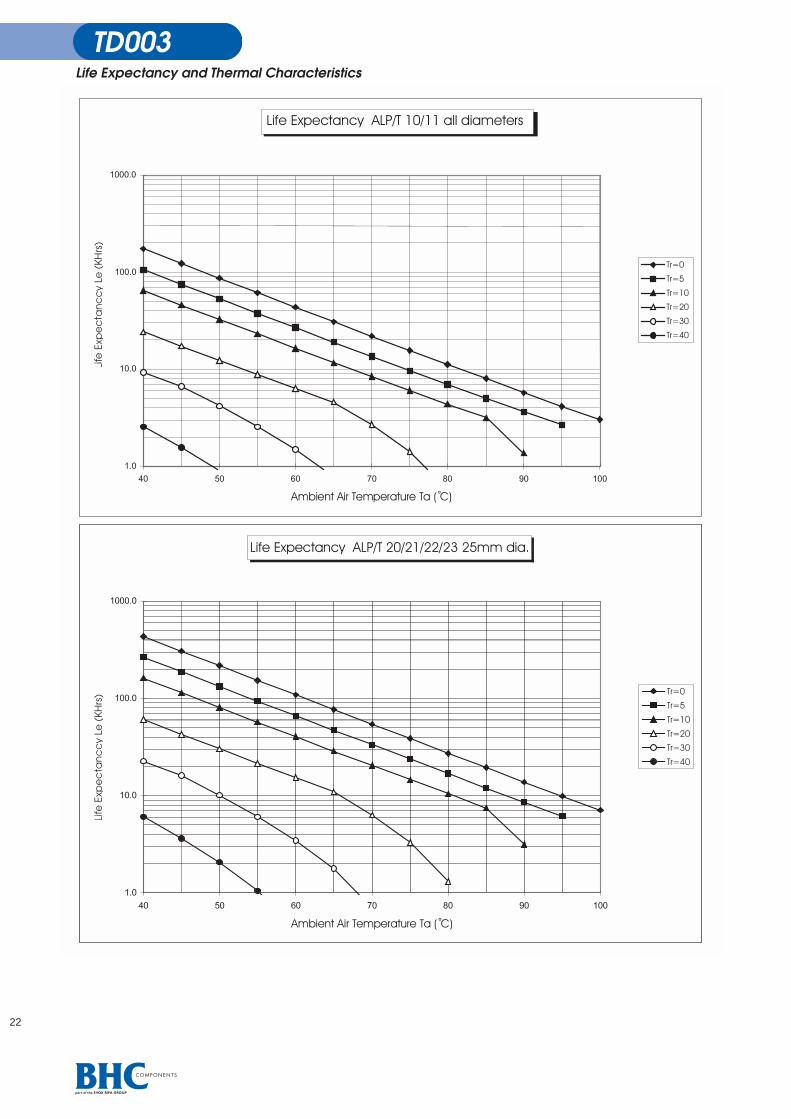
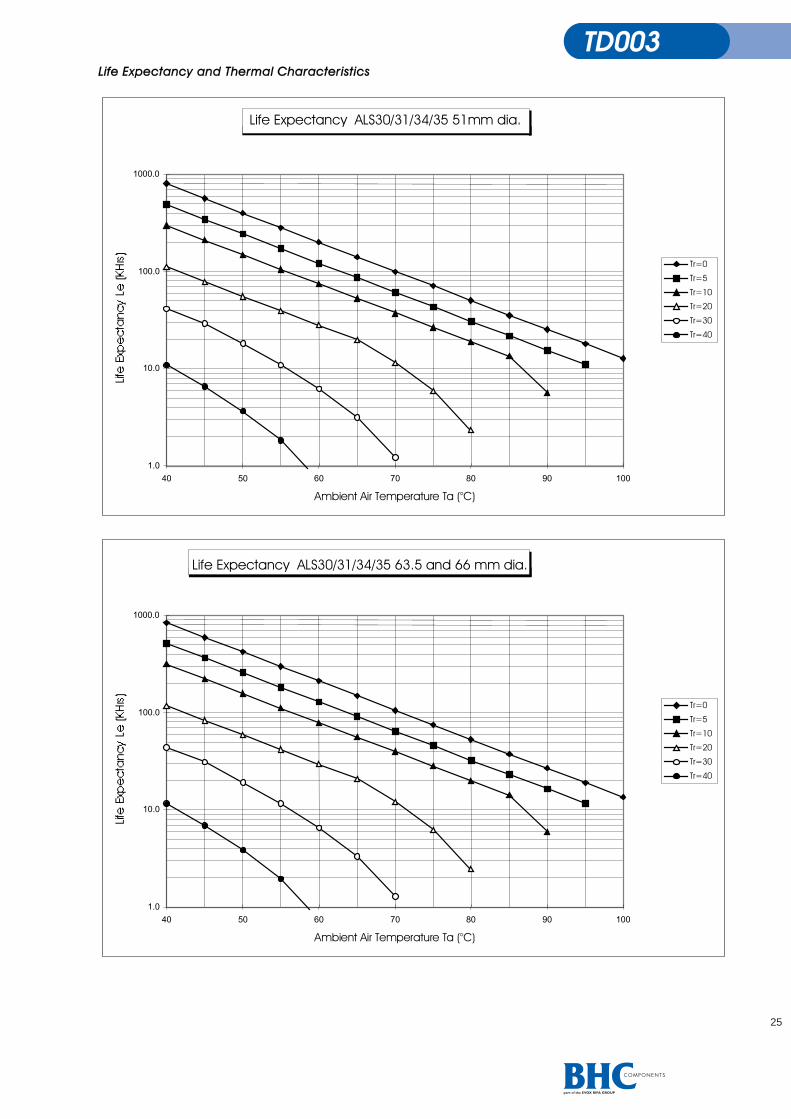
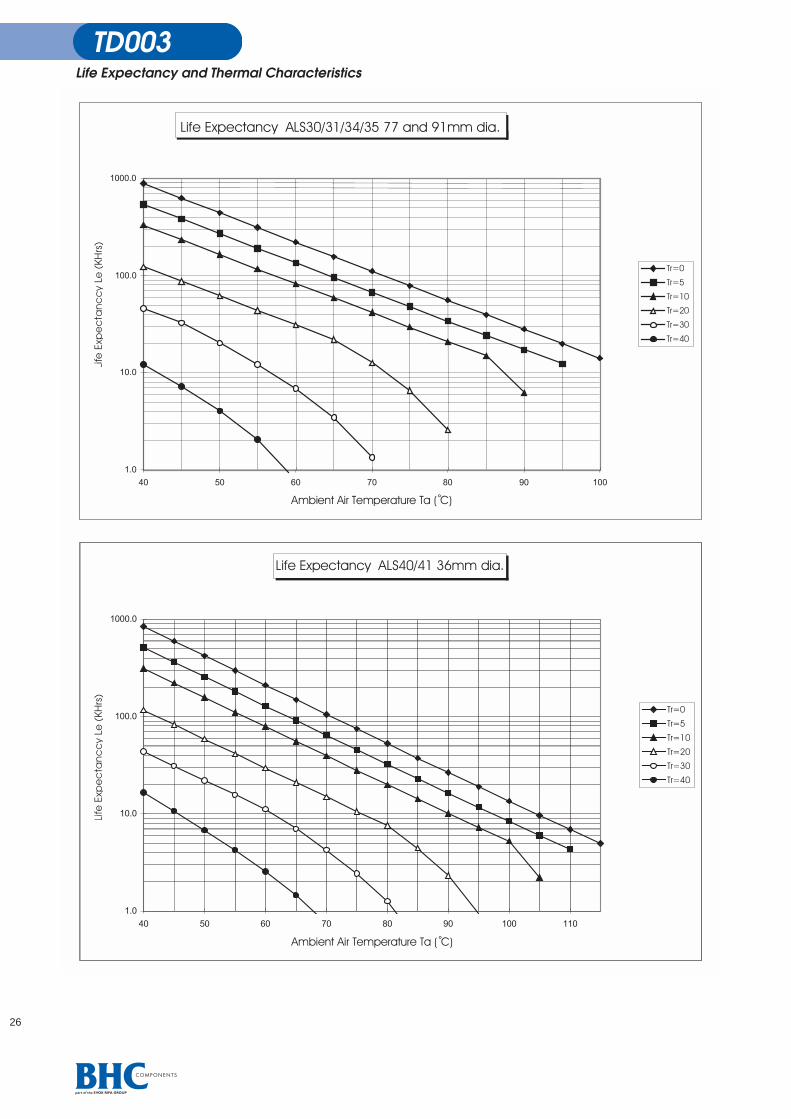
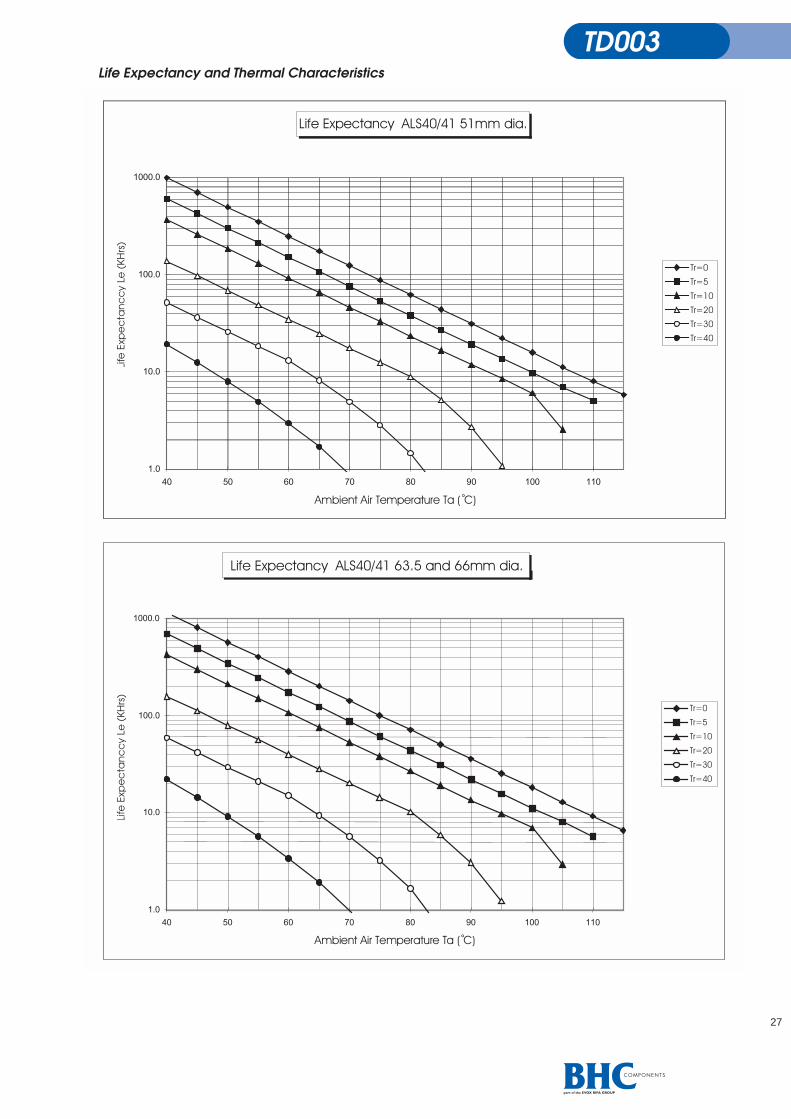
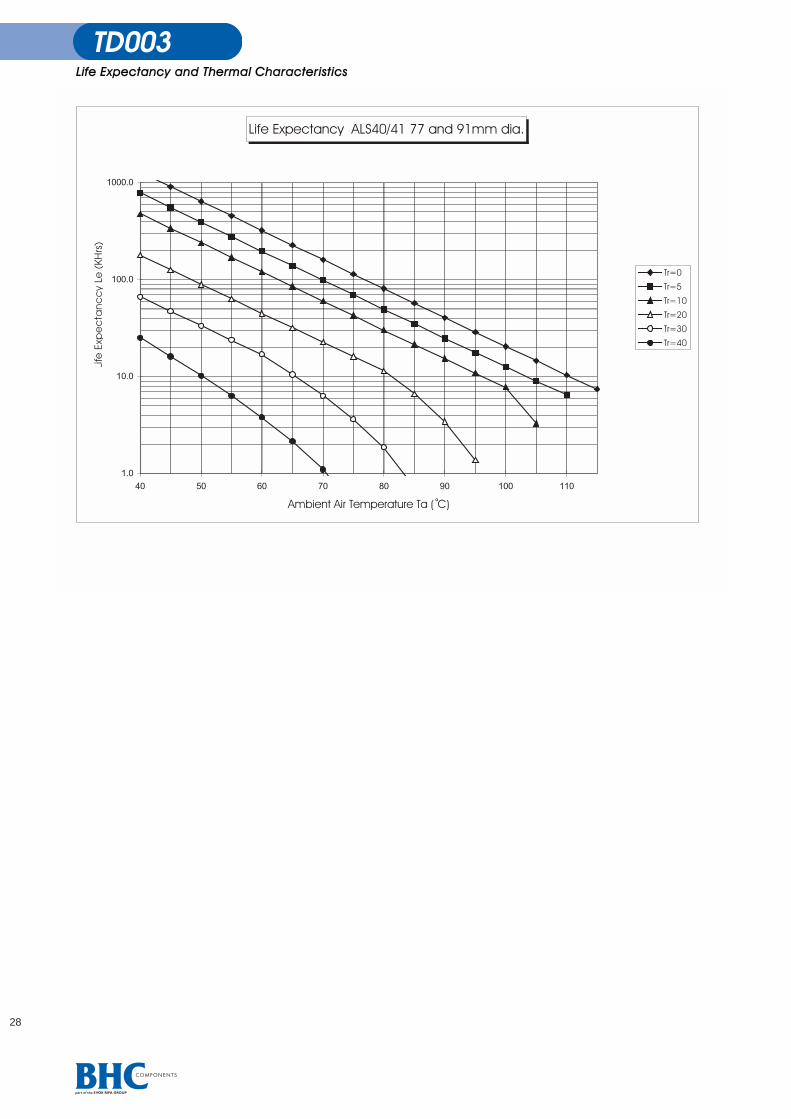
Life Expectancy Graphs
The graphs at the end of this technical data sheet
show the life expectancy for various product ranges.
To use the graphs, find the ambient air temperature
(Ta) on the horizontal scale, then choose the curve
representing the core temperature rise (Tr). Where the
two lines intersect look across to the vertical scale and
read off the life expectancy.
Interpolation will be required when the value of Tr falls
between two curves.
The life expectancy figure should now be multiplied by
the appropriate Kv factor if applicable.
14
Life Expectancy and Thermal Chararacacteristics
Example Life Expectancy Calculation
Consider the following example for an ALS30 series capacitor 4700µF 450 Vdc with case size 77x146 mm and a
rated temperature of 85°C.
Operating conditions : Ambient air temperature Ta = 45°C
DC Voltage (nom) 360 Vdc (i.e. 80% of rated value)
Ripple current I = 39.6 A rms at 300 Hz
Thermal conditions : Airflow rate = 2.0 m/s
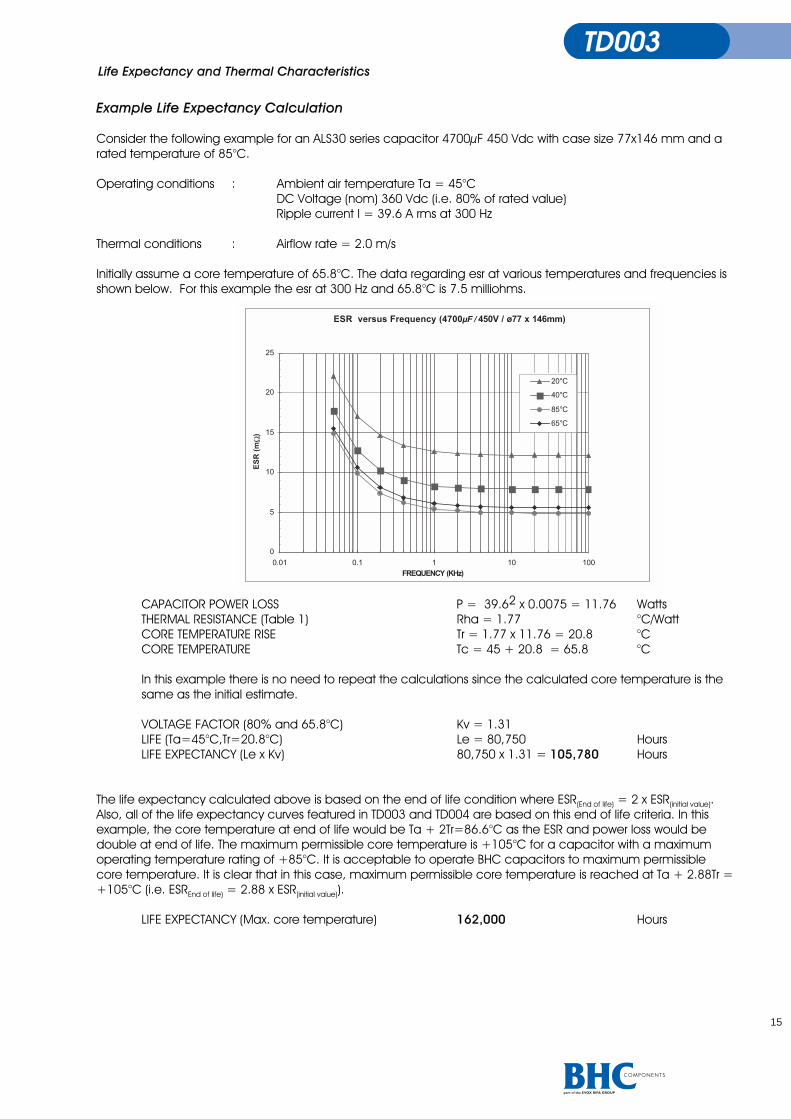
Initially assume a core temperature of 65.8°C. The data regarding esr at various temperatures and frequencies is
shown below. For this example the esr at 300 Hz and 65.8°C is 7.5 milliohms.
Fig 3
CAPACITOR POWER LOSS P = 39.62 x 0.0075 = 11.76 Watts
THERMAL RESISTANCE (Table 1) Rha = 1.77 °C/Watt
CORE TEMPERATURE RISE Tr = 1.77 x 11.76 = 20.8 °C
CORE TEMPERATURE Tc = 45 + 20.8 = 65.8 °C
In this example there is no need to repeat the calculations since the calculated core temperature is the
same as the initial estimate.
VOLTAGE FACTOR (80% and 65.8°C) Kv = 1.31
LIFE (Ta=45°C,Tr=20.8°C) Le = 80,750 Hours
LIFE EXPECTANCY (Le x Kv) 80,750 x 1.31 = 105,780 Hours
The life expectancy calculated above is based on the end of life condition where ESR(End of life) = 2 x ESR(initial value).
Also, all of the life expectancy curves featured in TD003 and TD004 are based on this end of life criteria. In this
example, the core temperature at end of life would be Ta + 2Tr=86.6°C as the ESR and power loss would be
double at end of life. The maximum permissible core temperature is +105°C for a capacitor with a maximum
operating temperature rating of +85°C. It is acceptable to operate BHC capacitors to maximum permissible
core temperature. It is clear that in this case, maximum permissible core temperature is reached at Ta + 2.88Tr =
+105°C (i.e. ESREnd of life) = 2.88 x ESR(initial value)).
LIFE EXPECTANCY (Max. core temperature) 162,000 Hours
ESR versus Frequency (4700µF / 450V / ø77 x 146mm)
0
5
10
15
20
25
0.01 0.1 1 10 100
FREQUENCY (KHz)
ES
R (
mW
)
20°C
40°C
85°C
65°C
15
16
Fac
tor K
vFa
cto
r Kv
L i f eLife Expectancy and Thermal Characteristics
17
Life Expectancy and Thermal Characteristics

18
Life Expectancy and Thermal Characteristics

19
Life Expectancy and Thermal Characteristics

20
Life Expectancy and Thermal Characteristics
21
Life Expectancy and Thermal Characteristics
22
Life Expectancy and Thermal Characteristics

23
Life Expectancy and Thermal Characteristics

24
Life Expectancy and Thermal Characteristics
Life Expectancy and Thermal Chararacacteristics
1.0
10.0
100.0
1000.0
40 50 60 70 80 90 100
Ambient Air Temperature Ta (°C)
Tr=0
Tr=5
Tr=10
Tr=20
Tr=30
Tr=40
Life Expectancy ALS30/31/34/35 51mm dia.
1.0
10.0
100.0
1000.0
40 50 60 70 80 90 100
Ambient Air Temperature Ta (°C)
Tr=0
Tr=5
Tr=10
Tr=20
Tr=30
Tr=40
Life Expectancy ALS30/31/34/35 63.5 and 66 mm dia.
25
26
Life Expectancy and Thermal Characteristics
27
Life Expectancy and Thermal Characteristics
Life Expectancy and Thermal Characteristics
28
Life Expepectancancy an and Rd Rated Rd Ripppple Cur Current
Introduction This technical data sheet gives details of the life expectancy as related to the rated ripple current. A further technical data sheet, TD003, is also available which gives details of life expectancy related to esr and thermal conditions. During the life of the capacitor certain physical and parametric changes occur. These changes eventually render the capacitor unusable, either due to thermal run-away leading to catastrophic failure, or excessive parametric drift. At higher temperatures degradation of encapsulation materials may accelerate these effects. When ripple current is applied to a capacitor the most important parameter in relation to the life expectancy is the esr. The value of esr will slowly increase throughout the life of the capacitor, leading to a gradual increase in power loss and hence core temperature rise. Long term endurance testing, with voltage and ripple current applied, has established the characteristic parameter changes which are displayed by each product family. The typical esr characteristic is shown below in figure 1.
Esr
increase
Life
Fig 1
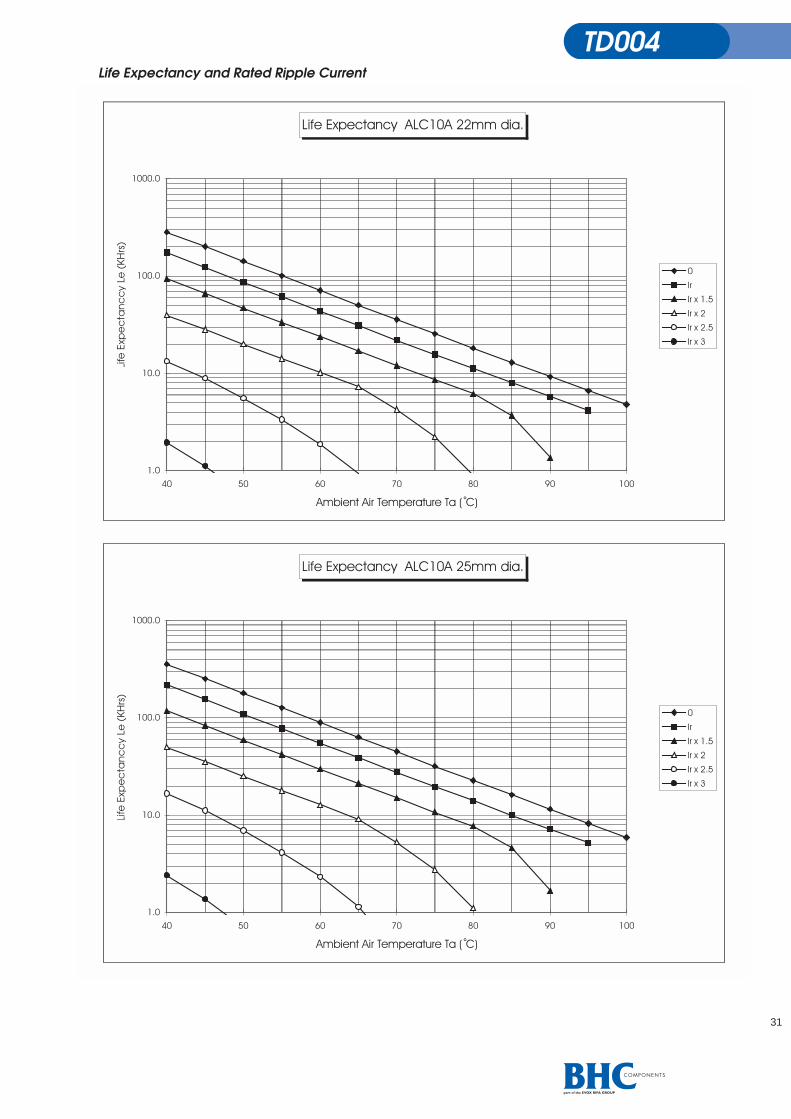
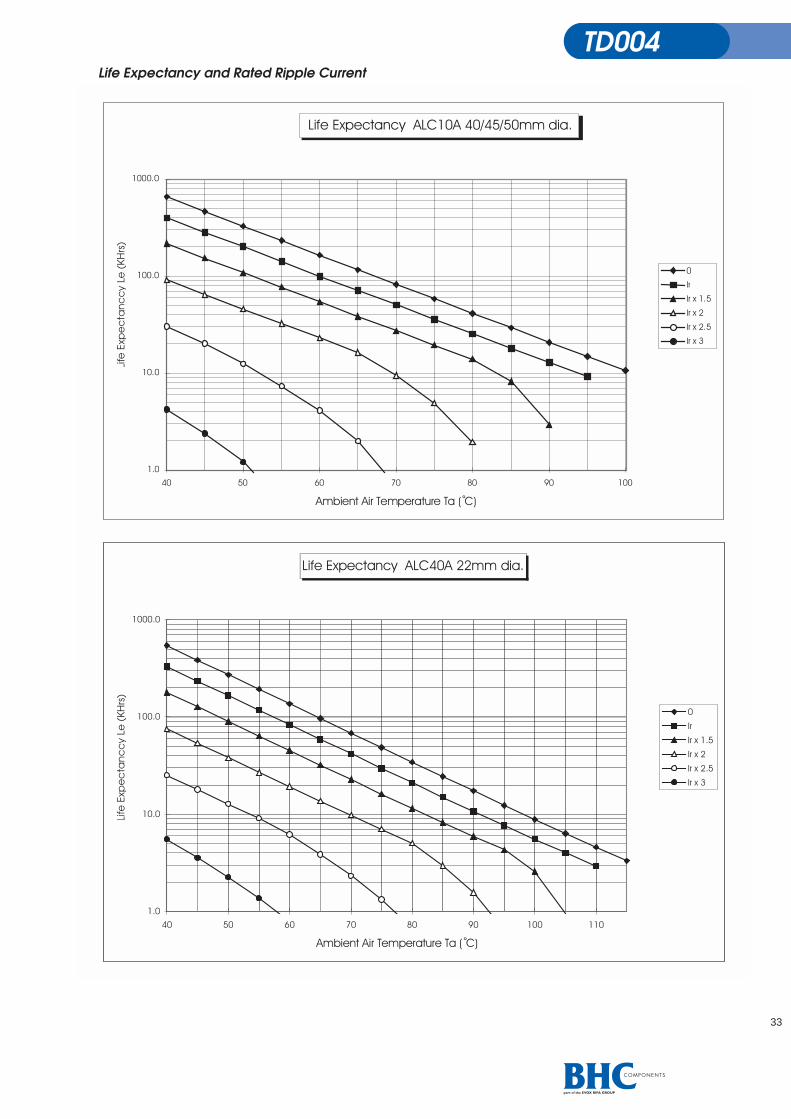
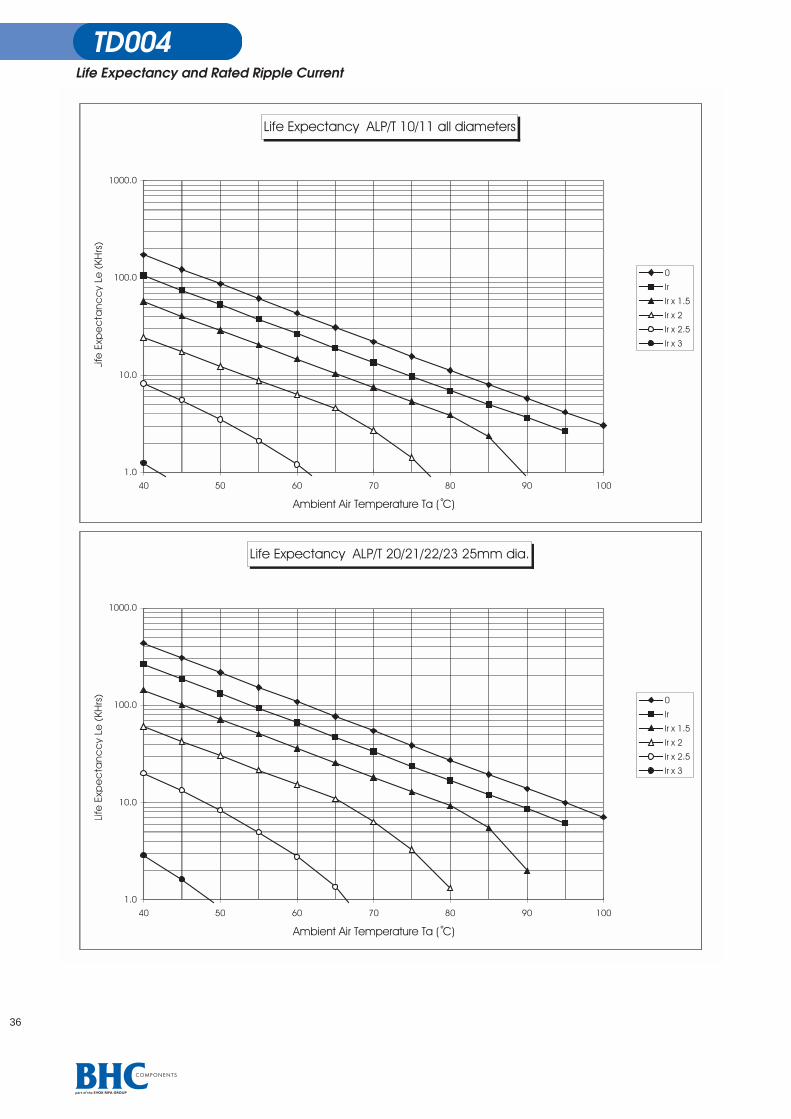
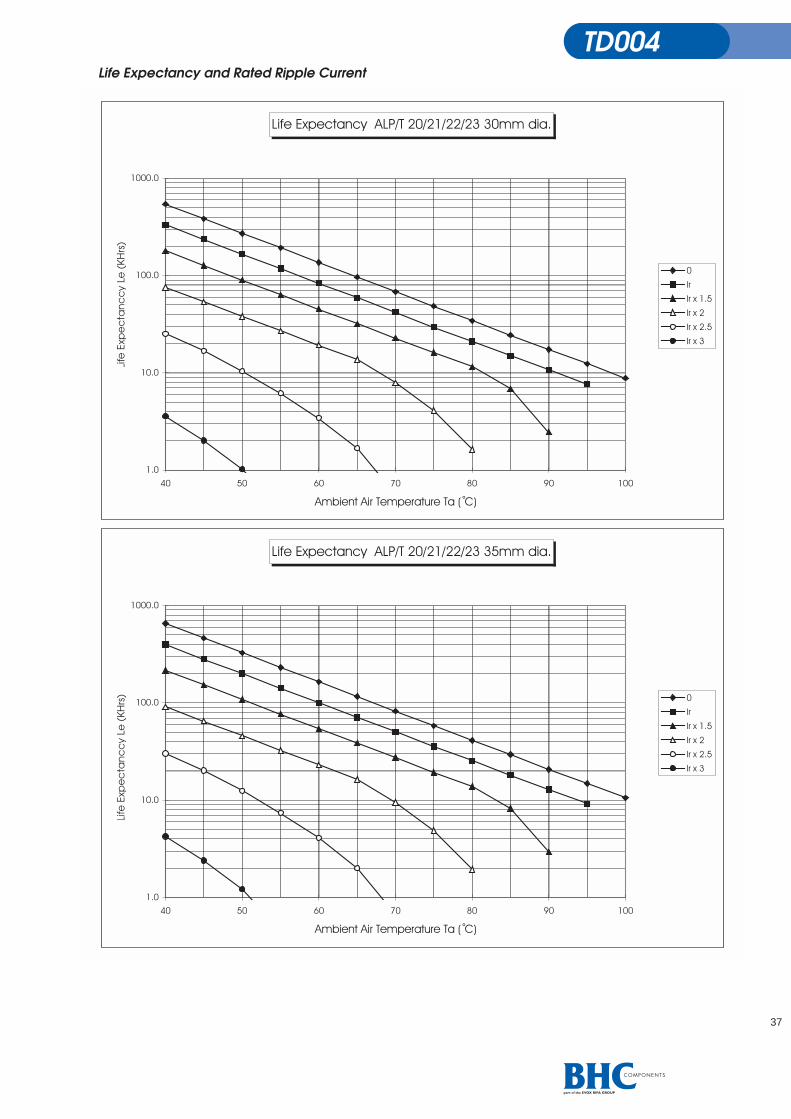
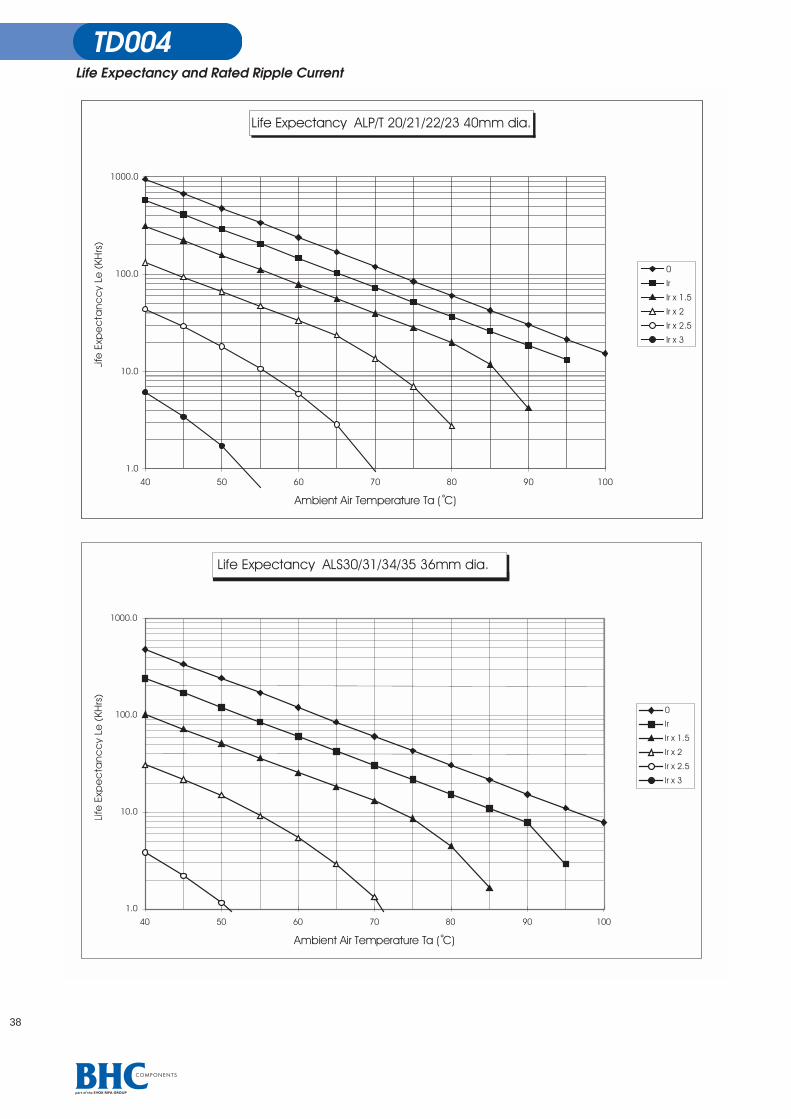
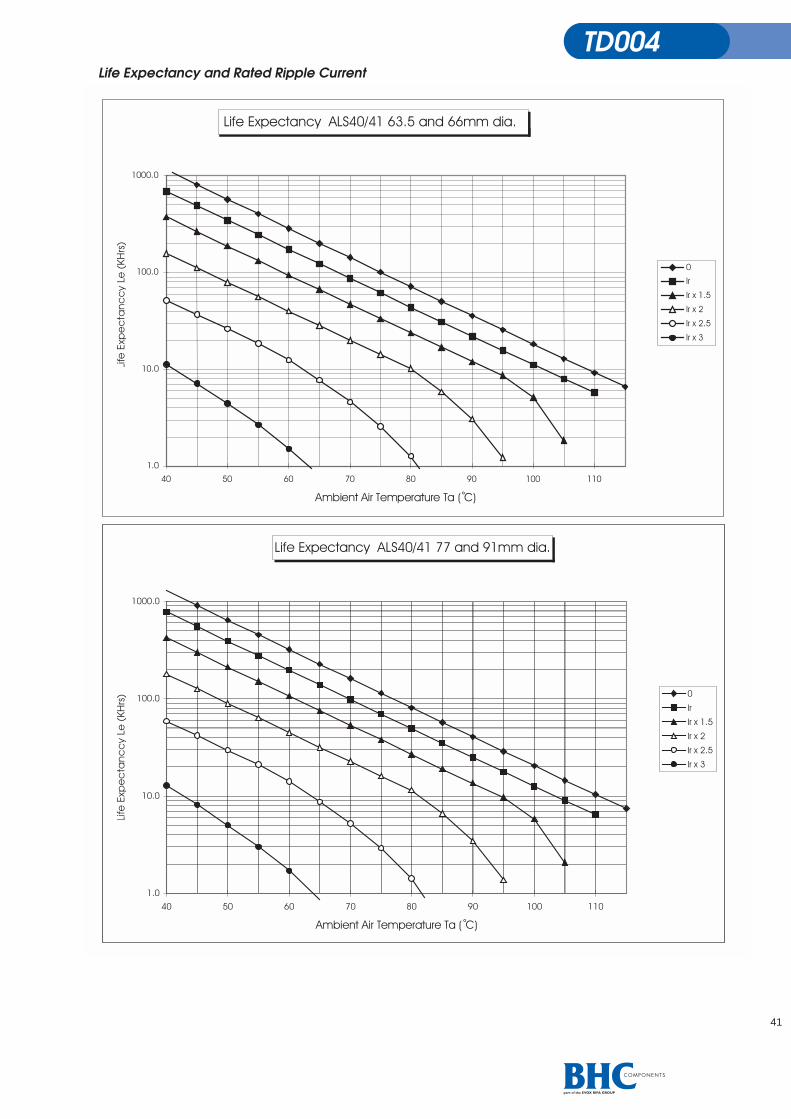
Careful study of these curves has enabled the development of a mathematical model to simulate the changes in esr which occur under various test conditions and levels of stress. Life Expectancy Graphs The graphs in TD004 show the life expectancy for various product ranges. The figures quoted are for capacitors in still air with no heatsinking. To use the graphs, find the ambient air temperature (Ta) on the horizontal scale, then choose the curve representing the ripple current required. Where the two lines intersect look across to the vertical scale and read off the life expectancy. Interpolation will be required when the value of ripple current falls between two curves.
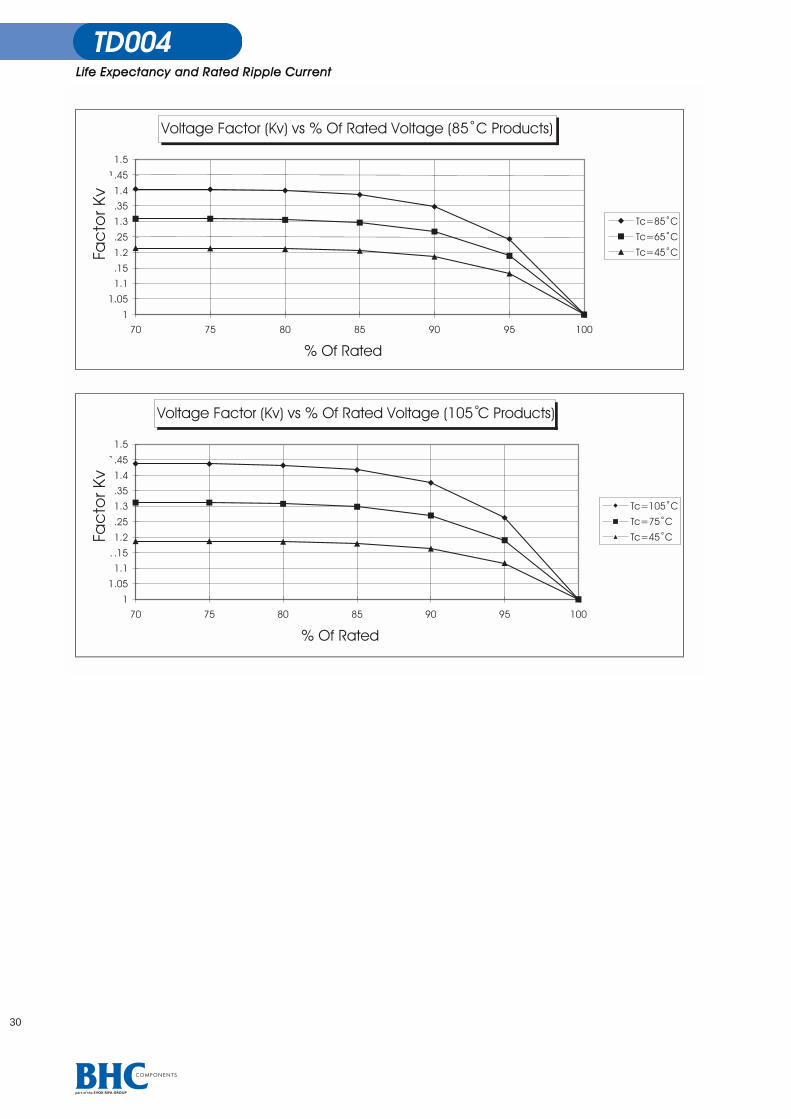
The rated ripple current (Ir) is shown in the catalogue or product data sheet for each individual item. Ripple currents are usually quoted at 100Hz with correction factors for other frequencies. The life expectancy figure from the graph should now be multiplied by the appropriate voltage deration factor Kv, if applicable. End Of Life Definition The end of life is defined as being the point at which any of the following conditions have been reached: Core temp > 105 °C (85°C products) > 120 °C (105°C products) Esr > 2 x initial esr
At the end of life the following conditions will also be satisfied : Capacitance change < 10 % Leakage current < initial limit Voltage Deration If capacitors are operated at a voltage below their rated value then the reduced stress and lower leakage current will give an improvement in the service life. Since leakage current increases with temperature the benefit of a reduced operating voltage is more pronounced at higher temperatures. The graphs in TD004 show values of Kv for products with rated temperatures of 85°C and 105°C . Note - the operating voltage should be taken as the mean d.c. value plus the peak a.c. ripple voltage.
29
Life Expepectancancy an and Rd Rated Rd Ripppple Cur Current
30
Fac
tor K
vFa
cto
r Kv
31
Life Expectancy and Rated Ripple Current

32
Life Expectancy and Rated Ripple Current
33
Life Expectancy and Rated Ripple Current

34
Life Expectancy and Rated Ripple Current

35
Life Expectancy and Rated Ripple Current
36
Life Expectancy and Rated Ripple Current
37
Life Expectancy and Rated Ripple Current
38
Life Expectancy and Rated Ripple Current

Life Expepectancancy an and Rd Rated Rd Ripppple Cur Current
Life Expectancy ALS30/31/34/35 51mm dia.
1.0
10.0
100.0
1000.0
40 50 60 70 80 90 100
Ambient Air Temperature Ta (°C)
0
Ir
Ir x 1.5
Ir x 2
Ir x 2.5
Ir x 3
Life Expectancy ALS30/31/34/35 63.5 and 66mm dia.
1.0
10.0
100.0
1000.0
40 50 60 70 80 90 100
Ambient Air Temperature Ta (°C)
0
Ir
Ir x 1.5
Ir x 2
Ir x 2.5
Ir x 3
39
Life
Exp
ec
tan
cc
y Le
(K
Hrs
)Li
fe E
xpe
cta
nc
cy
Le (
KH
rs)
TD004 Ammendment 27/11/02Life Expectancy and Rated Ripple Current
TD004 Ammendment BHC Components Ltd.
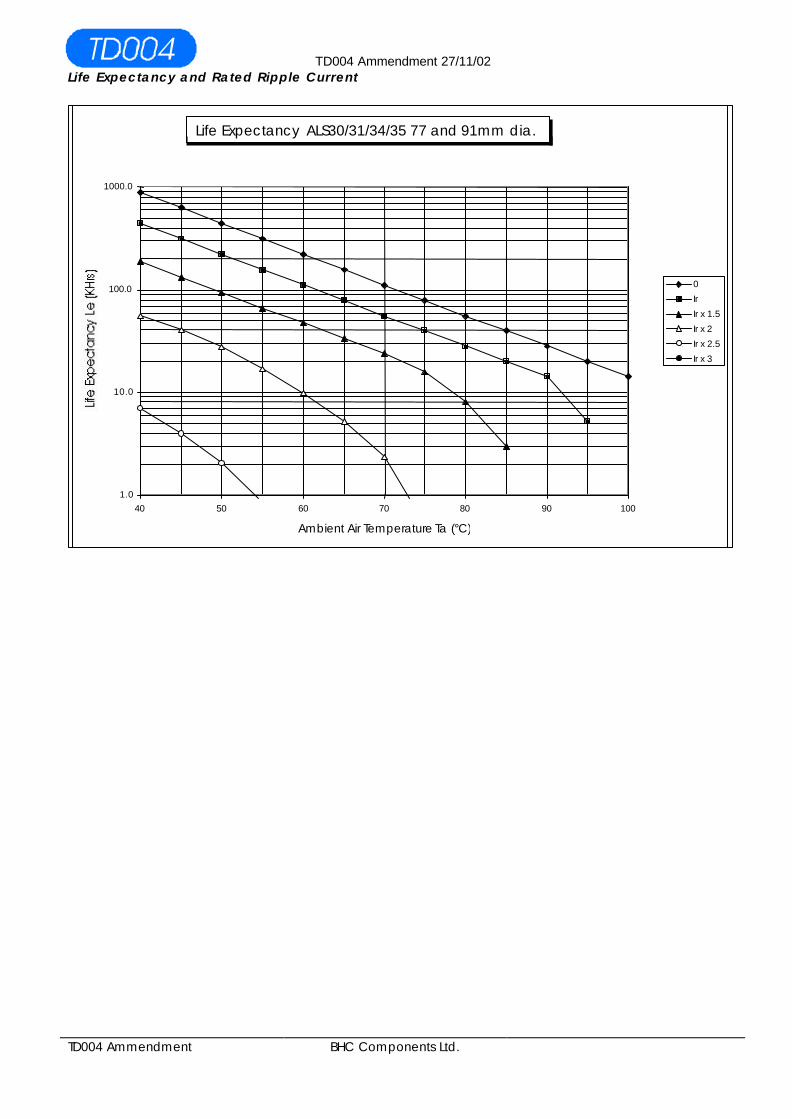
Life Expectancy ALS30/31/34/35 77 and 91mm dia.
1.0
10.0
100.0
1000.0
40 50 60 70 80 90 100
Ambient Air Temperature Ta (°C)
0
Ir
Ir x 1.5
Ir x 2
Ir x 2.5
Ir x 3

40
Life Expectancy and Rated Ripple Current
41
Life Expectancy and Rated Ripple Current
FlammaFlammability Charbility Characteracteristicsics
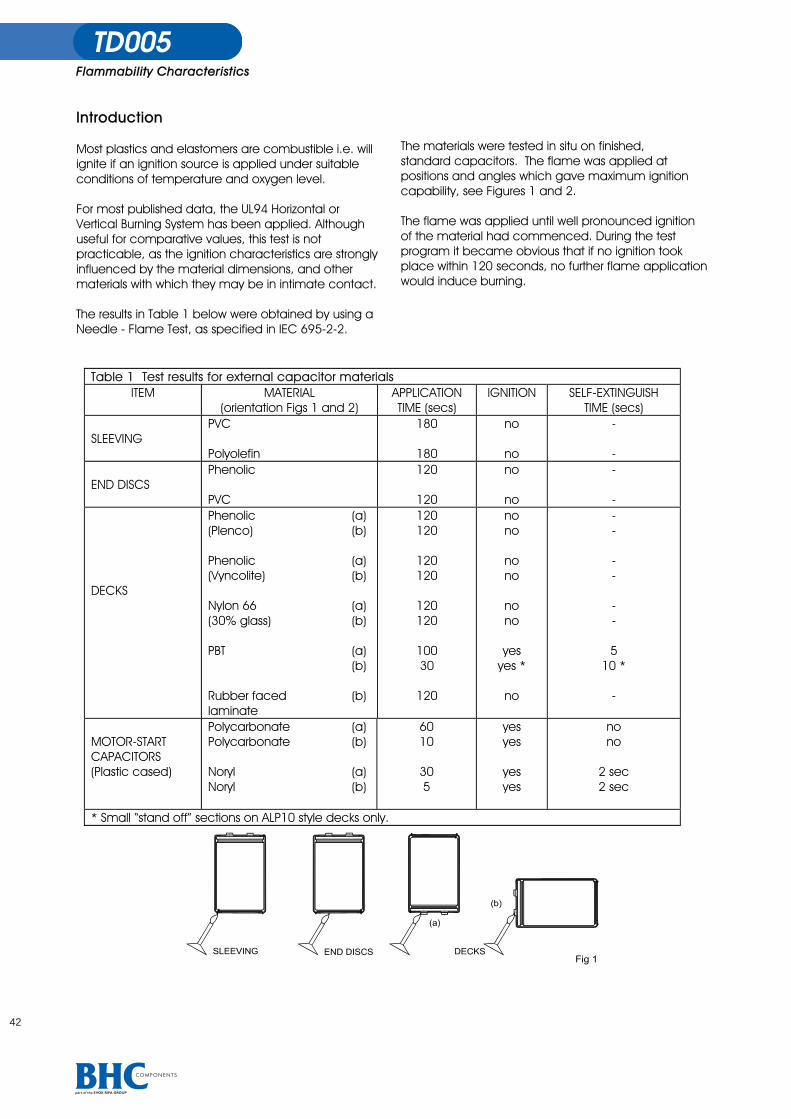
Introduction Most plastics and elastomers are combustible i.e. will ignite if an ignition source is applied under suitable conditions of temperature and oxygen level. For most published data, the UL94 Horizontal or Vertical Burning System has been applied. Although useful for comparative values, this test is not practicable, as the ignition characteristics are strongly influenced by the material dimensions, and other materials with which they may be in intimate contact. The results in Table 1 below were obtained by using a Needle - Flame Test, as specified in IEC 695-2-2.
The materials were tested in situ on finished, standard capacitors. The flame was applied at positions and angles which gave maximum ignition capability, see Figures 1 and 2. The flame was applied until well pronounced ignition of the material had commenced. During the test program it became obvious that if no ignition took place within 120 seconds, no further flame application would induce burning.
Table 1 Test results for external capacitorrnal capacitor mater materials ITEM MATERIAL
(orientation Figs 1 and 2) APPLICATION TIME (secs)
IGNITION SELF-EXTINGUISH TIME (secs)
SLEEVING
PVC Polyolefin
180
180
no
no
- -
END DISCS
Phenolic PVC
120
120
no
no
- -
DECKS
Phenolic (Plenco) Phenolic (Vyncolite) Nylon 66 (30% glass) PBT Rubber faced laminate
(a) (b) (a) (b) (a) (b) (a) (b) (b)
120 120
120 120
120 120
100 30
120
no no
no no
no no
yes
yes *
no
- - - - - - 5
10 * -
MOTOR-START CAPACITORS (Plastic cased)
Polycarbonate Polycarbonate Noryl Noryl
(a) (b) (a) (b)
60 10
30 5
yes yes
yes yes
no no
2 sec 2 sec
* Small “stand off” sections on ALP10 style decks only.
42
FlammaFlammability Charbility Characteristics
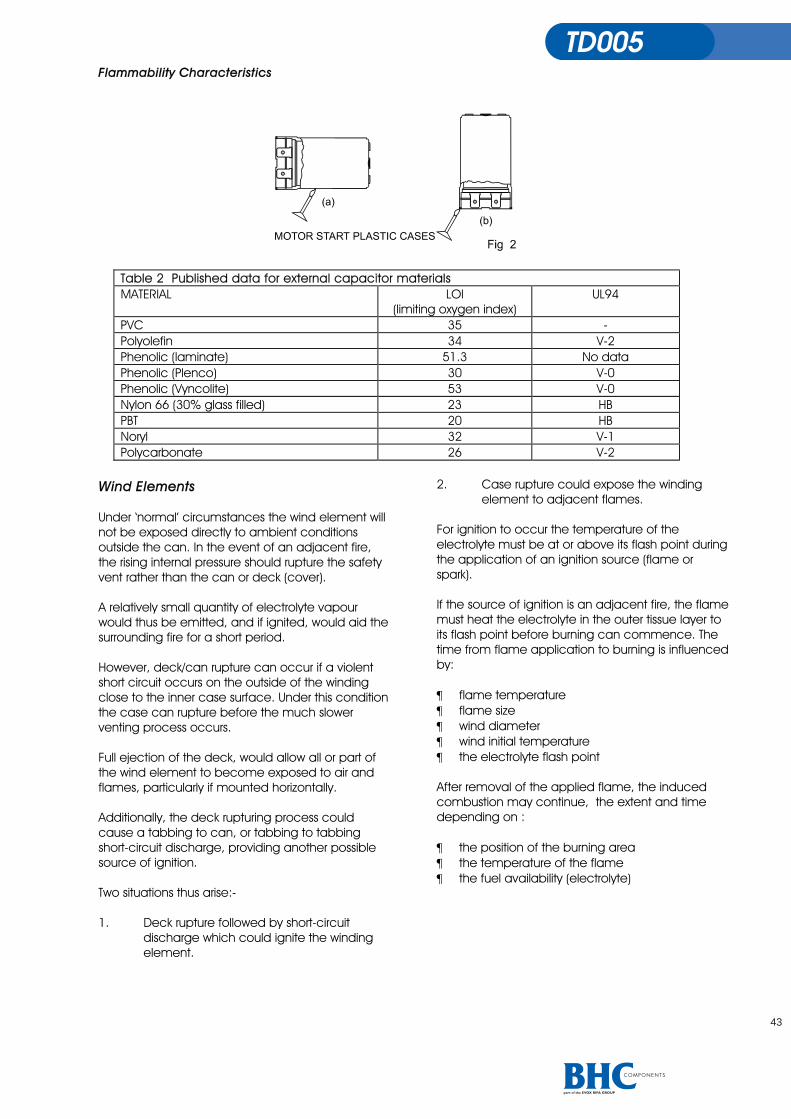
Wind Elements Under ‘normal’ circumstances the wind element will not be exposed directly to ambient conditions outside the can. In the event of an adjacent fire, the rising internal pressure should rupture the safety vent rather than the can or deck (cover). A relatively small quantity of electrolyte vapour would thus be emitted, and if ignited, would aid the surrounding fire for a short period. However, deck/can rupture can occur if a violent short circuit occurs on the outside of the winding close to the inner case surface. Under this condition the case can rupture before the much slower venting process occurs. Full ejection of the deck, would allow all or part of the wind element to become exposed to air and flames, particularly if mounted horizontally. Additionally, the deck rupturing process could cause a tabbing to can, or tabbing to tabbing short-circuit discharge, providing another possible source of ignition. Two situations thus arise:- 1. Deck rupture followed by short-circuit
discharge which could ignite the winding element.
2. Case rupture could expose the winding
element to adjacent flames. For ignition to occur the temperature of the electrolyte must be at or above its flash point during the application of an ignition source (flame or spark). If the source of ignition is an adjacent fire, the flame must heat the electrolyte in the outer tissue layer to its flash point before burning can commence. The time from flame application to burning is influenced by: ¶ flame temperature ¶ flame size ¶ wind diameter ¶ wind initial temperature ¶ the electrolyte flash point After removal of the applied flame, the induced combustion may continue, the extent and time depending on : ¶ the position of the burning area ¶ the temperature of the flame ¶ the fuel availability (electrolyte)
Table 2 Published dble 2 Published data for ex for externaternal ca capapacitor macitor materials terials MATERIAL LOI
(limiting oxygen index) UL94
PVC 35 - Polyolefin 34 V-2 Phenolic (laminate) 51.3 No data Phenolic (Plenco) 30 V-0 Phenolic (Vyncolite) 53 V-0 Nylon 66 (30% glass filled) 23 HB PBT 20 HB Noryl 32 V-1 Polycarbonate 26 V-2
43

FlammaFlammability Charbility Characteristics
Test Method Flame Flame Needle jet as per IEC 695-2-2, Butane gas. WiWinding Diameter 50-76mm, with no additional tissue overwrap. i.e. current design philosophy. Winding Tempermperature Room temperature (20°C). Flame pFlame position See Fig 3 below.
Table 3 Test resultsTable 3 Test results
Electrolyte type
Application time (secs)
Ignition Self extinguish
time (secs)
Glycol based
60 no -
TableTable 4 Pr 4 Producoducts with glyth glycol bas based electrd electrolyte
Product Range Voltage Range ALC10 10 - 500 Vdc ALC40 10 - 450 Vdc ALP/T10 100 - 450 Vdc ALS10 10 - 450 Vdc ALS30 100 - 500 Vdc ALS40 200 - 450 Vdc
MS/MD (motor-start) 120 - 330 Vac
Flash Point and Flammability
Characteristics Flash Point The lowest temperature at which vapour can be ignited by flame. Flammamability Chararacteristics Extremely flammable Flash point <0°C Highly flammable Flash point 0-21°C Flammable Flash point 21-55°C Combustible Flash point >55°C
44

Technical Enquiry
Please complete the boxes below with as much detail as possible and either fax to:
+44 1305 760670 or complete our on-line enquiry form at http://www.bhc.co.uk.
Contact Details
Name Tel:
Company Fax:
Address Email:
Capacitor Details
Capacitor part
number
(if known)
Capacitance µF Rated V dc
Voltage
Size dia. x l en.
(mm)
Configuration Number of Capacitors:
No in bank No in series No in parallel
Operation details The data below applies to : the whole bank [ ] each individual capacitor [ ]
Ripple currents Hz A rms
Hz A rms
Hz A rms
Hz A rms
Hz A rms
Hz A rms
Hz A rms
Working Voltage
Vdc
Forced air cooling
rate - m/s
Ambient air temperature
°C
Heat sinking
°C/W
Other details (e.g. surge
voltages,...)
Special end of life criteria
( e.g. 2 x initial esr )
Target life requirement Hours

11/02© BHC Components Ltd.
Design - [email protected]
BHC Components Ltd.,20 Cumberland Drive,Granby Industrial Estate,Weymouth,Dorset DT4 9TEUnited Kingdom
Telephone +44 (0)1305 782871Fax +44 (0)1305 760670Email [email protected] site www.bhc.co.uk