almarai company - argaamplus.s3.amazonaws.com and environment overview almarai company 2017 q4...
TRANSCRIPT
Almarai Company Annual Results – 2017
Disclaimer
Information contained in this presentation is subject to change without further notice, its accuracy is not guaranteed and it may not contain all material information concerning the company. Neither we nor our advisors make any representation regarding, and assume no responsibility or liability for, the accuracy or completeness of, or any errors or omissions in, to any information contained herein.
In addition, the information contains projections and forward-looking statements that reflect the company’s current views with respect to future events and financial performance. These views are based on current assumptions which are subject to various risks and may change over time. No assurance can be given that future events will occur, that projections will be achieved, or that the company’s assumptions are correct. Actual results may differ materially from those projected.
This presentation is strictly not to be distributed without the explicit consent of Almarai Company management under any circumstances.
2017 Q4 Earnings Presentation 2 Almarai Company
Macro Environment This has changed
from Business
Environment to
Macro Environment.
Industry and Environment Overview
2017 Q4 Earnings Presentation 4 Almarai Company
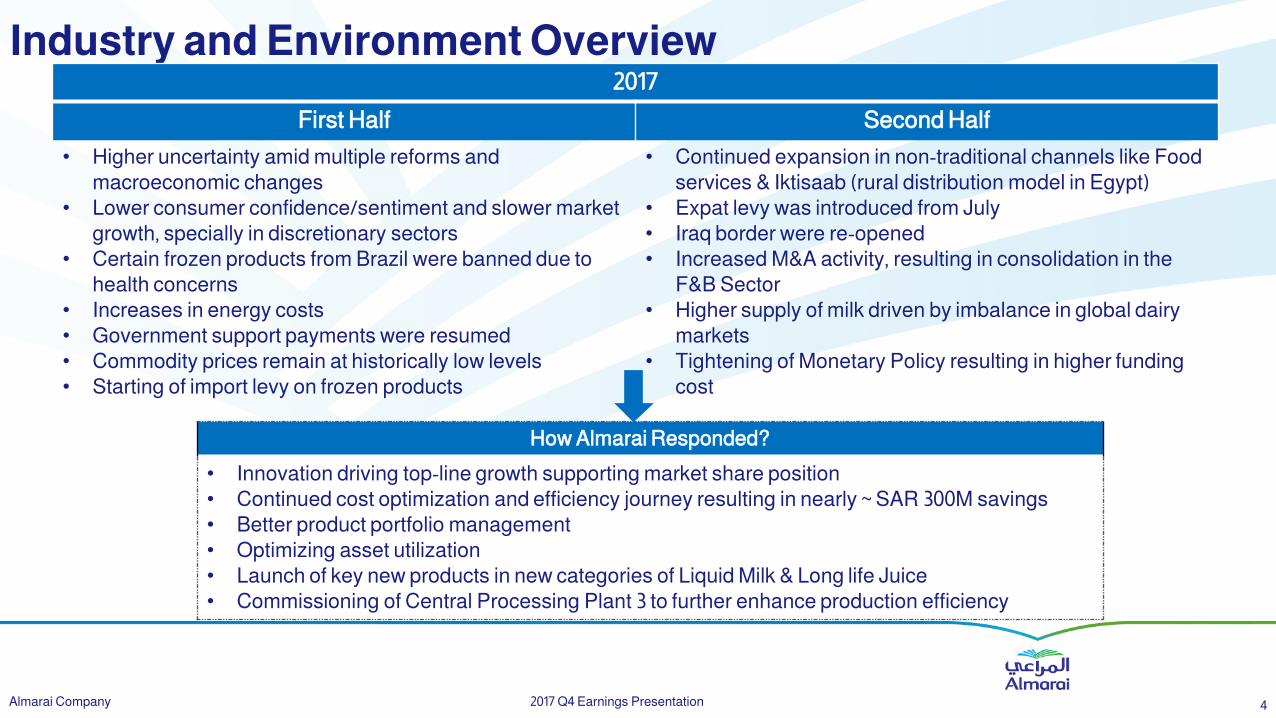
2017
First Half Second Half
• Higher uncertainty amid multiple reforms and
macroeconomic changes
• Lower consumer confidence/sentiment and slower market
growth, specially in discretionary sectors
• Certain frozen products from Brazil were banned due to
health concerns
• Increases in energy costs
• Government support payments were resumed
• Commodity prices remain at historically low levels
• Starting of import levy on frozen products
• Continued expansion in non-traditional channels like Food
services & Iktisaab (rural distribution model in Egypt)
• Expat levy was introduced from July
• Iraq border were re-opened
• Increased M&A activity, resulting in consolidation in the
F&B Sector
• Higher supply of milk driven by imbalance in global dairy
markets
• Tightening of Monetary Policy resulting in higher funding
cost
How Almarai Responded?
• Innovation driving top-line growth supporting market share position
• Continued cost optimization and efficiency journey resulting in nearly ~ SAR 300M savings
• Better product portfolio management
• Optimizing asset utilization
• Launch of key new products in new categories of Liquid Milk & Long life Juice
• Commissioning of Central Processing Plant 3 to further enhance production efficiency
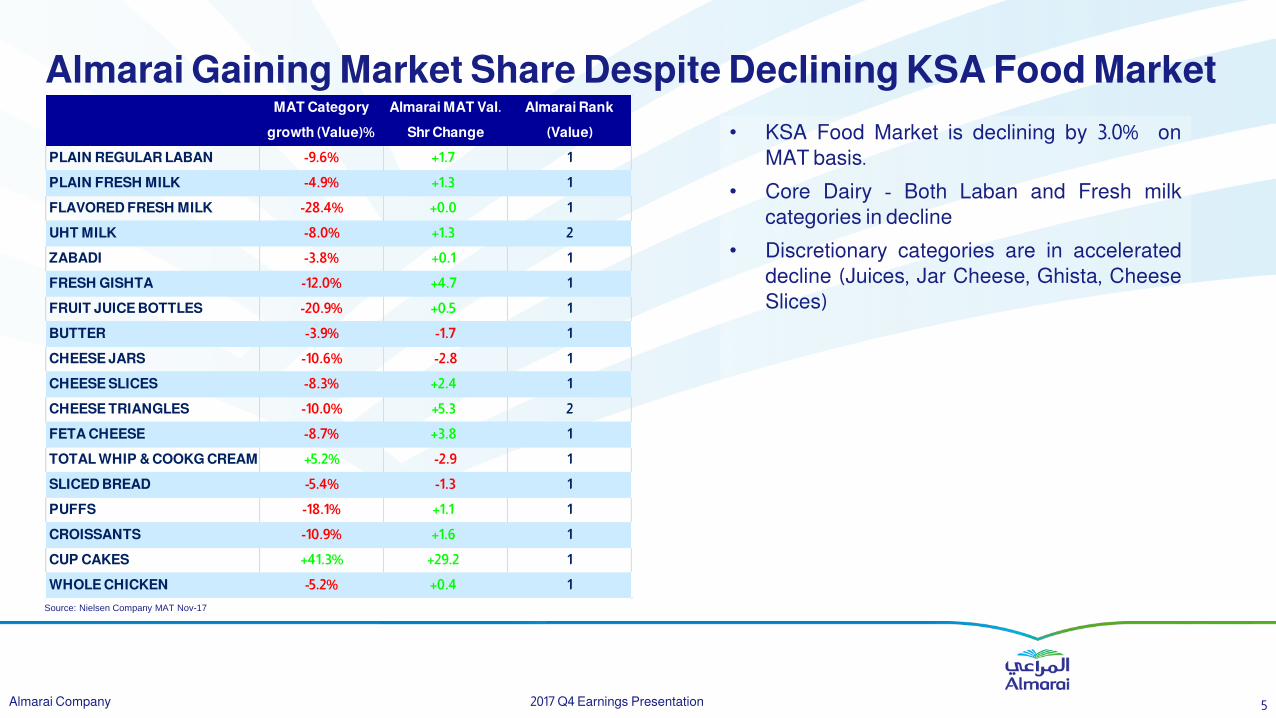
Almarai Gaining Market Share Despite Declining KSA Food Market
• KSA Food Market is declining by 3.0% on
MAT basis.
• Core Dairy - Both Laban and Fresh milk
categories in decline
• Discretionary categories are in accelerated
decline (Juices, Jar Cheese, Ghista, Cheese
Slices)
Source: Nielsen Company MAT Nov-17
2017 Q4 Earnings Presentation 5 Almarai Company
MAT Category
growth (Value)%
Almarai MAT Val.
Shr Change
Almarai Rank
(Value)
PLAIN REGULAR LABAN -9.6% +1.7 1
PLAIN FRESH MILK -4.9% +1.3 1
FLAVORED FRESH MILK -28.4% +0.0 1
UHT MILK -8.0% +1.3 2
ZABADI -3.8% +0.1 1
FRESH GISHTA -12.0% +4.7 1
FRUIT JUICE BOTTLES -20.9% +0.5 1
BUTTER -3.9% -1.7 1
CHEESE JARS -10.6% -2.8 1
CHEESE SLICES -8.3% +2.4 1
CHEESE TRIANGLES -10.0% +5.3 2
FETA CHEESE -8.7% +3.8 1
TOTAL WHIP & COOKG CREAM +5.2% -2.9 1
SLICED BREAD -5.4% -1.3 1
PUFFS -18.1% +1.1 1
CROISSANTS -10.9% +1.6 1
CUP CAKES +41.3% +29.2 1
WHOLE CHICKEN -5.2% +0.4 1
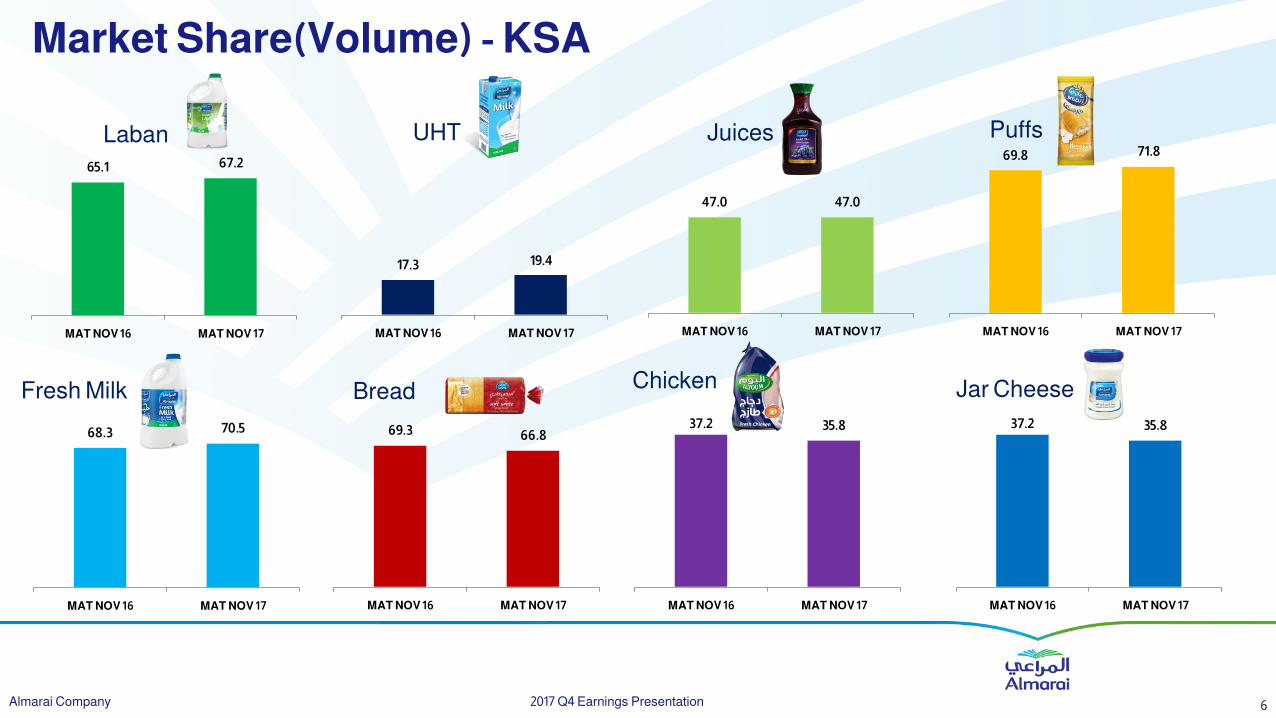
Market Share(Volume) - KSA
Puffs Juices UHT Laban
Jar Cheese Chicken Bread Fresh Milk
2017 Q4 Earnings Presentation 6 Almarai Company
65.1 67.2
MAT NOV 16 MAT NOV 17
17.3 19.4
MAT NOV 16 MAT NOV 17
47.0 47.0
MAT NOV 16 MAT NOV 17
69.8 71.8
MAT NOV 16 MAT NOV 17
68.3 70.5
MAT NOV 16 MAT NOV 17
69.3 66.8
MAT NOV 16 MAT NOV 17
37.2 35.8
MAT NOV 16 MAT NOV 17
37.2 35.8
MAT NOV 16 MAT NOV 17
Business Highlights This is a new slide
called Business
Environment.
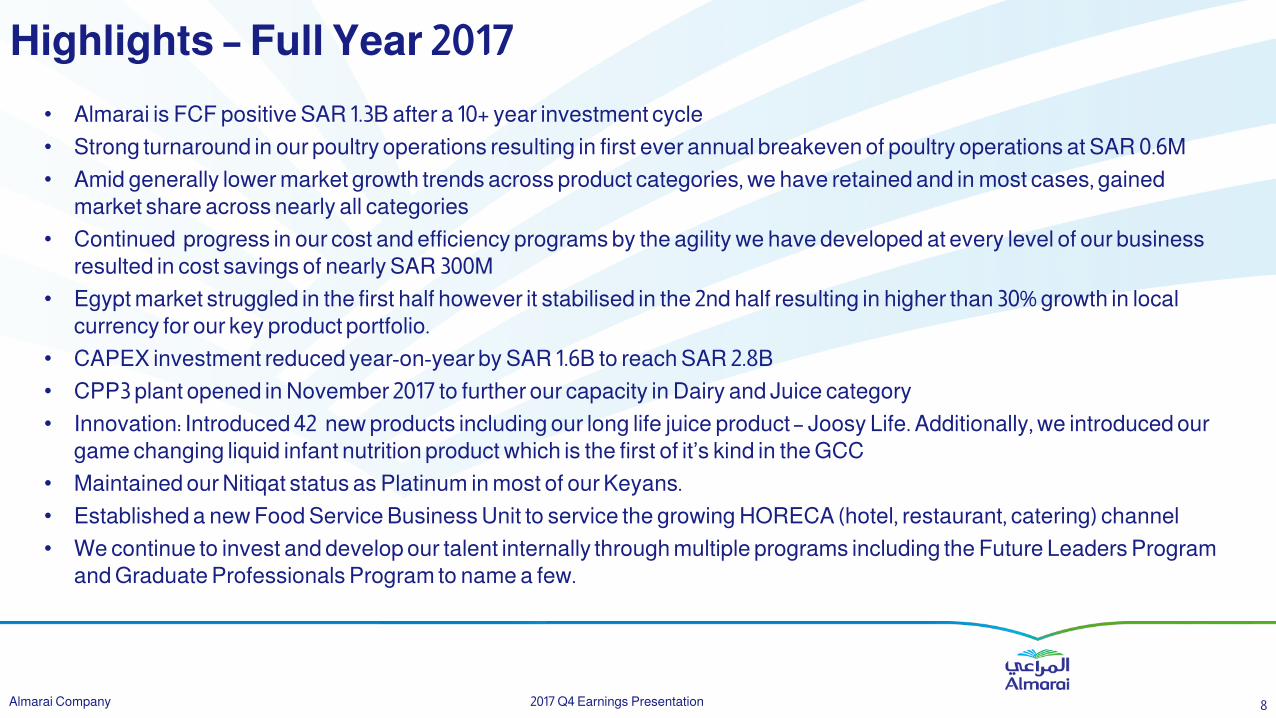
Highlights – Full Year 2017
• Almarai is FCF positive SAR 1.3B after a 10+ year investment cycle
• Strong turnaround in our poultry operations resulting in first ever annual breakeven of poultry operations at SAR 0.6M
• Amid generally lower market growth trends across product categories, we have retained and in most cases, gained
market share across nearly all categories
• Continued progress in our cost and efficiency programs by the agility we have developed at every level of our business
resulted in cost savings of nearly SAR 300M
• Egypt market struggled in the first half however it stabilised in the 2nd half resulting in higher than 30% growth in local
currency for our key product portfolio.
• CAPEX investment reduced year-on-year by SAR 1.6B to reach SAR 2.8B
• CPP3 plant opened in November 2017 to further our capacity in Dairy and Juice category
• Innovation: Introduced 42 new products including our long life juice product – Joosy Life. Additionally, we introduced our
game changing liquid infant nutrition product which is the first of it’s kind in the GCC
• Maintained our Nitiqat status as Platinum in most of our Keyans.
• Established a new Food Service Business Unit to service the growing HORECA (hotel, restaurant, catering) channel
• We continue to invest and develop our talent internally through multiple programs including the Future Leaders Program
and Graduate Professionals Program to name a few.
2017 Q4 Earnings Presentation 8 Almarai Company
The items in red are
highlighted in red.
2013
SAR 11.2 B +12.4%
9 2017 Q4 Earnings Presentation Almarai Company
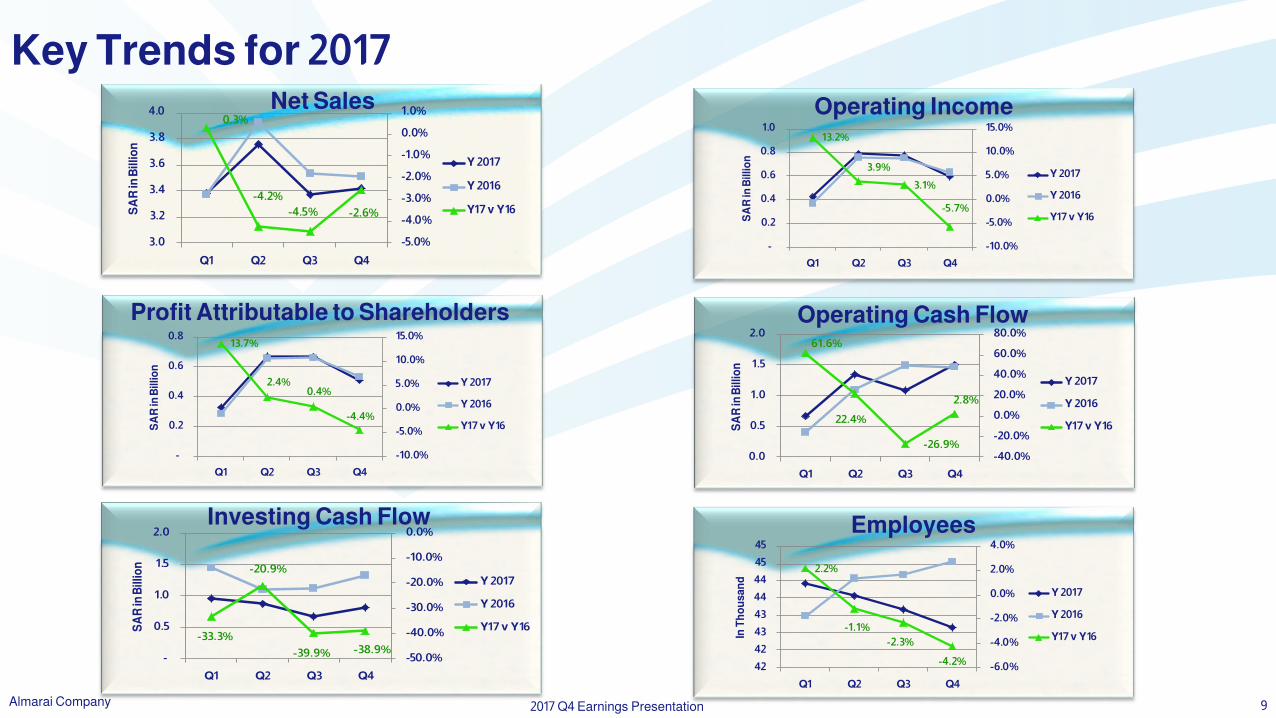
Key Trends for 2017 Net Sales
0.3%
-4.2%
-4.5% -2.6%
-5.0%
-4.0%
-3.0%
-2.0%
-1.0%
0.0%
1.0%
3.0
3.2
3.4
3.6
3.8
4.0
Q1 Q2 Q3 Q4
SA
R in
Bil
lio
n
Y 2017
Y 2016
Y17 v Y16
Operating Income 13.2%
3.9%
3.1%
-5.7%
-10.0%
-5.0%
0.0%
5.0%
10.0%
15.0%
-
0.2
0.4
0.6
0.8
1.0
Q1 Q2 Q3 Q4
SA
R in
Bil
lio
n
Y 2017
Y 2016
Y17 v Y16
Profit Attributable to Shareholders 13.7%
2.4%0.4%
-4.4%
-10.0%
-5.0%
0.0%
5.0%
10.0%
15.0%
-
0.2
0.4
0.6
0.8
Q1 Q2 Q3 Q4
SA
R in
Bil
lio
n
Y 2017
Y 2016
Y17 v Y16
Operating Cash Flow 61.6%
22.4%
-26.9%
2.8%
-40.0%
-20.0%
0.0%
20.0%
40.0%
60.0%
80.0%
0.0
0.5
1.0
1.5
2.0
Q1 Q2 Q3 Q4
SA
R in
Bil
lio
n
Y 2017
Y 2016
Y17 v Y16
Investing Cash Flow
-33.3%
-20.9%
-39.9% -38.9%-50.0%
-40.0%
-30.0%
-20.0%
-10.0%
0.0%
-
0.5
1.0
1.5
2.0
Q1 Q2 Q3 Q4
SA
R in
Bil
lio
n
Y 2017
Y 2016
Y17 v Y16
Employees
2.2%
-1.1%
-2.3%
-4.2%-6.0%
-4.0%
-2.0%
0.0%
2.0%
4.0%
42
42
43
43
44
44
45
45
Q1 Q2 Q3 Q4
In T
ho
us
an
d
Y 2017
Y 2016
Y17 v Y16
Mohammed change the
charts in the arabic
version to be formatted
as they are here.
Sales Trends
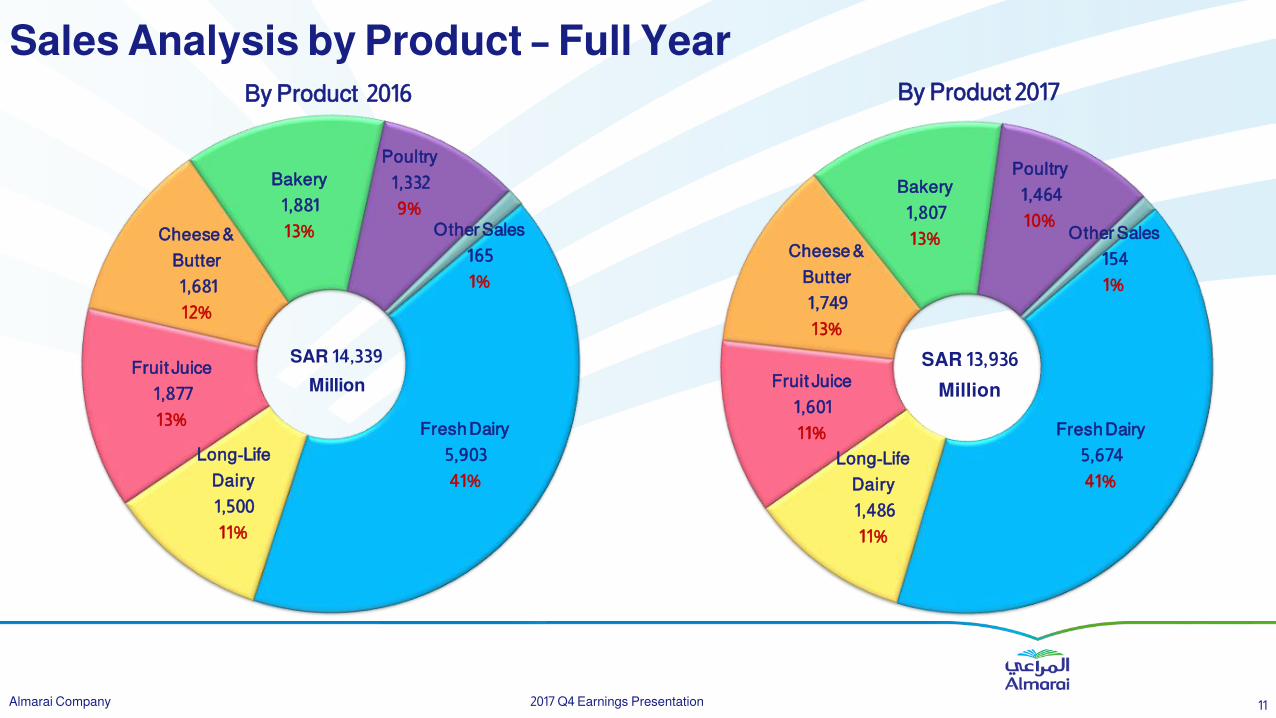
Sales Analysis by Product – Full Year By Product 2016 By Product 2017
2017 Q4 Earnings Presentation 11 Almarai Company
Fresh Dairy
5,903
41%
Long-Life
Dairy
1,500
11%
Fruit Juice
1,877
13%
Cheese &
Butter
1,681
12%
Bakery
1,881
13%
Poultry
1,332
9%
Other Sales
165
1%
SAR 14,339
Million
Fresh Dairy
5,674
41%
Long-Life
Dairy
1,486
11%
Fruit Juice
1,601
11%
Cheese &
Butter
1,749
13%
Bakery
1,807
13%
Poultry
1,464
10%Other Sales
154
1%
SAR 13,936
Million
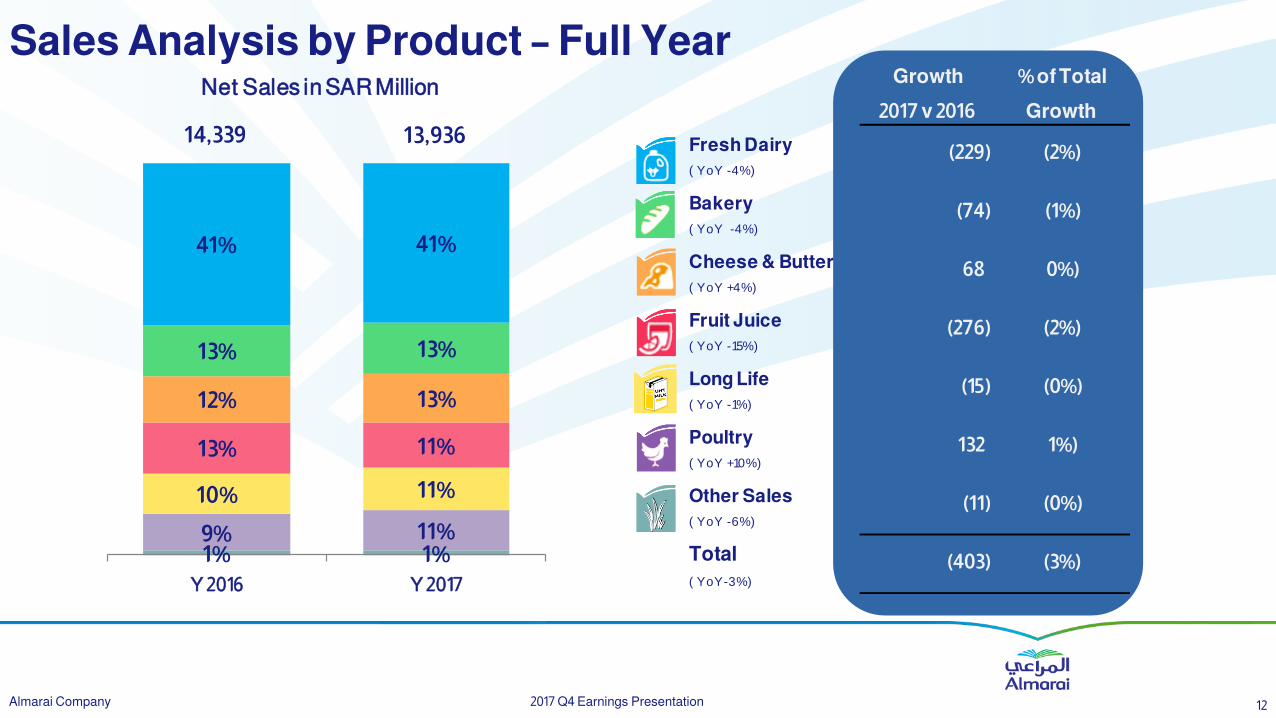
Sales Analysis by Product – Full Year
2017 Q4 Earnings Presentation 12 Almarai Company
1% 1%9% 11%
10% 11%
13% 11%
12% 13%
13% 13%
41% 41%
Y 2016 Y 2017
Net Sales in SAR Million
14,339 13,936
Growth
2017 v 2016
% of Total
Growth
Fresh Dairy
( YoY -4% )
(229) (2%)
Bakery
( YoY -4% )
(74) (1%)
Cheese & Butter
( YoY +4% )
68 0%)
Fruit Juice
( YoY -15% )
(276) (2%)
Long Life
( YoY -1% )
(15) (0%)
Poultry
( YoY +10% )
132 1%)
Other Sales
( YoY -6% )
(11) (0%)
Total
( YoY-3% )
(403) (3%)
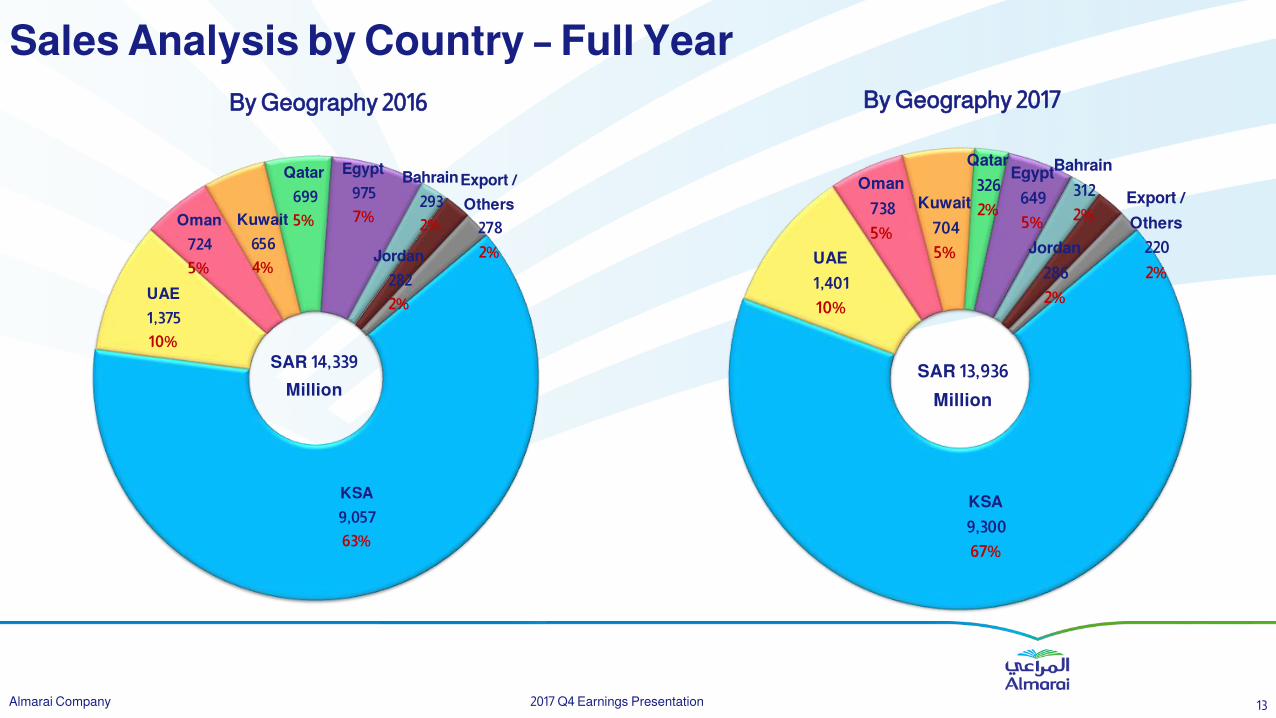
Sales Analysis by Country – Full Year
By Geography 2016 By Geography 2017
2017 Q4 Earnings Presentation 13 Almarai Company
KSA
9,057
63%
UAE
1,375
10%
Oman
724
5%
Kuwait
656
4%
Qatar
699
5%
Egypt
975
7%
Bahrain
293
2%
Jordan
282
2%
Export /
Others
278
2%
SAR 14,339
Million
KSA
9,300
67%
UAE
1,401
10%
Oman
738
5%
Kuwait
704
5%
Qatar
326
2%
Egypt
649
5%
Bahrain
312
2%
Jordan
286
2%
Export /
Others
220
2%
SAR 13,936
Million
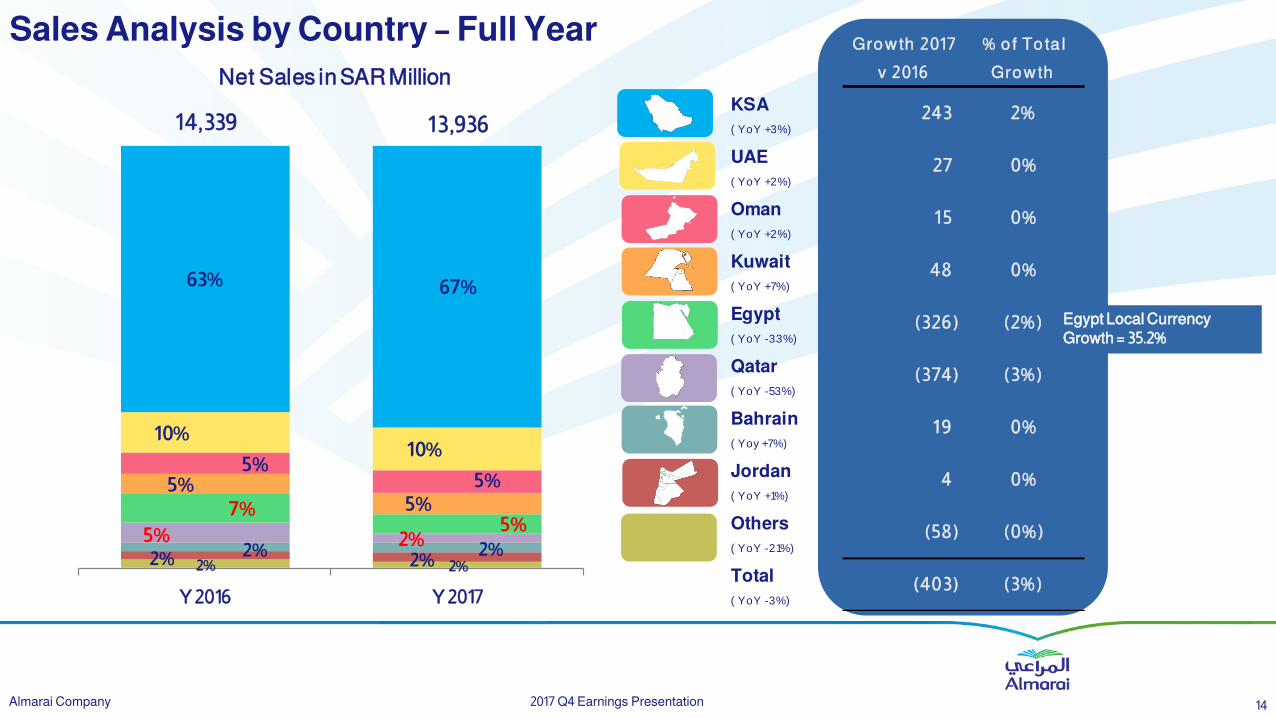
Sales Analysis by Country – Full Year
2017 Q4 Earnings Presentation 14 Almarai Company
2% 2%2% 2%2% 2%
5% 2%
7%5%
5%5%
5%5%
10%10%
63% 67%
Y 2016 Y 2017
Net Sales in SAR Million
14,339 13,936
Gro w th 2 017
v 2 016
% o f To ta l
Gro w th
KSA
( YoY +3% )
243 2%
UAE
( YoY +2% )
27 0%
Oman
( YoY +2% )
1 5 0%
Kuwait
( YoY +7% )
48 0%
Egypt
( YoY -33% )
(326 ) (2% )
Qatar
( YoY -53% )
(374) (3% )
Bahrain
( Yoy +7% )
1 9 0%
Jordan
( YoY +1% )
4 0%
Others
( YoY -21% )
(58) (0% )
Total
( YoY -3% )
(403) (3% )
Egypt Local Currency
Growth = 35.2%

Innovation Pipeline 2017
Q1 Q2
Q3 Q4
2017 Q4 Earnings Presentation 15 Almarai Company
Financial Highlights
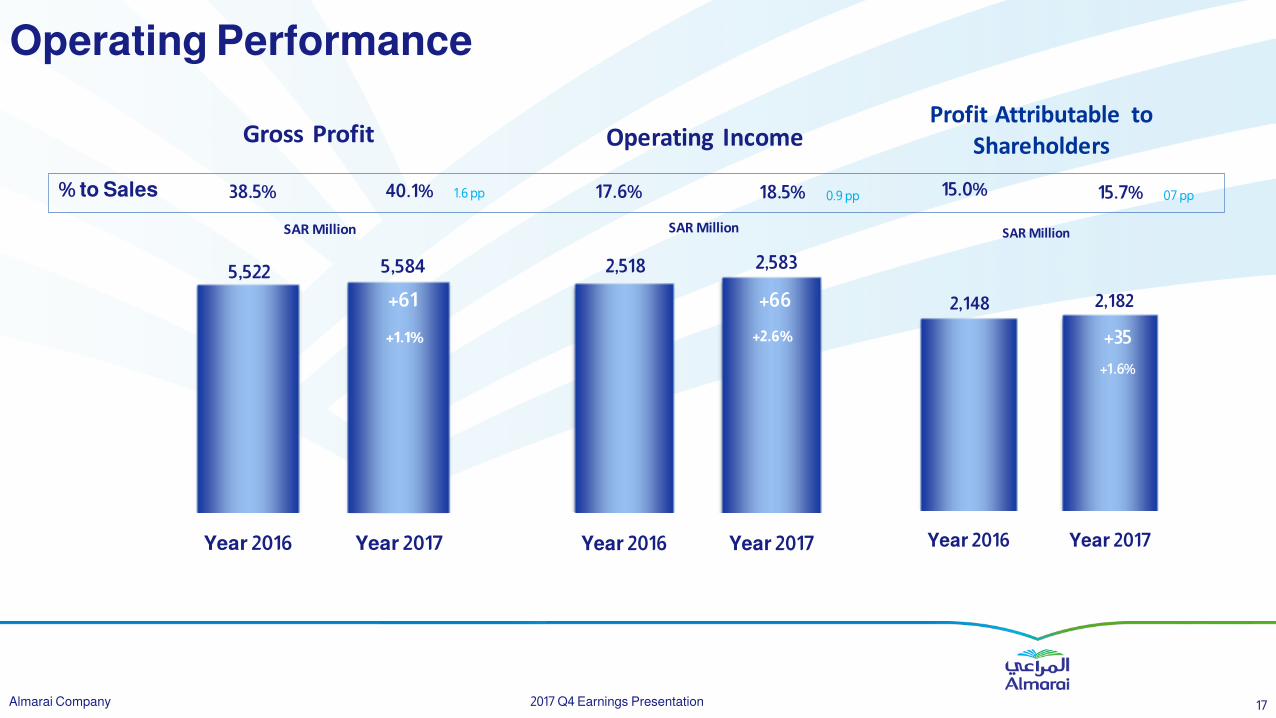
Operating Performance
2017 Q4 Earnings Presentation 17 Almarai Company
5,522 5,584
Year 2016 Year 2017
SAR Million
Gross Profit
+61
+1.1%
2,518 2,583
Year 2016 Year 2017
SAR Million
Operating Income
+66
+2.6%
2,148 2,182
Year 2016 Year 2017
SAR Million
Profit Attributable to Shareholders
+35
+1.6%
% to Sales 38.5% 40.1% 17.6% 18.5% 15.0% 15.7% 1.6 pp 0.9 pp 07 pp
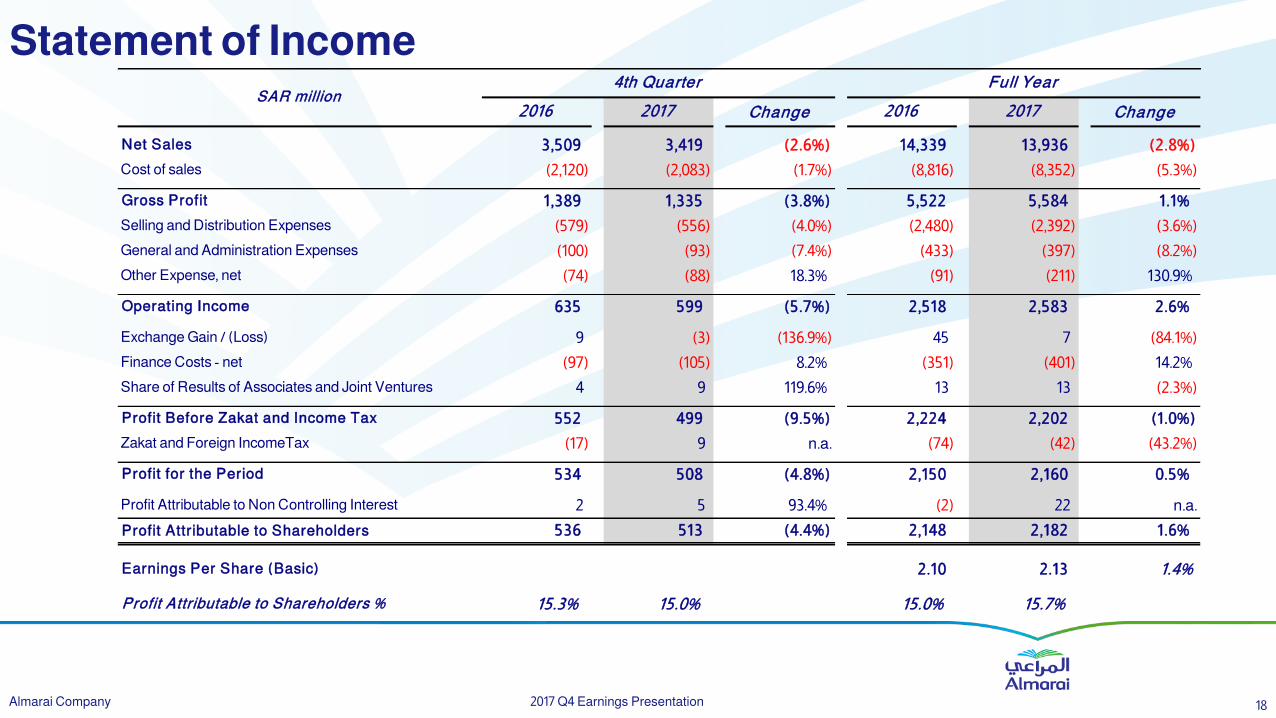
Statement of Income
2017 Q4 Earnings Presentation 18 Almarai Company
Change Change
Net Sales 3,509 3,419 (2.6%) 14,339 13,936 (2.8%)
Cost of sales (2,120) (2,083) (1.7%) (8,816) (8,352) (5.3%)
Gross Profit 1,389 1,335 (3.8%) 5,522 5,584 1.1%
Selling and Distribution Expenses (579) (556) (4.0%) (2,480) (2,392) (3.6%)
General and Administration Expenses (100) (93) (7.4%) (433) (397) (8.2%)
Other Expense, net (74) (88) 18.3% (91) (211) 130.9%
Operating Income 635 599 (5.7%) 2,518 2,583 2.6%
Exchange Gain / (Loss) 9 (3) (136.9%) 45 7 (84.1%)
Finance Costs - net (97) (105) 8.2% (351) (401) 14.2%
Share of Results of Associates and Joint Ventures 4 9 119.6% 13 13 (2.3%)
Profit Before Zakat and Income Tax 552 499 (9.5%) 2,224 2,202 (1.0%)
Zakat and Foreign IncomeTax (17) 9 n.a. (74) (42) (43.2%)
Profit for the Period 534 508 (4.8%) 2,150 2,160 0.5%
Profit Attributable to Non Controlling Interest 2 5 93.4% (2) 22 n.a.
Profit Attributable to Shareholders 536 513 (4.4%) 2,148 2,182 1.6%
Earnings Per Share (Basic) 2.10 2.13 1.4%
Profit Attributable to Shareholders % 15.3% 15.0% 15.0% 15.7%
SAR million4th Quarter Full Year
2016 2017 2016 2017
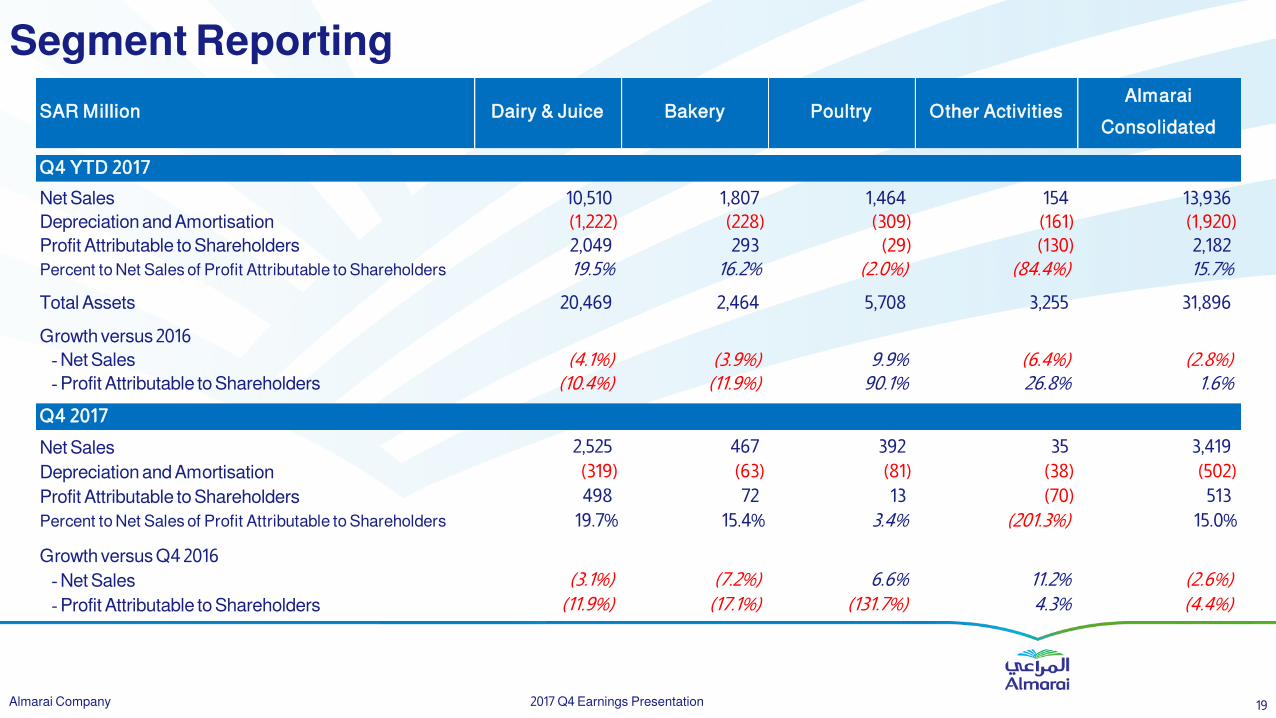
Segment Reporting
2017 Q4 Earnings Presentation 19 Almarai Company
SAR Million Dairy & Juice Bakery Poultry Other ActivitiesAlmarai
Consolidated
Q4 YTD 2017
Net Sales 10,510 1,807 1,464 154 13,936
Depreciation and Amortisation (1,222) (228) (309) (161) (1,920)
Profit Attributable to Shareholders 2,049 293 (29) (130) 2,182
Percent to Net Sales of Profit Attributable to Shareholders 19.5% 16.2% (2.0%) (84.4%) 15.7%
Total Assets 20,469 2,464 5,708 3,255 31,896
Growth versus 2016
- Net Sales (4.1%) (3.9%) 9.9% (6.4%) (2.8%)
- Profit Attributable to Shareholders (10.4%) (11.9%) 90.1% 26.8% 1.6%
Q4 2017
Net Sales 2,525 467 392 35 3,419
Depreciation and Amortisation (319) (63) (81) (38) (502)
Profit Attributable to Shareholders 498 72 13 (70) 513
Percent to Net Sales of Profit Attributable to Shareholders 19.7% 15.4% 3.4% (201.3%) 15.0%
Growth versus Q4 2016
- Net Sales (3.1%) (7.2%) 6.6% 11.2% (2.6%)
- Profit Attributable to Shareholders (11.9%) (17.1%) (131.7%) 4.3% (4.4%)
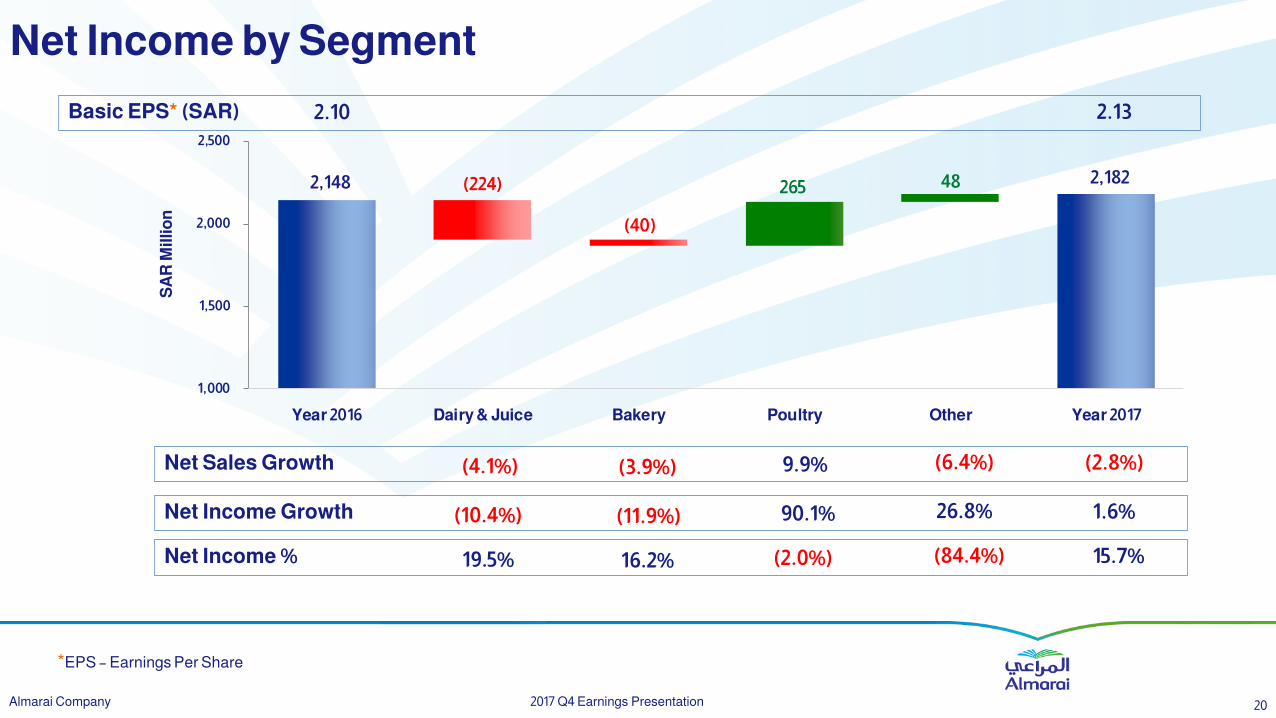
2,182 2,148 (224)
(40)
265 48
1,000
1,500
2,000
2,500
Year 2016 Dairy & Juice Bakery Poultry Other Year 2017
SA
R M
illi
on
Basic EPS* (SAR) 2.10 2.13
Net Income % 15.7% 19.5% 16.2% (2.0%) (84.4%)
Net Sales Growth (2.8%) (4.1%) (3.9%) 9.9% (6.4%)
Net Income Growth 1.6% (10.4%) (11.9%) 90.1% 26.8%
Net Income by Segment
2017 Q4 Earnings Presentation 20 Almarai Company
*EPS – Earnings Per Share
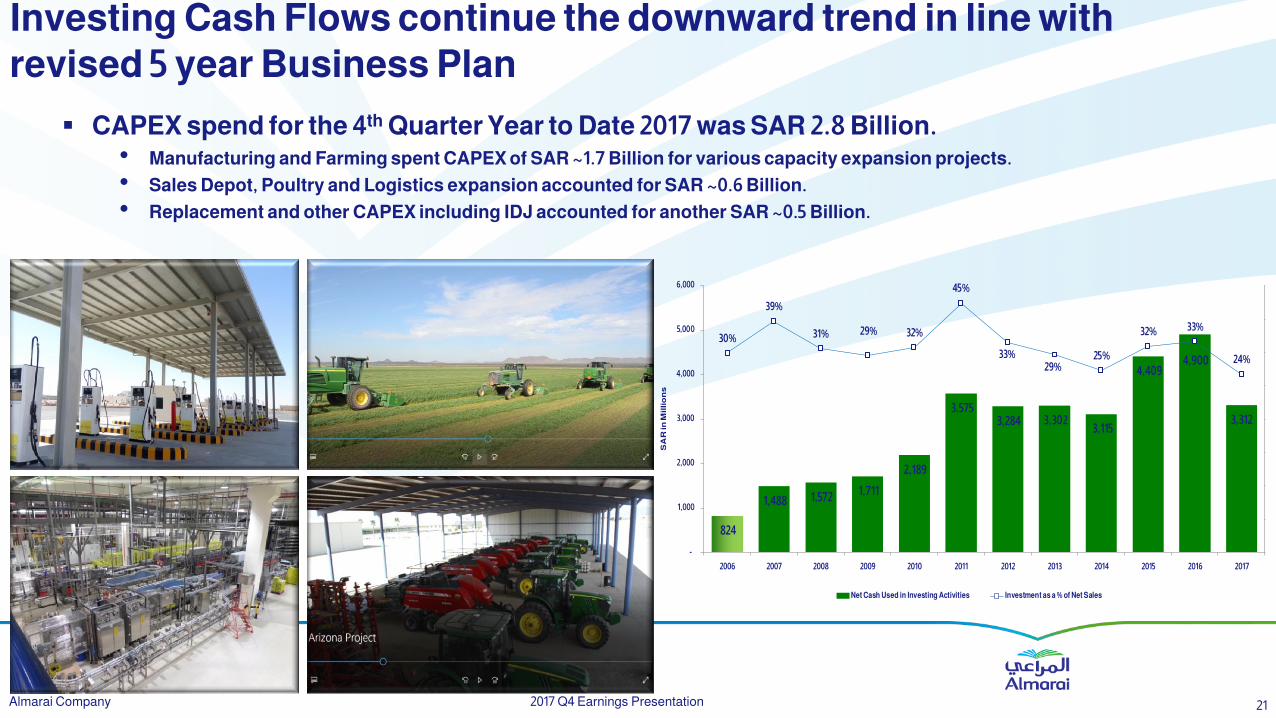
Investing Cash Flows continue the downward trend in line with
revised 5 year Business Plan
• Manufacturing and Farming spent CAPEX of SAR ~1.7 Billion for various capacity expansion projects.
• Sales Depot, Poultry and Logistics expansion accounted for SAR ~0.6 Billion.
• Replacement and other CAPEX including IDJ accounted for another SAR ~0.5 Billion.
CAPEX spend for the 4th Quarter Year to Date 2017 was SAR 2.8 Billion.
2017 Q4 Earnings Presentation 21 Almarai Company
824
1,488 1,572 1,711
2,189
3,575 3,284 3,302
3,115
4,409 4,900
3,312
30%
39%
31% 29% 32%
45%
33%29%
25%
32% 33%
24%
-30 %
-20 %
-10%
0%
10 %
20 %
30 %
40 %
50 %
-
1,000
2,000
3,000
4,000
5,000
6,000
2006 2007 2008 2009 2010 2011 2012 2013 2014 2015 2016 2017
SA
R i
n M
illi
on
s
Net Cash Used in Investing Activities Investment as a % of Net Sales
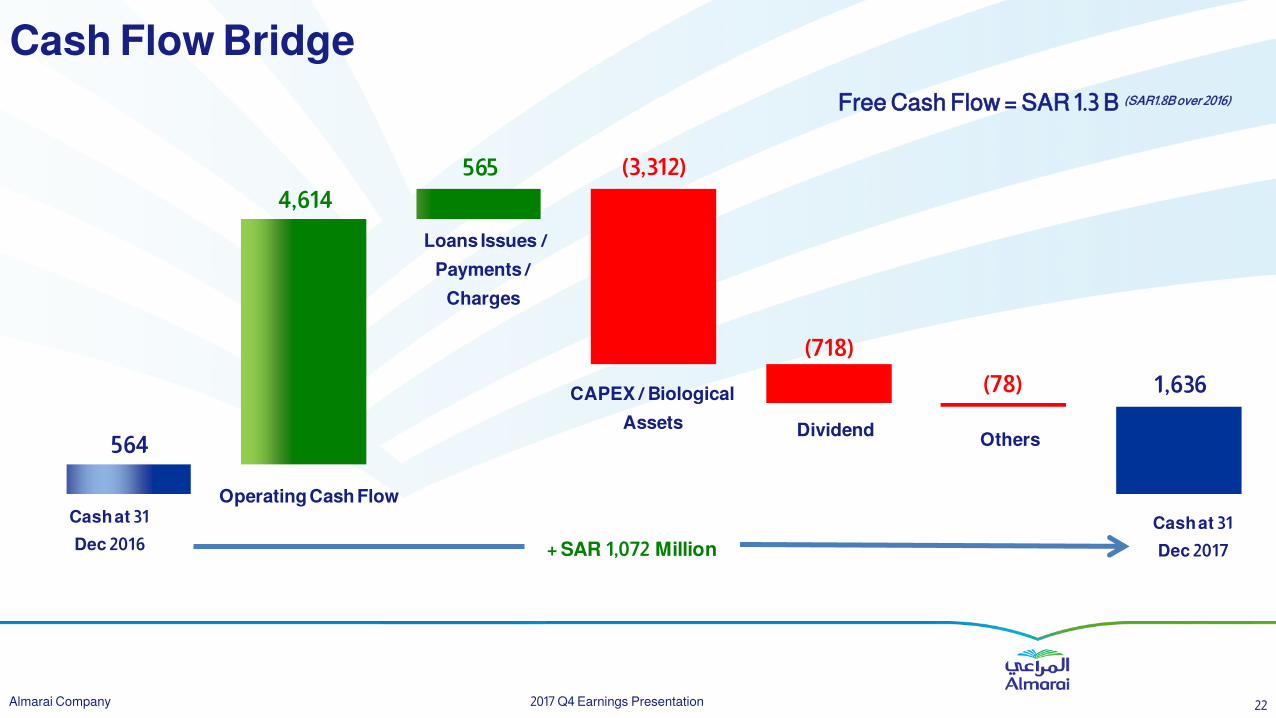
Cash Flow Bridge
2017 Q4 Earnings Presentation 22 Almarai Company
564
4,614
565 (3,312)
(718)
(78) 1,636
Cash at 31
Dec 2016
Operating Cash Flow
CAPEX / Biological
Assets DividendOthers
Cash at 31
Dec 2017+ SAR 1,072 Million
Loans Issues /
Payments /
Charges
Free Cash Flow = SAR 1.3 B (SAR1.8B over 2016)
Key Trends New Slide
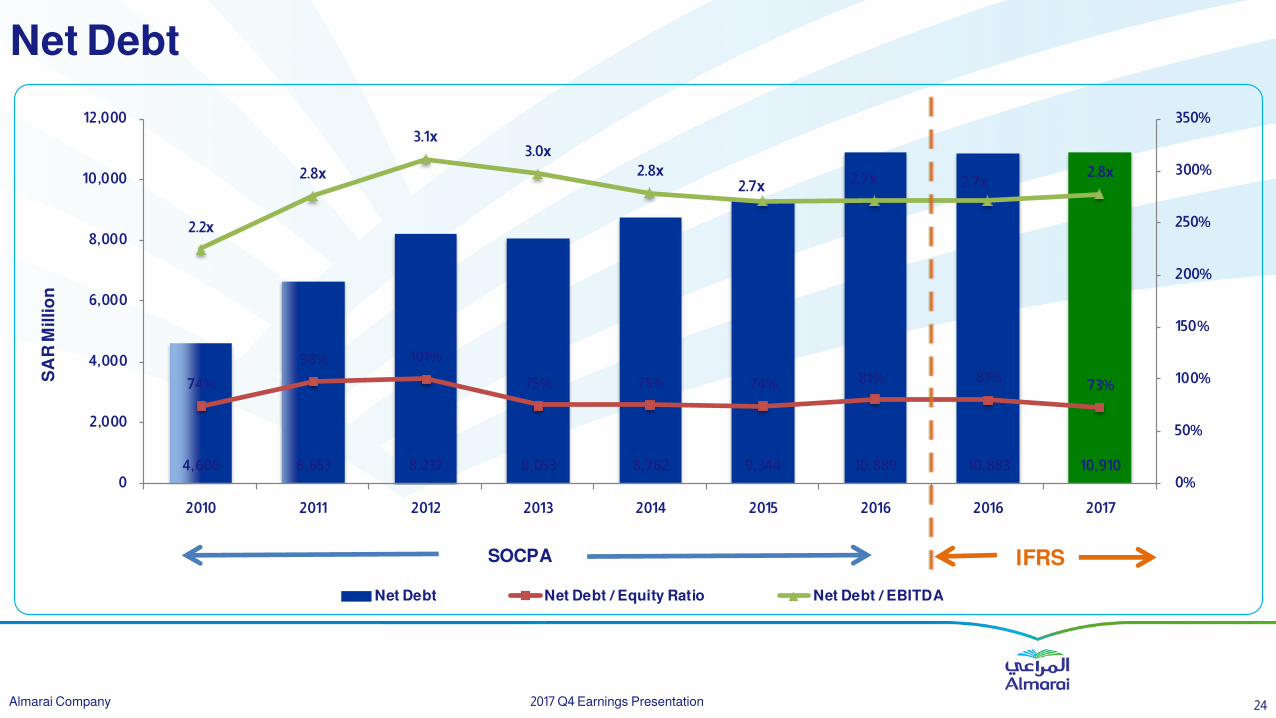
Net Debt
2017 Q4 Earnings Presentation 24 Almarai Company
4,606 6,653 8,237 8,053 8,762 9,344 10,889 10,883 10,910
74%
98% 101%
75% 75% 74% 81% 81% 73%
2.2x
2.8x
3.1x 3.0x
2.8x 2.7x
2.7x 2.7x 2.8x
0%
50%
100%
150%
200%
250%
300%
350%
0
2,000
4,000
6,000
8,000
10,000
12,000
2010 2011 2012 2013 2014 2015 2016 2016 2017
Net Debt Net Debt / Equity Ratio Net Debt / EBITDA
SA
R M
illi
on
SOCPA IFRS
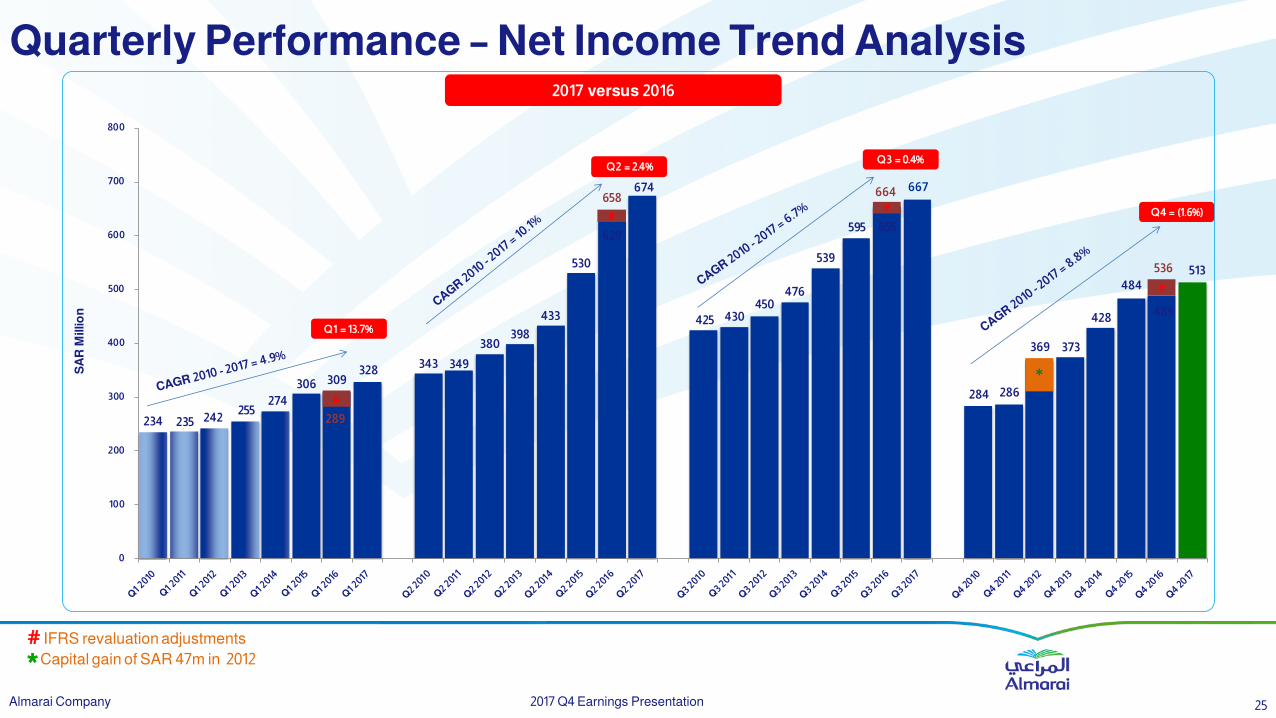
Quarterly Performance – Net Income Trend Analysis
2017 Q4 Earnings Presentation 25 Almarai Company
# IFRS revaluation adjustments
Capital gain of SAR 47m in 2012 *
234 235 242 255
274
306 309 328
343 349
380 398
433
530
629
674
425 430 450
476
539
595 655
667
284 286
369 373
428
484
489
513
0
100
200
300
400
500
600
700
800
SA
R M
illi
on
2017 versus 2016
Q1 = 13.7%
*#
289
Q 2 = 2.4%
#
658
Q3 = 0.4%
#
664
Q4 = (1.6%)
#
536
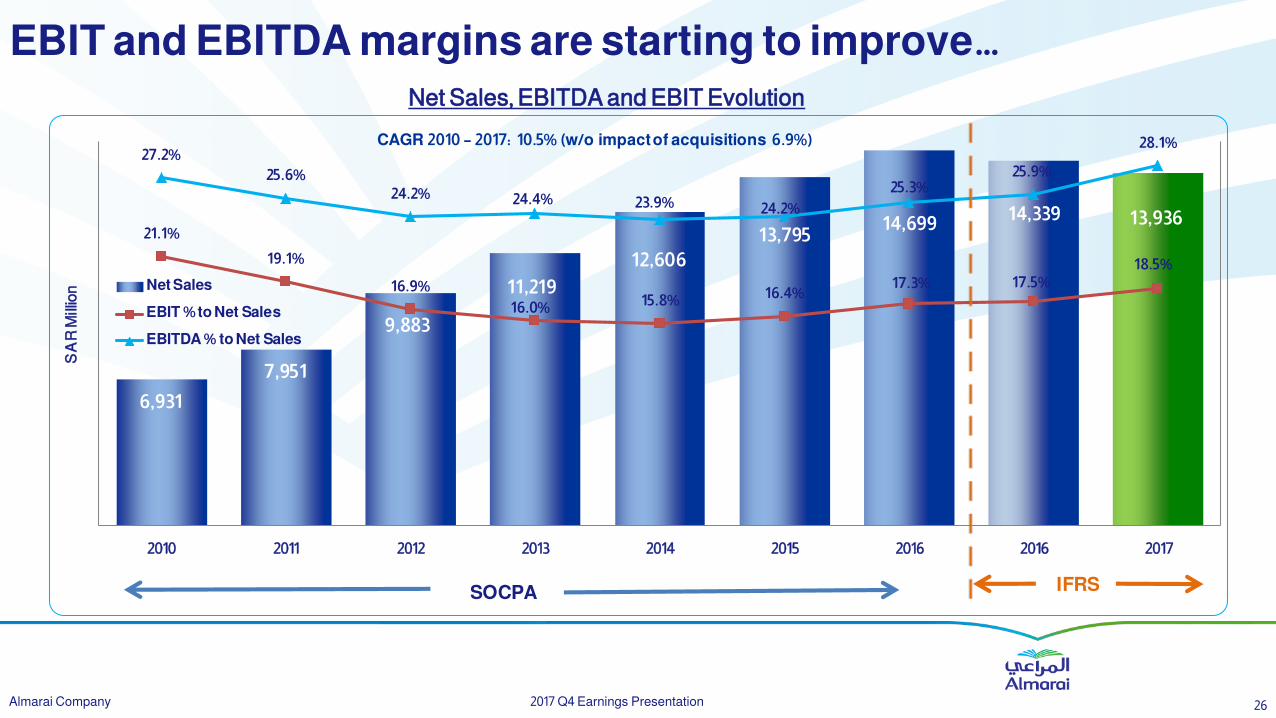
EBIT and EBITDA margins are starting to improve…
Net Sales, EBITDA and EBIT Evolution
2017 Q4 Earnings Presentation 26 Almarai Company
6,931
7,951
9,883
11,219
12,606
13,79514,699
14,339 13,93621.1%
19.1%
16.9%
16.0%15.8%
16.4%17.3% 17.5%
18.5%
27.2%
25.6%
24.2% 24.4% 23.9% 24.2%
25.3%25.9%
28.1%
2010 2011 2012 2013 2014 2015 2016 2016 2017
SA
R M
illio
n Net Sales
EBIT % to Net Sales
EBITDA % to Net Sales
CAGR 2010 – 2017: 10.5% (w/o impact of acquisitions 6.9%)
SOCPA IFRS
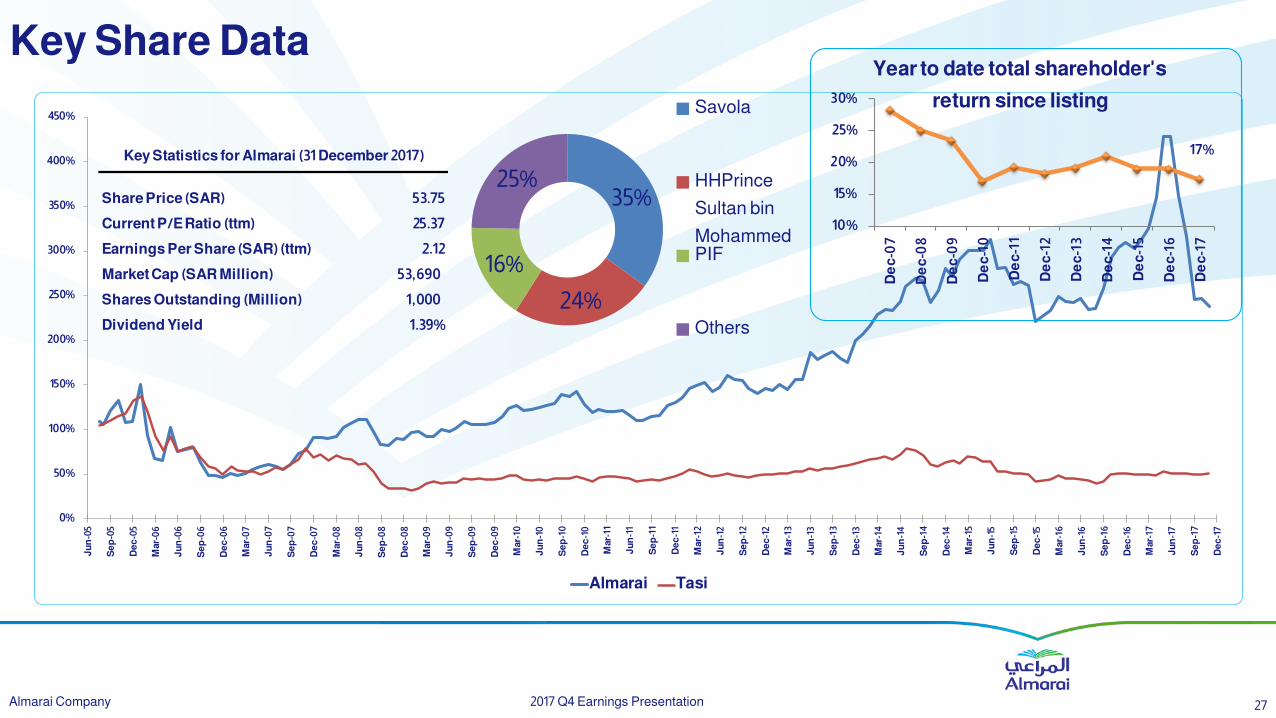
Key Share Data
2017 Q4 Earnings Presentation 27 Almarai Company
0%
50%
100%
150%
200%
250%
300%
350%
400%
450%
Ju
n-0
5
Se
p-0
5
De
c-0
5
Ma
r-0
6
Ju
n-0
6
Se
p-0
6
De
c-0
6
Ma
r-0
7
Ju
n-0
7
Se
p-0
7
De
c-0
7
Ma
r-0
8
Ju
n-0
8
Se
p-0
8
De
c-0
8
Ma
r-0
9
Ju
n-0
9
Se
p-0
9
De
c-0
9
Ma
r-10
Ju
n-1
0
Se
p-1
0
De
c-1
0
Ma
r-11
Ju
n-1
1
Se
p-1
1
De
c-1
1
Ma
r-12
Ju
n-1
2
Se
p-1
2
De
c-1
2
Ma
r-13
Ju
n-1
3
Se
p-1
3
De
c-1
3
Ma
r-14
Ju
n-1
4
Se
p-1
4
De
c-1
4
Ma
r-15
Ju
n-1
5
Se
p-1
5
De
c-1
5
Ma
r-16
Ju
n-1
6
Se
p-1
6
De
c-1
6
Ma
r-17
Ju
n-1
7
Se
p-1
7
De
c-1
7
Almarai Tasi
Share Price (SAR) 53.75
Current P/E Ratio (ttm) 25.37
Earnings Per Share (SAR) (ttm) 2.12
Market Cap (SAR Million) 53,690
Shares Outstanding (Million) 1,000
Dividend Yield 1.39%
Key Statistics for Almarai (31 December 2017)
35%
24%
16%
25%
Savola
HHPrince
Sultan bin
MohammedPIF
Others
17%
10%
15%
20%
25%
30%
De
c-0
7
De
c-0
8
De
c-0
9
De
c-1
0
De
c-1
1
De
c-1
2
De
c-1
3
De
c-1
4
De
c-1
5
De
c-1
6
De
c-1
7
Year to date total shareholder's
return since listing
www.almarai.com
Thank you
QR Code for Almarai IR App.
“We will encourage our major corporations to expand across borders
and take their rightful place in global markets”
For Investor Relations matters please contact: