alliance for aquatic resource monitoring (allarm) · pdf filealliance for aquatic resource...
TRANSCRIPT

1
Alliance for Aquatic Resource Monitoring (ALLARM)
Shale Gas Volunteer Monitoring Program
Quality Assurance Project Plan
Updated: October 6, 2015
2
SECTION A – PROJECT MANAGEMENT
A1. Title of Plan and Approval Sheet
Quality Assurance Project Plan Shale Gas Volunteer Monitoring Program
Alliance for Aquatic Resource Monitoring (ALLARM) January 2014
Prepared by: Candie Wilderman, Professor of Environmental Science; Science Advisor for ALLARM and Jinnieth Monismith, ALLARM Assistant Director
Julie Vastine, Program Director ALLARM
Jinnieth Monismith, Quality Assurance Manager
ALLARM Holden Sparacino, Outreach and Data Management Coordinator
ALLARM
Candie Wilderman, Science Advisor ALLARM
3
A2. Table of Contents
A PROJECT MANAGEMENT ...................................................................................................................................... 2 A1. Title of Plan and Approval Sheet ................................................................................................................ 2 A2. Table of Contents ....................................................................................................................................... 3 A3. Distribution List .......................................................................................................................................... 4 A4. Project/Task Organization .......................................................................................................................... 4 A5. Problem Definition/Background ................................................................................................................. 6 A6. Project/Task Description ............................................................................................................................ 7 A7. Data Quality Objectives for Measurement Data ........................................................................................ 9 A8. Training Requirements/Certification ........................................................................................................ 10 A9. Documents and Records ........................................................................................................................... 11
B DATA GENERATION AND ACQUISITION ............................................................................................................. 12 B1. Sampling Process Design .......................................................................................................................... 12 B2. Sampling Methods Requirements ............................................................................................................ 13 B3. Sample Handling and Custody Requirements .......................................................................................... 13 B4. Analytical Methods Requirements ........................................................................................................... 14 B5. Quality Control Requirements .................................................................................................................. 14 B6. Instrument/Equipment Testing, Inspection and Maintenance Requirements ......................................... 15 B7. Instrument/Equipment Calibration and Frequency ................................................................................. 15 B8. Inspection/Acceptance for Supplies and Consumables ............................................................................ 15 B9. Data Acquisition Requirements ............................................................................................................... 15 B10. Data Management .................................................................................................................................... 15
C ASSESSMENT AND OVERSIGHT .......................................................................................................................... 17 C1. Assessment and Response Actions ........................................................................................................... 17 C2. Reports to Management .......................................................................................................................... 18
D DATA VALIDATION AND USABILITY ................................................................................................................... 18 D1. Data Review, Verification and Validation Requirements ......................................................................... 18 D2. Validation and Verification Methods ........................................................................................................ 18 D3. Reconciliation with Data Quality Objectives ............................................................................................ 19
List of Tables Table 1: Project Implementation Personnel .................................................................................................................. 4 Table 2: Precision, Accuracy and Measurement Range Objectives. .............................................................................. 9 Table 3: Summary of Sampling Design ........................................................................................................................ 12 Table 4: Summary of Sampling Protocols and Equipment .......................................................................................... 13 Table 5: Summary of Analytical Methods .................................................................................................................... 15 List of Figures Figure 1: Project Organizational Chart .......................................................................................................................... 5 Figure 2: Areal Extent of the Marcellus and Utica Shale Formations. ........................................................................... 6 List of Appendices Appendix A: ALLARM Shale Gas Monitoring Workshop Agenda ................................................................................. 20 Appendix B1: Chemical and Stage Monitoring Data Sheet . ........................................................................................ 21 Appendix B2: QA/QC Form .......................................................................................................................................... 22 Appendix B3: Visual Assessment Checklist . ................................................................................................................ 23 Appendix B4: Image of Excel Spreadsheet .................................................................................................................. 24
Works Cited ................................................................................................................................................................. 25
4
A3. Distribution List Each person listed on the approval sheet and each person listed under Project/Task Organization will receive a copy of this Quality Assurance Project Plan (QAPP). Individuals and other organizations taking part in the project may request copies of the QAPP from personnel listed under Section A4. This document has been prepared according to the United States Environmental Protection Agency publication The Volunteer Monitor’s Guide to Quality Assurance Project Plans, EPA 841-B-96-003, 1996, available on line at http://water.epa.gov/type/rsl/monitoring/qappcovr.cfm and EPA Requirements for Quality Assurance Project Plans, EPA QA/R-5, 2001, available on line at http://www.epa.gov/quality/qs-docs/r5-final.pdf.
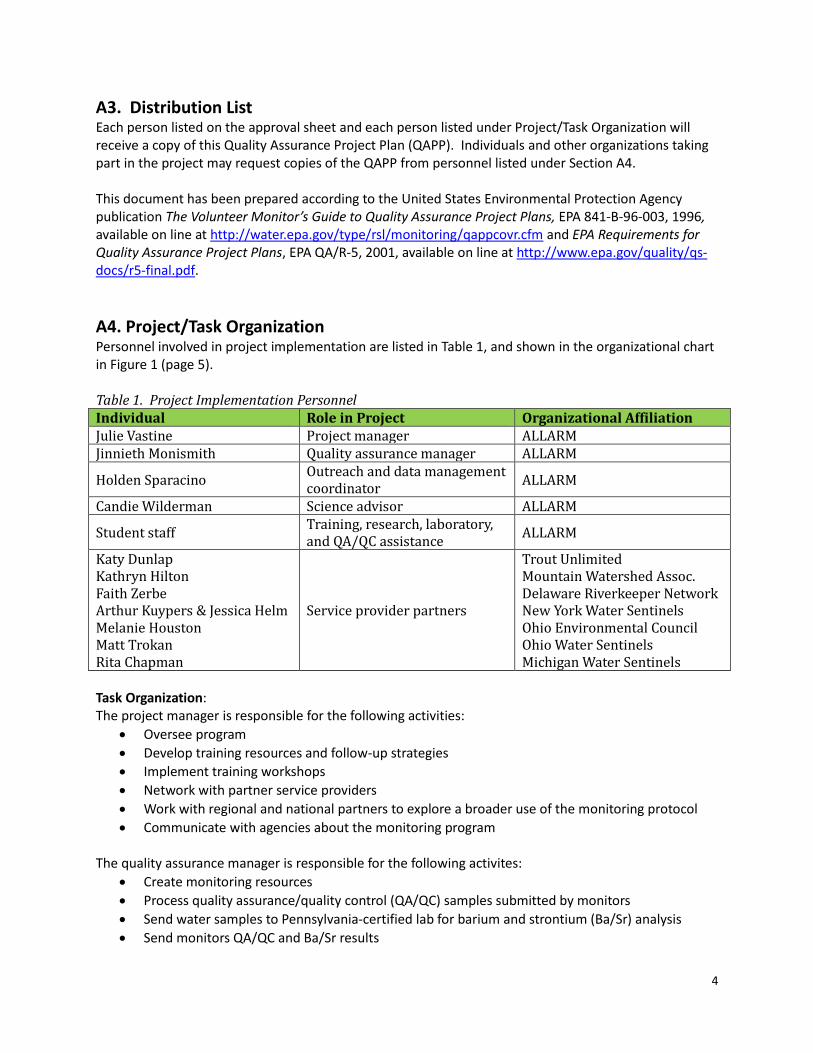
A4. Project/Task Organization Personnel involved in project implementation are listed in Table 1, and shown in the organizational chart in Figure 1 (page 5). Table 1. Project Implementation Personnel Individual Role in Project Organizational Affiliation Julie Vastine Project manager ALLARM Jinnieth Monismith Quality assurance manager ALLARM
Holden Sparacino Outreach and data management coordinator
ALLARM
Candie Wilderman Science advisor ALLARM
Student staff Training, research, laboratory, and QA/QC assistance
ALLARM
Katy Dunlap Kathryn Hilton Faith Zerbe Arthur Kuypers & Jessica Helm Melanie Houston Matt Trokan Rita Chapman
Service provider partners
Trout Unlimited Mountain Watershed Assoc. Delaware Riverkeeper Network New York Water Sentinels Ohio Environmental Council Ohio Water Sentinels Michigan Water Sentinels
Task Organization: The project manager is responsible for the following activities:
Oversee program
Develop training resources and follow-up strategies
Implement training workshops
Network with partner service providers
Work with regional and national partners to explore a broader use of the monitoring protocol
Communicate with agencies about the monitoring program The quality assurance manager is responsible for the following activites:
Create monitoring resources
Process quality assurance/quality control (QA/QC) samples submitted by monitors
Send water samples to Pennsylvania-certified lab for barium and strontium (Ba/Sr) analysis
Send monitors QA/QC and Ba/Sr results
5
Review and QC incoming data from monitors The outreach and data management coordinator is responsible for the following activities:
Advertise and promote upcoming shale gas workshops
Implement training workshops
Provide follow-up assistance and support for shale gas monitoring groups
Assist with data management strategies and data wrangling The science advisor is responsible for the following activities:
Develop scientific protocols
Develop training workshops
Network with the scientific and research community The student staff is responsible for the following activities:
Assist with training workshops
Assist with protocol research
Assist in laboratory analysis
Assist with data management
Service provider partners are responsible for:
Assist with organizing training workshops – securing location and advertising event
Communicate directly with local community and watershed organizations Volunteers and Data Users (Organizational Chart): Volunteers collect field data at their chosen sties and are trained to act upon that data, should they find a reportable event. Volunteers are therefore the primary data users. Other data users include agencies to which events are reported, as well as researchers who may access data through public databases, such as Shale Network (www.shalenetwork.org).
Figure 1. Project Organizational Chart
6
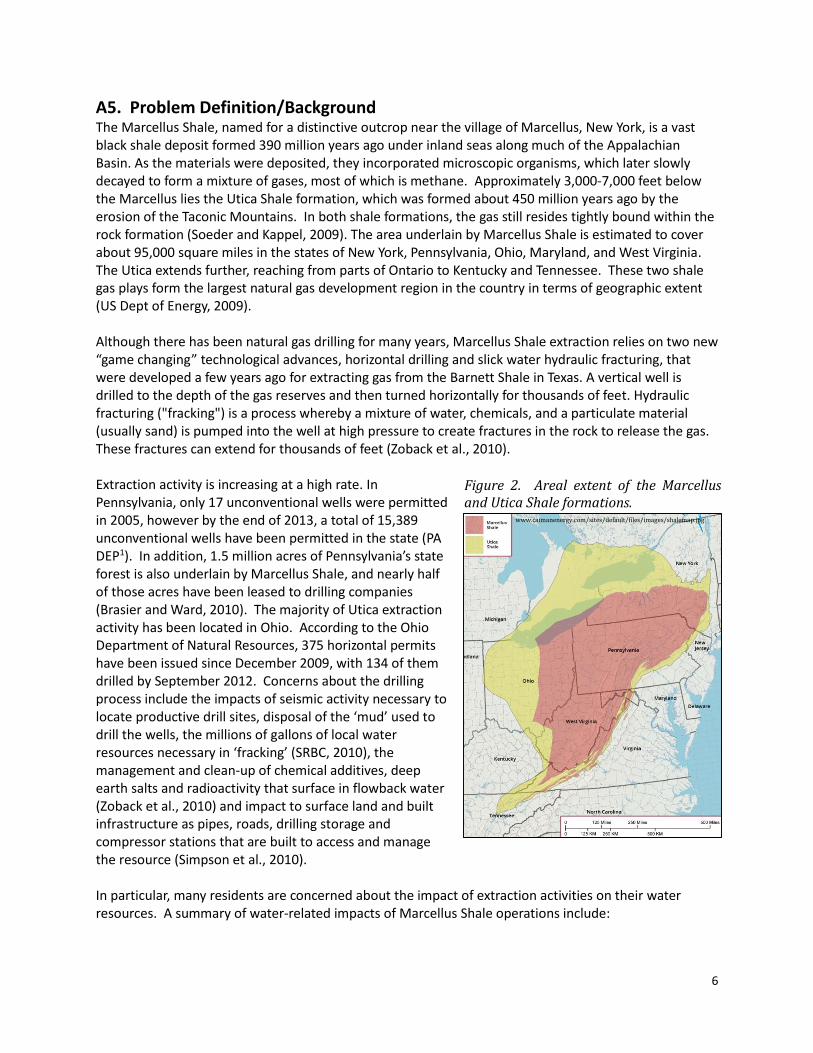
A5. Problem Definition/Background The Marcellus Shale, named for a distinctive outcrop near the village of Marcellus, New York, is a vast black shale deposit formed 390 million years ago under inland seas along much of the Appalachian Basin. As the materials were deposited, they incorporated microscopic organisms, which later slowly decayed to form a mixture of gases, most of which is methane. Approximately 3,000-7,000 feet below the Marcellus lies the Utica Shale formation, which was formed about 450 million years ago by the erosion of the Taconic Mountains. In both shale formations, the gas still resides tightly bound within the rock formation (Soeder and Kappel, 2009). The area underlain by Marcellus Shale is estimated to cover about 95,000 square miles in the states of New York, Pennsylvania, Ohio, Maryland, and West Virginia. The Utica extends further, reaching from parts of Ontario to Kentucky and Tennessee. These two shale gas plays form the largest natural gas development region in the country in terms of geographic extent (US Dept of Energy, 2009). Although there has been natural gas drilling for many years, Marcellus Shale extraction relies on two new “game changing” technological advances, horizontal drilling and slick water hydraulic fracturing, that were developed a few years ago for extracting gas from the Barnett Shale in Texas. A vertical well is drilled to the depth of the gas reserves and then turned horizontally for thousands of feet. Hydraulic fracturing ("fracking") is a process whereby a mixture of water, chemicals, and a particulate material (usually sand) is pumped into the well at high pressure to create fractures in the rock to release the gas. These fractures can extend for thousands of feet (Zoback et al., 2010).
Extraction activity is increasing at a high rate. In Pennsylvania, only 17 unconventional wells were permitted in 2005, however by the end of 2013, a total of 15,389 unconventional wells have been permitted in the state (PA DEP1). In addition, 1.5 million acres of Pennsylvania’s state forest is also underlain by Marcellus Shale, and nearly half of those acres have been leased to drilling companies (Brasier and Ward, 2010). The majority of Utica extraction activity has been located in Ohio. According to the Ohio Department of Natural Resources, 375 horizontal permits have been issued since December 2009, with 134 of them drilled by September 2012. Concerns about the drilling process include the impacts of seismic activity necessary to locate productive drill sites, disposal of the ‘mud’ used to drill the wells, the millions of gallons of local water resources necessary in ‘fracking’ (SRBC, 2010), the management and clean-up of chemical additives, deep earth salts and radioactivity that surface in flowback water (Zoback et al., 2010) and impact to surface land and built infrastructure as pipes, roads, drilling storage and compressor stations that are built to access and manage the resource (Simpson et al., 2010). In particular, many residents are concerned about the impact of extraction activities on their water resources. A summary of water-related impacts of Marcellus Shale operations include:
www.caimanenergy.com/sites/default/files/images/shalemap.jpg
Figure 2. Areal extent of the Marcellus and Utica Shale formations.
7
Impact of withdrawals and consumptive use of large amounts of water on small streams and local water supplies;
Potential for surface and ground water contamination from poor casing of well bores, accidental spills, flooding of well pads in floodplains, and the poor handling, treatment and disposal of fracking and flowback fluids;
Land disturbance and runoff from well pads, pipelines, increased trucking activity and access roads;
Air pollution from transport vehicles, compression stations, pipelines and well pad activities, much of which translates into water pollution; and
Fragmentation of sensitive lands adjacent to water bodies.
Experience in the state has demonstrated that spills and accidents are common. According to the Pennsylvania Department of Environmental Protection (PA DEP2), 1,643 unconventional wells were inspected in Pennsylvania between 2005 and 2013, with recorded violations totaling 4,688. With such a rapid growth of activities, our state agencies are simply not able to provide the oversight to assure that environmental impacts are systematically documented and mitigated. For this reason, members of many communities who are impacted by Marcellus gas extraction activities have asked ALLARM to provide technical assistance and training for them to act as watchdogs of their resources.
The objectives of this project are:
1) Early detection of contamination of small streams and of disturbance in the surrounding watersheds of gas extraction activities.
2) Prevention of future environmental impact through the continuing presence of watchful residents.
3) Determination of cumulative impact to aquatic resources caused by drilling activities.
The protocol that is being used is a “red flag warning” protocol. Volunteers are trained to identify data that indicate a reportable event (ALLARM Shale Gas Volunteer Monitoring Manual, pages 36-38) and to report it to the appropriate state or local agency for action. ALLARM has developed an agreement with the PA Department of Environmental Protection, Bureau of Oil and Gas, to prioritize calls that come in from trained ALLARM volunteers. Other examples of how volunteers may use the data include:
Calling companies to report findings and seek mitigation;
Publicizing monitoring activities in newspaper articles, op ed pieces, letters to the editor, etc.;
Determining the cumulative impact from gas development;
Testifying at permit application hearings; and
Discussing findings with landowners Data are also archived and made available to professional scientists who may use the data in their research.
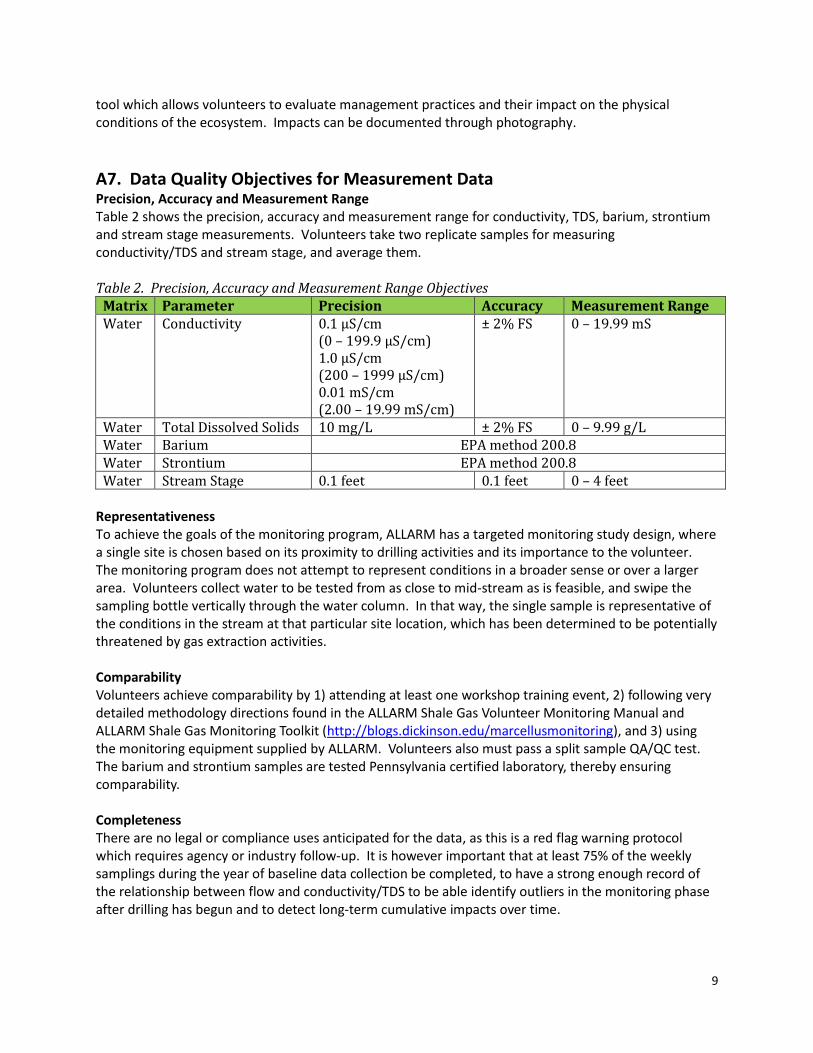
A6. Project/Task Description Ideally, volunteers will monitor a single stream site for one year prior to drilling to establish baseline data. Once drilling and gas extraction begins, volunteers will continue to monitor on a weekly basis, until such time that the drilling activities are completed or that the volunteers decide that the resource
8
and/or landscape is no longer in danger of contamination or disruption. Volunteers will choose their site locations either at the time of the initial training or at a follow-up meeting. They will do so by first accessing available information in their watershed concerning water withdrawals and drilling permits. They will also consider accessibility, safety, and resources. After volunteers choose the location of their sites, they will document the latitude and longitude of the location using GPS, and perform chemical analysis, stream stage measurement, and a visual assessment on a weekly basis in the field. Volunteers will fill out data sheets on site, and then following data collection, data will be entered into an Excel spreadsheet, which will automatically graph the data to show the relationship between stream stage and conductivity. All data will be archived in a local database by the groups’ local data manager. Once the databases are in place, data will also be archived in central databases such as Shale Network. Once central archiving of the data is achieved, there will be the ability to map and compile data online by other interested users. If there is evidence of an outlier or possible reportable event, the volunteers will consult the decision trees in the ALLARM Shale Gas Monitoring Manual (Wilderman and Monismith, 2012) to determine if the event is reportable and to whom the report should be made. Chemical Analysis Since there are hundreds of different chemicals found in the waters associated with gas extraction, it is not possible to test for each possible constituent. The ALLARM protocol assesses two indicator chemicals: conductivity and total dissolved solids (TDS). A large increase in conductivity/TDS is an indicator that the water may be impacted by spills or leaks from gas extraction and other activities. In addition to using conductivity/TDS as indicator parameters, signature parameters, that is, those chemicals that point to gas extraction activities as the cause for the increase in conductivity, are measured twice a year. Although the composition of flowback water varies quite a bit, two parameters are almost always found: Barium (Ba) and Strontium (Sr).1 These two analytes will will be used as signature chemicals. Simply put, if conductivity/TDS is high, we then test for Ba and Sr, and if they are high also, we assume that the source of impact is Marcellus Shale flowback water. Volunteers will collect water to be tested in a certified laboratory for Ba and Sr two times per year (ideally during high and low flows) for background information, and then again if the conductivity/TDS indicates a possible reportable event. Stream Stage Volunteers will measure stream stage (the depth of the water at a given point) in order to understand the relationship between stream flow and the conductivity/TDS values in the stream. Understanding this relationship helps to decide whether increases or decreases in conductivity/TDS are simply due to changes in flow, or to a contamination event. Visual Observations Volunteers will systematically make and record visual observations on land disturbances, spills and discharges, gas migration and leakages, and best management practices for multiple stages of the gas extraction process from well pad preparation to pipeline construction. Visual assessment is a powerful
1 The New York Department of Environmental Conservation completed a draft Environmental Impact Statement on the gas regulatory program in September, 2009. They reported typical concentrations of flowback constituents based on limited samples from PA and WV. There were more than 75 different chemicals listed.
9
tool which allows volunteers to evaluate management practices and their impact on the physical conditions of the ecosystem. Impacts can be documented through photography.
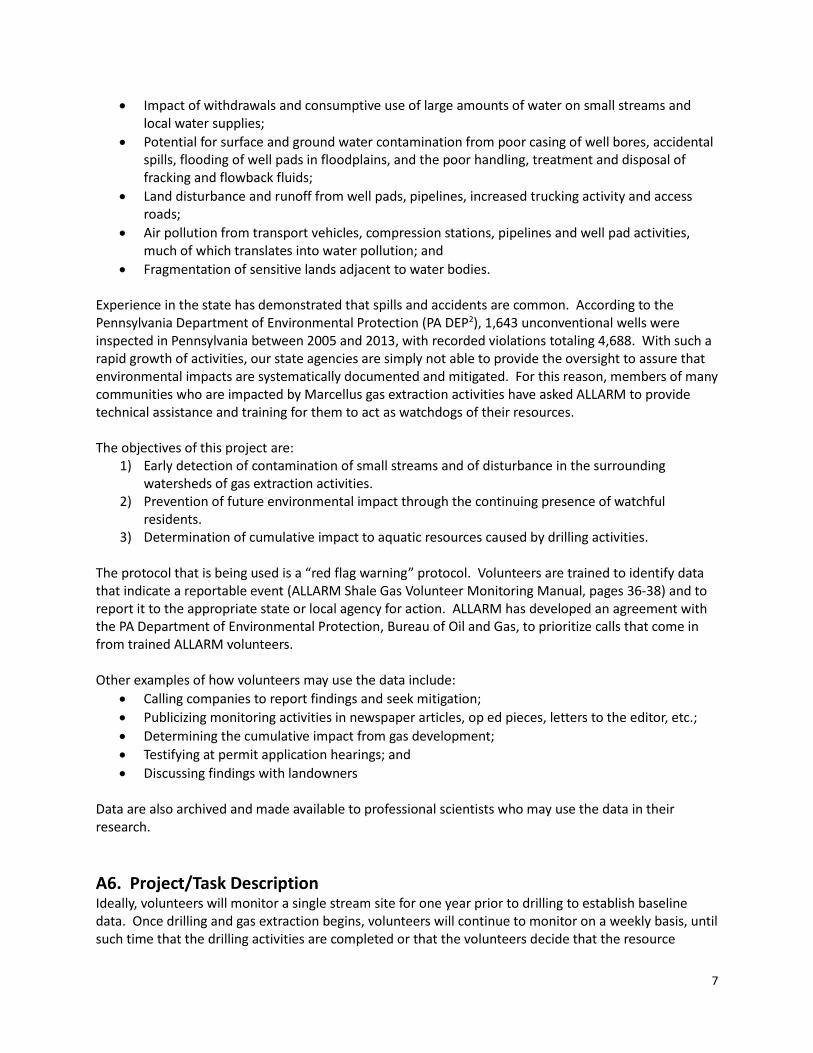
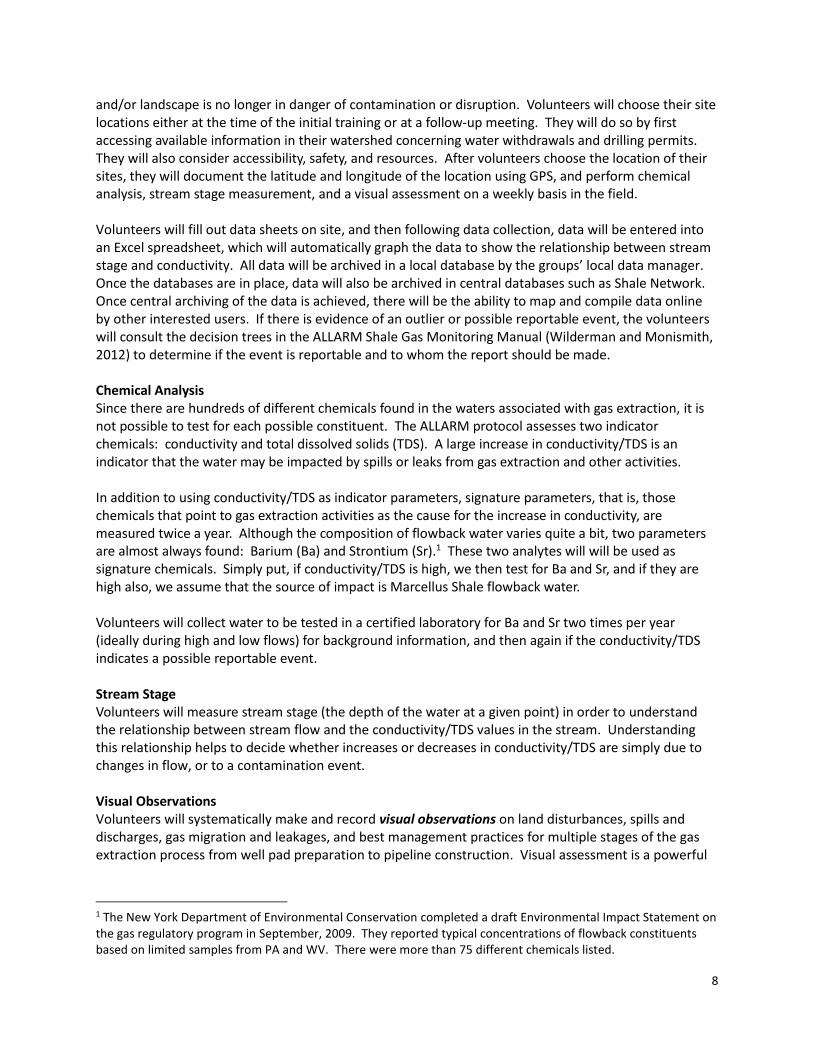
A7. Data Quality Objectives for Measurement Data Precision, Accuracy and Measurement Range Table 2 shows the precision, accuracy and measurement range for conductivity, TDS, barium, strontium and stream stage measurements. Volunteers take two replicate samples for measuring conductivity/TDS and stream stage, and average them. Table 2. Precision, Accuracy and Measurement Range Objectives
Matrix Parameter Precision Accuracy Measurement Range Water Conductivity 0.1 µS/cm
(0 – 199.9 µS/cm) 1.0 µS/cm (200 – 1999 µS/cm) 0.01 mS/cm (2.00 – 19.99 mS/cm)
± 2% FS 0 – 19.99 mS
Water Total Dissolved Solids 10 mg/L ± 2% FS 0 – 9.99 g/L Water Barium EPA method 200.8 Water Strontium EPA method 200.8 Water Stream Stage 0.1 feet 0.1 feet 0 – 4 feet
Representativeness To achieve the goals of the monitoring program, ALLARM has a targeted monitoring study design, where a single site is chosen based on its proximity to drilling activities and its importance to the volunteer. The monitoring program does not attempt to represent conditions in a broader sense or over a larger area. Volunteers collect water to be tested from as close to mid-stream as is feasible, and swipe the sampling bottle vertically through the water column. In that way, the single sample is representative of the conditions in the stream at that particular site location, which has been determined to be potentially threatened by gas extraction activities. Comparability Volunteers achieve comparability by 1) attending at least one workshop training event, 2) following very detailed methodology directions found in the ALLARM Shale Gas Volunteer Monitoring Manual and ALLARM Shale Gas Monitoring Toolkit (http://blogs.dickinson.edu/marcellusmonitoring), and 3) using the monitoring equipment supplied by ALLARM. Volunteers also must pass a split sample QA/QC test. The barium and strontium samples are tested Pennsylvania certified laboratory, thereby ensuring comparability. Completeness There are no legal or compliance uses anticipated for the data, as this is a red flag warning protocol which requires agency or industry follow-up. It is however important that at least 75% of the weekly samplings during the year of baseline data collection be completed, to have a strong enough record of the relationship between flow and conductivity/TDS to be able identify outliers in the monitoring phase after drilling has begun and to detect long-term cumulative impacts over time.
10
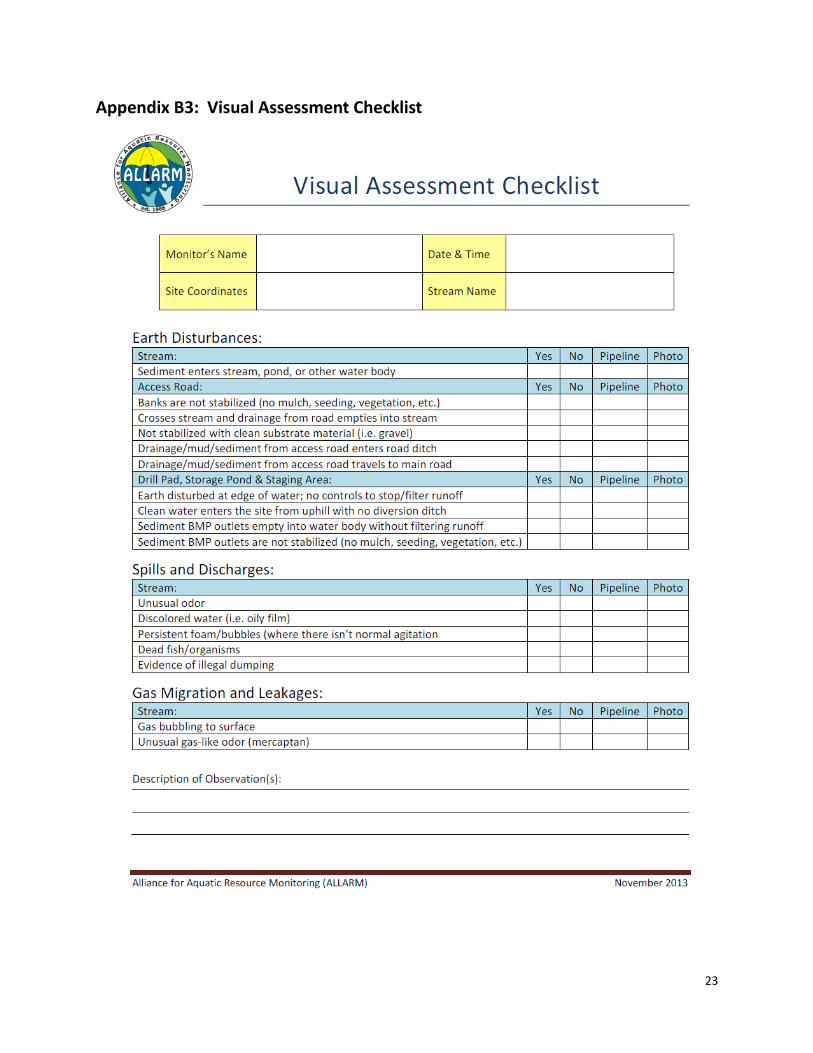
Qualitative measurements The visual assessment process is not quantitative and so it is not possible to state data quality objectives in terms of precision, accuracy or measurement range. A detailed visual assessment checklist (ALLARM Shale Gas Volunteer Monitoring Manual, page 34) is required to be completed every week over the same designated reach of the stream; if there are any concerns, volunteers are encouraged to photograph the impact for documentation. It is expected that a visual assessment will be completed at every sampling event. Comparability is insured in part by the extensive training that volunteers receive and their access to photographs of different disturbance scenarios on the ALLARM Shale Gas Monitoring Toolkit (http://blogs.dickinson.edu/marcellusmonitoring/).
A8. Training Requirements/Certification
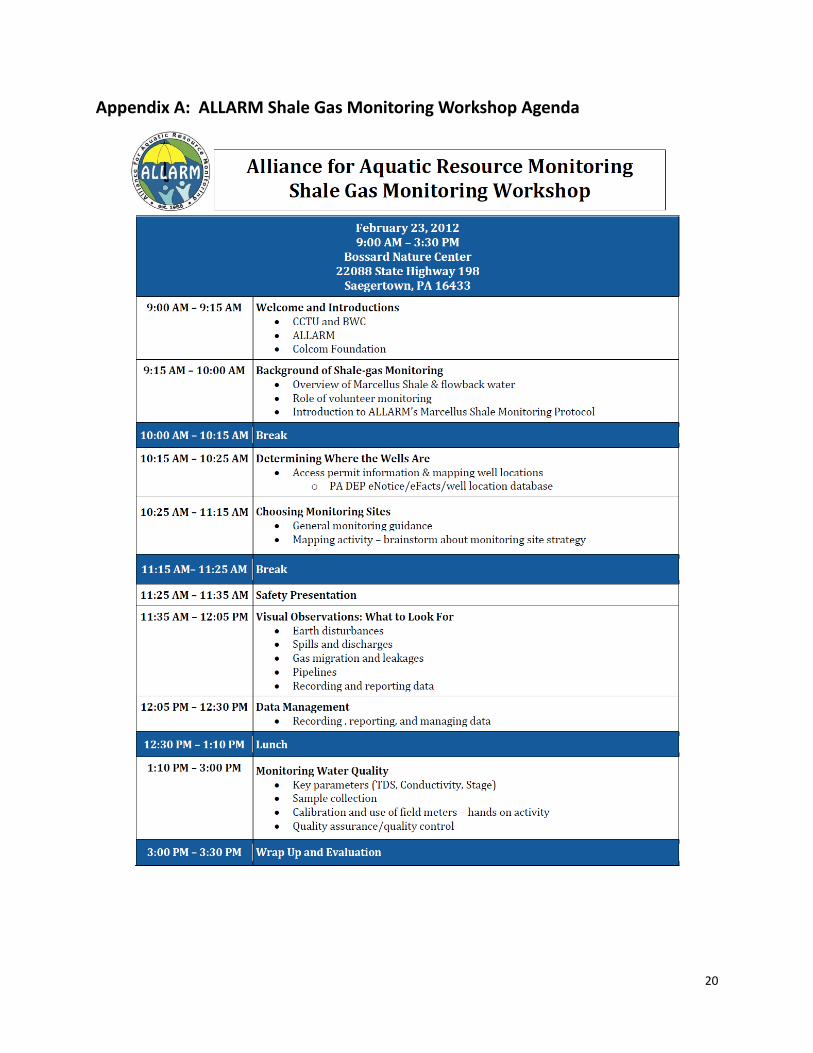
Volunteers are required to attend a one-day training workshop in their region. The workshop includes2:
background information on the science of shale gas extraction and flowback water;
role of volunteer monitoring;
training on accessing permit locations;
hands-on training on choosing site locations, using a case study;
safety information;
training on visual assessment, using photographs to illustrate various examples of disturbance;
information on water quality impacts and the significance of the indicator and signature analytes that we will be measuring;
training on field methods for sample collection and stage measurement;
hands-on training to calibrate and use the LaMotte conductivity/TDS meter;
training on the method to collect samples for Ba and Sr laboratory analysis;
hands-on training on the identification of outliers or reportable events using decision trees;
training on how to prepare samples for split sample analysis for QA/QC;
training on how to record and enter data into our customized Excel database. Volunteers are given all materials needed to begin monitoring following the workshop. After they complete QA/QC successfully, they can begin their weekly monitoring. Volunteers also receive copies of the ALLARM Shale Gas Monitoring Manual, which contains all of the training information as well as all necessary data forms, and are referred to ALLARM’s Shale Gas Monitoring Toolkit, where they can access information and training videos to supplement and reinforce what they have learned at the workshop. ALLARM staff provides these training workshops on an as-needed basis. In most cases, ALLARM partners with local community and watershed groups. Funding for these workshops is provided by private foundations, state grants, and Dickinson College. Volunteer performance is evaluated at the workshop during the hands-on activities. Staff members work very closely with individual volunteers during the hands-on training exercises to be sure that they have achieved the goals of the exercises. For example, staff will work with each volunteer until they successfully calibrate their meters and make accurate measurements on the samples provided. It is expected that each volunteer will be able to identify reportable events; during the hands-on exercise to train them in this skill, staff make sure that every volunteer understands the criteria and can apply the
2 A workshop agenda can be found in Appendix A.
11
decision trees. And finally, after their first visit to their stream site, volunteers must submit a split sample to the ALLARM laboratory for analysis; their result must be within 20% of the laboratory’s result. A workshop evaluation sheet is distributed to all participants at the end of the workshop. This evaluation focuses on self-reporting of perceived levels of understanding of the important concepts covered. ALLARM staff are constantly fine-tuning and improving the pedagogy of the workshops, based in part on these evaluations from the participants.
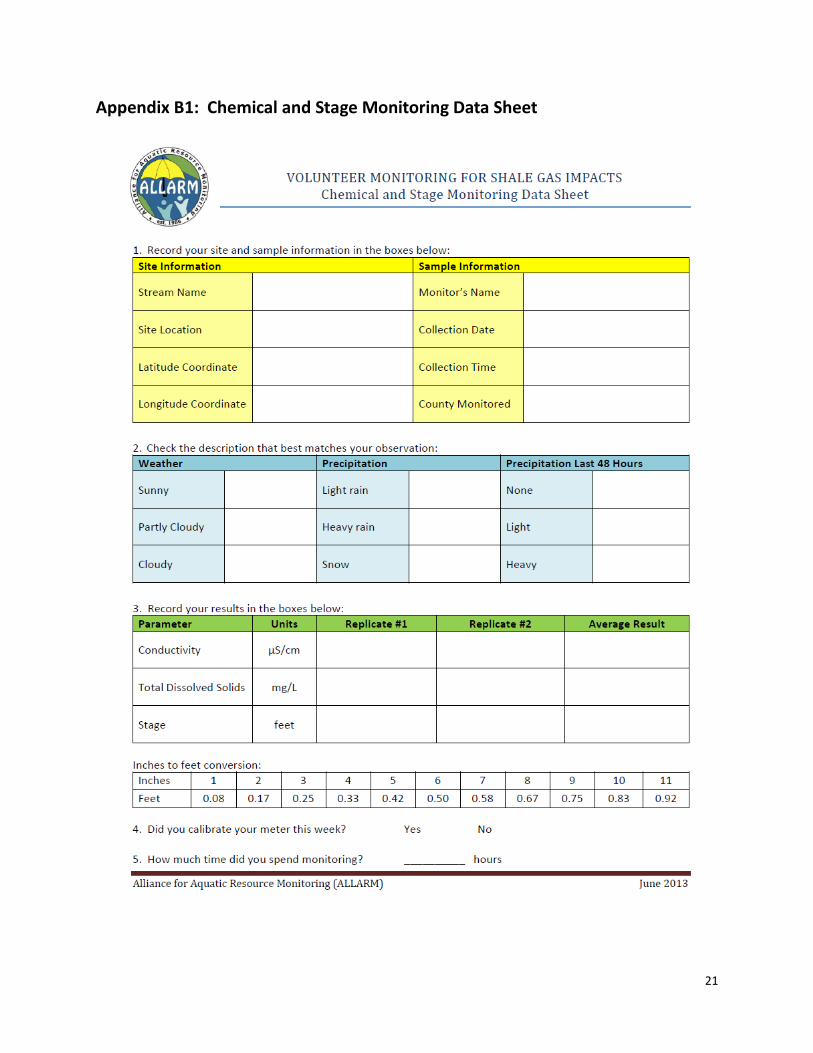
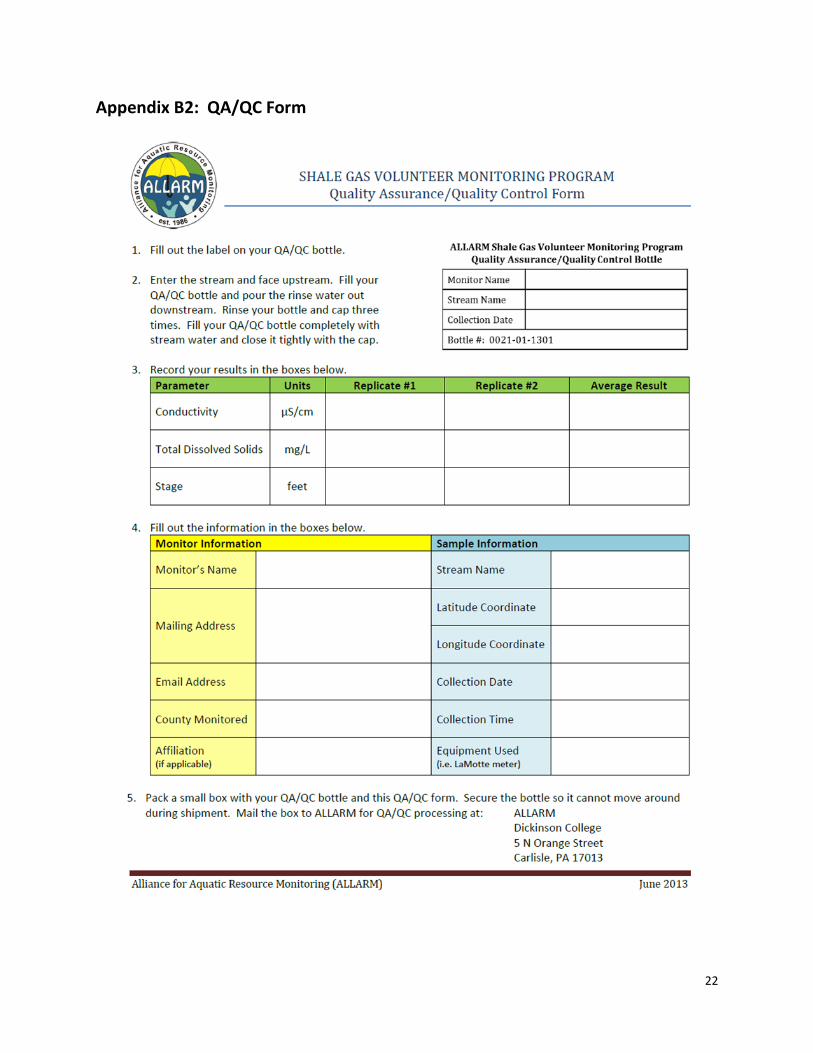
A9. Documentation and Records3 Each volunteer completes two field data sheets at the time the sampling occurs: a visual assessment checklist and a chemical and stage monitoring data sheet. If there are visual disturbances found, they are documented through photographs as well. On the field data sheet, volunteers record their name, date, time, sample site location (latitude and longitude), and sample site name. They also record weather conditions, whether or not they calibrated their meter, and time spent monitoring. The data themselves are entered into a table on the data sheet, including values for both replicates and the average. These data sheets are either archived by the volunteer for the entire sampling period and/or passed on to the watershed group leader for archiving. Upon returning from the field, each volunteer enters their data into their provided Excel spreadsheet and determines whether or not they have reportable events. These Excel files are passed on to the watershed group leader for archiving. ALLARM checks in with each new group after 2-3 months of data collection to assure that the data are being housed locally and correctly. In addition, groups are asked to send their data to ALLARM for quality control checks on an annual basis. ALLARM is currently working with several partner organizations to develop a user-friendly and secure online central database for Shale Gas volunteer data. When volunteers do split sample analysis with the ALLARM laboratory for QA/QC, they fill out a data form and send it along with the samples. Before a sample is analyzed, the monitor and sample information are entered into the laboratory Shale Gas QA/QC binder (the monitor’s results are not entered so there is no bias when recording the lab results). The same information, as well as the monitor’s results are also entered into the Shale Gas QA/QC Results Excel spreadsheet. The original QA/QC data sheets are then filed. After samples are processed for QA/QC, the samples are acidified and refrigerated until the end of the month, when they are sent to a PA-certified laboratory for barium and strontium analysis. The PA-certified laboratory tests the water samples and sends the results to ALLARM, which are then recorded into the Shale Gas QA/QC Results Excel spreadsheet and sent to the monitors. The original Ba/Sr results are then filed.
3 Copies of all forms can be found in Appendix B. (B1: Chemical and Stage Monitoring Data Sheet, B2: QA/QC Form, B3: Visual Assessment Checklist, and B4: Image of Excel Spreadsheet)
12
SECTION B – DATA GENERATION AND ACQUISITION
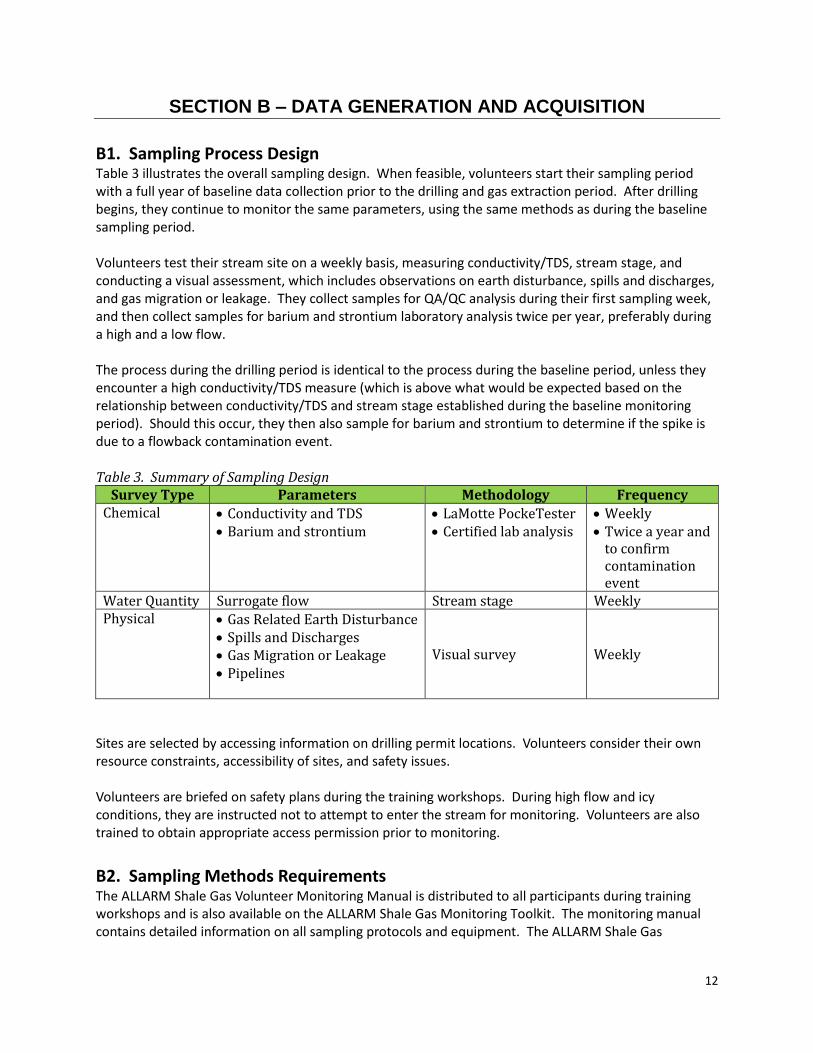
B1. Sampling Process Design Table 3 illustrates the overall sampling design. When feasible, volunteers start their sampling period with a full year of baseline data collection prior to the drilling and gas extraction period. After drilling begins, they continue to monitor the same parameters, using the same methods as during the baseline sampling period. Volunteers test their stream site on a weekly basis, measuring conductivity/TDS, stream stage, and conducting a visual assessment, which includes observations on earth disturbance, spills and discharges, and gas migration or leakage. They collect samples for QA/QC analysis during their first sampling week, and then collect samples for barium and strontium laboratory analysis twice per year, preferably during a high and a low flow. The process during the drilling period is identical to the process during the baseline period, unless they encounter a high conductivity/TDS measure (which is above what would be expected based on the relationship between conductivity/TDS and stream stage established during the baseline monitoring period). Should this occur, they then also sample for barium and strontium to determine if the spike is due to a flowback contamination event. Table 3. Summary of Sampling Design
Survey Type Parameters Methodology Frequency Chemical Conductivity and TDS
Barium and strontium LaMotte PockeTester Certified lab analysis
Weekly Twice a year and
to confirm contamination event
Water Quantity Surrogate flow Stream stage Weekly Physical Gas Related Earth Disturbance
Spills and Discharges Gas Migration or Leakage Pipelines
Visual survey Weekly
Sites are selected by accessing information on drilling permit locations. Volunteers consider their own resource constraints, accessibility of sites, and safety issues. Volunteers are briefed on safety plans during the training workshops. During high flow and icy conditions, they are instructed not to attempt to enter the stream for monitoring. Volunteers are also trained to obtain appropriate access permission prior to monitoring.
B2. Sampling Methods Requirements The ALLARM Shale Gas Volunteer Monitoring Manual is distributed to all participants during training workshops and is also available on the ALLARM Shale Gas Monitoring Toolkit. The monitoring manual contains detailed information on all sampling protocols and equipment. The ALLARM Shale Gas
13
Monitoring Toolkit contains additional information, such as narrated Powerpoint presentations and demonstration videos on sampling methods. Table 4 summarizes a portion of this information. Table 4. Summary of Sampling Protocols and Equipment
Parameter Sample Holding
Container
Method Sample
Preservation
Maximum Holding
Time
Monitoring Manual Pages:
Monitoring Toolkit
Click on:
Conductivity/TDS
250 mL high density polyethylene bottle
None Immediately 10-11, 23
Monitoring Resources/ Chemical & Stage
Barium & Strontium
250-mL low density polyethylene bottle
Add 5 mL of concentrated nitric acid and refrigerate
6 months 11, 26
Monitoring Resources/ Chemical & Stage
Stream Stage N/A N/A N/A 11-12, 27-31
Monitoring Resources/ Chemical & Stage
Visual Assessment
N/A N/A N/A 12-13, 34
Monitoring Resources/ Visual Assessment
Methods for sample bottle preparation and sample collection are found in Appendix A1 of the ALLARM Shale Gas Volunteer Monitoring Manual (page 22).
B3. Sample Handling and Custody Requirements
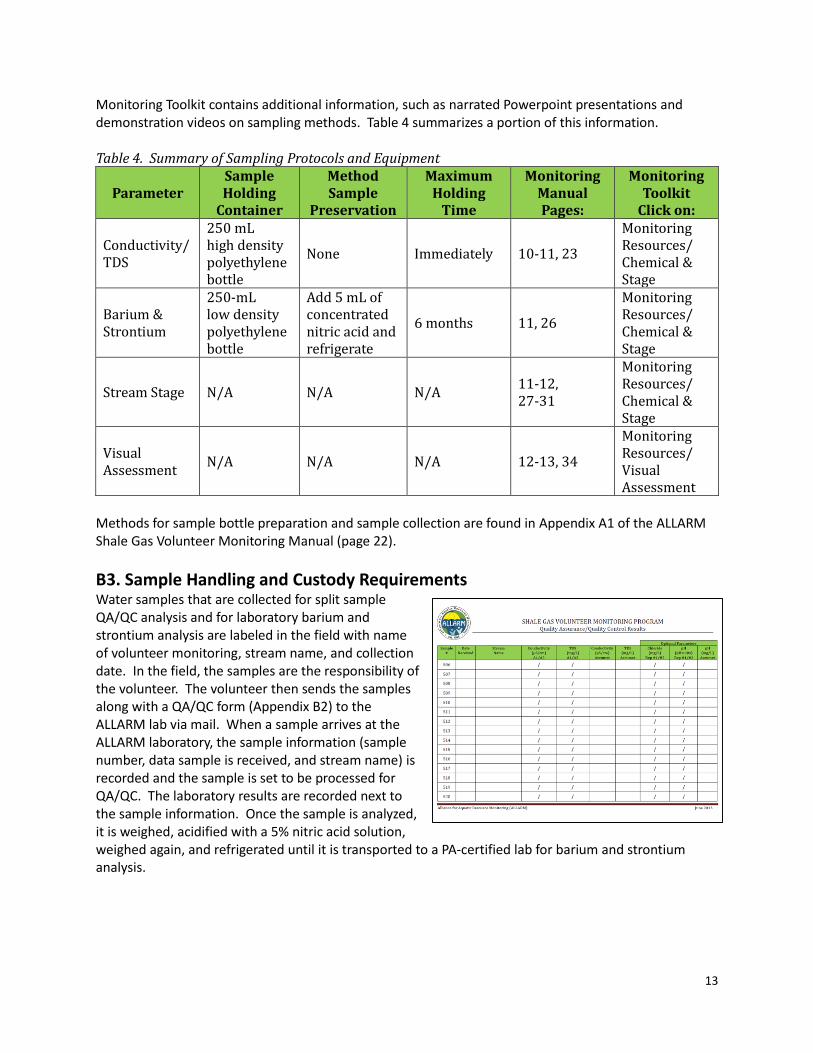
Water samples that are collected for split sample QA/QC analysis and for laboratory barium and strontium analysis are labeled in the field with name of volunteer monitoring, stream name, and collection date. In the field, the samples are the responsibility of the volunteer. The volunteer then sends the samples along with a QA/QC form (Appendix B2) to the ALLARM lab via mail. When a sample arrives at the ALLARM laboratory, the sample information (sample number, data sample is received, and stream name) is recorded and the sample is set to be processed for QA/QC. The laboratory results are recorded next to the sample information. Once the sample is analyzed, it is weighed, acidified with a 5% nitric acid solution, weighed again, and refrigerated until it is transported to a PA-certified lab for barium and strontium analysis.
14
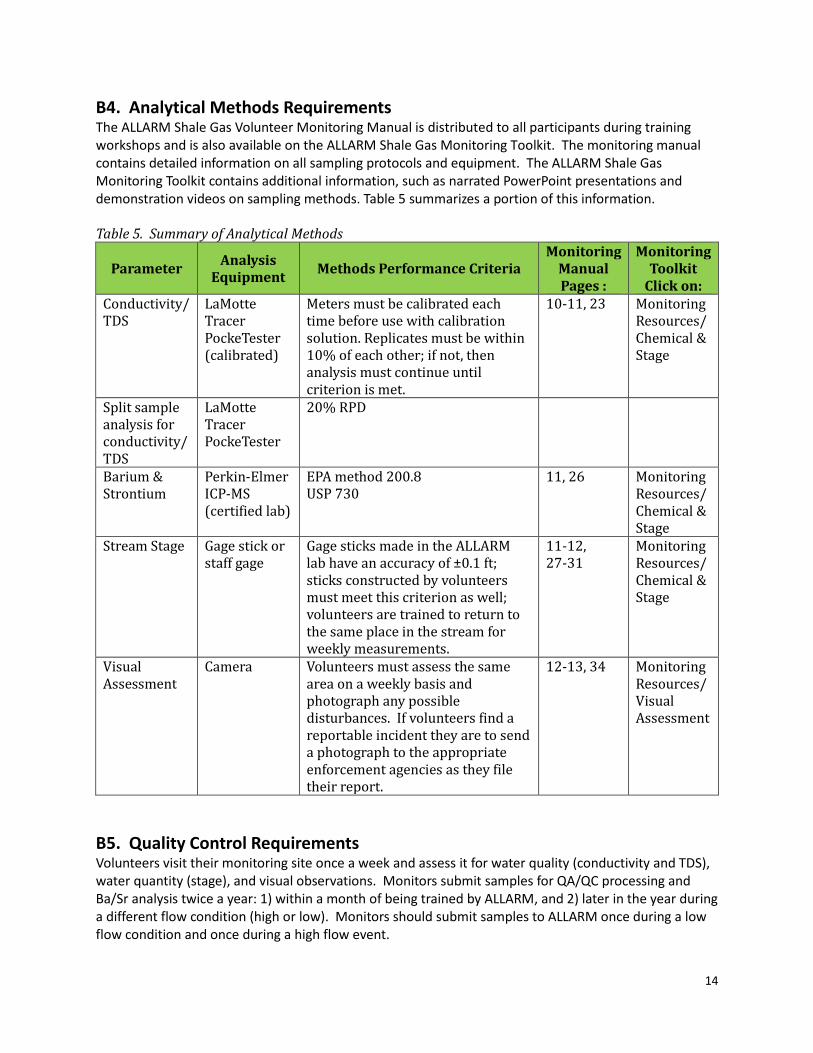
B4. Analytical Methods Requirements The ALLARM Shale Gas Volunteer Monitoring Manual is distributed to all participants during training workshops and is also available on the ALLARM Shale Gas Monitoring Toolkit. The monitoring manual contains detailed information on all sampling protocols and equipment. The ALLARM Shale Gas Monitoring Toolkit contains additional information, such as narrated PowerPoint presentations and demonstration videos on sampling methods. Table 5 summarizes a portion of this information. Table 5. Summary of Analytical Methods
Parameter Analysis
Equipment Methods Performance Criteria
Monitoring Manual Pages :
Monitoring Toolkit
Click on: Conductivity/TDS
LaMotte Tracer PockeTester (calibrated)
Meters must be calibrated each time before use with calibration solution. Replicates must be within 10% of each other; if not, then analysis must continue until criterion is met.
10-11, 23 Monitoring Resources/ Chemical & Stage
Split sample analysis for conductivity/TDS
LaMotte Tracer PockeTester
20% RPD
Barium & Strontium
Perkin-Elmer ICP-MS (certified lab)
EPA method 200.8 USP 730
11, 26 Monitoring Resources/ Chemical & Stage
Stream Stage Gage stick or staff gage
Gage sticks made in the ALLARM lab have an accuracy of ±0.1 ft; sticks constructed by volunteers must meet this criterion as well; volunteers are trained to return to the same place in the stream for weekly measurements.
11-12, 27-31
Monitoring Resources/ Chemical & Stage
Visual Assessment
Camera Volunteers must assess the same area on a weekly basis and photograph any possible disturbances. If volunteers find a reportable incident they are to send a photograph to the appropriate enforcement agencies as they file their report.
12-13, 34 Monitoring Resources/Visual Assessment
B5. Quality Control Requirements Volunteers visit their monitoring site once a week and assess it for water quality (conductivity and TDS), water quantity (stage), and visual observations. Monitors submit samples for QA/QC processing and Ba/Sr analysis twice a year: 1) within a month of being trained by ALLARM, and 2) later in the year during a different flow condition (high or low). Monitors should submit samples to ALLARM once during a low flow condition and once during a high flow event.
15
B6. Instrument/Equipment Testing, Inspection, and Maintenance Requirements Field and laboratory equipment are routinely checked to be sure that is everything is working properly. The probes of the LaMotte Tracer PockeTester are rinsed with distilled water after each use and stored per the manufacturer’s recommendation. Information on replacement parts are found in the ALLARM Shale Gas Volunteer Monitoring Manual (page 13).
B7. Instrument/Equipment Calibration and Frequency Volunteers calibrate the LaMotte Tracer PockeTester every other week using the middle range calibration solution (1,413 µS/cm), per the manufacturer’s recommendations. Volunteers record on their data sheet and also in their Excel spreadsheet when they calibrate their meter. The ALLARM lab calibrates the QA/QC LaMotte Tracer PockeTester instruments before each QA/QC event.
B8. Inspection/Acceptance of Supplies and Consumables Monitoring equipment is selected and ordered by ALLARM in bulk and is then given to volunteers during a training workshop. All water quality monitoring equipment (meter, calibration solution, wash bottle, sample bottle, QA/QC bottles) are all ordered from laboratory supply companies. Water quantity equipment (gage stick) is purchased locally by ALLARM and calibrated by ALLARM staff. All supplies and equipment are purchased under the supervision of the Quality Assurance Manager.
B9. Data Acquisition Requirements To determine site locations for monitoring, volunteers get information on the location of gas extraction activities by accessing permits applications, permits issued, drilling commence dates (SPUD dates), as well as inspections, violations and enforcement actions. These data can be organized by county and/or operators and are found on the PA Department of Environmental Protection website (ALLARM Shale Gas Volunteer Monitoring Manual, page 14, and ALLARM Shale Gas Monitoring Toolkit under Monitoring Resources/Well Tracking & Monitoring Site Location). For the most part, these databases are kept up to date and are accurate. Volunteers are also provided with baseline maps of their watersheds, constructed by ALLARM and based on standard GIS files, most of which are available for download from Pennsylvania Spatial Data Access (PASDA) at: http://www.pasda.psu.edu/. These baseline maps are customized and typically include: watershed boundaries, municipality boundaries, streams, state roads, towns, and unconventional wells that have been permitted and/or drilled. These maps are helpful to volunteers as they choose their monitoring locations, however as additional wells become permitted, they need to be documented and recorded on the map. The other map layers are static. Volunteers are also encouraged to use topo maps.
B10. Data Management The primary intention of this monitoring protocol is to have data interpreted and used immediately after it is collected. To that end, volunteers are trained to identify reportable events and to report them in a timely and efficient manner to interested and responsible parties, depending on the nature of the event.
16
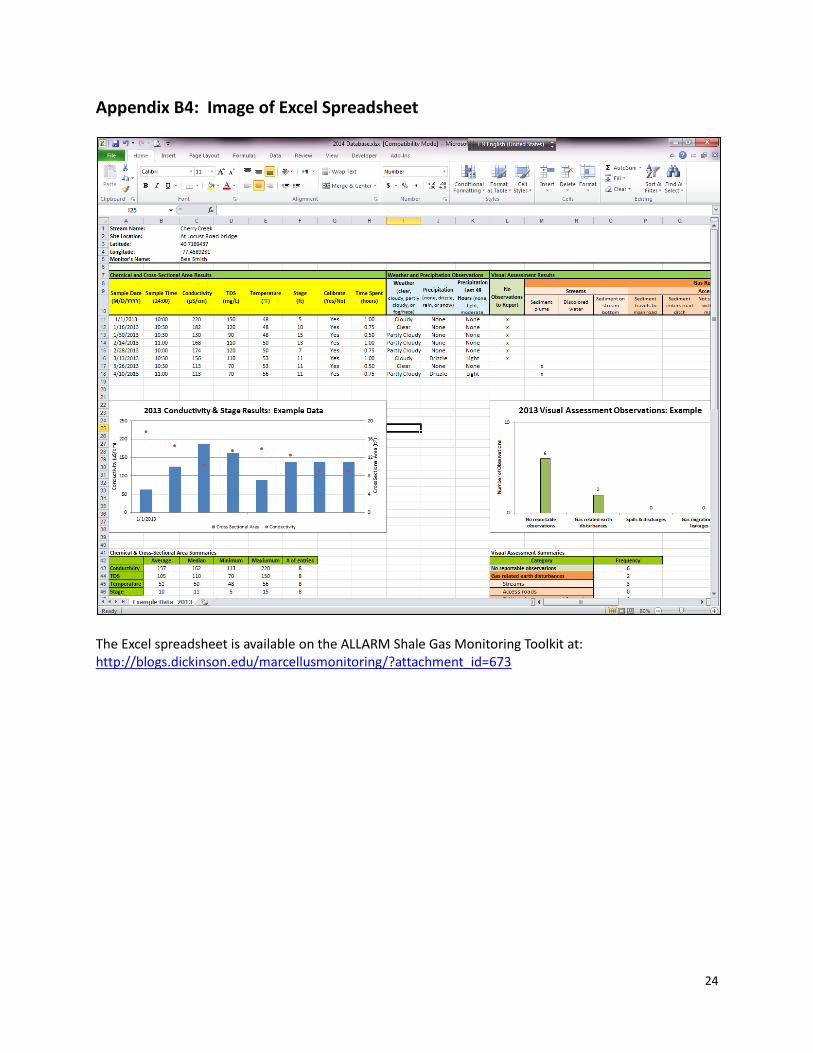
The secondary intention of data collection in this monitoring protocol is to archive the data for future use by interested parties. To that end, ALLARM is currently working with partner groups to establish a central online database with a mechanism for volunteers to enter their own data (volunteer-friendly ingestion portal). Such a database will also be designed to provide feedback on data that would be considered outliers (either errors or reportable events) based on the criteria provided. Path of data At the present time, data are collected by volunteers in the field and entered into a field data form (ALLARM Monitoring Manual, p. 24). Volunteers then return to their homes and enter the data into a Microsoft Office Excel file, provided to them by ALLARM and available at http://blogs.dickinson.edu/marcellusmonitoring/data-management/2012-chemical-and-flow-database-3/. This file automatically graphs conductivity against stream stage and allows volunteers to make an assessment regarding whether there is a reportable event. The data file gets sent to the volunteer coordinator periodically, based on an agreement within the group. The coordinator compiles multiple databases (http://blogs.dickinson.edu/marcellusmonitoring/data-management/2012-chemical-and-flow-database-3/) and sends a copy of the latest Excel workbook to the ALLARM office, where it is also archived. As mentioned above, it is the intention to have a central online database available to volunteers for archiving data in the near future. How check for accuracy and completeness and minimize and correct errors Volunteers are trained in data entry, management, and interpretation, including the identification of reportable events during the training workshop. At this time, volunteers also learn how to validate their data by comparing numbers to previous weeks of similar stage, and to check that the values entered are within the expected ranges. If the numbers are outside the expected ranges, the volunteers are instructed to first check and be sure the values are entered correctly, and if so, only then to consider if they have found a reportable event. Data are checked again by the coordinators when they are submitted to them. If volunteers detect a disturbance during the visual assessment, they photograph the evidence and consult with either their volunteer coordinator or their local County Conservation District to verify the severity of the disturbance. ALLARM conducts a follow-up meeting within two months of the initial workshop to examine the data collected thus far and to assess completeness and accuracy, to make sure that volunteers are aware of any errors they may be making, and to correct them. ALLARM also maintains constant communication with coordinators to make sure that active volunteers are going through the QA/QC process with the ALLARM lab. ALLARM also examines compiled data that is periodically submitted by the coordinators for completeness and accuracy and follows up on any shortcomings observed. ALLARM has written directions on how to enter data into the Excel spreadsheet as well as a checklist for data entry that includes review steps such as: values in proper column, values within range of similar flows, decimal points in correct place, proper date entered, and values are the same as on field data sheet, etc. Barium and strontium data are collected semi-annually and/or to confirm a possible contamination event follow a different pathway. For most groups, the samples are sent to the ALLARM lab and delivered by laboratory staff to a certified lab for analysis. The results are returned to the ALLARM lab, where they are entered into a common database, and then sent to the volunteers. The certified laboratory disposes of the samples. ALLARM will be responsible for submitting these data to the common database once it is established. In the case of a sample that is collected to confirm that a spike
17
in conductivity/TDS is due to a contamination event, the sample is brought to a certified lab by the volunteer and returned directly to the volunteer, so that the results can be timely. In these cases, the results are also sent to the ALLARM laboratory for archiving in the barium and strontium database.
SECTION C – ASSESSMENT AND OVERSIGHT
C1. Assessments and Response Actions Volunteer performance is evaluated at the workshop during the hands-on activities. Staff members work very closely with individual volunteers during the hands-on training exercises to be sure that they have achieved the goals of the exercises. For example, staff will work with each volunteer until they successfully calibrate their meters and make accurate measurements on the samples provided. It is expected that each volunteer will be able to identify reportable events; during the hands-on exercise to train them in this skill, staff make sure that every volunteer understands the criteria and can apply the decision trees. And finally, after their first visit to their stream site, volunteers must submit a split sample to the ALLARM laboratory for analysis; their result must be within 20% of the laboratory’s result. ALLARM tracks the percentage of volunteers who pass QA/QC and use these data to evaluate the effectiveness of our trainings. To date, 94% of monitors have passed QA/QC. A workshop evaluation sheet is distributed to all participants at the end of the workshop. This evaluation focuses on self-reporting of perceived levels of understanding of the important concepts covered. ALLARM staff are constantly fine-tuning and improving the pedagogy of the workshops, based in part on these evaluations from the participants. Examples of ways in which we have improved our workshops based on volunteer feedback include: changing the presentation materials on visual assessment to be more specific and to engage the audience in a more interactive mode; adding an exercise requiring participants to enter data into the Excel spreadsheet; improving a hands-on exercise to train them to identify a reportable event, based on actual measurement of samples; and developing an online toolkit with narrated PowerPoint presentations and videos to further explain sampling and analytical methods. ALLARM hired a full-time professional staff person in May 2012 to respond to a need that was identified for stronger follow-up with volunteer groups to promote better performance and to ensure a higher level of data quality. This Outreach and Data Management Coordinator revisits the monitoring groups to provide additional follow up assistance. Meetings with new groups are held within two months of the initial training to answer any early questions and to better understand the group’s mode of organization. A subsequent meeting is held with the group’s data management coordinator to ensure that data is being correctly entered into the template. Additionally, there are monthly phone calls with group point contacts to assist with any additional questions or concerns. The laboratory that performs the barium and strontium analysis is certified by the Pennsylvania Department of Environmental Protection, and ALLARM relies on their process to ensure data quality. Prior to choosing the LaMotte Tracer PockeTester meter, ALLARM tested a variety of popular conductivity/TDS meters (under $200) and determined, through trial tests with untrained volunteers, that the LaMotte PockeTester exceeds all other meters tested in terms of accuracy, precision and ease of use. ALLARM also tracks the LaMotte PockeTester performance in comparison to a Fisherbrand Accumet benchtop meter. Data accuracy and completeness is evaluated as discussed in Section B10.
18
C2. Reports to Management As ALLARM continues to develop and enhance its shale-gas monitoring protocol, changes are documented and shared with funders, service providers, and volunteer coordinators to make sure that the program is consistent. On a group-by-group basis, ALLARM helps with internal data and metadata management to ensure that there is full documentation. At this time, until there is a centralized data system, ALLARM helps local communities with their own localized data reporting on an annual basis. In addition to reports to data users, sponsors and partnership organizations, ALLARM has the intention to publicize this project nationally to a variety of audiences, including those involved in Public Participation in Scientific Research (citizen science) and academic scholars and teachers interested in community-based learning. We have written a number of articles highlighting the project activities in our annual newsletter (The Stream of Consciousness), in the nationally-distributed The Volunteer Monitor journal (Zerbe and Wilderman, 2010).
SECTION D – DATA VALIDATION AND USABILITY
D1. Data Review, Verification, and Validation Requirements The requirements for data review, verification, and validation are that all the following steps be completed:
1) Volunteers will be trained to carefully compare their computer entries to the field data sheets and, if possible, to enter data weekly. They will be trained to use the automatic graphing capability of the spreadsheet to identify outliers and nonsensical readings. Volunteers do not need to make any calculations during data entry, but they are required to carefully review their entries.
2) Data will be first reviewed by the volunteer group coordinator, and then by our Quality Assurance Manager for completeness and accuracy. The Quality Assurance Manager will make decisions to reject or qualify data. Data on barium and strontium concentrations will be compiled and managed by the Quality Assurance Manager.
3) In addition, the Outreach and Data Management Coordinator will meet with volunteers several months after they have started monitoring, to review and verify their data. Volunteers will be made aware of any errors they may be making, and correct them.
D2. Validation and Verification Methods
Before any data can be accepted, volunteers must attend an ALLARM training workshop and demonstrate that they can calibrate and use the conductivity/TDS meter and then, during the initial phase of their field sampling, they must pass our split sample QA/QC requirement which will verify their correct sampling procedures as well as calibration and use of the equipment. Volunteers are trained to carefully compare their computer entries to the field data sheets and, if possible, to enter data weekly. The automatic graphing capability of the spreadsheet helps volunteers identify outliers and nonsensical readings. Volunteers do not need to make any calculations during data entry. The data are then checked again by the volunteer coordinators when they are submitted to them for compilation. If errors are detected, they will consult with our Quality Assurance Manager. If errors are verified, those data will be discarded and the data collector will be contacted for a discussion on how to prevent the errors from continuing to occur. The Quality Assurance Manager also examines compiled
19
data that is periodically submitted by the coordinators for completeness and accuracy and follows up on any shortcomings observed. If volunteers detect a disturbance during the visual assessment, they photograph the evidence and consult with either their volunteer coordinator or their local County Conservation District to verify the severity of the disturbance. The Outreach and Data Management Coordinator follows up with the group within two months of the initial workshop to examine the data collected thus far and to assess completeness and accuracy, to make sure that volunteers are aware of any errors they may be making, and to correct them.
D3. Reconciliation with Data Quality Objectives
During follow-up trainings by the Outreach and Data Management Coordinator, calculations and determinations for precision, accuracy, completeness, and comparability will be made and corrective action implemented if needed. If data quality indicators do not meet the project’s specifications, data will be discarded and the cause of failure will be evaluated. If necessary, the training workshops will be revised to address these issues. If the problem is found to be the equipment, calibration and maintenance techniques will be reassessed and if necessary, substitute equipment will be provided. If the data collected do not meet the intended data use, the protocol will be revised to strengthen the robustness of the data collected in detecting flowback water contamination and land disturbance due to gas extraction activities. For example, we are currently revising the protocol to distinguish between high conductivity related to acid mine drainage from that related to shale-gas flowback water contamination, a concern expressed by volunteers working in areas of abandoned mine drainage. If the protocol or specifications therein are revised, these revisions will be submitted to EPA quality assurance officers for approval.
20
Appendix A: ALLARM Shale Gas Monitoring Workshop Agenda
21
Appendix B1: Chemical and Stage Monitoring Data Sheet
22
Appendix B2: QA/QC Form
23
Appendix B3: Visual Assessment Checklist
24
Appendix B4: Image of Excel Spreadsheet
The Excel spreadsheet is available on the ALLARM Shale Gas Monitoring Toolkit at: http://blogs.dickinson.edu/marcellusmonitoring/?attachment_id=673
25
Works Cited
ALLARM Shale Gas Volunteer Monitoring Toolkit. Available on line at: http://blogs.dickinson.edu/marcellusmonitoring/. Brasier, K., and Ward, M., 2010. Accelerating Activity in the Marcellus Shale: An Update on Wells Drilled and Permitted, Penn State Cooperative Extension., available on line at: http://extension.psu.edu/naturalgas/news/2010/05/accelerating-activity. New York Department of Environmental Conservation, Division of Mineral Resources, 2009. Draft Supplemental Generic Environmental Impact Statement on the Oil, Gas and Solution Mining Regulatory Program, September, 2009, available on line at: http://www.dec.ny.gov/energy/58440.html. Pennsylvania Department of Environmental Protection1 (PA DEP1), Oil and Gas Permits Issued, January 7, 2014, available on line at: http://www.depreportingservices.state.pa.us/ReportServer/Pages/ReportViewer.aspx?/Oil_Gas/Permits_Issued_Count_by_Well_Type_YTD. Pennsylvania Department of Environmental Protection2 (PA DEP2), Oil and Gas Compliance, January 7, 2014, available on line at: http://www.depreportingservices.state.pa.us/ReportServer/Pages/ReportViewer.aspx?/Oil_Gas/OG_Compliance Simpson, J., Faddis, H., Michaels, C., and Wegner, B. 2010. Industrial Gas Drilling Reporter, Vol 6, Riverkeeper, available on line at: http://www.riverkeeper.org/wp-content/uploads/2010/02/Riverkeeper-Gas-Drilling-Reporter-Vol.-6.pdf Soeder, D.J. and Kappel, W.M., 2009, Water resources and natural gas production from the Marcellus Shale: U.S. Geological Survey Fact Sheet 2009–3032, 6 pages. http://pubs.usgs.gov/fs/2009/3032/. Susquehanna River Basin Commission, 2010. Natural Gas Well Development in the Susquehanna River Basin, Information Sheet. January 2010, 4 pp. United States Department of Energy, 2009. Modern Shale Gas Development in the United States: A Primer, April 2009, 116 pp. United States Environmental Protection Agency, 1996. The Volunteer Monitor’s Guide to Quality Assurance Project Plans, EPA 841-B-96-003, 1996, available on line at http://water.epa.gov/type/rsl/monitoring/qappcovr.cfm. United States Environmental Protection Agency, 2001. EPA Requirements for Quality Assurance Project Plans, EPA QA/R-5, 2001, available on line at http://www.epa.gov/quality/qs-docs/r5-final.pdf. Wilderman, C. and Monismith, J. 2012. ALLARM Shale Gas Volunteer Monitoring Manual. Available on line at: http://blogs.dickinson.edu/marcellusmonitoring/files/2012/08/Shale-Gas-Volunteer-Monitoring-Manual-2.0.pdf. Zoback, M., Kitasei, S., Copithorne, B. 2010. Addressing the Environmental Risks from Shale Gas Development, Worldwatch Institute Briefing Paper 1. July, 2010, 19 pp.