alice: asset limited, income constrained, employed....alice lives in all counties 10 source:...
TRANSCRIPT


ALICE: Asset Limited, Income Constrained, Employed.
Michigan ALICE Report
3
Lead Researcher, Director and AuthorStephanie Hoopes, Ph.D. – United Way of Northern New Jersey
Michigan Research Advisory CommitteeBrian Pittelko, M.P.A. ‐ W.E. Upjohn Institute for Employment Research
Bridget Flynn Timmeney, M.S.W. W.E. Upjohn Institute for Employment Research
David Clifford, Ph.D. ‐ Eastern Michigan University
David Callejo Perez, Ph.D. ‐ Saginaw State Valley University
Huda Fadel, Ph.D. ‐ Blue Cross Blue Shield of Michigan
Kurt Metzger, M.A. ‐ Data Driven Detroit
Luke Shaefer, Ph.D. ‐ University of Michigan
Neil Carlson, Ph. D. ‐ Calvin College

What ALICE Measures
4
Household Survival Budget
ALICE Threshold
ALICE Income Assessment
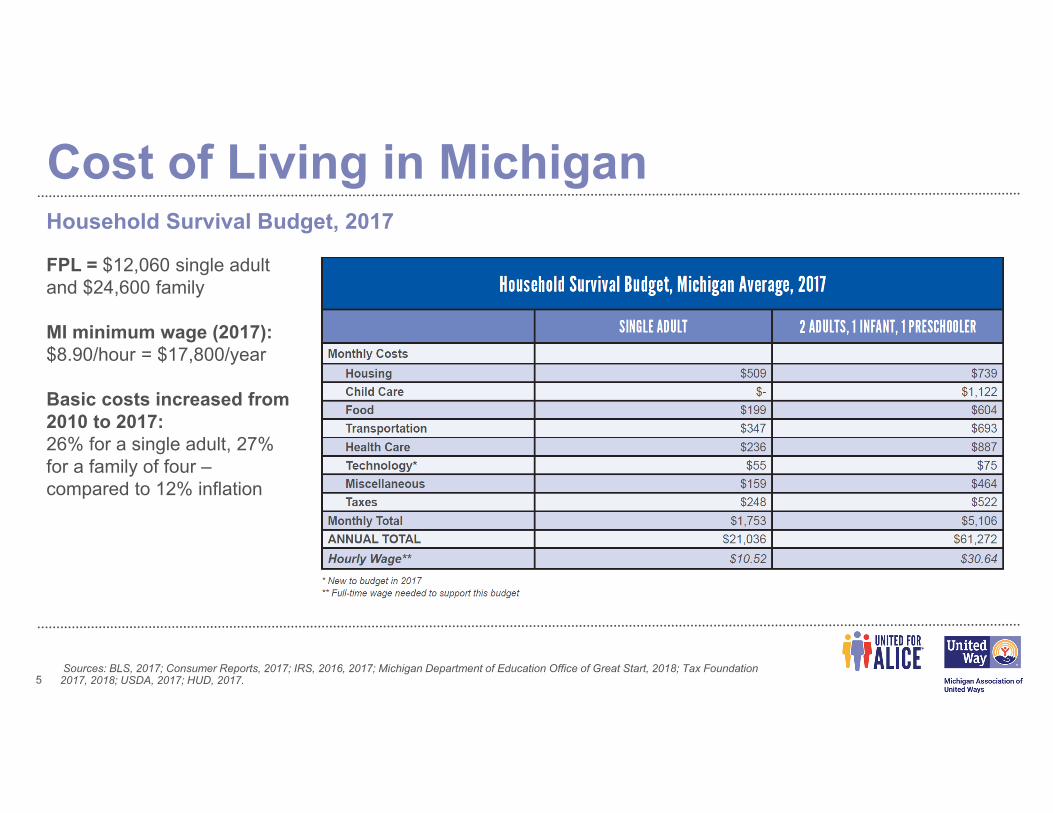
Cost of Living in Michigan
5Sources: BLS, 2017; Consumer Reports, 2017; IRS, 2016, 2017; Michigan Department of Education Office of Great Start, 2018; Tax Foundation 2017, 2018; USDA, 2017; HUD, 2017.
Household Survival Budget, 2017
FPL = $12,060 single adult and $24,600 family
MI minimum wage (2017):$8.90/hour = $17,800/year
Basic costs increased from 2010 to 2017: 26% for a single adult, 27% for a family of four –compared to 12% inflation
Household Survival Budget sources
6
Housing: HUD’s Fair Market Rent (40th percentile)
Child Care: Registered Family Child Care Homes
Food: Thrifty Level (lowest of four levels) of the U.S. Department of Agriculture (USDA) Food Plans – with regional variation
Transportation: Car expenses include gas and motor oil and other vehicle maintenance expenses from Consumer Expenditure Survey (CES)
Health Care: nominal out-of-pocket health care spending, medical services, prescription drugs from Consumer Expenditure Survey (CES)
Technology: smart phone using Consumer Reports “Best Low-Cost Cell-Phone Plans”
Taxes: Tax Foundation’s individual income tax rates and deductions
Miscellaneous: 10 percent of the total (including taxes) to cover cost overruns
7
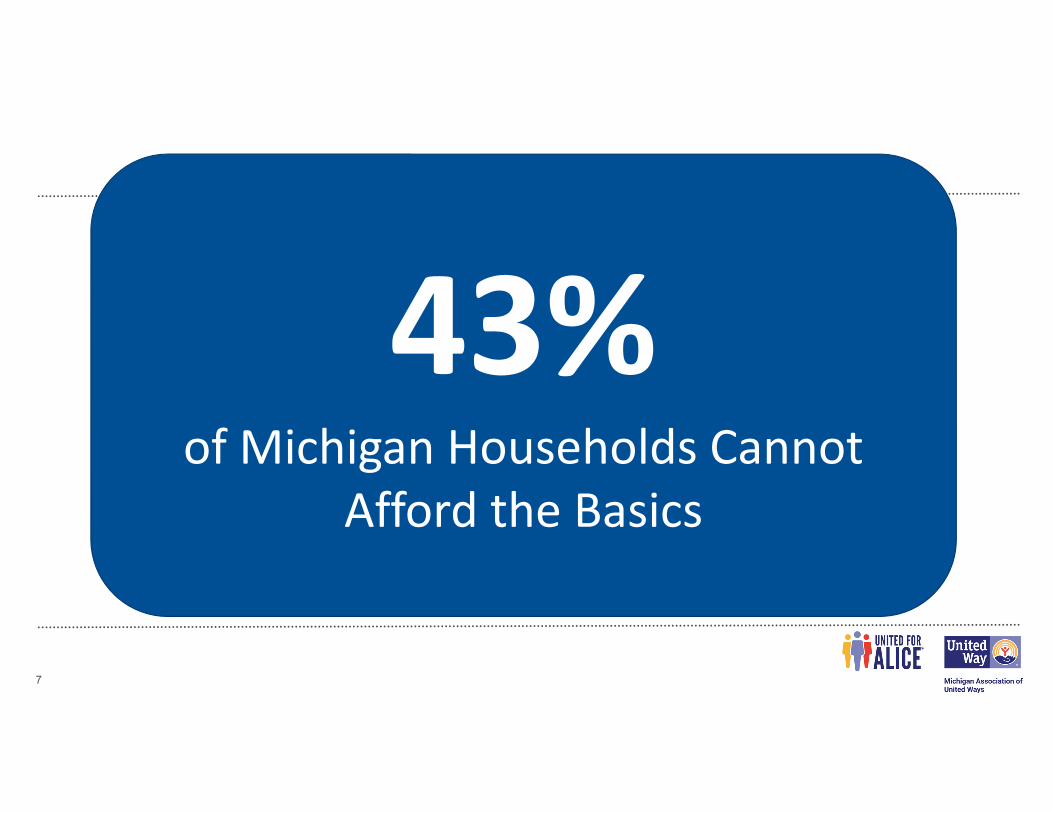
43%of Michigan Households Cannot
Afford the Basics
Financial hardship is increasing over time
8 Source: American Community Survey, 2017, and the ALICE Threshold, 2017
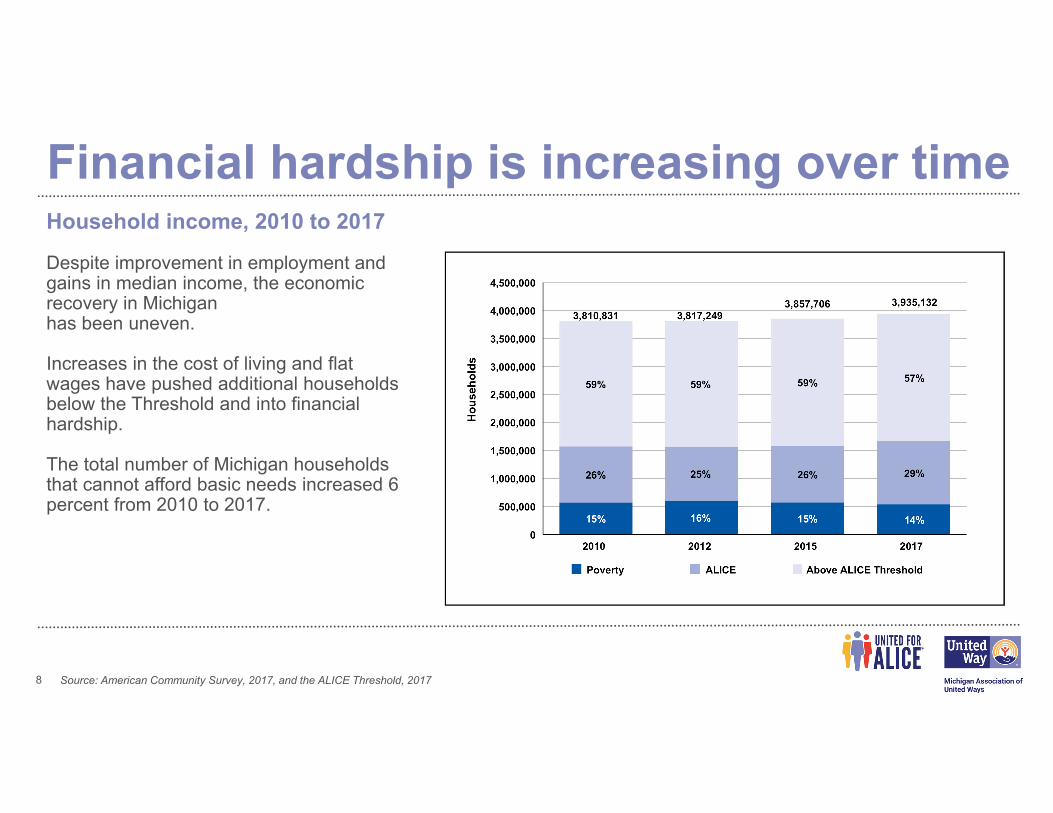
Household income, 2010 to 2017
Despite improvement in employment and gains in median income, the economic recovery in Michiganhas been uneven.
Increases in the cost of living and flat wages have pushed additional households below the Threshold and into financial hardship.
The total number of Michigan households that cannot afford basic needs increased 6percent from 2010 to 2017.

Earnings for people in Michigan
9 Source: American Community Survey, 2017, and the ALICE Threshold, 2017
Number of jobs by hourly wage, 2017
Wages needed to support the Household Survival Budget:Single adult: $10.52/hourFamily of four: $30.64/hour
In 2017, 61% of jobs in Michigan paid less than $20/hour.
For comparison, in 2010, 64% of jobs paid less than $20/hour.
ALICE lives in all counties
10 Source: American Community Survey, 2017, and the ALICE Threshold, 2017
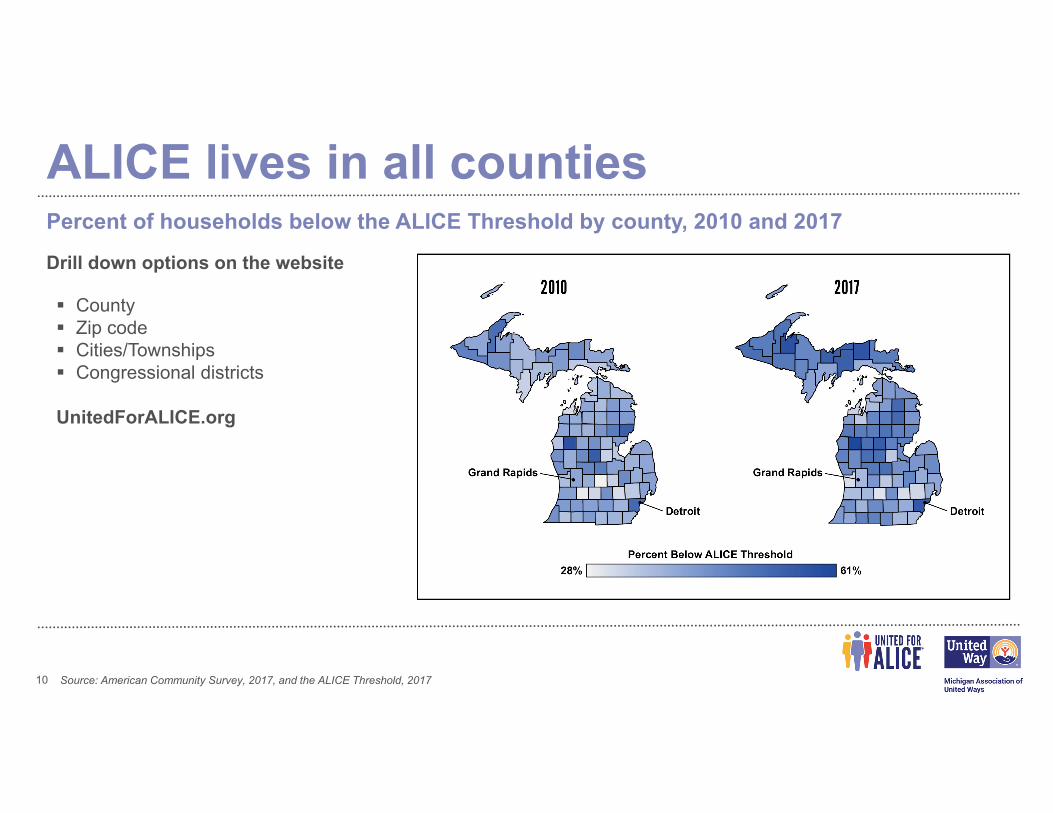
Percent of households below the ALICE Threshold by county, 2010 and 2017
Drill down options on the website
County Zip code Cities/Townships Congressional districts
UnitedForALICE.org
How does Michigan compare?
11
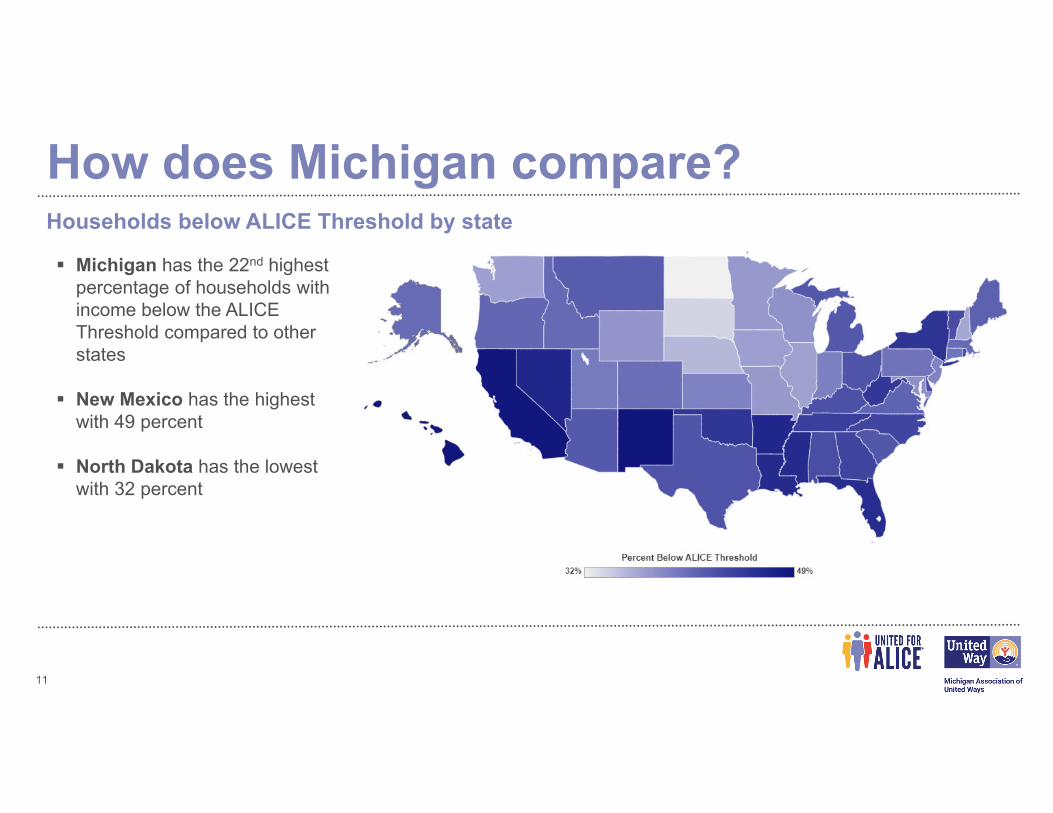
Households below ALICE Threshold by state
Michigan has the 22nd highest percentage of households with income below the ALICE Threshold compared to other states
New Mexico has the highest with 49 percent
North Dakota has the lowest with 32 percent
ALICE households vary by family type
12 Source: American Community Survey, 2017, and the ALICE Threshold, 2017
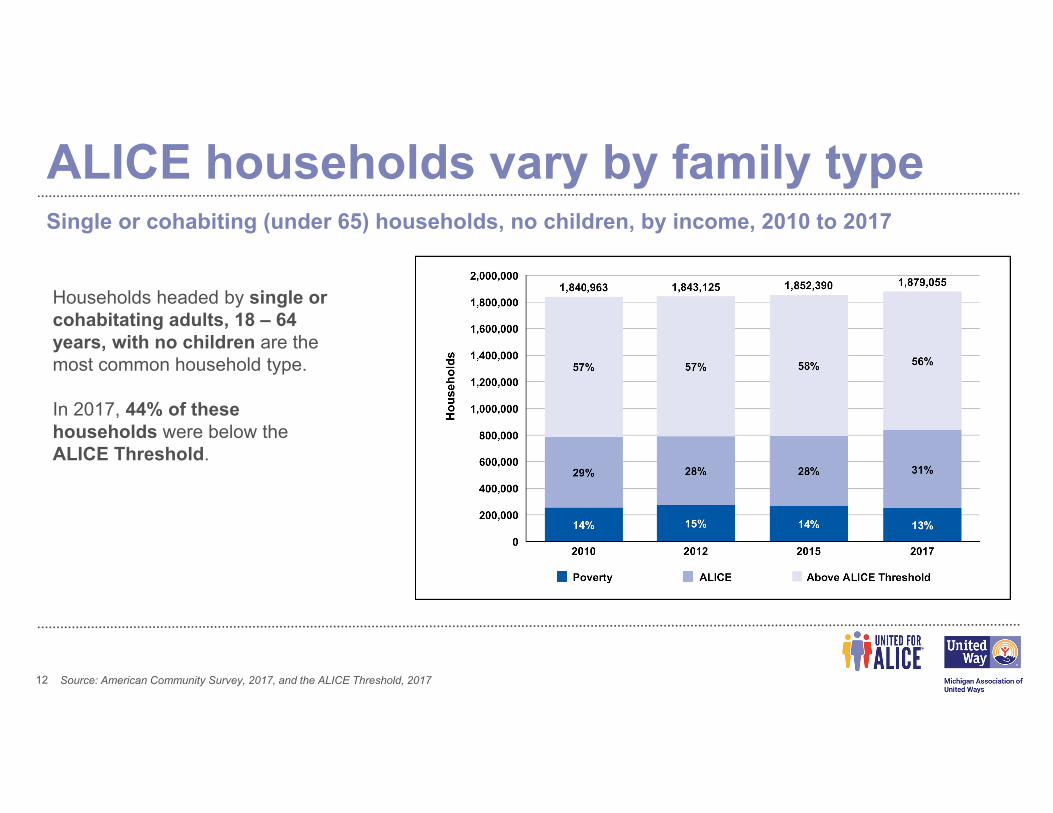
Single or cohabiting (under 65) households, no children, by income, 2010 to 2017
Households headed by single or cohabitating adults, 18 – 64 years, with no children are the most common household type.
In 2017, 44% of these households were below the ALICE Threshold.

ALICE Families with Children
13
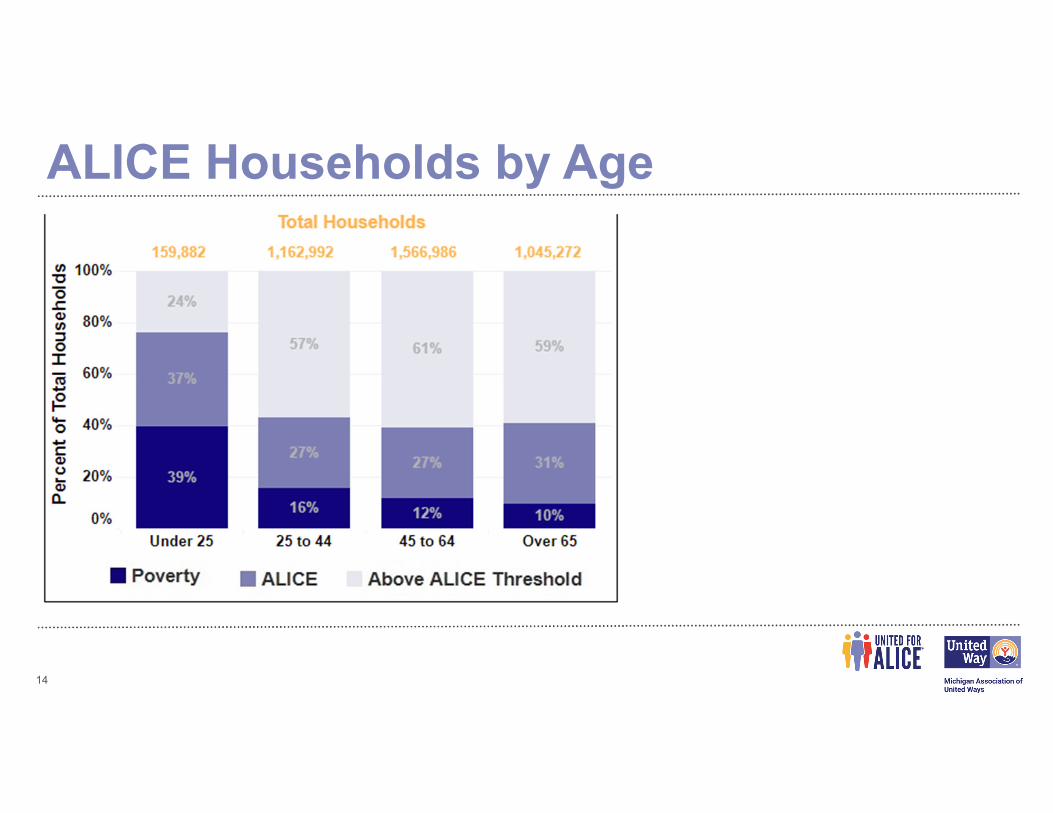
ALICE Households by Age
14
15 Source: Bureau of Labor Statistics, Occupational Employment Statistics (OES) Wage Survey - All Industries Combined, 2017
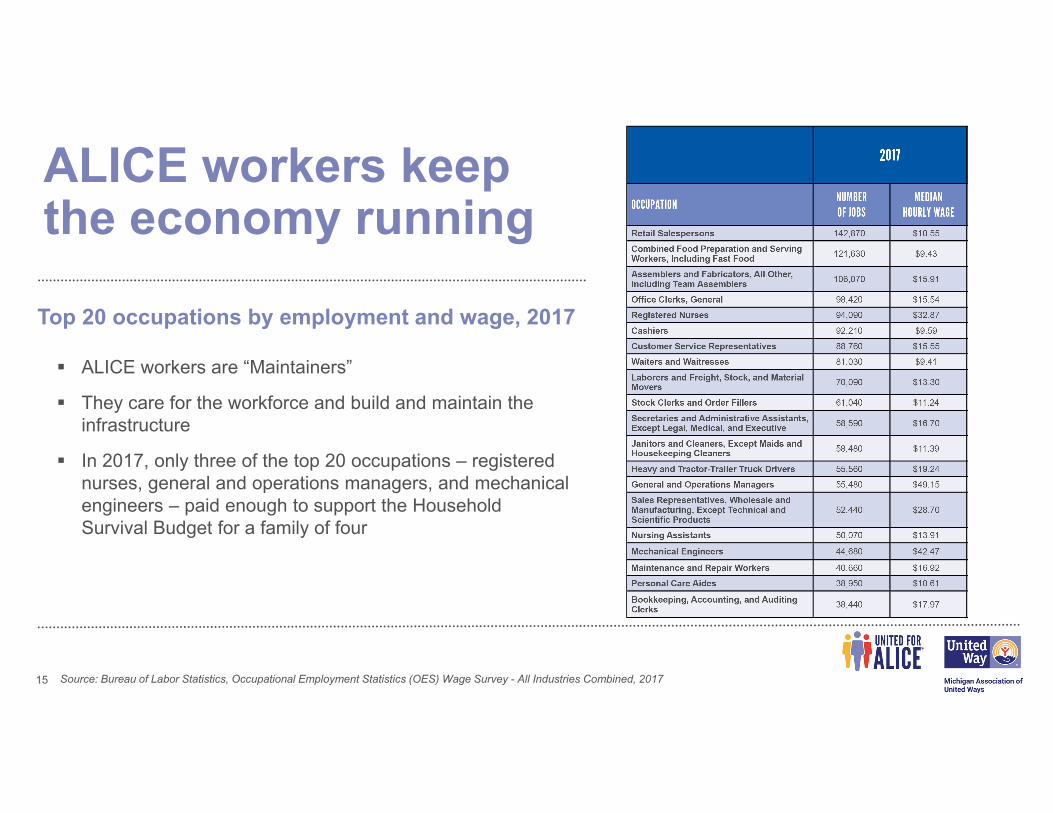
ALICE workers keep the economy running
ALICE workers are “Maintainers”
They care for the workforce and build and maintain the infrastructure
In 2017, only three of the top 20 occupations – registered nurses, general and operations managers, and mechanical engineers – paid enough to support the Household Survival Budget for a family of four
Top 20 occupations by employment and wage, 2017

It matters where ALICE works
16 Source: U.S. Census, Quarterly Workforce Indicators (QWI), 2017
Private-sector employment by firm size, with average annual wages, 2017
Small firms have been an important engine for growth, driving job creation, innovation, and wealth, and they have traditionally grown tobecome medium or large employers.
However, small firms also tend to have lower wages, fewer benefits, and higher turnover.
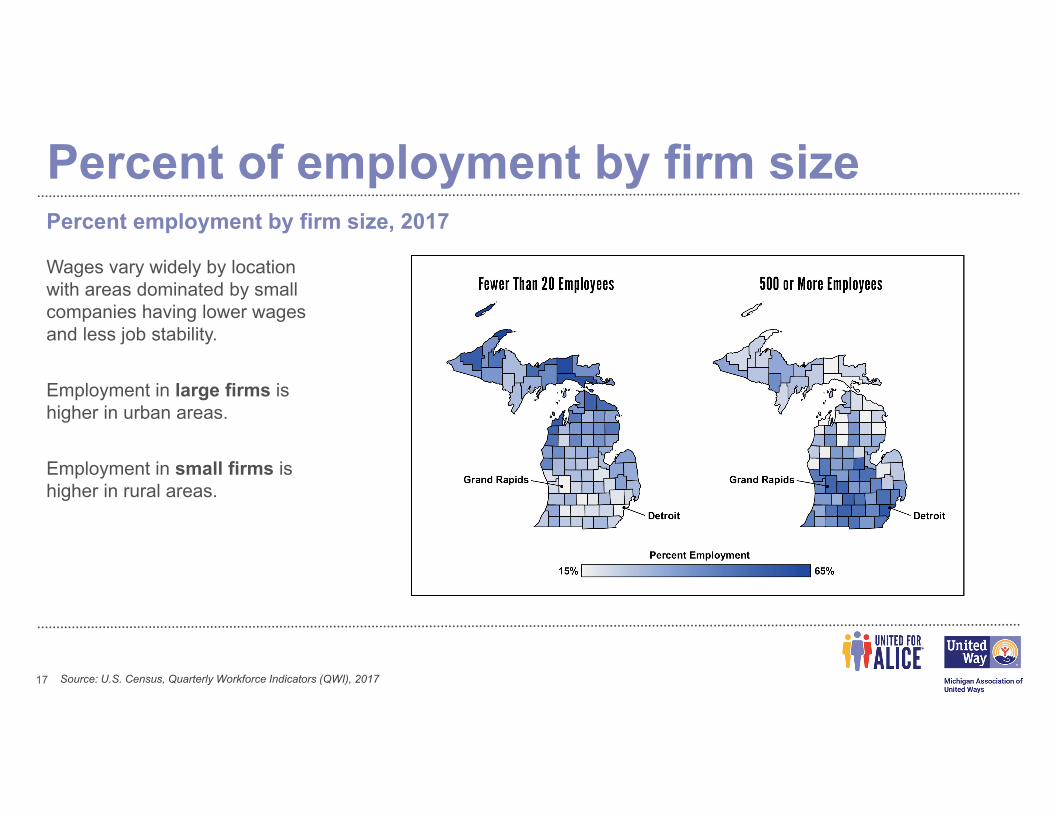
Percent of employment by firm size
17 Source: U.S. Census, Quarterly Workforce Indicators (QWI), 2017
Percent employment by firm size, 2017
Wages vary widely by location with areas dominated by small companies having lower wages and less job stability.
Employment in large firms is higher in urban areas.
Employment in small firms is higher in rural areas.

2019 ALICE Report key findings
18
In 2018, 43% of Michigan households could not afford basic needs14% households are under FPL, 29% are between FPL and ALICE threshold = 43% total
Despite overall improvement in employment, the economic recovery has been uneven
Cost of basic household expenses in the ALICE Survival Budget have increased steadily. The cost of the average household budget increased by 27 percent from 2010 to 2017, despite low rate of inflation nationwide – 12 percent from 2010 to 2017
Although unemployment rates are falling, ALICE workers are still struggling. Low-wage jobs dominate – 61% of all jobs in Michigan pay less than $20 per hour.
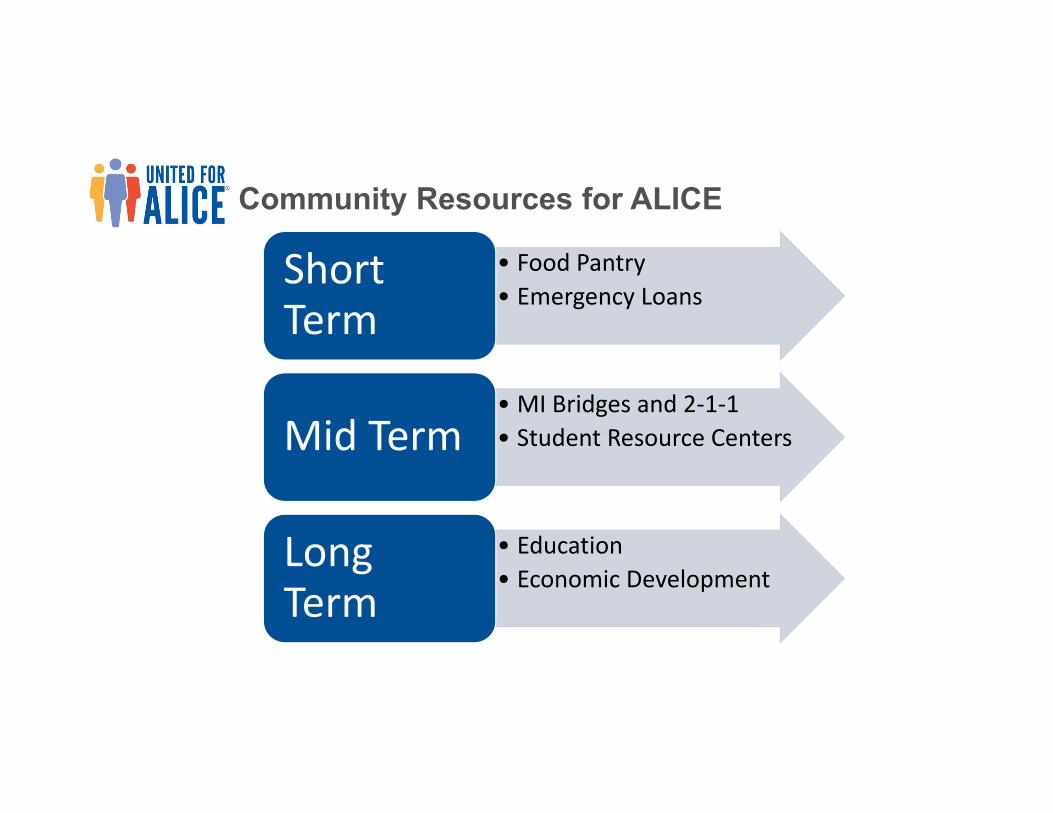
Community Resources for ALICE
• Food Pantry• Emergency Loans
Short Term
• MI Bridges and 2‐1‐1• Student Resource CentersMid Term
• Education• Economic Development
Long Term

www.MichiganALICE.org