alarape and nassar
TRANSCRIPT

7/30/2019 Alarape and Nassar
http://slidepdf.com/reader/full/alarape-and-nassar 1/22
TITLE OF THE PAPER RELATIONAL EMBEDDEDNESS AND PERFORMANCEOF SMALL AND MEDIUM ENTERPRISES INSOUTHWESTERN NIGERIA
NAME OF AUTHORS: ALARAPE, Aderemi Ayinla.Management Consultant/Lecturer
Centre for Industrial Research and DevelopmentObafemi Awolowo University, Ile-Ife, Nigeria
NASSAR, Moshood LanreProfessor of Business AdministrationDepartment of Management and Accounting,Faculty of Administration,Obafemi Awolowo University, Ile-Ife, Nigeria
Corresponding Author: ALARAPE, Aderemi Ayinla.
Telephone: +2348034090821
Email: [email protected] or [email protected]
Keywords : Business Networks, relational embeddedness, SME’s performance, Nigeria

7/30/2019 Alarape and Nassar
http://slidepdf.com/reader/full/alarape-and-nassar 2/22
RELATIONAL EMBEDDEDNESS AND PERFORMANCE OF SMALL AND
MEDIUM ENTERPRISES IN SOUTHWESTERN NIGERIA
ABSTRACT
The paper examined the impact of relational embeddedness on the performance of SMEs.The primary data were collected through questionnaire and analyzed using descriptive andinferential statistics. 279 firms were selected for the study. The relational embeddednesswas operationalised based on (i) strong ties and (ii) weak ties and the performance of thefirm were contrasted on the basis of growth in assets. The result of the study showed that
personalised “strong ties” do not automatically translate to better performance, atimes,“weak ties” enhance firm’s performance due to removal of unnecessary pressure,obligations and expectations associated with strong relation.
Introduction
The concept of relational embeddedness assumes that firms are closely linked to
their local production environments in a world of increasing globalisation. Relational
embeddedness emphasises the importance of trust-based networks in firm’s development
and explain why under the same market condition some firms perform better than others.
Literature on relational embeddedness in term of effect of degree of relations a firm
cultivated with members of its business networks on the firm’s performance is not only
scarce but there is controversy among the available literature on the effect of strong and
weak ties on firm’s performance.
Strong and weak ties have direct effects on individual economic action (Granovetter
1990). Strong ties enhance firm’s performance directly through trust building, information
transfer and joint problem solving arrangement (Uzzi, 1997). Whereas, (Burt, 1992)
hypothesized that weak ties are performance boosting devices because they provide that
crucial freedom to act upon opportunities and the entrepreneurs are likely to gain most when
not bound by expectations and obligations.

7/30/2019 Alarape and Nassar
http://slidepdf.com/reader/full/alarape-and-nassar 3/22
In this paper, the concern is not to engage on the debate whether is better for firm to
cultivate strong relations with the member of is business network or not but provide
empirical information on the effects of strong and weak ties on entrepreneurial performance
of SMEs as it relates to the Nigeria Business environment. Further, this study is a follow-up
to a previous study that found the performance of entrepreneurs who are members of
business associations to be significantly higher than those who did not belong to business
association.
Theoretical Perspective of Effect of Relational Embeddedness on the Performance of
Firms
Embeddedness plays an important role in social relations among economic actors.
There are many theoretical approaches to the study of firms’ relations, such as transaction
cost approach (TCA), resource dependence approach (RDA) and social network approach
(SNA). These theories look at firms relations with social, cultural and economic
environments from different perspectives and provide insights into the causes as well as the
structure of small enterprise relationship. The TCA analyses firm’s relations from an
economic point of view, while the management point of view is the basis of the RDA and
the SNA explains firm’s relations from a sociological point of view.
The Transaction cost approach (TCA) provides a rationale for enterprise networks
rather than analyzing the direction of the relations. The focal point of the TCA is
transactional event rather than any other relationships. The TCA provides a better basis for
analyzing the organizational integration. However, formal integration of small firms among
themselves is not a general phenomenon in less developed countries (LDCs). What is
commonly found in LDCs are informal relations with other supporting organizations and
other firms, because small firms in developing countries are generally seeking for support
7/30/2019 Alarape and Nassar
http://slidepdf.com/reader/full/alarape-and-nassar 4/22
rather than looking for avenues to reduce their transaction costs (Ring and Van de Ven
1994).
The Resource Dependency Approach is an organizational ecology perspective that
looks into the behaviour of an organization in relation to its external environment.
According to the RDA, successful performance of a firm depends on resources and
supporting networks. The resources and supports are, particularly for small firms, control by
outside actors of the firms. Thus, in order to access these resources and supports at a
relatively low cost, firms are linked by federations, associations, customer-supplier
relationships, competitive relationships, and a social-legal apparatus that define and control
the nature and limits of these relationships (Butler and Sohod 1995, Pfeffer and Salanick
1978).
Despite, this support from businesses’ federations and associations, individual firms
develop different degrees (strong or weak) of relationship with their customers, suppliers,
bankers, larger firms, consultants that cause variance in their performance. Granovetter
(1990) stated that relational embeddedness has typically quite direct effects on individual
economic actions that is constrained and facilitated by history of interactions and
consequent mutual expectations.
Therefore, relational quality as preconditioned affects sharing of knowledge and
pertinent information essentials for firms development. Specifically, coping with increasing
globalization, promoting technology transfer, achieving economies of scale, internalising
specialised functions (such as training, marketing intelligence, logistics and technical
innovation) and overcoming the problem of poor physical infrastructure which adversely
affect their operation and competitive positions of the firm in the market. Strong ties
enhance firm performance directly through trust building, information transfer, and joint
problem solving arrangements (Uzzi, 1997).

7/30/2019 Alarape and Nassar
http://slidepdf.com/reader/full/alarape-and-nassar 5/22
Relational trust and closeness as indicators of relational quality have been found
significantly related to managerial sales and innovation performance (Galunic & Moran,
1999). Therefore, the relational quality has effect on firm performance by directly affecting
the access to physical and financial resources of the firm. Hence, the study hypotheses are:
1(a) Firms that have strong ties with their Bankers perform better than firms that have
weak ties with their Bankers.
1(b) Firms that have weak ties with their Bankers perform better than firms that have
strong ties with their Bankers.
2(a) Firms that have strong ties with their business counsellor perform better than firms
that have weak ties with their business counsellor.
2(b) Firms that have weak ties with their business counsellor perform better than firms
that have strong ties with their business counsellor.
3(a) Firms that have strong ties with their competitors perform better than SMEs that
have weak ties with their competitors.
3(b) Firms that have weak ties with their competitors perform better than firms that have
strong ties with their competitors.
4(a) Firms that have strong ties with larger firms perform better than firms that have
weak ties with larger firms.
4(b) Firms that have weak ties with larger firms perform better than firms that have
strong ties with larger firms.

7/30/2019 Alarape and Nassar
http://slidepdf.com/reader/full/alarape-and-nassar 6/22
The Conceptual Framework for the Study
In explaining entrepreneurship and small business firms, the SNA applies network
concept in four different manners. These are: (1) the effect of social forces that increase the
density of networks, (2) the role of brokers and other persons or organizations that increase
the accessibility of networks, (3) the importance of linkage diversity to the question of
which positions in networks are most likely to produce entrepreneurs, and (4) the
importance of the social resources embedded in entrepreneur’s network. However, these are
based on the premises that (i) the entrepreneurial process involves the gathering of scarce
resources (finance, and other material resource like information, ideas, advice, customers
among others and (ii) resources are usually obtained through the entrepreneur’s personal
network.
In this aspect, a social network provides the entrepreneur with information, support,
contact, and credibility. Hence, the SNA is necessary for the analysis of business relations
because economic actions are infused and mixed with social context and the embedded
business relations is a focal issue in social network analysis (Granovetter 1985, Johannisson
1990, Uzzi 1997). However, since it reveals how actors such as entrepreneurs use their
social relations to obtain necessary resources in carrying out economic activities, it
complements the resource-based view.
The foci of RBV are competitive advantages generated by the firm, from its unique
set of resources (Wernerfelt, 1984; Barney, 1986, 1991; Peteraf, 1993). The RBV is based
on the assumptions that: (i) firm resource heterogeneity - firms can be thought of as bundles
of productive resources and that different firm possesses different bundles of these
resources (Penrose, 1959, Barney 1991); and (ii) resource immobility - some of these
resources are either very costly to copy or inelastic in supply (Richardo, 1966).
7/30/2019 Alarape and Nassar
http://slidepdf.com/reader/full/alarape-and-nassar 7/22
Therefore, the RBV describes a firm in terms of the resources that firm integrates.
Thus, for a firm to take high levels of performance and a sustained competitive advantage, it
needs to integrate variant resources that should be difficult to create, to substitute or to
imitate by other firms. These resources can be tangible or intangible in nature. Tangible
resources include capital, access to capital and location (among others). Intangible resources
consist of knowledge, skills and reputation, entrepreneurial orientation, among others
(Runyan et al ., 2006). In this sense, this theory defends that, under imperfection of markets
exists a diversity of firms and a variation in the specialisation degrees that provokes a
limited transfer of resources, which present type, magnitude and different nature (Amit and
Schoemaker, 1993).
Therefore, the main reason for firms grow and success is inside of the firms, that is,
firms with resources will build up a basis for gaining and sustaining competitive advantage
(Peteraf, 1993; Ferreira and Azevedo 2007). The SNA thus provide the explanation for the
ways the firm utilised the personalised relations to gain access to this resources and have
sustained competitive advantage in the markets. The firm with the greater resources due to
the strong ties it has with the members of its social networks will be more equipped with
necessary physical and financial resources. Hence, have higher performance compared to
firms with weak ties that cannot equally access the resources.
The Research Methods
The data for the study were collected from 279 firms from a sample frame of one
thousand and forty seven (1,047) SMEs. The two hundred and seventy nine firms are
selected using proportionate stratified random sampling procedure. The questionnaire was
drawn to collect relevant information on the growth performance of SMEs, the forms of
7/30/2019 Alarape and Nassar
http://slidepdf.com/reader/full/alarape-and-nassar 8/22
relationship in the SMEs networks and the state of the physical and financial resources in
the SMEs.
The performance of the firms was measured using the growth rate in total assets
calculated based on Gilbrat’s rule. Mathematically, the growth rate is expressed as:
X t1 = X t0 (1+g) t1-t0
Then, g = X t1 1/t1-t0 − 1X t0
g refers to growth rate(GR), i.e. the annual growth rate
X t1 refers to the value of the unit of measure (i.e. assets, employee as at
inception).X t0 refers to the value of the unit of measure (i.e. assets, employee as
present).
The relational embeddedness is expressed in terms of the nature of relevant actors in
the networks, such as: (i) the Bank manager, (ii) the Business Counsellor, (iii) Competitors,
and (iv) the relations with larger firms.
Furthermore, relationship that is at acquaintance’s level is regarded as weak ties and
the one friendly is regarded as strong ties.
The data collected were analysed using descriptive and inferential statistics
The frequencies distribution and percentages are employed for describing the sample
population. The t-test is employed in comparing the mean-values of performance of firms
having personalised strong ties to firms having weak ties. The Kruskal-Wallis’s test
compares the rank the mean performance of the firms based on the extensiveness of
utilising relationship with members of network. The Correlation test is employed to test the
significance of the relationship in firm’s network on performance.
7/30/2019 Alarape and Nassar
http://slidepdf.com/reader/full/alarape-and-nassar 9/22
Result and Discussion
The Description of the Relational Embeddedness among the Sample population
In general, the majority of the firms have weak ties with the members of their
networks. For examples: more than seventy percent (i.e. 72.6%) have weak ties with bank
mangers, seventy seven percent (77%) have weak ties with business counsellor, eighty four
percent (84.4%) have weak ties with fellow firms in the same business (i.e. competitors)
and eighty five percent (85%) have weak ties with larger firms. Whereas, only twenty seven
percent (i.e. 27.4%) have strong ties with their bank managers, twenty-three percent (i.e.
22.9%) have strong ties with business counsellor, fifteen percent have strong ties with
competitors and another fifteen percent have strong ties with larger businesses (see Table
1).
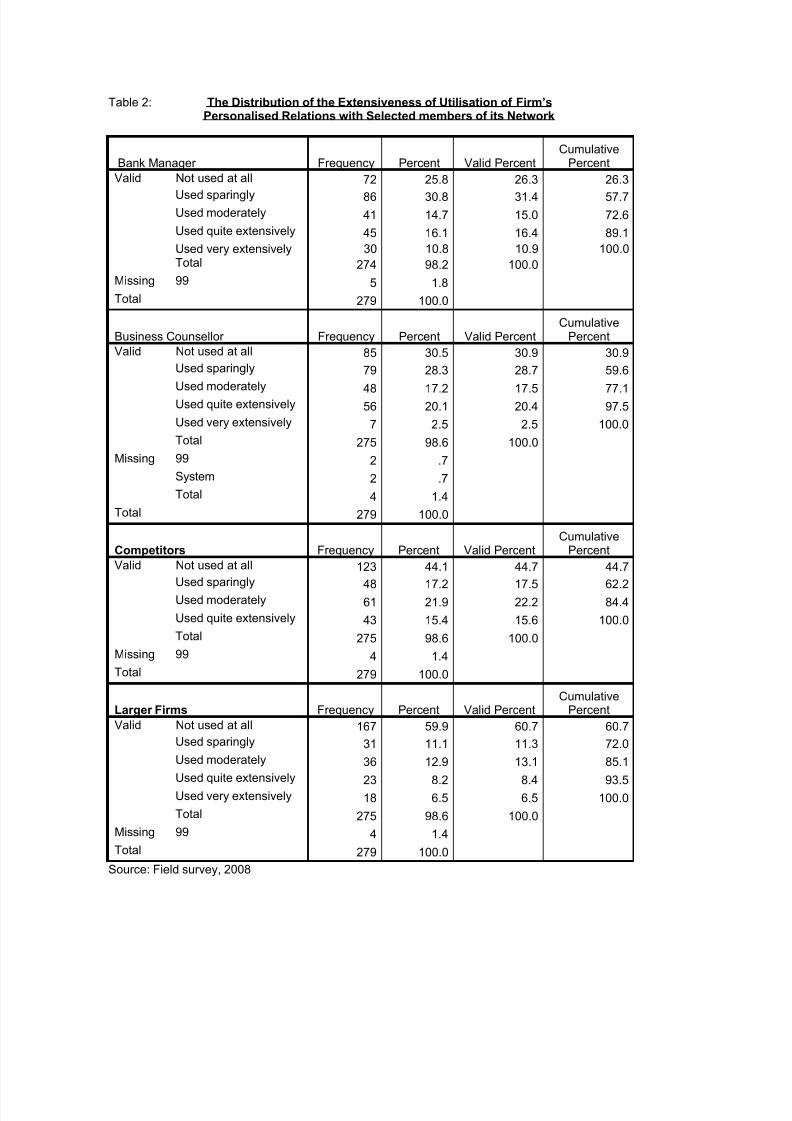
Furthermore, less than twenty percent moderately, quite extensively or very
extensively utilized their relations with bank managers. While, twenty six percent and
thirty-one percent do not used or sparingly utilized the relationship they have with their
bank managers. The above pattern is replicated in terms of the utilization of relationship
with business counsellors by the firms. Eighteen percent, twenty percent and three percent
of the firms moderately, quite extensively and very extensively utilized their relationship
with their business counsellors, While, more than fifty percent of the firms do not utilize or
sparingly utilize their relationship with business counsellors. In addition, more than sixty
percent of the firms do not utilize or sparingly utilize relationship with their fellow firms,
whereas, only thirty-eight percent moderately or quite extensively utilize their relationship
with fellow firms. However, no firms extensively utilize the relationship with fellow firms.
With respect to having relationship with larger firms: seventy two percent do not utilize or
sparingly utilize their relationship with larger firm in their network but thirteen percent,
eight percent and seven percent moderately, quite extensively and very extensively utilize
their relationship with larger firms in their network (see Table 2).
The Effect of Relational Embeddedness on the Performance of Firms
The mean value of the performance measure growth in assets of the firms is
generally low. The annual growth rate of firms with weak ties is .03 percent and the growth
rate of firms with strong ties is -.27 percent. This implied that the performance of small and
7/30/2019 Alarape and Nassar
http://slidepdf.com/reader/full/alarape-and-nassar 10/22
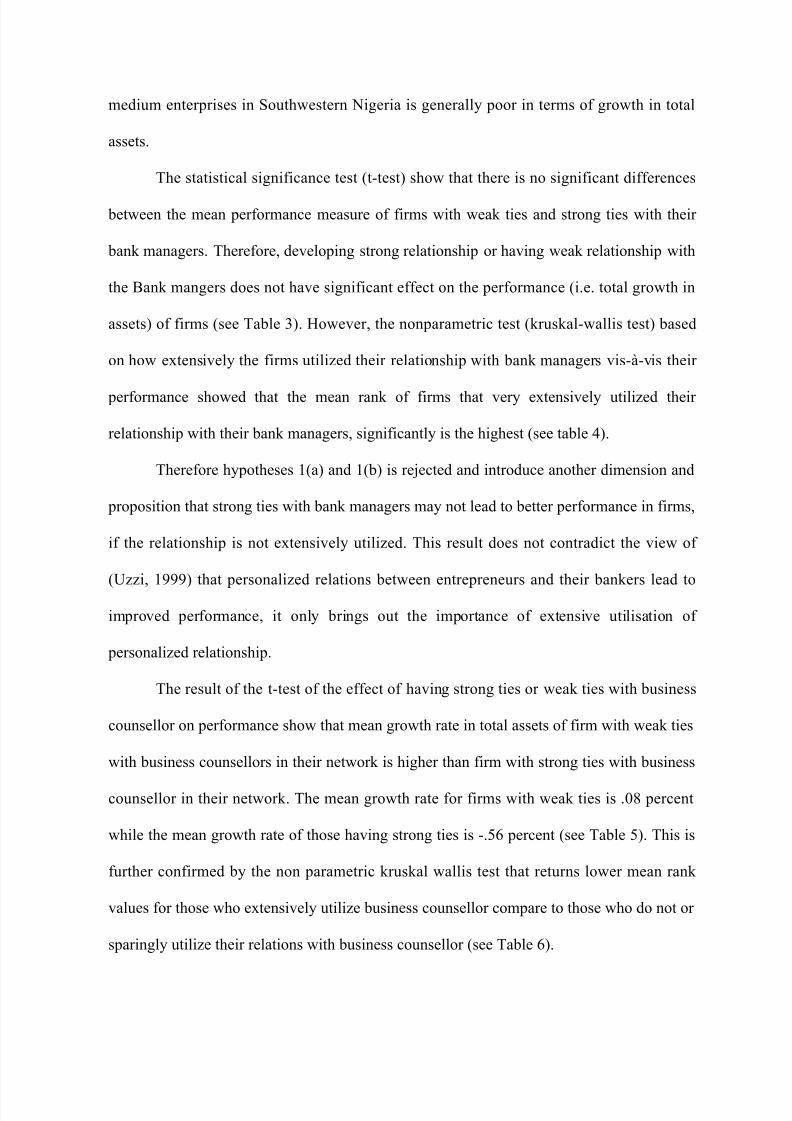
medium enterprises in Southwestern Nigeria is generally poor in terms of growth in total
assets.
The statistical significance test (t-test) show that there is no significant differences
between the mean performance measure of firms with weak ties and strong ties with their
bank managers. Therefore, developing strong relationship or having weak relationship with
the Bank mangers does not have significant effect on the performance (i.e. total growth in
assets) of firms (see Table 3). However, the nonparametric test (kruskal-wallis test) based
on how extensively the firms utilized their relationship with bank managers vis-à-vis their
performance showed that the mean rank of firms that very extensively utilized their
relationship with their bank managers, significantly is the highest (see table 4).
Therefore hypotheses 1(a) and 1(b) is rejected and introduce another dimension and
proposition that strong ties with bank managers may not lead to better performance in firms,
if the relationship is not extensively utilized. This result does not contradict the view of
(Uzzi, 1999) that personalized relations between entrepreneurs and their bankers lead to
improved performance, it only brings out the importance of extensive utilisation of
personalized relationship.
The result of the t-test of the effect of having strong ties or weak ties with business
counsellor on performance show that mean growth rate in total assets of firm with weak ties
with business counsellors in their network is higher than firm with strong ties with business
counsellor in their network. The mean growth rate for firms with weak ties is .08 percent
while the mean growth rate of those having strong ties is -.56 percent (see Table 5). This is
further confirmed by the non parametric kruskal wallis test that returns lower mean rank
values for those who extensively utilize business counsellor compare to those who do not or
sparingly utilize their relations with business counsellor (see Table 6).

7/30/2019 Alarape and Nassar
http://slidepdf.com/reader/full/alarape-and-nassar 11/22
In addition, the non-parametric bivariate correlation further confirmed the above
trend. There is a significant negative relationship (i.e. Kendall’s tau b = -.180 and rho =
-.250) between the extensiveness of utilizing business counsellor and the growth
performance of firms at 99 percent confidence level (Table 7). Hypotheses 2(a) is rejected
and 2(b) is upheld that firms with weak ties with their business counsellor perform better
than firms that have strong ties with their business counsellor. This support the findings of
Burt (1992) that Weak ties are also performance boosting devices because vaguely defined
relationships provide that crucial freedom to act upon opportunities and entrepreneurs are
likely to gain most being not bound by expectations and obligations.
The analysis of the relational effect of weak ties or strong ties with fellow firms (i.e.
competitors) shows that both types of relationships return negative growth rates in total
assets of the firms. However, the t-test of the effect of the relations on performance shows
that they are not significant (see Table 8). The nonparametric Kruskal-Wallis’s test shows
that the extensiveness of utilizing the relations with fellow firms in the same business does
not have significant effect on the performance of the firms 9see Table 9). Thus, hypotheses
3(a) and 3(b) is rejected. The non significance of the effect of the modes of relationship firm
has on other competitively related firms is because competitively related firms see one
another as rivals and do not cultivate the required networking relationship that could
significantly reduce the cost of transactions by internalizing the advantages of economics of
scale as postulated by Nassar and Remi Alarape (2007).
The result of test of the personalized relationship of small firms with larger firms
shows that the mean performance value of firms with weak ties is significantly higher than
mean performance value of firms with strong ties with larger firms (see Table 10). The
nonparametric test of the extensiveness of utilizing personalized relations with larger firms
shows that the mean rank of the performance measure (growth in total assets) of those who

7/30/2019 Alarape and Nassar
http://slidepdf.com/reader/full/alarape-and-nassar 12/22
do not utilize or sparingly utilize the personalized relations is higher than those who quite
and very extensively utilize the personalized relations with larger firms (Table 11).
This is further confirmed through nonparametric correlation test. The result of the
correlation test show that the extensiveness of utilizing the personalized relations is
significantly negative related to performance (see Table 12).Therefore, hypothesis 4(a) is
rejected and hypothesis 4 (b) is upheld. This implies that firms with weak ties with larger
firms perform better than firms that have strong ties with larger firms. This may result from
lack of what Uzzi (1997) describes as trust building, information transfer, and joint problem
solving arrangements in the relationship between firms.
Conclusion
This study contributes to the literature on the empirical effect of relational embeddedness on
performance of SMEs by investigating the effect of strong ties and weak ties of small firms
with selected members (bank managers, business counsellor, competitors and larger firms)
of its network on growth performance of SMEs. Study of this nature is scarce in this part of
the world, thus, it is of high relevance to researchers interested in explaining firm
performance from a sociological perspective.
The results of this study complement existing studies, and it suggests that
personalised strong ties with members of firm’s network is not sufficient to lead to high
performance, it has to be extensively utilised. This is because weak ties or non-extensive
cultivation of personalised relations can also lead to high performance due to the removal of
unnecessary pressure, obligations and expectations that can adversely affect the
performance of firms as previously explained by Burt (1992).
Therefore, firms need not only cultivate strong informal relationship with member
of its business network but it should be extensively utilised for the good of the business.
Firms should be very careful in developing strong informal relations because not all such
relations contributed positively to performance.
Despite the fact that the study does not provide information on those factors that
may make developing strong or weak informal relations with members of the firm’s

7/30/2019 Alarape and Nassar
http://slidepdf.com/reader/full/alarape-and-nassar 13/22
network to be injurious or catalyst for improved performance, this may be focus of future
research. However, this has not limit its relevance and application by researchers, trainers,
owner-managers of SMEs and other practitioners because it highlights the effects of
personalised relationship on performance of firms and the importance of well-cultivated
informal relationship on growth performance of SMEs. Thus, the study has enhanced the
understanding of the relevance of firm’s social relations with the members of its business
network in the explanation of the dynamism of firm’s performance.

7/30/2019 Alarape and Nassar
http://slidepdf.com/reader/full/alarape-and-nassar 14/22
References
Amit, R. and Schoemaker, P. 1993, ‘Strategic assets and organizational rent, Strategic Management Journal , vol. 14, pp. 33-46.
Barney, J, 1986, ‘Strategic factor markets: expectations luck and business strategy’, Management Science , vol. 42, pp. 1231-1241.
Barney, J. 1991, ‘Firm resources and sustained competitive advantage’, Journal of Management , vol. 17, pp. 99-120.
Burt, R. (1992) Structural holes, The social structure of competition , Cambridge:Harvard University Press
Butler, R., and Sohod, S., (1995), ‘Joint-Venture Autonomy: Resource Dependence andTransaction Costs Perspectives’, Scandinavian Journal of Management , Vol. 11,
No. 2, pp. 159-175.
Galunic, C. & Moran, P. (1999) Social capital and productive exchange: Structural and relational embeddedness and managerial performance link . manuscript, LondonBusiness School
Granovetter, M. (1985) “Economic action and social structure: The problem of embeddedness.” American Journal of Sociology , 91 (3): 481-510.
Granovetter, M. (1990) “The old and the new economic sociology: A history and anagenda.” Beyond the market place: Rethinking economy and society ed. R. Friedland& A. Robertson, 89-112. New York: Walter de Gruyter.
João Ferreira and Susana Azevedo S.G (2007 ) “ The Impact of Entrepreneurial Orientationand Resource-Based View on Growth of Small Firms” . 30 th Institute of SmallBusiness and Entrepreneurship Conference, 7 th – 9 th November, 2007, Glasgow,Scotland
Johannisson, B. (1990), ‘Economies of Overview – Guiding the External Growth of SmallFirms’, International Small Business Journal , Vol. 9, no. 1, pp. 32 – 44.
Nassar and Remi Alarape (2007) “ Small Business Learning Networks, Growth rate and operational Efficiency” , Eight International Conference on HRD Research andPractice Across Europe, Oxford Brookes University, UK, 27-29 June 2007.
Penrose, E. 1959, “ The Theory of the Growth of the Firm" , Oxford: Basil Blackwell.
Peteraf, M. 1993, “The cornerstone of competitive advantage: A Resource-Based View”,Strategic Management Journal , vol. 14, pp. 179-191.
Pfeffer, J., and Salancik, G. R., (1978), ‘ The External Control Organizations: A Resource Dependence Perspective’ , Harper and Row Publishers, New York.
Ricardo, D. 1966, Economic Essays . New York: A. M. Kelly Runyan et al ., 2006

7/30/2019 Alarape and Nassar
http://slidepdf.com/reader/full/alarape-and-nassar 15/22
Ring, P. S., and Van de Ven, A, H., (1994), ‘Developmental Processes of Cooperative Inter-organizational Relationships’, Academy of Management Review , Vol. 19, pp. 90-118
Runyan, R., Huddleston, P. and Swinney, J. 2006, Entrepreneurial orientation and social
capital as small firm strategies: a study of gender differences from a Resource-BasedView’, Entrepreneurship Management , vol. 2, pp. 455-477
Wernerfelt, B. 1984, ‘A resource-based view of the firm’, Strategic Management Journal ,vol. 5, pp. 171-180.
Uzzi, B. (1997), ‘Social Structure and Competition in Inter-firm Networks: The Paradox of Embeddedness', Administrative Science Quarterly , Vol. 42 (1), pp. 35-67.
Uzzi, B., (1999), ‘Embeddedness in the Making of Financial Capital: How Social Relationsand Networks Benefit Fir ms Seeking Financing’, American Sociological Review ,Vol. 64, pp. 481-505.

7/30/2019 Alarape and Nassar
http://slidepdf.com/reader/full/alarape-and-nassar 16/22
App endix
Table 1: The Distribution of the Relational Strength of the Firms with Selected
Members of the its Network
Bank manager Frequency PercentValid
PercentCumulative
PercentValid weak 199 71.3 72.6 72.6
strong 75 26.9 27.4 100.0Total 274 98.2 100.0
Missing 99 5 1.8Total 279 100.0
Business counsellor Frequency PercentValid
PercentCumulative
PercentValid weak 212 76.0 77.1 77.1
strong 63 22.6 22.9 100.0Total 275 98.6 100.0
Missing 99 4 1.4Total 279 100.0
Competitor Frequency Percent
ValidPercent
CumulativePercent
Valid weak 232 83.2 84.4 84.4strong 43 15.4 15.6 100.0Total 275 98.6 100.0
Missing 99 4 1.4Total 279 100.0
Larger firms Frequency PercentValid
PercentCumulative
PercentValid weak 234 83.9 85.1 85.1
strong 41 14.7 14.9 100.0Total 275 98.6 100.0
Missing 99 4 1.4Total 279 100.0
Source: Field survey 2008
7/30/2019 Alarape and Nassar
http://slidepdf.com/reader/full/alarape-and-nassar 17/22
Table 2: The Distribution of the Extensiveness of Utilisation of Firm’sPersonalised Relations with Selected members of its Network
Bank Manager Frequency Percent Valid PercentCumulative
PercentValid Not used at all 72 25.8 26.3 26.3
Used sparingly 86 30.8 31.4 57.7Used moderately 41 14.7 15.0 72.6Used quite extensively 45 16.1 16.4 89.1Used very extensively 30 10.8 10.9 100.0Total 274 98.2 100.0
Missing 99 5 1.8Total 279 100.0
Business Counsellor Frequency Percent Valid PercentCumulative
PercentValid Not used at all 85 30.5 30.9 30.9
Used sparingly 79 28.3 28.7 59.6Used moderately
48 17.2 17.5 77.1Used quite extensively 56 20.1 20.4 97.5Used very extensively 7 2.5 2.5 100.0Total 275 98.6 100.0
Missing 99 2 .7System 2 .7Total 4 1.4
Total 279 100.0
Competitors Frequency Percent Valid PercentCumulative
PercentValid Not used at all 123 44.1 44.7 44.7
Used sparingly48 17.2 17.5 62.2Used moderately 61 21.9 22.2 84.4
Used quite extensively 43 15.4 15.6 100.0Total 275 98.6 100.0
Missing 99 4 1.4Total 279 100.0
Larger Firms Frequency Percent Valid PercentCumulative
PercentValid Not used at all 167 59.9 60.7 60.7
Used sparingly 31 11.1 11.3 72.0Used moderately 36 12.9 13.1 85.1Used quite extensively
23 8.2 8.4 93.5Used very extensively 18 6.5 6.5 100.0Total 275 98.6 100.0
Missing 99 4 1.4Total 279 100.0
Source: Field survey, 2008

7/30/2019 Alarape and Nassar
http://slidepdf.com/reader/full/alarape-and-nassar 18/22
Table 3: The Result of the T-Test of Effect of Firm Relationship with Bank
Managers on Performance of Firms Group Statistics
Bank manager N Mean Std. DeviationStd. Error
MeanGrowth in Asset Weak 175 .0303 2.13425 .16133
Strong 74 -.2714 2.03898 .23703
Independent Samples Test
Levene's Testfor Equality of
Variances t-test for Equality of Means
F Sig. t Df Sig. (2-tailed)
MeanDifference
Std. Error Difference
95% ConfidenceInterval of the
Difference
Lower Upper Growthin
Asset
Equalvariancesassumed
1.616 .205 1.033 247 .303 .30165 .29210 -.27367 .87698
Equalvariances notassumed
1.052 143.397 .295 .30165 .28672 -.26510 .86840
Table 4: Kruskal –Wallis Mean Ranks Test of Performance of SMEs andthe Extensiveness of Utilising the Relationship with Bank Managers
Bank Managers N Mean Rank
Growth in Asset Not used at all 60 144.00Used sparingly 76 114.84Used moderately 28 102.27Used quite extensively 44 72.61Used very extensively 25 153.38Total 233
Test Statistics(a,b)
Growth in AssetChi-Square 37.435Df 4
Asymp. Sig. .000a Kruskal Wallis Testb Grouping Variable: Bank manager
Table 5: The Result of the T-Test of Effect of Firm Relationship with

7/30/2019 Alarape and Nassar
http://slidepdf.com/reader/full/alarape-and-nassar 19/22
Business Counsellors on Performance of Firms
Group Statistics
Business counsellor N Mean Std. DeviationStd. Error
MeanGrowth in Asset Weak 194 .0808 2.35591 .16914
Strong 56 -.5576 .47411 .06336
Independent Samples Test
Levene's Testfor Equality of
Variances t-test for Equality of Means
F Sig. T df Sig. (2-tailed)
MeanDifference
Std. Error Difference
95% ConfidenceInterval of the
Difference
Lower Upper Growthin
Asset
Equalvariancesassumed
6.551 .011 2.014 248 .045 .63847 .31709 .01394 1.26299
Equalvariances notassumed
3.535 234.740 .000 .63847 .18062 .28262 .99431
Table 6: Kruskal –Wallis Mean Ranks Test of Performance of SMEs and theExtensiveness of Utilising the Relationship with Business Counsellor
Business Counsellor N Mean Rank
Growth in Asset Not used at all 75 145.37Used sparingly 76 131.30Used moderately 43 124.59Used quite extensively 49 86.23Used very extensively 7 130.00Total 250
Test Statistics(a,b)
Growth in
AssetChi-Square 20.649Df 4
Asymp. Sig. .000a Kruskal Wallis Testb Grouping Variable: Seek advice of a Consultant in managing biz
Table 7: The Result of the Correlation Test of the relationship of Extensiveness of Utilising the Relationship with Business Counsellor and Performance of Firms

7/30/2019 Alarape and Nassar
http://slidepdf.com/reader/full/alarape-and-nassar 20/22
Growth in
Asset
Seek advice of a Consultant inmanaging biz
Kendall 's tau_b Growth in Asset Correlation Coefficient 1.000 -.180(**)
Sig. (2-tailed) . .000N 254 250
Seek advice of aConsultant inmanaging biz
Correlation Coefficient -.180(**) 1.000Sig. (2-tailed) .000 .
N 250 275
Spearman's rho Growth in Asset Correlation Coefficient 1.000 -.250(**)Sig. (2-tailed) . .000N 254 250
Seek advice of aConsultant inmanaging biz
Correlation Coefficient -.250(**) 1.000Sig. (2-tailed) .000 .
N 250 275
** Correlation is significant at the 0.01 level (2-tailed).
Table 8: The Result of the T-Test of Effect of Firm Relationship with
Competitors on Performance of Firms
Group Statistics
Competitor N Mean Std. DeviationStd. Error
MeanGrowth in Asset Weak 214 -.0129 2.24201 .15326
Strong 36 -.3554 .87837 .14640
Independent Samples Test
Levene's Testfor Equality of
Variances t-test for Equality of Means
F Sig. T df Sig. (2-tailed)
MeanDifference
Std. Error Difference
95% ConfidenceInterval of the
Difference
Lower Upper Growth in
Asset
Equalvariancesassumed
1.614 .205 .904 248 .367 .34259 .37899 -.40386 1.08903
Equalvariances notassumed
1.616 128.415 .108 .34259 .21194 -.07677 .76194
Table 9: Kruskal–Wallis Mean Ranks Test of Performance of SMEs and theExtensiveness of Utilising the Relationship with Competitors

7/30/2019 Alarape and Nassar
http://slidepdf.com/reader/full/alarape-and-nassar 21/22
Competitors NMeanRank
Growth in Asset Not used at all 114 134.65Used sparingly 45 121.53Used moderately 55 114.06Used quite extensively 36 118.96Total 250
Test Statistics(a,b)
Growthin Asset
Chi-Square 3.633df 3
Asymp. Sig. .304a Kruskal Wallis Testb Grouping Variable: relations with Competitors
Table 10: The Result of the T-Test of Effect of Firm Relationship
with Larger firms on Performance of Firms
Group Statistics
Contractual Relations N Mean Std. DeviationStd. Error
MeanGrowth in Asset Weak 213 .0220 2.26239 .15502
Strong 37 -.5466 .40807 .06709
Independent Samples Test
Levene'sTest for
Equality of Variances t-test for Equality of Means
F Sig. t df Sig. (2-tailed)
MeanDifference
Std. Error Difference
95% ConfidenceInterval of the
Difference
Lower Upper Growth
in Asset
Equal
variancesassumed 4.559 .034 1.522 248 .129 .56854 .37358 -.16726 1.30434Equalvariances notassumed
3.366 247.684 .001 .56854 .16891 .23585 .90122
Table 11: Kruskal –Wallis Mean Ranks Test of Performance of SMEs and the
Extensiveness of Utilising the Relationship with Larger firms

7/30/2019 Alarape and Nassar
http://slidepdf.com/reader/full/alarape-and-nassar 22/22
Relations with larger firms N Mean Rank
Growth in Asset Not used at all 152 140.01Used sparingly 28 115.80Used moderately 33 93.23Used quiteextensively 20 92.53Used very extensively 17 113.18Total 250
Test Statistics(a,b)
Growth in
AssetChi-Square 17.861Df 4
Asymp. Sig. .001a Kruskal Wallis Testb Grouping Variable: Develop contractual relations with larger firms
Table 12: The Result of the Correlation Test of the relationship of Extensiveness of Utilising the Relationship with Business Counsellor and Performance of Firms
Growth in
Asset
Developcontractual
relations withlarger firms
Kendall's tau_b Growth in Asset Correlation Coefficient 1.000 -.189(**)Sig. (2-tailed) . .000N 254 250
Develop contractualrelations with larger firms
Correlation Coefficient -.189(**) 1.000Sig. (2-tailed) .000 .N 250 275
Spearman's rho Growth in Asset Correlation Coefficient 1.000 -.249(**)Sig. (2-tailed) . .000N 254 250
Develop contractualrelations with larger firms
Correlation Coefficient -.249(**) 1.000Sig. (2-tailed) .000 .N 250 275
** Correlation is significant at the 0.01 level (2-tailed).