air resources module introduction units/conversions w/ ideal gas law indoor air outdoor air carbon...
Post on 19-Dec-2015
233 views
TRANSCRIPT

Air Resources Module• Introduction• Units/conversions w/ Ideal Gas Law• Indoor Air • Outdoor Air
• Carbon Monoxide, Particulate Matter
• Visibility, Sox, Photochemical Smog
• Air pollution transport• Guassian Plume Model*not all topics are covered in any
given semester.
Engineering 115: Introduction to Environmental Resources Engineering

Air Resources Module
These slides have been developed by Eileen M. Cashman and Elizabeth A. Eschenbach for use in an introductory engineering and environmental science course.
Supported by NSF CCLI DUE program
Figures and photos from text and other copyright sources have been removed.
Engineering 115: Introduction to Environmental Resources Engineering
Agenda
• Air Resources•How is air a resource?•How do we manage air as a
resource?•Clean Air Act•Units

How do we USE air as a resource?
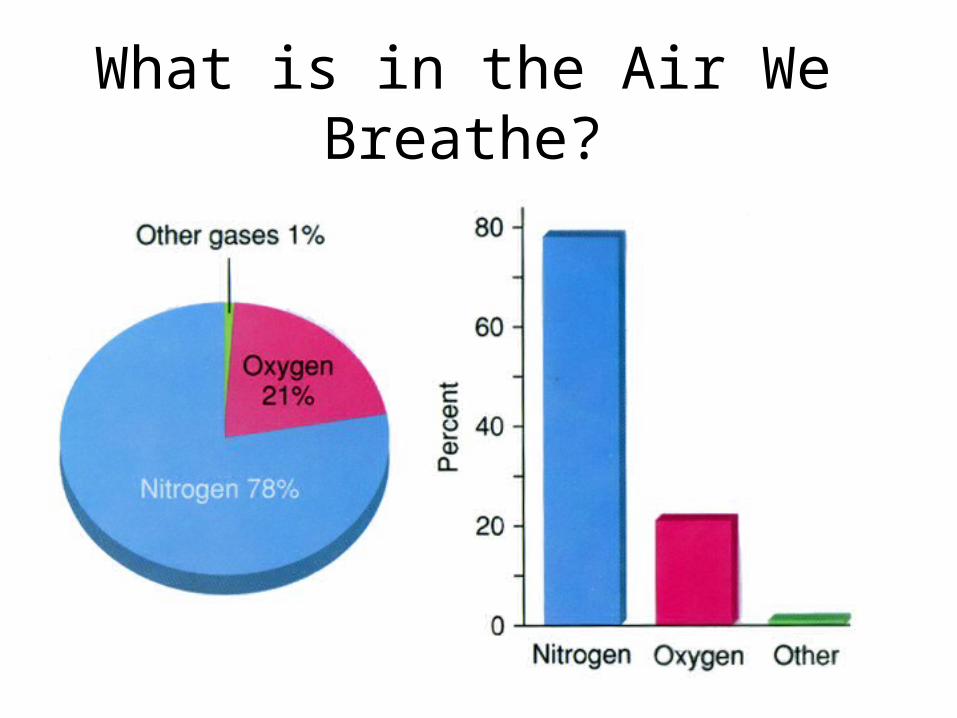
What is in the Air We Breathe?


Some Air Pollution Concerns• Sulfur dioxide (SO2)
• Carbon monoxide (CO)
• Nitrogen oxides (NOx)
• Volatile organic compounds (VOCs)
• Carbon dioxide (CO2) and greenhouse gases
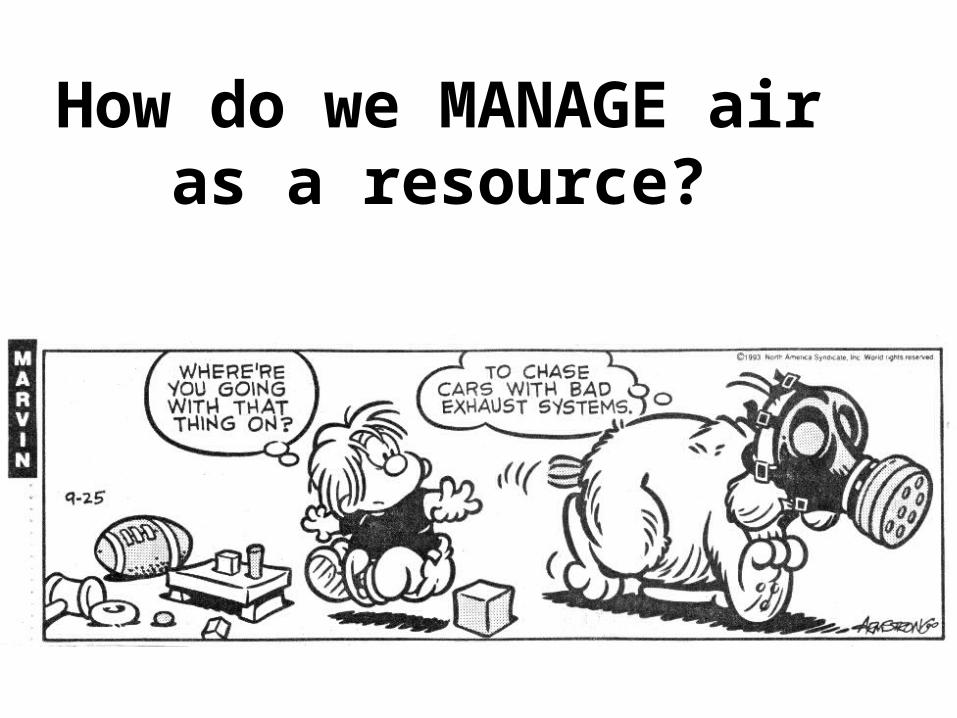
How do we MANAGE air as a resource?

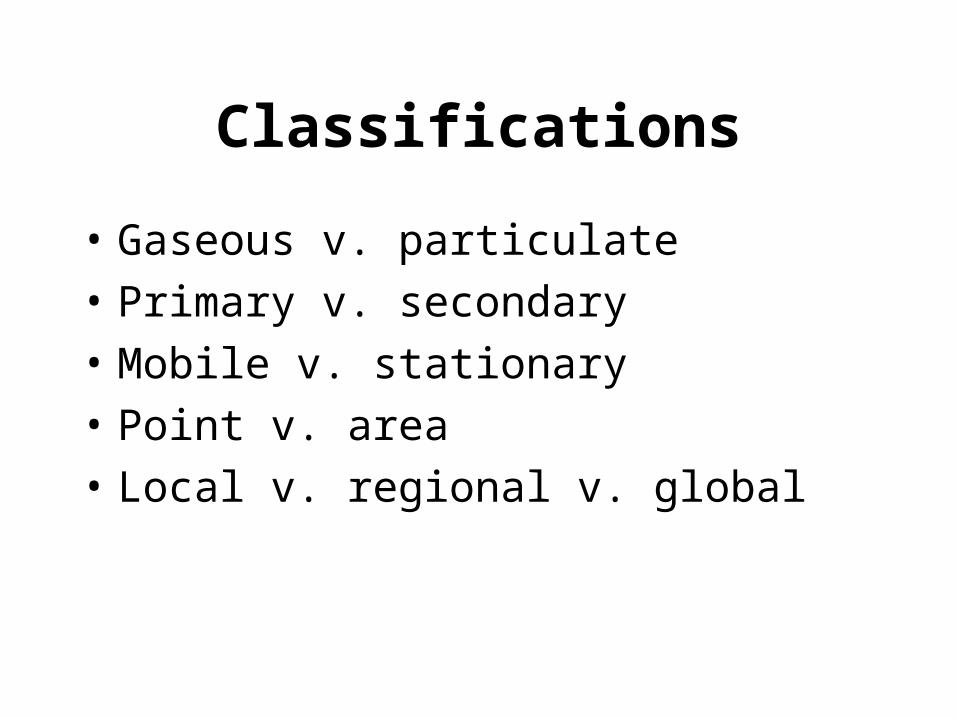
Classifications
• Gaseous v. particulate
• Primary v. secondary
• Mobile v. stationary
• Point v. area
• Local v. regional v. global
Criteria Pollutants
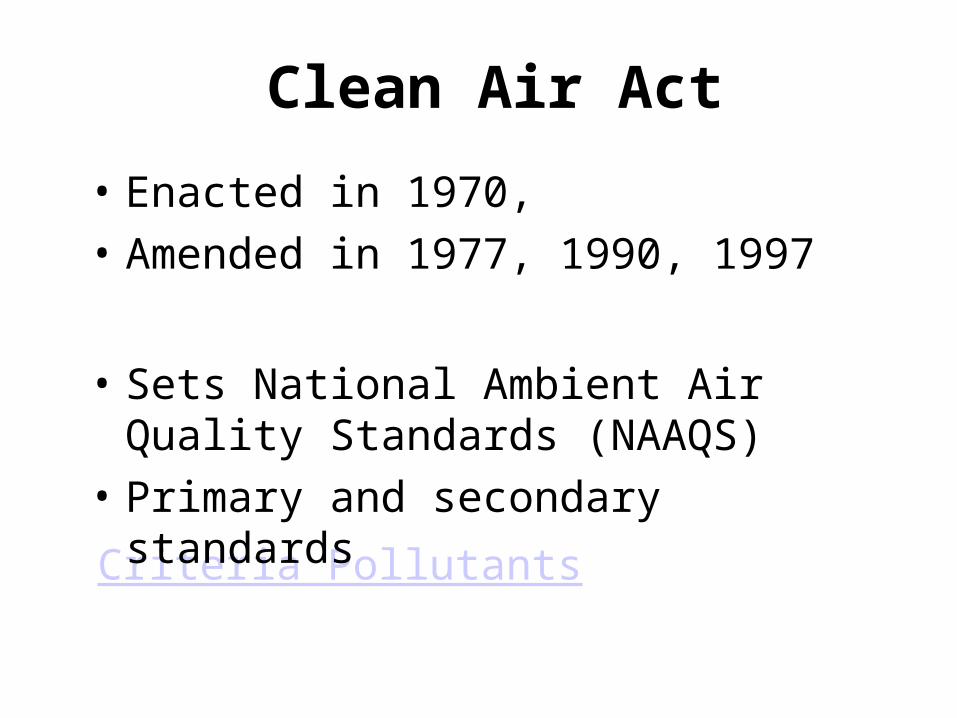
Clean Air Act
• Enacted in 1970,
• Amended in 1977, 1990, 1997
• Sets National Ambient Air Quality Standards (NAAQS)
• Primary and secondary standards
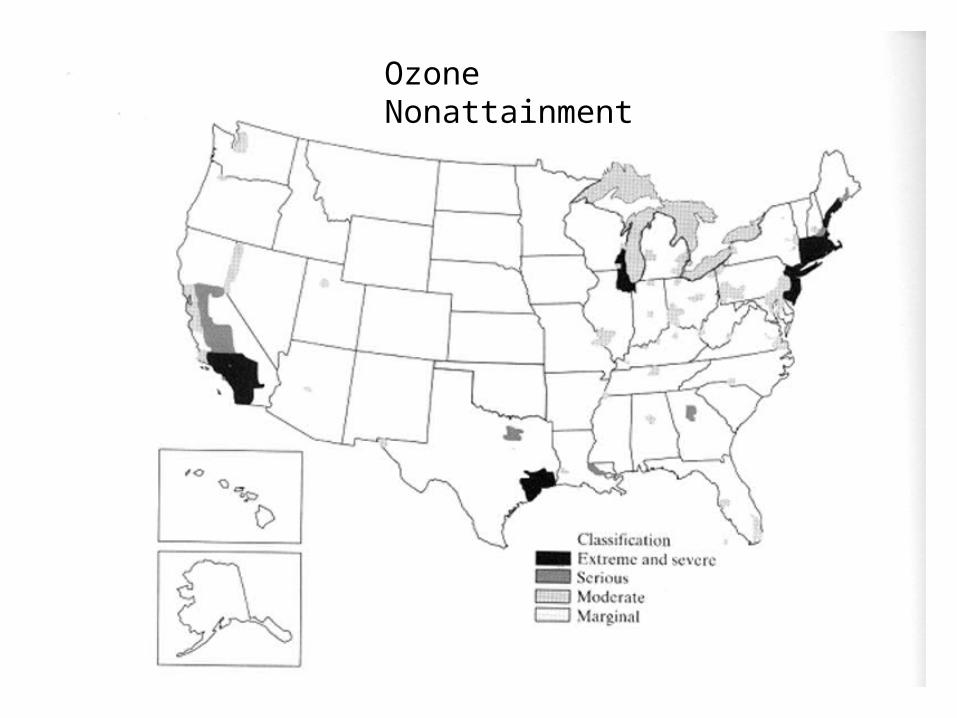
Ozone Nonattainment

Pollution Standard Index
• PSI is method used to develop general air quality index for an area
• Calculated using an index number corresponding to criteria pollutant concentrations (see Example 7.2 and homework problem 7-6)
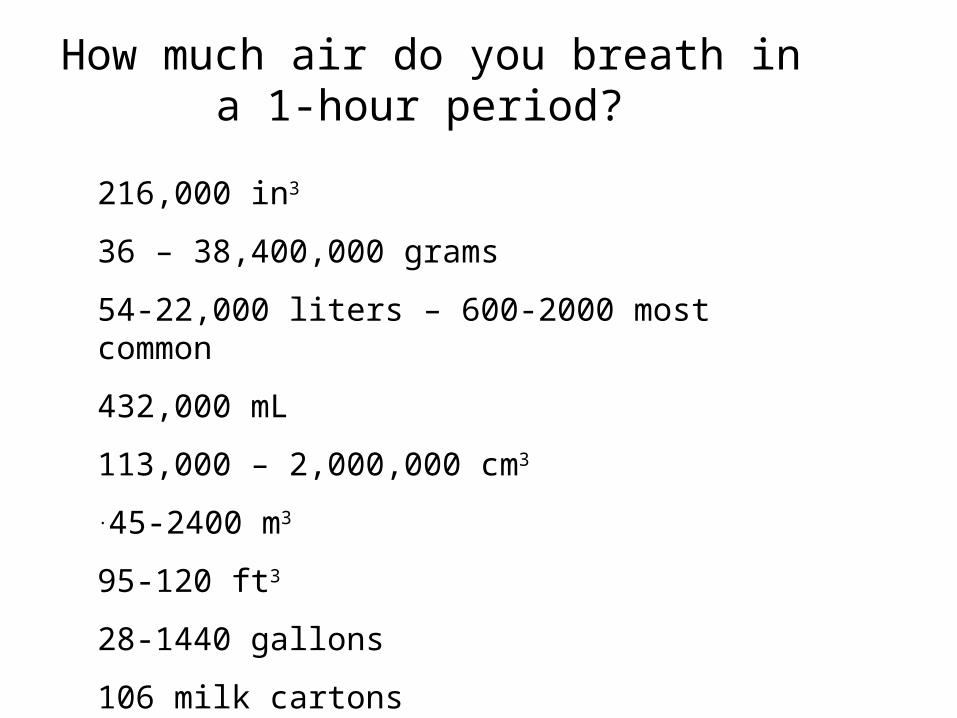
How much air do you breath in a 1-hour period?
216,000 in3
36 – 38,400,000 grams
54-22,000 liters – 600-2000 most common
432,000 mL
113,000 – 2,000,000 cm3
.45-2400 m3
95-120 ft3
28-1440 gallons
106 milk cartons

Quiz AnswersI estimated that I take a breath about every three seconds. I am not sure how I would estimate lung capacity maybe in
liters? So I would say between my two lungs I can hold about two liters of air.
But with each breath I do not fill my lungs to their capacity so I would say each breath is about a liter of air.
So, with a breath every three seconds I would take 20 breath a minute and about 1200 breaths and hour so that would be about 1200 liters of air I breathe in an hour.

O.K. Well, I'm going to say that in one average breath I could inflate a regular balloon with regular elasticity, red in color, out to a radius of 3.4 inches.
By the equation for the volume of a sphere: V=(4/3)(pi)(radius cubed), the volume of air inside of this particular red balloon would be (4/3)(3.1415...)(39.304) = 164.6 cubic in.
So, after timing my breathing for one minute I find that I take 13 breaths per minute. There are still 60 minutes in an hour yeah? So, (13 breaths)X(60 minutes) = 780 breaths in one hour on average.
With each breath I draw an average of 164.6 cu. in. and this equals 13.72 cu.ft. So, (780 breaths)X(13.72 cu.ft.) = 10,701.4 cu.ft. of air in one hour...great googly moogly!

Quiz AnswersTheoretical Lung Capacity Formula v=.041h-.018a-2.69 v= lung capacity in liters, h=height in centimeters, a=age in
years source: www.regentsprep.org/Regents/math/fsolid/TSolids.htm [(5.75 ft.)/(h)]=[(3.28 ft.)/(1 m) h=1.75 m=175 cm v=.041(175)-.018(22)-2.69 v=4.089 liters
Assumption: 1 breath for every 2 seconds. 1800 breaths per hour v=(4.089)(1800)=7360.2 liters per hour

• I thought that this paragraph was very interesting. I got it from:http://www.breathing.com/articles/how-much-air.htm
How much air we breathe in is, as a statistic just by itself, risking being extremely misleading. The answer would move around somewhere between a per breath 1/2 liter in quiet breathing to 6 liters for a tall singing base baritone depending on height, weight, posture, parents genes (big lungs, small lungs, small bones vs big bones, activity quality & intensity) cellular condition, chemistry, emotions (joy, shallow breathing, hyperventilation), breathing skill level, thinking processes and more. Not a great way to get any real clear conclusions.
Considering this, and the fact that peoples breaths per minute range from 4 to 15 or more, I decided that averages of these statistics would not give me a very accurate estimation. Therefore, I decided to take my own measurements.
I found a bag, filled it with air, and breathed in that air. I repeated this process until I could determine how full the bag had to be for me to comfortably breathe all the air in, as naturally as possible. I then filled the bag to that level with water, and then I measured the water. I completed this experiment from start to finish three times in a row. The first time I got 1000ml, the second time I got 890ml and the third time I got 930ml. I used the mean of these numbers to assume that I breathe in about 940ml per breath in a relaxed state.
I then calculated my breaths per minute, by simply counting. I did this several time and came to the assumption that I breathe in about 10 times per minute in a relaxed state.
Based on these measurements, I concluded that, in a relaxed state, I breathe in about 9.4 liters per minute. Hence, 564 liters per hour.
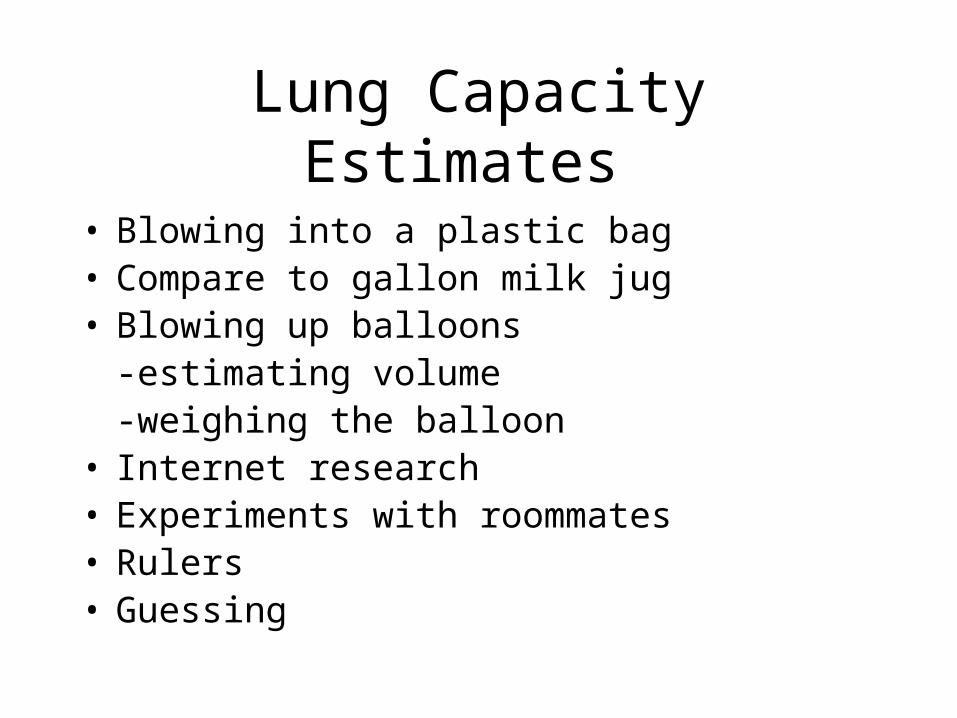
Lung Capacity Estimates
• Blowing into a plastic bag• Compare to gallon milk jug• Blowing up balloons
-estimating volume-weighing the balloon
• Internet research• Experiments with roommates• Rulers• Guessing

57,600 Liters/Day
Assuming:
20 breaths minute
2 liter lung capacity

Units
• PPM means what for– Aqueous Solutions– Gaseous Solutions

Units
• PPM – Aqueous Solutions (mass concentration)
• Mass per 1,000,000 units of mass
• E.g.,– 20 ppm = 20 mg/kg = 20 mg/ 1,000,000 mg
– Gaseous Solutions (volume concentration)• Volume per 1,000,000 units of Volume
• E.g.,– 20 ppm = 20 ml/m3 = 20 ml/1,000,000 ml

Atmospheric Concentration Units
• percent (x)
• parts per million (y)
• parts per billion (z)
x y z100 10 106 9

You try it...
• The smoke inhaled from a cigarette contains about 400 ppm of CO. Express this concentration as a percentage of the air inhaled.
ANSWER: 0.04%
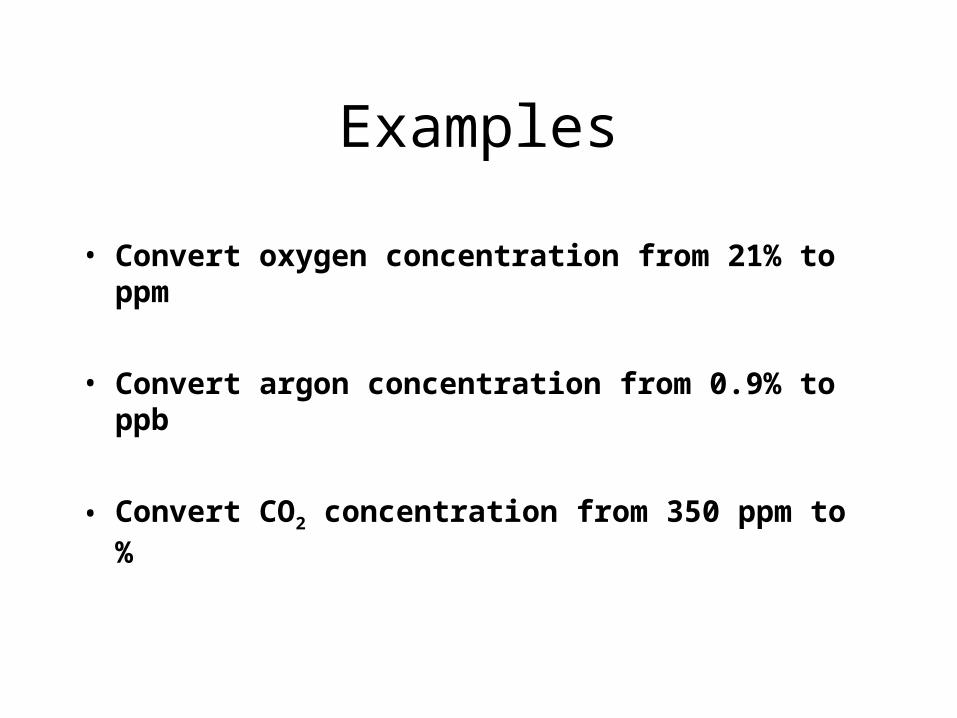
Examples
• Convert oxygen concentration from 21% to ppm
• Convert argon concentration from 0.9% to ppb
• Convert CO2 concentration from 350 ppm to %

Micrograms per Cubic Meter (μg/m3)
• Mass of pollutant / volume of air
1 μg/m3 = 1 ng/L
1 m3 = 1000 Liters
1 μg = 1 x 10⁻⁶ grams
1 ng = 1 x 10⁻⁹ grams
(See Tables A-1.3 and A-1.4 in your Text)


How do we get from one to the other?
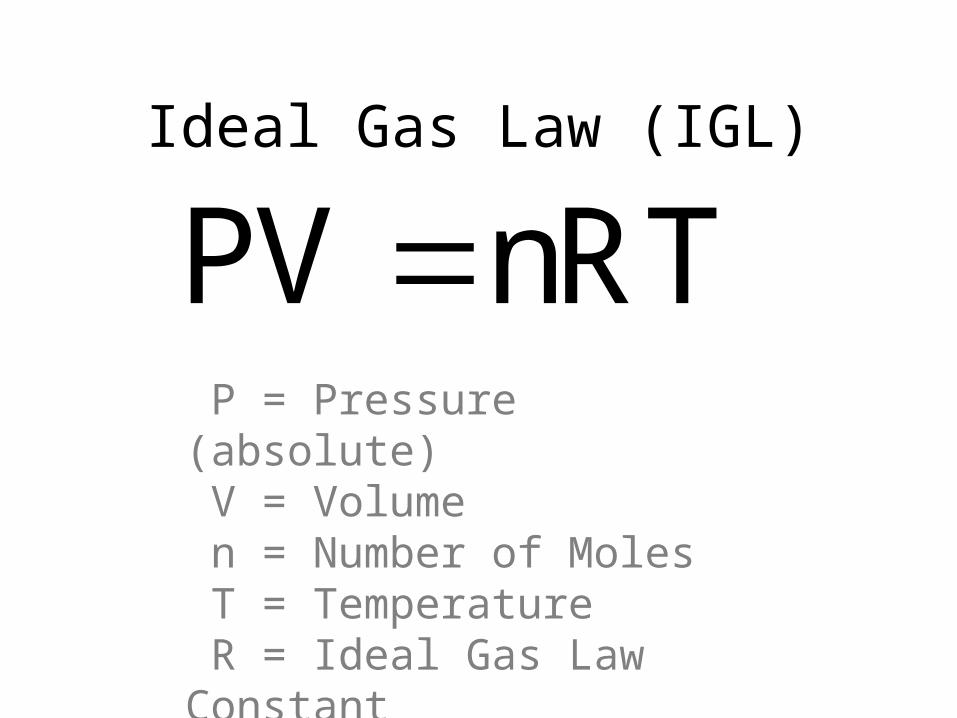
Ideal Gas Law (IGL)
PV nRT P = Pressure (absolute) V = Volume n = Number of Moles T = Temperature R = Ideal Gas Law Constant
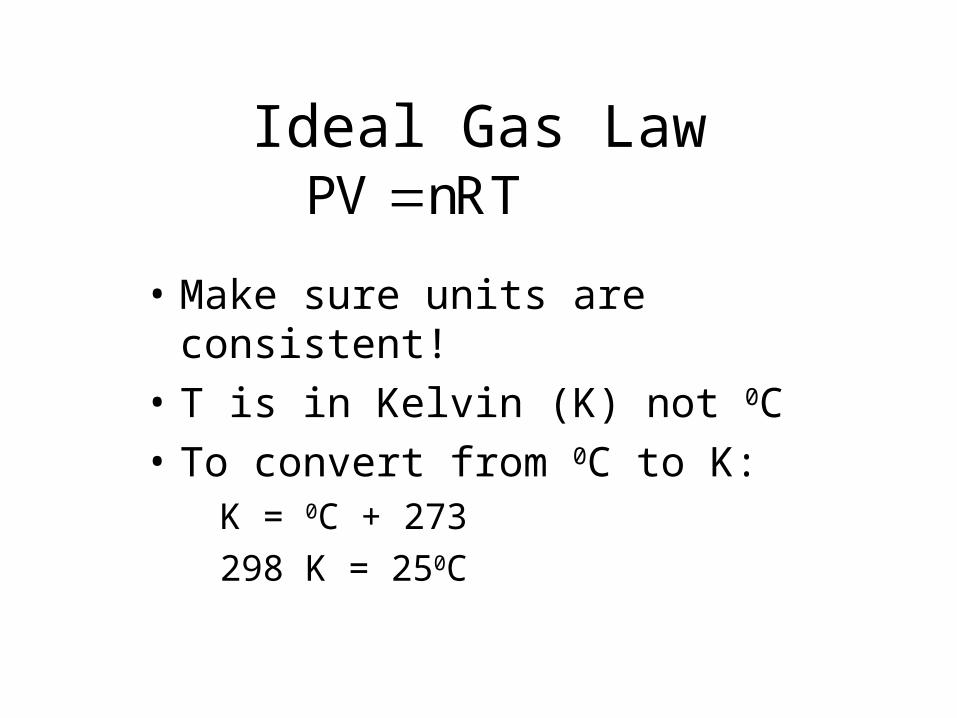
Ideal Gas Law
• Make sure units are consistent!
• T is in Kelvin (K) not 0C
• To convert from 0C to K:K = 0C + 273
298 K = 250C
PV nRT

Ideal Gas Law - Units
If R = 0.0821 L·atm/K·molThen P = 1 atm, V = Liters
If R = 8.31 J/K·molThen P = 101,325 Pa, V = m3

Why would ppm or ppb be the preferred units for standards?
They are independent of Pressure and Temperature

How much Chloroform is this?
Reference to scientific american article


How do we get from one to the other?
• Convert 50 ppm Chloroform (CHCl3 ) to μg/m3.
• Convert 1 ppm Benzene (C6H6) to μg/m3.

How do we get from one to the other?
• Chloroform (CHCl3 )
– 50 ppm = 243,000 μg/m3
• Benzene (C6H6)
– 1 ppm = 3188 μg/m3
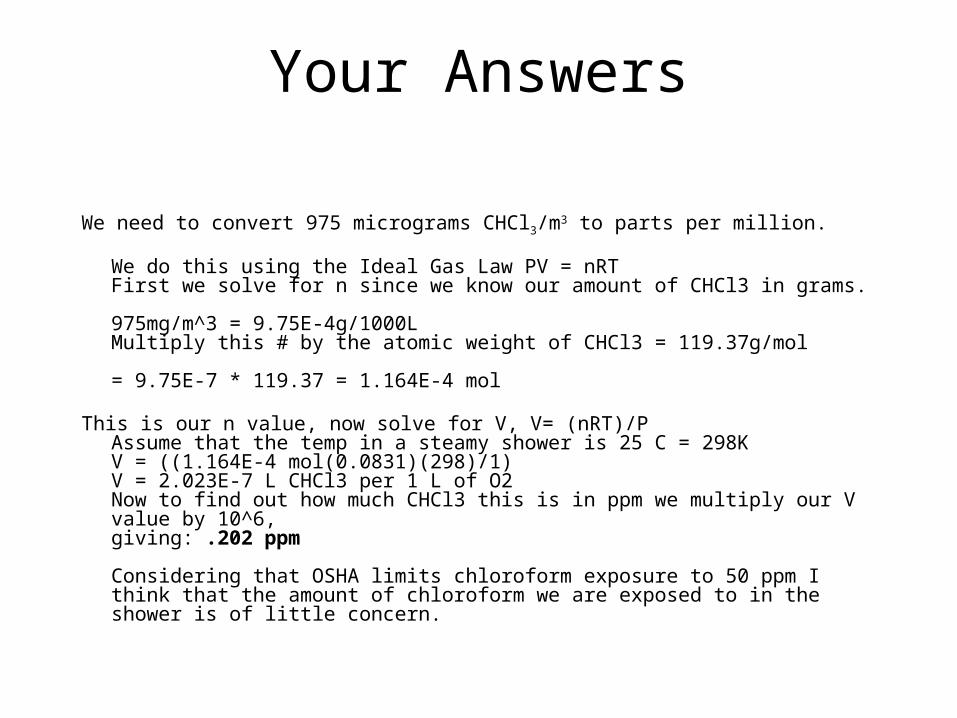
Your Answers
We need to convert 975 micrograms CHCl3/m3 to parts per million.
We do this using the Ideal Gas Law PV = nRTFirst we solve for n since we know our amount of CHCl3 in grams.
975mg/m^3 = 9.75E-4g/1000L Multiply this # by the atomic weight of CHCl3 = 119.37g/mol
= 9.75E-7 * 119.37 = 1.164E-4 mol
This is our n value, now solve for V, V= (nRT)/PAssume that the temp in a steamy shower is 25 C = 298KV = ((1.164E-4 mol(0.0831)(298)/1)V = 2.023E-7 L CHCl3 per 1 L of O2Now to find out how much CHCl3 this is in ppm we multiply our V value by 10^6,giving: .202 ppm
Considering that OSHA limits chloroform exposure to 50 ppm I think that the amount of chloroform we are exposed to in the shower is of little concern.

Your Answers• 50ppm for 8 hours a day 40 hours per work week...
PV=nRTPressure= 1 atmVolume= 50 liter/1,000,000 litersMoles= unknownConstant= .0821Temperature= 293 k(1 atm)(50 liter chlorofrom/1,000,000 liters air) = n(.0821)(293)
number of moles = 2.079 moles
I don't know where else to go from here because I don't know the molecular formula of chloroform, but if I had to take a guess I would say that it is CHCL3, makeing its molecular wieght, 119.368 grams per mole
2.078 moles x 119.368 grams per mole = 248.05 grams
1000 liters = 1 cubic meter
(248.05 grams/liter) x 1,000,000 grams = (248,050,000 micrograms/liter)/1000 liters=
248,050 micrograms/cubic meters allowed in 1 week
I really have no idea idea if this is correct... but if it is, there is no need to worry about excessive exposure to chloroform in your shower.

Your Answers• 50ppm for 8 hours a day 40 hours per work week...
I don't know if i should be concerned, but because of the bioacumulation concept--probably.
PV=nRT is the equation that I tried to figure this one out with.I used:P=pressure at 1atmV=don't know--something in liters or micrograms or cubic meters.n=think I'm trying to find thisR=0.0821 constantT=293 KelvinsChloroform molecular weight=48g/mol
I tried to set the problem up a bunch of different ways and since i couldn't figure the Volume out nothing worked.
• Next i tried using the "conversion equation" at the bottom of page 505 under table 13-3 and that didn't work either.
• Lastly I talked to a chemistry major friend who told me to do this equation (below) on the basis that ppm=micrograms/mL.
(900ug/cubic meter)(cubic meter/100cm cubed)(1cm cubed/1 mL)= 28.6ug/mL = 28.6 ppm chloroform
Then I checked one of the problems in Table 13-3 using this conversion equation (above) and it did not work out, telling me that 28.6 ppm does not equal 900 micrograms.
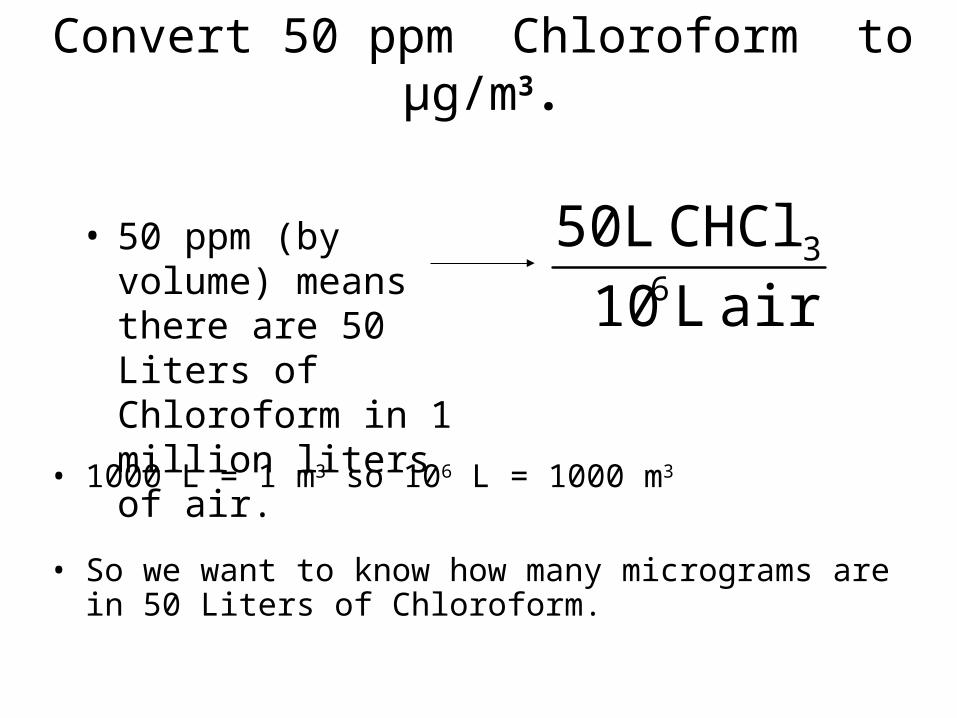
Convert 50 ppm Chloroform to μg/m3.
• 50 ppm (by volume) means there are 50 Liters of Chloroform in 1 million liters of air.
air L10
CHCl L 506
3
• 1000 L = 1 m3 so 106 L = 1000 m3
• So we want to know how many micrograms are in 50 Liters of Chloroform.

Convert 50 ppm Chloroform to μg/m3.
• Use ideal gas law: PV = nRT• Assume P = 1 atm, T = 25C=298 K,
)298)(0821.0(
)50)(1(
KmolK
LatmLatm
RT
PVn
R = 0.0821 L·atm/K·mol
moles 04.2n

Convert 50 ppm Chloroform to μg/m3.
• Chloroform has a molecular weight of 119 grams/mole
gramsmole
grams 243
119 moles 04.2
gg
000,000,243g 1
10 g 243
6

Convert 50 ppm Chloroform to μg/m3.
• So there are 243,000,000 micrograms of Chloroform in 50 Liters of Chloroform
• There are 243,000,000 micrograms of Chloroform in 1 million Liters of air

Emissions vs Exposure
• Discussion from Scientific American Article

Indoor Air Pollution
Chloroform Benzene
• Picture of person in shower
• Picture of person smoking

Indoor Air PollutionSolutions
• Low tech solutions: • Door mats, remove
shoes• Dust sensor on
vacuum cleaner
• Ventilation – use CO2

What are the implications for Regulation and Management?

CO2 Sources (Indoor)
• CO2 is produced from outdoor sources, indoor combustion and metabolic generation
• Average CO2 concentration of exhaled human breath is 4% (40,000 ppm)
• American Society of Heating Refrigeration and Air-Conditioning Engineers (ASHRAE) recommend a value of 1000 ppm
• Major health threat at concentrations of greater than 6% (60,000 ppm)

Impacts
• CO2 is at least an indicator of poor ventilation
• Minor impacts of “stuffiness”, discomfort, shortness of breath, fatigue, lack of attentiveness
• Serious impacts of death

Controls
• Better Ventilation

CO2 data
Air Quality Lab - Annex Chapel
0200400600800
10001200140016001800
9:50 AM 10:04AM
10:19AM
10:33AM
10:48AM
11:02AM
11:16AM
11:31AM
Time
CO
2 le
vel
(pp
m)

CO2 dataCO2 Emissions vs. Time in SCID Room 13
0
100
200
300
400
500
600
700
800
900
1000
10:00AM
10:02AM
10:04AM
10:06AM
10:08AM
10:10AM
10:12AM
10:14AM
10:16AM
10:18AM
10:20AM
10:22AM
10:24AM
10:26AM
10:28AM
10:30AM
10:32AM
10:34AM
10:36AM
10:38AM
10:40AM
10:42AM
10:44AM
10:46AM
Time
CO
2 (
pp
m)

Ventilation Rate < 1 scfm/person
Air Quality Lab - Annex Chapel
0200400600800
10001200140016001800
9:50 AM 10:04AM
10:19AM
10:33AM
10:48AM
11:02AM
11:16AM
11:31AM
Time
CO
2 le
vel
(pp
m)
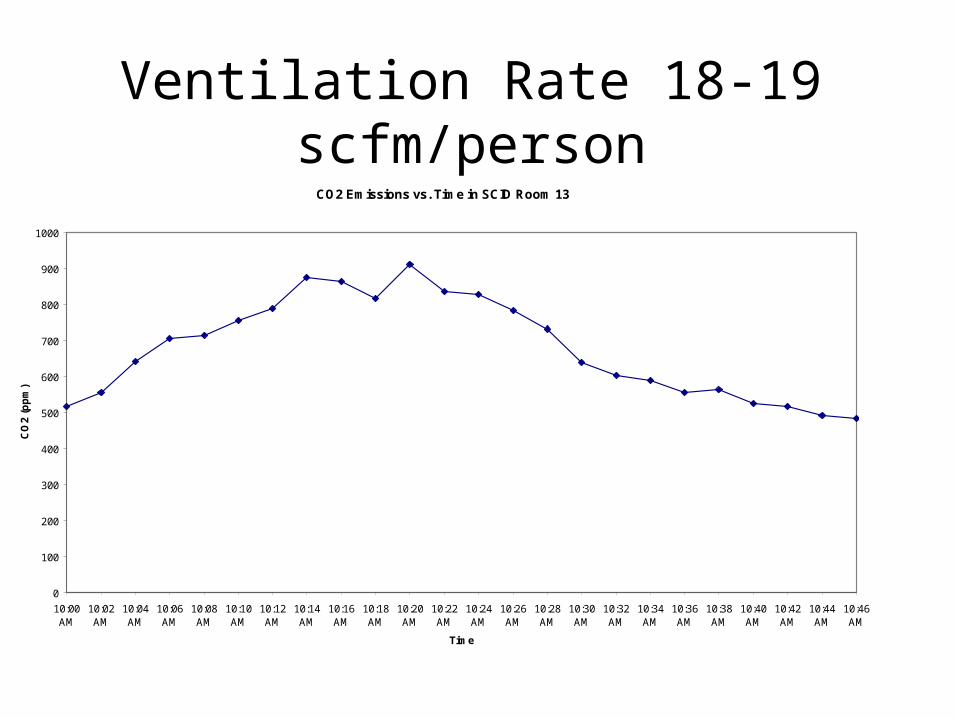
Ventilation Rate 18-19 scfm/personCO2 Emissions vs. Time in SCID Room 13
0
100
200
300
400
500
600
700
800
900
1000
10:00AM
10:02AM
10:04AM
10:06AM
10:08AM
10:10AM
10:12AM
10:14AM
10:16AM
10:18AM
10:20AM
10:22AM
10:24AM
10:26AM
10:28AM
10:30AM
10:32AM
10:34AM
10:36AM
10:38AM
10:40AM
10:42AM
10:44AM
10:46AM
Time
CO
2 (
pp
m)

Other Ventilation Rates
Space Ventilation Rate (scfm/p)
Library Study 6
Camper Van 1
Sci D 5 22-37 nr door,
15-19 nr windows
Dean’s Conference Room
16-19
Theater Arts 114 2-3

Ventilation rate: Theater Arts 114Time CO2 Decay
0 541 05 519 0.169636 Ventilation Rate8 514 0.212561 Design Capacity 20
11 495 0.394883 Volume (ft2) 288015 489 0.460124 Slope 0.021818 492 0.42697120 490 0.44895 Ventilation Rate (scfm/person) 3.139223 496 0.38441225 490 0.44895
Ventilation Rate Analysis y = 0.0218x
R2 = 0.6613
0
0.1
0.2
0.3
0.4
0.5
0.6
0 5 10 15 20 25 30
Time (min)
De
ay
Ra
te

Carbon Monoxide
Sources
• CO is produced from incomplete combustion of hydrocarbonds
• 77% from transportation
• Standards are 9 ppm over 8 hour period, or 35 ppm over 1 hour period
• CO is a primary pollutant and a precursor to low-level ozone

Impacts
• CO is an asphyxiant
• Blood has a higher affinity for CO than O2, so when inhaled, CO forms COHb
• Serious impacts from mental impairment to death

Controls
• Must increase parameters that allow for complete combustion of hydrocarbons
• For mobile sources, we can also: drive less and use alternative fuels
Particulate Matter

Definition
• small particles of dust, soot, fumes, mist, smoke, etc. found in the atmosphere
• Categorized by diameter in microns
• NAAQS standards for PM-10 and PM-2.5 are 150 and 65 micrograms/m3 respectively over a 24 hour period
Sources
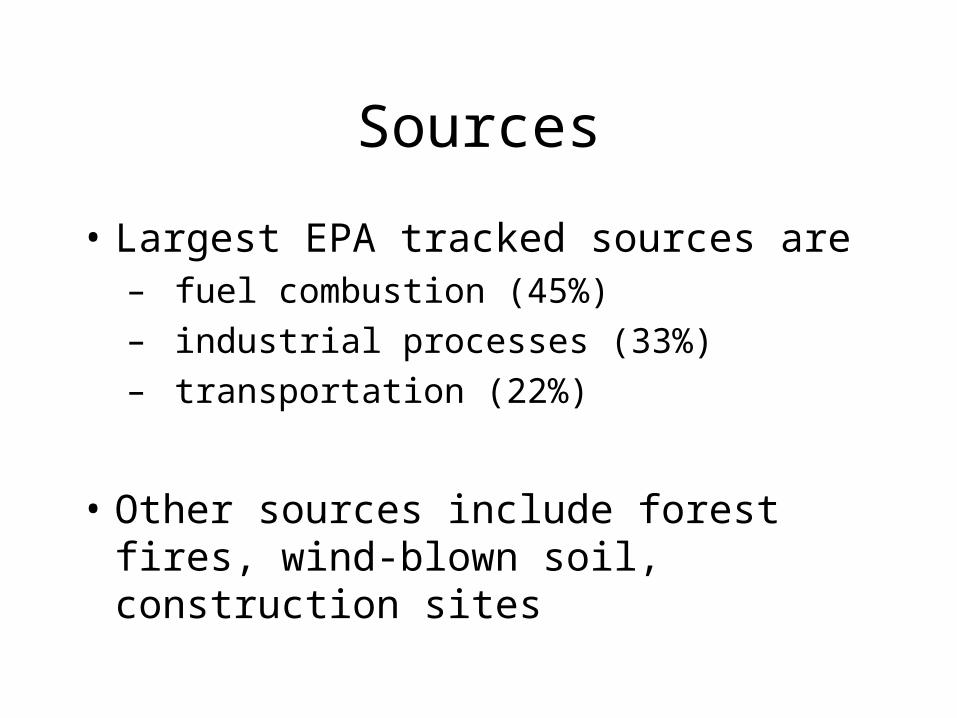
• Largest EPA tracked sources are– fuel combustion (45%)– industrial processes (33%)– transportation (22%)
• Other sources include forest fires, wind-blown soil, construction sites

• Settling velocity is defined by a modified Stokes’ equation:
where,
v = terminal or settling velocity (m/s)
g = gravitational force constant = 9.80 m/s2
d = particle diameter (m)
= density of particle (g/m3)
= viscosity of air = 0.017 g/m-s
18
2gdv

Impacts
• Serious impacts on human respiratory functions.
• Smaller the particle, the farther it can get lodged in the respiratory system
• Larger particles can also attract hydrocarbons and transport these into our bodies
Insert figure of human respiratory system

Controls
insert cyclone
• Electrostatic precipitator

• Fabric filter baghouse

Visibility


Factors in Visual Air Quality
• Viewing direction
• Terrain
• Time of day
• Season
• Meteorology
• Air pollution

Visibility Metrics
• Extinction Coefficient:– reduction of image forming light per unit
distance due to scattering
• Visual Range:– How far away a large black target could be seen
• Deciview scale: – Perceptual scale based on just-noticable-
differences (analogous to decibels in sound)

SOx
Transport
Utilities
Industrial
Slice 4

Sources of SOx • SO2 is emitted primarily from coal burning power
plants
S(s) + O2(g) ==> SO2(g)
SO2(g) + OH* ==> HOSO2*
HOSO2*(g) + O2(g) ==> SO3(g) + HO2*
SO3(g) + H2O(l) ==> H2SO4(aq)
H2SO4(aq) ==> 2H+(aq) + SO42-(aq)
Definition of Acid
• Acids are substances that release hydrogen ions, H+, usually in aqueous solutions

pH of Natural Rain Water
• Rain water typically has a pH less than 7.0 due to dissolved CO2:
CO2(g) + H2O(l) <==>H2CO3(aq)
H2CO3(aq) <==> H+(aq) + HCO3-(aq)
• This can bring rain pH down to values as low as 5.6.
• So where does the other acid come from?
Measuring the pH of Rain
insert map of pH distribution is US

Sources of Acid Rain
• NO2 is emitted from burning and undergoes the following:
N2(g) + O2(g) ==> 2NO(g)
2NO(g) + O2(g) ==> 2NO2(g)
NO2(g) + OH*(g) ==> HNO3(l)
HNO3(l) ==> H+(aq) + NO3-(aq)

Impacts of Acid Deposition
• Damage to materials (especially limestone):
CaCO3(s) + 2H+(aq) ==> Ca2+(aq) + CO2(g) + H2O(l)
• Reduced visibility
• Respiratory problems in humans

Impacts on Lakes and Streams
• Direct aquatic impacts
• Indirect aquatic impacts
• Acid Neutralizing Capacity (ANC) which is a function of geology..


SO2 Controls• Fuel switching
• Coal cleaning
• Fluidized-bed combustion
2CaCO3(s) + 2SO2(g) + O2(g) ==>2CaSO4(s) + 2CO2(g)
• Flue Gas Desulfurization (“Scrubbers”)
Control Policy
• Political implications of SO2 control based on regionality of pollution sources and impacts
• Clean Air Act Amendments of 1990 and the Title IV SO2 Allowance Trading System

Photochemical Smog

Origins
• primarily low-level O3
• Standards in U.S. is 80 ppb over 8 hours
• Produced by NOx and volatile organic compound (VOC) reactions
• O3 is a secondary pollutant

Sources
• Sources of NO and VOCs are:
– any kind of burning in air with hot flame
– unburned hydrocarbons industrial solvents and other organic compounds
– non-anthropogenic sources

Formation Reactions
• The general reactions are:N2 + O2 ==> 2NO (mostly)
NO + [VOCs or CO] ==> NO2
NO2 + hv ==> NO + O
O + O2 ==> O3
• Note in evenings:NO + O3 ==> NO2 + O2

Impacts
• Mostly local
• Respiratory problems
• May stunt vegetative growth; may reduce immune systems of vegetation.
Controls
• Must reduce either NOx or VOCs
• Evaporative controls
• Burning at lower temperatures

Controls (con’d)
• Mobile sources:– driving less (carpools, mass transit)– cleaner fuels– evaporative controls– catalytic converters (three-way converters) can reduce NO
and can oxidize unburned fuel
2H2 + 2NO ==> N2 + 2H2O
Fuel + O2 ==> CO2 + H2O

Stationary Sources

Precombustion Controls
• Fuel switching
• Coal cleaning

Combustion Controls
• Fluidized-bed combustion
2CaCO3(s) + 2SO2(g) + O2(g) ==>2CaSO4(s) + 2CO2(g)
• Integrated Gasification Combined Cycle

Post Combustion Controls
• Flue Gas Desulfurization (“Scrubbers”)
CaCO3 + SO2 + 2H2O ==>CaSO3• 2H2O + CO2(g)

Air Pollution Transport and Dispersion

What information (input) might be required for an air pollution
model?
What information (output) might an air pollution model
provide?

Air Pollution Meteorology
• Predictions of ambient concentrations use models that consider: source, chemical composition, meteorology, and atmospheric chemical reactions

Air Pollution Transport
• Pollution is transported at the speed and in the direction of the wind
• Pollutants also disperse under turbulence, changes in wind direction/speed, and molecular diffusion
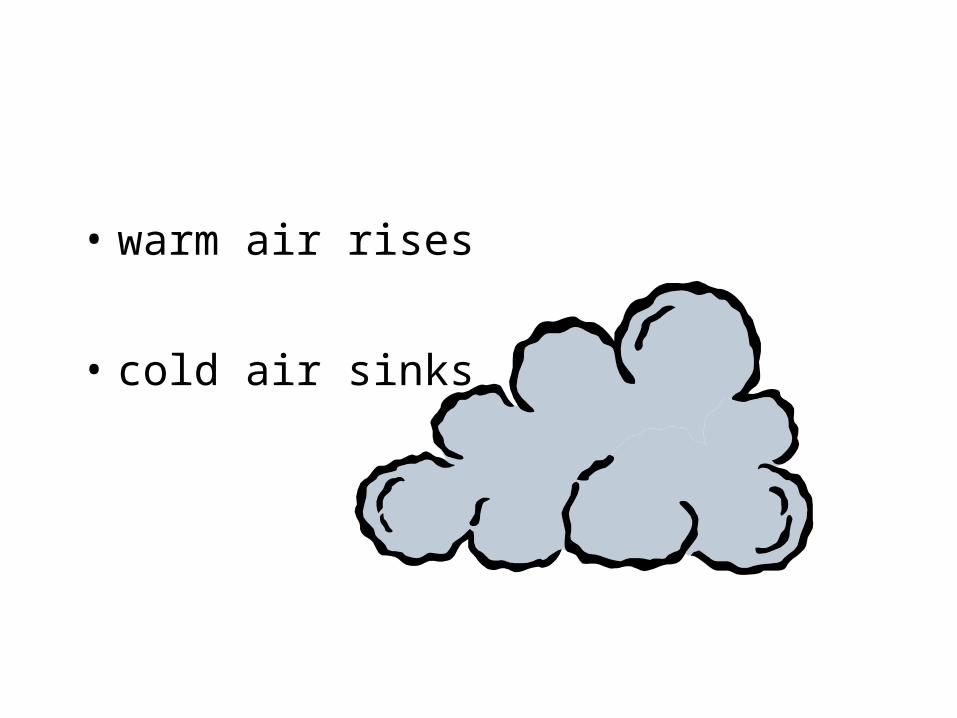
• warm air rises
• cold air sinks

Atmospheric Conditions
• Stable vs. Unstable– Stable = NOT MOVING– Unstable = MOVING
Which condition would have the higher likelihood of higher
concentrations?

Adiabatic Lapse Rate
where g is 9.8 m/s2 and cp is 1005 J/kg-K.
pc
g
dz
dT

Adiabatic Lapse Rate
• Thus, for every increase in altitude of 100 meters, we expect a parcel of air to drop in temperature 1 degree C.
• This is true for dry air with no heat transfer across its boundary (adiabatic)
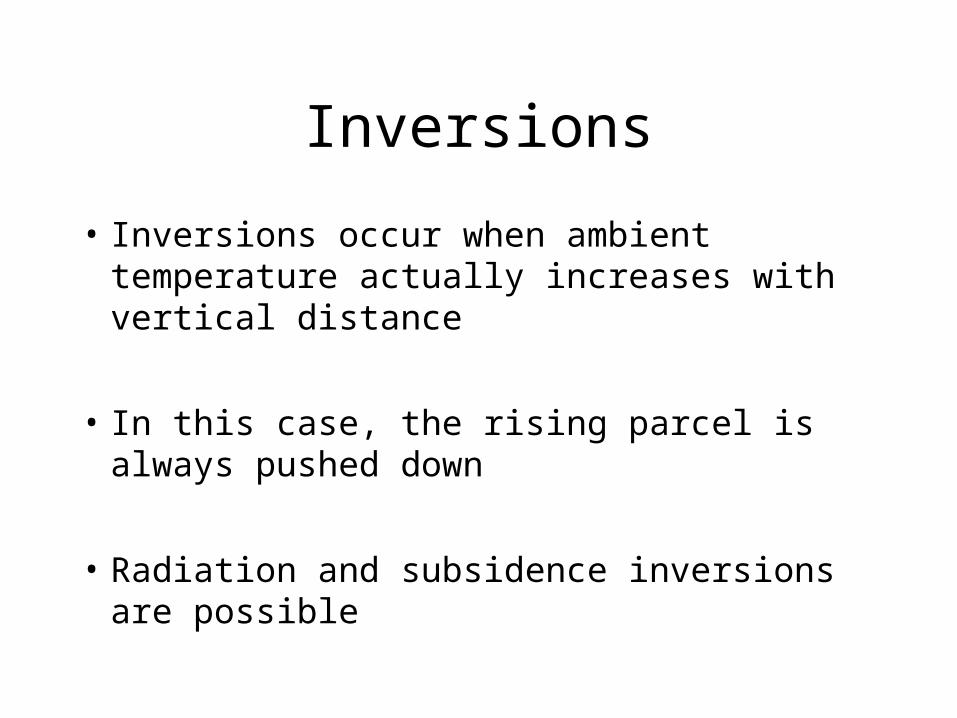
Inversions
• Inversions occur when ambient temperature actually increases with vertical distance
• In this case, the rising parcel is always pushed down
• Radiation and subsidence inversions are possible

Insert plume figure

Gaussian Plume Model

Dispersion Modeling
22
2
12
1
,, 2
zy
zy
zyzyx ee
u
QC
where x=0 at source, and y=z=0 at centerline of plume

Dispersion Modeling
22
2
12
1
,, 2
zy
HZy
zyzyx ee
u
QC


Dispersion Modeling
222
2
1
2
12
1
,, 2zzy
HZHZy
zyzyx eee
u
QC
Assumptions
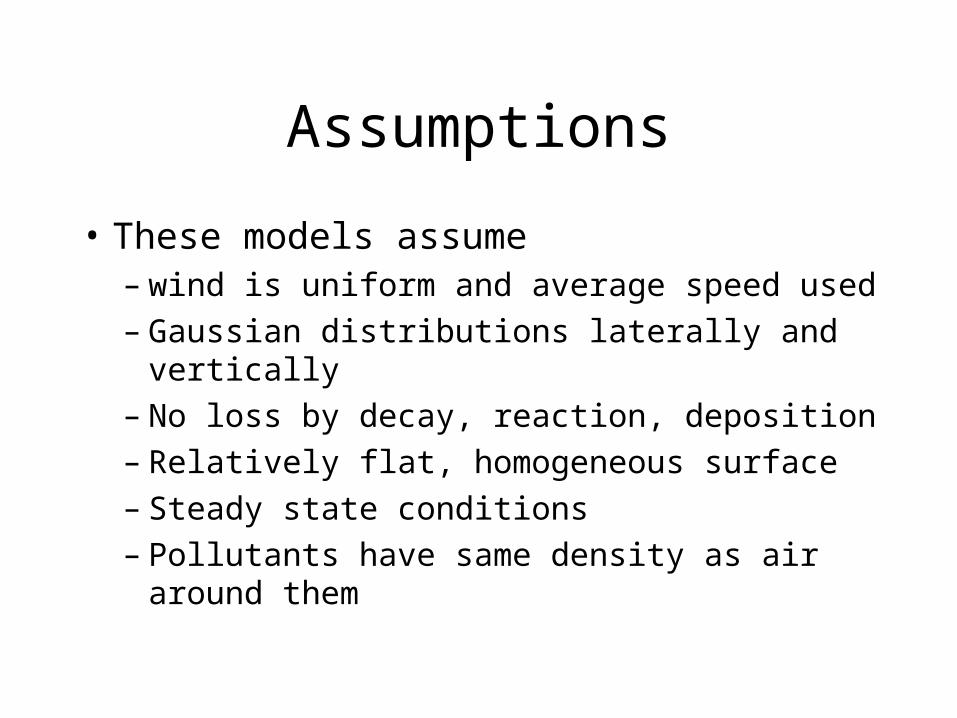
• These models assume– wind is uniform and average speed used– Gaussian distributions laterally and vertically– No loss by decay, reaction, deposition– Relatively flat, homogeneous surface– Steady state conditions– Pollutants have same density as air around them
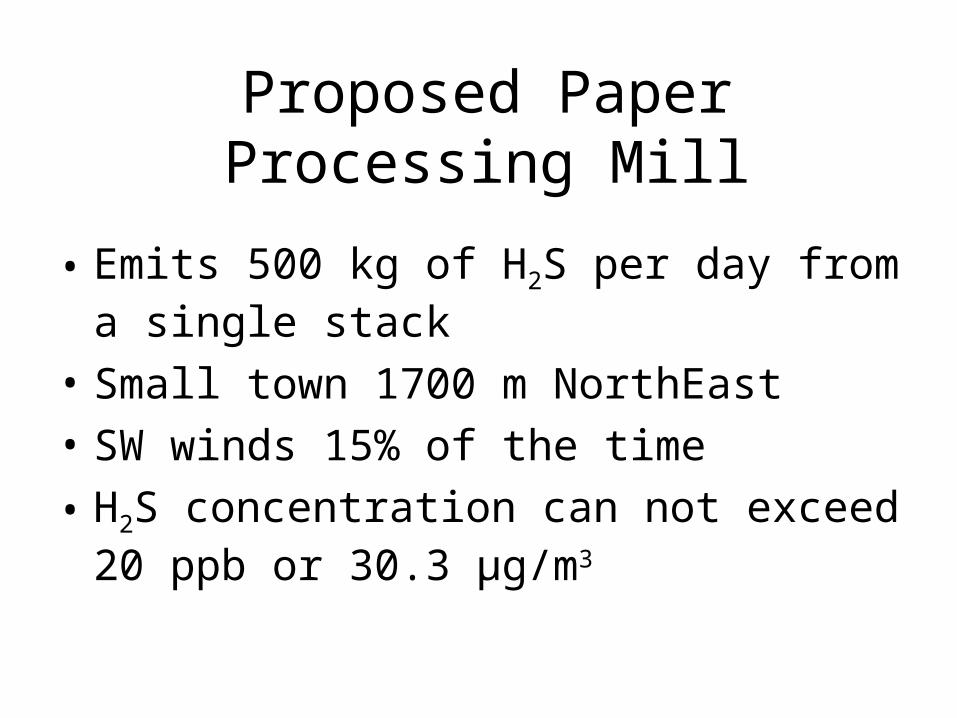
Proposed Paper Processing Mill
• Emits 500 kg of H2S per day from a single stack
• Small town 1700 m NorthEast
• SW winds 15% of the time
• H2S concentration can not exceed 20 ppb or 30.3 μg/m3

Emissions Data
• Gas exit velocity 20 m/s
• Gas exit temperature 122ºC
• Stack diameter at top 2.5 m
• Ambient air temperature 17 ºC
• Wind velocity 2 m/s
• Temperature lapse rate 6 ºC/km
• Slightly stable atmosphere – category E
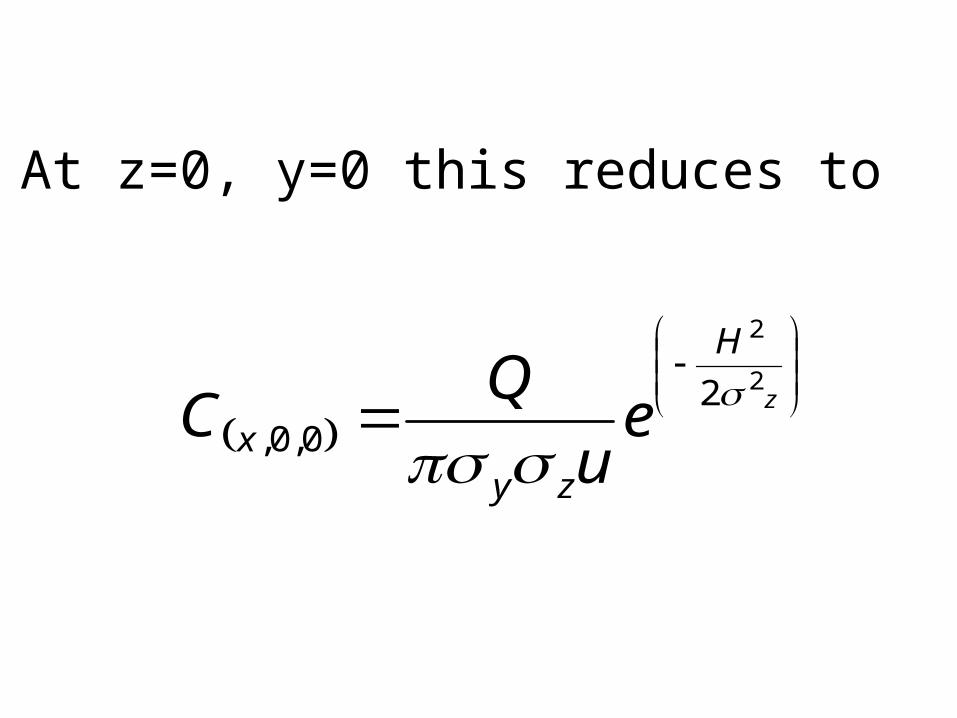
At z=0, y=0 this reduces to
z
H
zyx e
u
QC
2
2
20,0,

Plume Diffusion Equation
222
2
1
2
12
1
,, 2zzy
HZHZy
zyzyx eee
u
QC
Equation 13-28 in text

Source Strength
skgxdays
daykgQ /1079.5
/400,86
/500 3


What you should be able to do...
– Understand the role of each variable in downwind concentration predictions
– Simplify the Gaussian model based on x,y,z information
– Given variable values, use the Gaussian model to predict concentrations
– Understand sensitivity of model to changes in variables

“Improvement in domestic emissions from space heating is possible by using district heating systems and electric heating that transfer emissions to a different site, where tall stacks and emission control systems can be installed.”
(page 510 of your text) – use as a transition to energy module