photochemical ozone and nitric oxide formation in air
TRANSCRIPT
PHOTOCHEMICAL OZONE AND NITRIC OXIDE FORMATION IN AIR-NITROGEN DIOXIDE
MIXTURES CONTAINING SULFUR DIOXIDE OR CHLORINE
JAMES S. WALLACE
Department of Mechanical Engineering, University of Toronto, Toronto, Ontario, MSS tA4, Canada
and
GEORGE S. SPRINGER*+ and DONALD H. WEDMANS
t Department of Mechanical Engineering and $ Department of Chemistry, The University of Michigan, Ann Arbor, MI 48109, U.S.A.
(First received 16 march 1979 and in ~~ai~o~~ 13 December 1979)
Abstract - Experiments were performed to investigate the effects of sulfur dioxide (O-10 ppm) and chlorine (O-15 ppm) on ozone and nitric oxide concentrations in irradiated mixtures of nitrogen dioxide (1-5 ppm) and air. The mixtures were irradiated by ultraviolet fluorescent lamps while flowing at a steady speed through a 9 m long, 15.2 cm i.d. Pyrex tube. The presence of sulfur dioxide produced no measurable change in the ozone and nitric oxide con~ntrations. The addition of small quantities of chlorine increased the ozone con~ntration in much the same manner as the addition of a hydr~rbon. A reaction model was developed for the chlorine-nitrogen dioxide-air mixtures. The observed increase in ozone concentration could only be predicted if the following two reactions were included : Cl00 + NO -+ NO2 + Cl0 and Cl00 + NO -+ GINO + OZ. Significant quantities of unexpected condensation nuclei were also observed in the chlorine-nitrogen dioxide-air mixtures.
INTRODUCTION
Ozone concentrations exceeding ambient levels were first observed in power plant plumes by Davis et al.
(1974). This observation has since been amply con- firmed by Miller et al. (f978) and by Keifer (1977). In both of these most recent reports it appears that nitrogen oxides and ambient hydrocarbons are re- sponsible for the ozone formation. However, it has also been suggested (Davis et al., 1974) that reactions of sulfur dioxide and oxides of nitrogen may result in ozone formation. Although early work by Stephens et
al. (1956) implied that sulfur dioxide reactions could not generate ozone, more recent studies by Altwicker (1976) indicate that such a possibility does indeed exist. We therefore studied the possibility that sulfur dioxide or chlorine released by burning coal might participate in the photochemical reactions which form ozone. The participation of chlorine in such reactions had previously been suggested by Pierrard (1969).
Several studies have been conducted with sulfur dioxide-nitrogen dioxide mixtures with data only reported for sulfur dioxide oxidation rates (Smith and Urone, 1974; Miller, 1977). Several other authors
*To whom correspondence should be addressed.
considered the effect of sulfur dioxide on air and nitrogen dioxide mixtures containing hydrocarbons, without any strong effect being apparent (Ripperton et
af. 1965; Altshuller et al. 1968; Wilson and Levy, 1970 and Wilson et al. 1972). The only previous ex~riment with mixtures of air-nitric oxide (instead of nitrogen dioxide), and chlorine was performed by Bittker and Wong (1978). Their results are not directly applicable to photochemical reactions near the earths surface because they used a light spectrum characteristic of the stratosphere. Tests with chlorine-nitrogen dioxide-air mixtures containing hydrogen and for- maldehyde have been performed by Niki er at. (1977) and by Hanst and Gay (1977) respectively. These investigators focused their attention on the spectro- scopic identification of the reaction products.
The available data do not as yet explain adequately photochemical reactions in nitrogen dioxide-air mix- tures containing either sulfur dioxide or chlorine. The main objective of this investigation was, therefore, to obtain data which will aid in understanding the reactions occurring in irradiated mixtures of sulfur dioxide-nitrogen dioxide-air and chlorine-nitrogen dioxide-air. To accomplish this objective, ozone and nitric oxide concentrations were measured in such mixtures under a wide range of experimental conditions.
1147
1148 JAMES S. WALI.ACE, GEORGE S. SPRINGER and DONALD H. STEDMAY
EXPERIMEYTAI.
The experiments were performed in a Row-type smog chamber described in detail by Shen YI ai. (1977).
The photochemical reactions took place in a 9m long 15.2 cm i.d. horizontal Pyrex tube (“reaction vessel” - Fig. 1). Twelve openings were made on the top of the tube for inserting sampling probes. The first opening was 23 cm from the entrance of the tube. The distance between any two successive openings was 76cm. A stainless steel mixing chamber, ~ont~ning stainless steei screen how straighteners, was connected to the upstream end of the reaction vessel. The test gases were fed directly into this chamber. The down- stream end of the tube vented at atmospheric pressure.
The UV radiation was produced by 48 F4ORL (General Electric) Ruorescent lamps placed around the reaction vessel symmetricahy on a 31.7 cm dia. circle. The lamps were mounted on two semicircular metal shells covered on the inside with aluminum foil. Room air was blown through the annulus between the reaction vessel and the shell in the direction opposite to the flow inside the reaction vessel. The maximum temperature rise of the cooling air was 7’ C. The temperature rise of the gas-air mixture along the reaction vessel was always less than 4 ‘C. The total light intensity was characterized by the photolysis frequency of nitrogen dioxide i(, (Shen rt ul. 1977; Stedman and Niki, 1973). For the present apparatus k, was found to be 0.39 min-‘. This value is a iittie over half the value at noon in the lower atmosphere at 40’ N latitude.
Air used in the expertments was supplied from an air- conditioned room by an oil-free,diaphragm type compressor. The air was passed through a series of drying agents and filters and was then branched into two streams. One stream was designated as “dry air”, while the other stream passed through a humidifier where it was saturated with water vapor. The two streams were then joined together. The relative humidity of the test au was controlled at 50”~ by adjusting the flowrates of the two streams of air.
The nitrogen dioxide and sulfur dioxide were supplied prediluted in cylinders of nitrogen, The nitrogen dioxide, sulfur dioxide, and air flow rates were regulated by needle valves and measured by how meters. Chlorine gas was metered directly into the mixing chamber with a Harvard Apparatus infusion pump.
The flow rates used in the experiments varied from 47 cm3 s- ’ -.753 cm3 s- ‘. The mean velocities corresponding to these flow rates were 0.259 cm s- ’ and 4.13 cm s - ‘. The Reynolds number (based on diameter) thus ranged between 26 and 420.
The sampling probes, described in detail by Waliace (1978), were connected to the measuring instruments with Teflon (for ozone), polypropylene (for nitric oxide) and Tygon (for particulates) lines. Losses in the sampling lines were assessed and were found to be negligible (Wallace, 1978). Ozone was measured with a chemiluminescent type ozone meter (McMiiIan Electronics Corporation Model 1100-3). Nitric
oxide was measured with a chemiiuminescent detector built in this laboratory. Both the ozone and the nitric oxide detectors were calibrated per~~ica~ly. The concentration of condensation nuclei was measured with a type CN Small Particle Detector manufactured by Gardner Associates. Nitrogen dioxide concentrations were checked by measure- ment as NO after thermal decomposition.
The initial operation, “cleaning” the reaction vessel. was performed whenever a change was made from one test gas to another. The lighting system was energized and the reaction vessel was flushed with 501, relative humidity air until ail measured ozone concentrations were less than 4ppb. all measured nitric oxide concentrations were less than 10 ppb, and less than 200 condensation nuclei cm- 3 sample were detected. Once these conditions were met, the air how and nitrogen dioxide concentrations were adjusted to the desired value and data were taken. The test gas was then introduced and data were taken again. With sulfur dioxide, the measure- ments were made at two sulfur dioxide concentrations ( 1 and 10 ppm) and also after the flow of sulfur dioxide was stopped. With chlorine the measurements were repeated at each chlorine concentration and also after the chlorine How was stopped. Data were obtained for different initial concen- trations of the nitrogen dioxide and the test gas, this concentration being denoted by the subscript zero. The term “initial concentration” refers to conditions at the inlet of the reaction vessel. Concentration measurements were made as a function of distance Z along the vessel. This distance was converted to irradiation time I by the expression t = Z3 where V was the mean flow velocity. The data were corrected for surface effects as described in the Appendix.
For further experimental details the reader is referred to Wallace (19783.
REACTION .MEC’HANlSMS
The reactions which occur in the nitrogen dioxide-air mixtures are well known (Stedman and Niki, 1973). For use in this ex~riment, however, the abbreviated mechanism shown in Table 1 was ade- quate. A more comprehensive model which included 12 additional reactions was also considered (Wallace, 1978). The differences in the ozone and nitric oxide concentrations predicted by this model and the simple one listed in Table 1 were less than the spread in the data. Hence, the mechanism shown in Table 1 was adopted.
A reaction mechanism for sulfur dioxide-nitrogen dioxide-air mixtures was proposed by Davis et a!. (1974). This mechanism was later discussed and criti-
Fluorescent
‘.- Inlet Sectbon Shell From Gas
Meterlnq Syslem
. Thermocouples A Sample Connectrons
Exhaust
Fig. 1, Schematic of experimental apparatus.

Photochemical ozone and nitric oxide formation 1149
Table 1. Reactions and rate constants used to model ozone formation in mixtures of nitrogen dioxide and air
Reaction Rate constant @298 K Reference
1. NO2 + hv+NO + 0 0.39 min - 1 This work 2.O+O,+M+O,+M 4.2 x lo6 min-‘* Hampson and Garvin (1978) 3. 0,+NO+NOt+02 27.0 ppm-’ min-’ Hampson and Garvin (1978) 4. O+N02+NO+02 1.37 x lo4 ppm-’ min-’ Hampson and Garvin (1978)
*Pseudo first-order (k; = k2[02][M], where [0,] = 2 x lO’ppm, [M] = 1 x lo6 ppm).
Table 2. Sulfur dioxide reaction mechanism
No. Reaction
1. NO, + hv-+NO + 0 2. O+O,+M--rO,+M 3. NO + O,+NOs + 02 4. 0 + N02-+N0 + 0, 5. OH + SO, + M-+HS03 + M 6. HS03+02+M’HSOs+M 7. HSOs + NO + HSOz, + NO, 8. HSO* + O2 + M 4 HSO, + M 9. HSOs + NO 4 HSO, + NO,
10. HSO, + NO1 --+ HSOsNO, 11. HS04 + NO, + HS04N02 12. HSOsNO, + NO-+2N02 + HSO‘, 13. HS0sN02 + hv+ HSO, + NO2 14. HSOINOz + H,O -+ Aerosols
cized by Miller (1977) and by Bufalini and Walter (1977) (Table 2).
The reaction mechanism proposed for chlorine-nitrogen dioxide-air mixtures is listed in Table 3. This mechanism was formulated with the aim of providing estimates of the amounts of ozone and nitric oxide formed in chlorine-nitrogen dioxide-air mixtures and a qualitative description of the processes that occur. Therefore, the proposed mechanism in- cludes only those reactions believed to be most significant.
Reactions l-4 are required to account for ozone formation in mixtures of air and nitrogen dioxide only. Reactions 15-18 and 21-28 were selected from the chlorine reactions included in a survey by Watson (1977). Reaction 15 is the source of chlorine atoms (in an actual plume the source of chlorine atoms would be the reaction OH + HCl -+ Cl + H,O). Reactions 19 and 20 were suggested by Pierrard (1969). Reaction 29, the loss of chlorine through reaction at the surface of the condensation nuclei, was added after the experi- ments showed that greater chlorine loss than could be accounted for by any gas phase process was observed along with the appearance of unexpected and un- identified particles. It should be noted that any heterogeneous chlorine loss mechanism, including atom loss at the walls, will show similar effects.
Ozone and nitric oxide concentrations were calcu- lated as a function of irradiation time and initial mixture composition on the basis of the reactions
included in Tables 1 and 3. To perform these calcu- lations, conservation equations were formulated for the most important species in each mechanism. In forming the conservation equation for chlorine, it was postulated that the chlorine loss at the surface of the condensation nuclei was proportional to the total surface area of the condensation nuclei formed and to the instantaneous chlorine concentration [Cl,] in the mixture
chlorine concentration change per unit time due to interaction
= - k,,A,N[Cl,] (1)
with nuclei,
where kzg is a constant, AN is the surface area of a single condensation nuclei, and N is the condensation nuclei concentration as a function ofirradiation time. For the purposes of this calculation all of the condensation nuclei were assumed to have the same diameter, 2 x 10⁻⁵cm. The concentration of nuclei as a function of time, N, was measured for each test mixture. The maximum concentration of nuclei observed varied from about 300,000 cmm3 for the mixture with 1.2 ppm initial chlorine and nitrogen concentrations to greater than 10’ cme3 for the mixture with a 1.2 ppm initial nitrogen concentration and a 9.6 ppm initial chlorine concentration.
The system ofconservation equations for each of the two mechanisms listed in Tables 1 and 3 was solved using an algorithm by Gear (1971). The rate constants used in the calculations and the sources for these constants are included in Tables 1 and 3. When available, the rate constants recommended by Hamp- son and Garvin (1978) were used, although in several instances, e.g. k,, and k,,, the value used represents the upper or lower limit of the recommended value (see footnotes for Table 3). The rate constant for reaction 1 was determined from data for irradiated mixtures of air and nitrogen dioxide only, as indicated previously. The rate constants for reactions 1522, and 25 (Table 3) were calculated from the value of k, (Wallace, 1978). Rate constants were not available for reactions 19,20, or 29. Reactions 19 and 20 are both possible reactions for the reactants Cl00 and NO. Consideration of entropy and energy factors involved in the two re- actions led to the suggestion that reaction 20 would proceed at a faster rate than reaction 19 (Wallace,

ii50 JAMFS S. WALLACE, GEOK;E S. SPRINGER and DONALD H. S-II,IX\\
Table 3. Reaction mechanism for irradiated mixtures of air, nitrogen dioxide and chlorine
Reaction Reference
1. NO, +hv-NO+0 ?O+O,tMdO,+M 3. O3 + NO-NO, + 0, 4. O+NOz+NO+02
15. Cl, + hv-Cl+ Cl 16. CI+CI+M-Cl,+M 17. Cl f O2 + M-Cl00 + M 18. Cl00 + M 4 Cl + Oz + M 19. Cl00 + NO ---) Cl0 + NO, 20. Cl00 + NO + GINO + O2 21. Cl+NO+M+CINO+M 22. GINO + hv 4 Cl + NO 23. Cl + GINO- NO + Cl, 24. Cl $ NO, + M4ClNOz + M 25. GINO, + hv-+Cl + NO, 26. Cl f GINO, + Cl, + NO, 27. Cl+O,-+ClO+O, 28. Cl0 t NO--Cl + NOZ
prrticie,
Rate constant ppm
-I min’ I -. 0.39 min _ I 4.39 x 10” min-’ (1) 27. 1.37 X IO” 0.05 min-’ (2) 461.0 (3) 6 x IO7 miK’(4) 4 x 10⁷min-‘(5j 4 X IO” 4 x IO” 3.8 x 10³(6) 0.08 min-’ (7) 4.5 x lo1 1.35 x 10⁴(8) 0.010 min _ ’ (91 45.0(10) 1.7 x lo4 2.9 x 10’
This work Hampson and Garvin (1978) Hampson and Garvin (1978) Hampson and Garvin (1978) Wallace (1978) Hampson and Garvin (1978) Hampson and Garvin (1978) Hampson and Garvin (1978) This work ‘This work Hampson and Garvin (I978) Wallace (1978) Hampson and Garvin (1978) Hampson and Garvin (1978) Wallace (I 978) Hampson and Garvin (1978) Hampson and Garvin (1978) Hampson and Garvin (1978)
29. Cl, --------it products 516cm min-’ This work
(1) The value given is the product k,[O,][M], where [0,] = 2 x 10’ ppm, [M] = I x 10h ppm, and k, is from Hampson and Garvin (1978).
(2) k,, defined by d[Cl&dt = -k,,[Cl,] was calculated using the value of k,, the absorption cross sections for NOz and Cl,, and the relative spectral energy distribution measured inside the reaction vessel (Wallace, 1978).
(3) The value given here is the product k,,[M], where [M] = 1 x lo6 ppm and k,, was taken from Hampson and Garvin (1978).
(4) The value given here is the product .$,[OJ[M], where [0,] = 2 x lo5 ppm and [M] = 1 x 10h. The value of k,, used was 4.7 times higher than the value recommended by Hampson and Garvin (1978). This value and the value of k,s used are within the factor of ten uncertainty specified For the ratio k,,/k,,.
(5) The value given here is the product kIBIM], where [M J = 1 x lo6 ppm. The value of k, s used was 407; less than the value recommended by Hampson and Garvin (1978). This value and the value of k,, used are within the factor of ten uncertainty specified for the ratio k,,/k,s.
(6) The value given here is the product k21[M], where [M] = 1 x lo6 ppm. (7) Calculated using value ofk,, the absorption cross sections for NOz and GINO, and the relative spectral
energy distribution measured inside the reaction vessel (Wallace, 1978). (8) The value given here is the product k,,[M], where [M] = 1 x IO6 ppm and k,, is the lower limit of the
range of values given by Hampson and Garvin (1978). (9) Calculated using the vaiue of k,, the absorption cross sections for NO2 and GINO,, and the relative
spectra energy distribution measured inside the reaction vessel (Wallace, 1978). (10) Lowest value given by Hampson and Garvin (1978).
1978). Therefore, reaction 20 was assigned the fastest rate constant possib!e, i.e. the biomolecular collision rate between Cl00 and NO molecules. The bimole- cular collision rate is generally between 1.5 x lo5 and 1.5 x 10⁴ppm-l min -l. An intermediate value was chosen, resulting in k,, = 4 x IO4 ppm- ’ min- ‘. Rate constants for reactions 19 and 29 were determined by matching the model to the data. To accomplish this, values were assumed for k,, and kz9. The conservation equations representing the reaction mechanism in Table 3 were then solved for the different test mixtures. The ozone and nitric oxide concentrations predicted by these solutions were compared with the measured ozone and nitric oxide concentrations. The values chosen for k,, and k,, were adjusted and the process was repeated until the best agreement between the predicted and measured concentrations was obtained.
RESULTS
Sulfur dioxide-nitrogen dioxide-air mixtures
The sulfur dioxide concentration in power plant plumes may range from as much as 700ppm at the stack to less than 0.5 ppm at distanees greater than 25 km. However, ozone formation has only been observed at distances greater than 24 km from the stack, where the sulfur dioxide concentration is low (Davis et al. 1974; Keifer, 1977). The sulfur dioxide concentrations selected for the tests were chosen to be representative of the sulfur dioxide concentrations present in the plume when the ozone is forming. Therefore, tests were performed with initial sulfur dioxide concentrations of 1 and 10 ppm. Each of these sulfur dioxide concentrations were tested in nitrogen dioxide-air mixtures with either 1 or 5 ppm initial

Photochemical ozone and nitric oxide formation it51
nitrogen dioxide concentrations. The temperature in the reaction vessel was maintained between 26-3 1°C. These temperatures are similar to the temperatures in those regions of the plume where ozone formation was observed (Keifer, 1977).
In order to determine whether or not sulfur dioxide had any effect on the ozone and nitric oxide con- centrations these concentrations were measured in air-nitrogen dioxide mixtures both with and without sulfur dioxide. For the range of concentrations tested (1 and 10 ppm sulfur dioxide), the addition of sulfur dioxide to the nitrogen dioxide-air mixtures resulted in no measurable change in the amounts of ozone and nitric oxide formed. This result is illustrated in Fig. 2, where the data are presented. The ozone and nitric oxide concentrations calculated by the reaction mech- anism postulated for nitrogen dioxide-air mixtures (no sulfur dioxide - Table 1) are also shown. The measured concentrations correlate well with the calcu- lated ones indicating further that sulfur dioxide does not participate significantly in the photochemical reactions. These observations suggest that reactions 6-14 (Table 2) are either inappropriate or occur so slowly as to be insignificant. Unfortunately the rate constants for reactions 6-14 are largely unknown. Hence the contributions of these reactions could not be evaluated quantitatively. Since the addition of either 1 or 10ppm sulfur dioxide did not affect measurably the ozone and nitric oxide concentrations, it appears that sulfur dioxide was not responsible for the ozone formation observed in power plant plumes.
In order for ozone to form in sulfur dioxide-nitrogen oxides-air mixtures by means of the suggested reaction mechanism, hydroxyl radicals (OH) must be present (reaction 5, Table 2). Thus, the hydroxyl radical concentration in the reaction vessel had to be evaluated. The hydroxyl radical con- centration could not be measured directly but was inferred from ozone and nitric oxide measurements made in irradiated nitrogen dioxide-air mixtures containing carbon monoxide. These measurements, together with the results of a reaction model, indicated that the hydroxyl radical concentration in the reaction vessel was between 1.5-6.5 x IO-’ ppm (Wallace, 1978). This is of the same order of magnitude as OH concentrations observed in the atmosphere (Wang et al. 1975 ; Davis et al. 1976). Thus, hydroxyl radicals were evidently present in the reaction vessel in sufficient quantities to ensure the formation of ozone.
Chlorine-nitrogen dioxide-air mixtures
Chlorine released from burning coal is converted to hydrogen chloride during combustion (Stedman et al. 1974). In the power plant plume the hydrogen chloride reacts with hydroxyl radicals to form chlorine atoms. It is these chlorine atoms that are presumed to contribute to ozone formation through a chain of reactions (15-29 Table 3) involving chlorine and nitrogen-containing substances. This chain of re- actions, beginning with the chlorine atoms, was exam- ined in the present experiments in which chlorine gas was introduced into irradiated mixtures of air and
0.001 I 1 I I I I I I I I I I
IRRITATION TIME, min IRRADIATI~ TIME, min
A.E. 14/10-
Fig. 2. Ozone and nitric oxide concentrations in irradiated sulfur dioxide-nitrogen dioxide-air mixtures. Data: 0-l ppm initial SO2 conqmtration, O-10 ppm initial SO* concentration, triangles are for nitrogen dioxide-air mixtures only : A-before SO2 addition ; A-after SO, flow stopped. Solid lines are calculated
concentrations for the nitrogen dioxide-air mixture.
c

nitrogen dioxide. The chlorine gas readily photo- dissociated in the ultraviolet light present in the reaction vessel to form chlorine atoms.
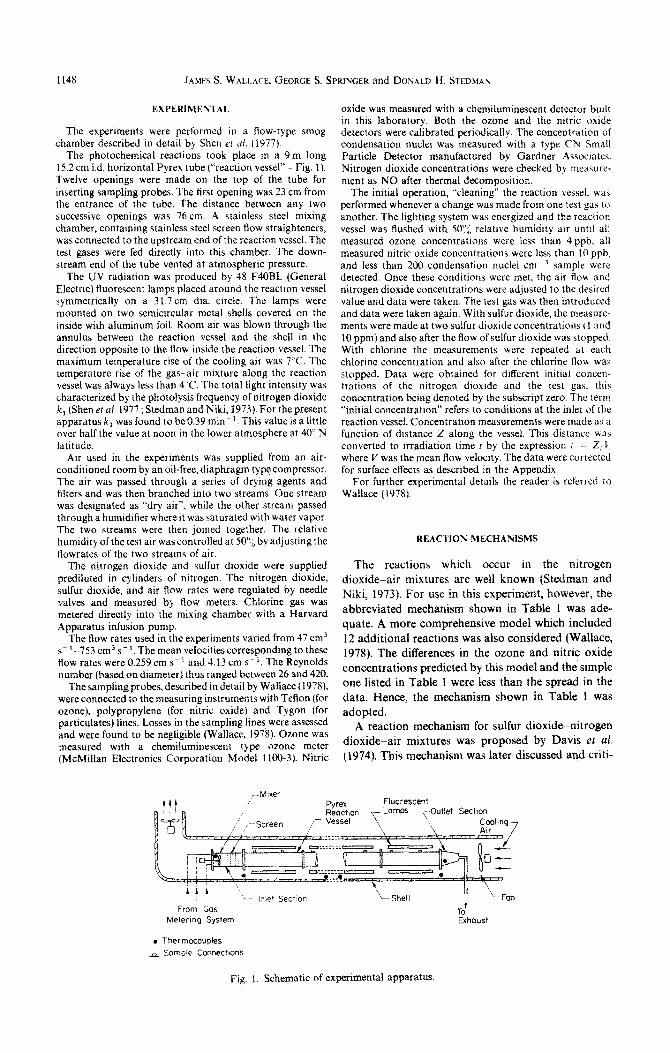
Ozone, nitric oxide and condensation nuclei con- centrations were measured as a function of irradiation time for each of fifteen mixtures indicated in Figs 3-5. The results are shown in these figures where the circles represent measurements taken with chlorine present in the mixture. The open triangles indicate concen- trations measured in the mixture of air and nitrogen dioxide only, prior to the introduction of the chlorine. The solid triangles are for concentrations obtained after the chlorine flow was stopped (mixtures of air and NOz only).
Ozone and nitric oxide concentrations calculated from the reaction mechanism proposed in Table 3 are shown in Figs 3-5 as dashed lines. For comparison, the ozone and nitric oxide concentrations calculated for mixtures of air and nitrogen dioxide only are also included in these figures (solid lines). For the tests with mixtures initially containing 1.2 ppm NO2 (Fig. 3), the predicted ozone and nitric oxide concentrations show excellent agreement with the measured ozone and nitric oxide concentrations for all of the initial chlorine concentrations tested. The agreement between the predicted and measured ozone and nitric oxide con- centrations becomes slightly worse as the initial NOz concentration is increased. This may be observed in Fig. 5 (mixtures initially containing 54ppm N02) where the agreement is reasonable for low chlorine concentrations but shows significant deviation at
higher chlorine concentrations. The overpredictmn of ozone and the underpredictjon of nitric oxide suggests that the proposed reaction mechanism does not re- move chlorine rapidly enough at high NO, con- centrations. Overall, however, thereaction mechamsm proposed in Table 3 appears to be a reasonable representation of the processes which govern ozone formation in irradiated mixtures of ch~orine~nitr~~gen dioxide-air, and provides reasonable estimates of the concenirations of ozone and nitric \>xide formed in such mixtures.
The experimental evidence indicates that the ad- dition of small quantities of chlorine to irradiated mixtures of air and nitrogen dioxide increases the ozone concentration in much the same manner as the addition of a hydrocarbon. ft is emphasized, however, that in order to describe the observed ozone formation reaction 19 must be included in the reaction model. Without this reaction the observed increase in ozone concentration could not be pre- dicted. Reaction 19 is mainly responsible for the ozone increase, but since reaction 20 occurs simuhaneously and is probably faster, it was included as well. The absolute reaction rates which were needed in our model for reactions 19 and 20 (4 x 10’ and 4 x IO4 ppm-’ min -‘) indicate that these reactions can- not be neglected in future studies.
Infrared spectroscopic analyses were performed on chlorineenitrogen dioxide hydrogen-air mixtures by Niki et ~1. (1977) and on chlorine-nitrogen dioxide formaldehyde-air mixtures by Hanst and Gay (1977).
lRRA~lA?lON TIME, m!n
Fig. 3. Ozone and nitric oxide concentrations in irradiated chlorine-nitrogen dioxide- air mixtures.

Photochemical ozone and nitric oxide formation 1153
Niki er al. (1977) observed the formation of ClNO in a mixture originally containing 21 ppm Cl,, 10.7 ppm NOz and 14.3 ppm Hz. After 5 min irradiation, the ratio [CINO,]/[CINO] measured by Niki and his coworkers was about 9. Using the model in Table 3, we computed the ratio of [CINO,]/[CINO] for air initially containing 5.4ppm NOz and 15.1 ppm Cl,. After 5 min irradiation time, this calculation yielded the value of 10 for the [CINO,]/[CINO] ratio. The good agreement between the [CINO,]/[CINO] ra- tio given by Niki et al. (1977) and by the present model further supports the model described in Table 3.
During the preparation of this paper the work of Wongdontri-Stuper et al. (1978) was published, con- firming the occurrence of reactions 19 and 20. However, they found the product k,, K,,,,, to be (5.6 + 2.3) x 10m4 ppm-‘min-’ and k,, K,,.,, to be (6.0 + 3.8) x 10e3 ppm-’ min-’ as compared with values of 3 x 10m2 ppmm2 min-’ and 3 x 10-‘ppm-2 min-’ determined in this work. Thus, the values used here are about 50 times those of Wongdontri-Stuper et al. It should be pointed out that concentrations tested by Wongdontri-Stuper et al. were considerably higher than those used in the present work (example : 35 ppm NO, 0.52% Cl,). These higher concentrations, in conjunction with a photolysis rate for chlorine only
slightly smaller (k,, = 0.018 vs 0.05 min-‘), results in considerably higher concentrations of Cl and ClOO. Thus, the rates of reactions 19 and 20 have a stronger influence on the results of their experiment. It is interesting to note, however, that they found tile ratio
k,,/k,, to be 11.0 f 2.2 compared with the va!ue of 10.0 determined in this experiment.
The recent work of Spence et al. (1978) shows that chlorine atoms attack unreactive species such as methane and carbon monoxide which could be present in our charcoal filtered air supply.Wongdontri-Stuperet al. (1978) also recognized this possibility and suggested the oxidation of NO by the sequence,
Cl+RH-HCl+R (30)
R + O2 + R02 (31)
R02+NO+RO+N02 (32)
RO + NO + RON0 (33) In the present experiment the reaction
RO + NO, ---* RONOz (34)
would also have to be included as the concentration of NO2 is greater than that of NO. To determine whether or not this mechanism contributed to the observed ozone formation, the hydrocarbon concentrations present in the air supply were measured with a gas chromatograph. The methane concentration was found to be 1.6 ppm and the CO concentration about 0.4ppm which demonstrates that the air supply was not contaminated by combustion derived hydrocar- bons. Higher hydrocarbons could not be detected at the 0.1 ppm level, as might be expected from the low CO reading. Assuming a steady-state for RO1, the rate of reaction 32 is given by
Rate (32) = k,,[Cl]/[RH] (2)
0 1 2 34 5 IRRADIATION TIME. mm
Fig. 4. Ozone and nitric oxide concentrations in irradiated chlorine-nitrogen dioxide-air mixtures
1154 JSVIS S. WAI I AO, GtoRw S. SPRIVitR and DOMI II H. SII I)\\\
Fig. 5. Ozone and nitric oxide concentrations in irradiated chlorineenitrogen dioxide-air mixtures.
This rate must be compared with the sum of the rates of
reactions 19 and 20
Rate(l9+20) = (k,,+k,O)[CIOO]/[NO] (3)
This was done for the mixture containing 1.2 ppm NO2 and 4.8 ppm Cl,, a typical run shown in Fig. 3. Using concentrations of Cl, ClOO, and NO computed for this test mixture by the mode1 in Table 3, the rate for reaction 30 was found to be4.6 x 10m3 ppm min-’
after 1 min of irradiation compared with 8.25 x lo-’ ppm min-’ for the sum of reactions 19 and 20. After 4 min irradiation, these values are 1.7 x
10e3 ppm min-’ and 2.1 x lo-’ ppm min-’ respectively. Thus, the rate of consumption of NO by
* Note added: Since this paper was completed and sub- mitted for publication, a new value of the equilibrium constant k,,/kr, has been published (Chemical Kinetic and Photochemical Data for Use in Stratospheric Modeling, JPL Publication 79-27). The new value is 3.7 x lo-‘* x T x exp(3217/T) cm3 molecule-’ or 1.26 x lo-‘ppm-’ at
300K. The value used in the present work is 7.5 x 10⁻⁶ppm-‘. If the new equilibrium constant is indeed correct, then a mechanism other than the one proposed in Table 3 would be needed to account for the observed ozone formation. It has been suggested by one of the reviewers that, despite our best efforts, there may have been some hy- drocarbons present in the air supply which could have contributed to the observed ozone formation. Thus, in- dividuals conducting future experiments along these lines must be even more careful to eliminate all hydrocarbons from their experimental system.
reaction 32 is about an order of magnitude less than by reactions 19 and 20. The rate of loss of NO by reactions
33 and 34 is even smaller. Therefore, the presence of this small amount of methane could have increased the
ozone concentration slightly but cannot account for the entire increase observed.
While the reactions of chlorine atoms with methane
and carbon monoxide did not have a significant effect in the present experiments, chlorine in actual power plant plumes could be important in activating these otherwise inactive species. In any case, we believe that both reactions (19) and (20) ought to be considered as
possible steps in the atmospheric fate of ClOO.* The role of the condensation nuclei must also be
discussed. The results obtained imply that chlorine is lost rapidly somewhere. This loss must be taken into account as was done here by including reaction (29) in the reaction mechanism. It is interesting to note that Bittker and Wong (1978) observed a loss ofchlorine in their system. In the absence of condensation nuclei measurements they attributed this to atomic chlorine loss at the surface of their chamber, as may also be true in this experiment. However, we should point out that the nature of the species involved in nuclei formation in these mixtures remains unknown.
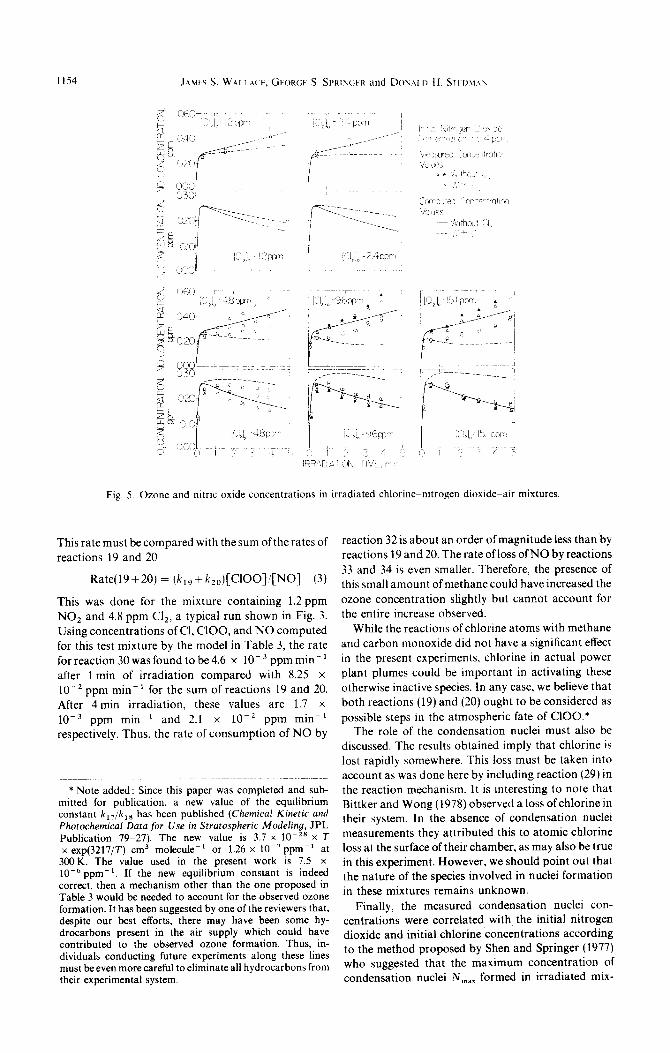
Finally, the measured condensation nuclei con- centrations were correlated with the initial nitrogen dioxide and initial chlorine concentrations according to the method proposed by Shen and Springer (1977) who suggested that the maximum concentration of condensation nuclei IV,,, formed in irradiated mix-

Photochemical ozone and nitric oxide formation 1155
Fig. 6. Maximum condensation nuclei concentrations obser- ved in chlorine-nitrogen dioxide-air mixtures as a function of the ratio of the initial chlorine concentration to the initial
nitrogen dioxide concentration. 0 data;-fit to data.
tures of air containing two reacting gases depends on the ratio of the initial concentrations of the two reacting gases [A$, and [B],,
N * [Alo/CJ% (4)
To test this hypothesis, N,,, was plotted as a function of the ratio of the initial chlorine concentration to the initial nitrogen dioxide concentration [CIJo/[NOz],,. The results, displayed in Fig. 6, show excellent cor- relation between the maximum nuclei concentration
o.ooJ I I I I
0.001 I I I I I 0 IO 20 30 40 50 60
IRRADIATION TIME, mm
and the initial concentration ratio lending support to Shen and Springer’s hypothesis (Equation (4)).
In conclusion, the experimental evidence indicates that the addition of small quantities of chlorine to irradiated mixtures of air and nitrogen dioxide gives rise to ozone formation, and to the formation of large numbers of condensation nuclei. The ozone formation was considered to result from a mechanism involving only chlorine species; however, hydrocarbon involve- ment cannot be completely ruled out. It is important to note that while the generation of condensation nuclei correlates well with the ratio of the initial chlorine and initial nitrogen dioxide concentrations, the exact na- ture of these particles remains unknown.
REFERENCES
Altshuller A. P., Kopczynski S. L., Lonneman W. A., Becker T. L. and Wilson D. L. (1968) Photooxidation ofpropylene with nitrogen dioxide in the presence of sulfur dioxide. Envir. Sci. Technol. 2, 696-698.
Altwicker E. R. (1976) Ozone formation during sulfur dioxide irradiation. J. enuir. Sci. Health All, 439-443.
Bittker D. A. and Wong E. L. (1978) Effect of nitric oxide on photochemical ozone formation in mixtures of air with molecular chlorine and with trichlorofluoromethane. NASA Technical Paper 1192, Lewis Research Center, Cleveland, Ohio.
Bufalini J. J. and Walter T. A. (1977) Ozone formation from SO,-NO, reactions. Presented at the 173rd National ACS Meeting, New Orleans, Louisiana, U.S.A.
Davis D. D., Smith G. and Klauber G. (1974) Trace gas
I I I I
5 [ N0210 = 5 Pm
001 I I I I I
b / I I 1
[ t’J02]0 = 5 PP~
I
IRRADIATION TIME, m,n
Fig. 7. Ozone and nitric oxide concentrations in irradiated nitrogen dioxide-air mixtures. Flow rates, cmJ se1 : A-47.2, O-94.4, o-188.8, B-377.6, l -755.1. The solid lines are calculated concentrations for
the reactions in Table 1.

1156 JAMES S. WAI.~ ~(‘1. GFOK(;F S. SPRIYGFR and DONM I) H. SII I)M.I\
analysis of power plant plumes via aircraft measurements: O,, NO,, and SO, chemistry. Science. N.Y. 186, 733-736.
Davis D. D., McGee T. J. and Heaps W. (1976) Direct tropospheric OH radical measurements via an aircraft platform: Laser induced fluorescence. Presented at the Z_‘th Intl Symp. on Free Rudicnls, Laguna Beach, Califor- ma, U.S.A.
Gay B. W., Jr. and Bufalini J. J. (1971) Nitric acid and the nitrogen balance of irradiated hydrocarbons in the pre- sence of oxides of nitrogen. Encir. Sci. Tech& $422-425.
Gear C. W. (1971) The automatic integration of ordinary differential equations. Commun. Ass. Comput. Much 14, 176&190.
Hampson R. F., Jr. and Garvin D. (Editors) (1978) Reactlon rate and photochemical data for atmospheric chemistry 1977. NBS Special Publication 513, U.S. Department of Commerce, Washington, D.C.
Hanst P. L. and Gay B. W. Jr. (1977) Photochemical reactlons among formaldehyde, chlorine, and nitrogen dioxide in air. E,iL%-. S<,i. Tech&. 11, 1105~ 1109.
Keifer W. S. (1977) The generation of ozone in plumes from large point sources. Ph.D. Thesis, University of Maryland. College Park, Maryland.
Miller D. F. (1977) Simulations ofgas phase SO, oxidation in power plant plumes. Presented at the 173rd National ACS Meeting, New Orleans, Louisiana, U.S.A.
Miller D. F., Alkezweeny A. J., Hales J. M. and Lee R. N. (1978) Ozone formation related to power plant emissions. Science, N.Y. 202, 1186.. 1188.
Niki H., Maker P. D., Savage C. M. and Breitenbach L. P. (1977) Fourier transform IR spectroscopic observation of pernitric acid formed via HO0 + NO, m--* HOONO,. Chem. Phys. Lett. 45, 564.~566.
Pierrard J. M. (1969) Photochemical decomposition of lead halides from automobile exhaust. Encir. Sci. Tech&. 3, 4x 51.
Ripperton L. A., Decker C. E. and Page W. W. (1965) Effect of sulfur dioxide on photochemical oxidant production. Pre- sented before the Division of Water, Air, and Waste Chemistry at the 150th R;utionul ACS Meeting. Atlantic City, yew Jersey, U.S.A.
Shen C. H. and Springer G. S. (1977) Photochemical par- ticulate formation in cyclohexene-nitrogen dioxide-air mixtures. Atmospheric EntGronment 11, 683 6X8.
Shen C. H., Springer G. S. and Stedman D. H. (1977) Photochemical ozone formation in cyclohexene--nitrogen dioxide-air mixtures. Envir. Sci. Technol. 11, 151--158.
Smith J. P. and Urone P. (1974) Static studies of sulfur dioxide reactions: EtTects of NO,, C,H,, and H,O. Envir. Sci. Tec,hnol. 8, 742-146.
Spence J. W., Edney E. 0. and Hanst P. L. (197X) Peroxy- chloroformyl nitrate: synthesis and thermal stability. (‘hem. Ph1.s. Lrtt. 56, 478.483.
Spicer C. W. and Miller D. F. (1976) Nitrogen balance in smog chamber studies. J. Air Pollut. Control Ass. 26,45551.
Stedman D. H. and Niki H. (1973) Photolysis of NOZ in air as measurement method for light intensity. Enuir. Sci. Tech&. 7, 735-739.
Stedman D. H., Ay J., Williams J. R. and Adamson T. C. (1974) Afterburning of solid rocket exhaust. Astronaut. Actu I, 1507 1509.
Stephens E. R.. Scott W. E., Hanst P. L. and Doerr R. C. (1956) Recent developments in the study of the organic chemistry of the atmosphere. J. Air PoIlut. Control Ass. 6, 159-165.
Wallace J. S. (1978) Photochemical ozone and nitric oxide formation in air and nitrogen dioxide mixtures containing sulfur dioxide, chlorine, or hydrogen sulfide. Ph.D. Thesis, University of Michigan, Ann Arbor, Michigan, U.S.A.
Wang C. C., Davis L. I., Jr., Wu C. H., Hapar S., Niki H. and Weinstock B. (1975) Hydroxyl radical concentrations measured in ambient air. Science, N.Y. 189, 797-800.
Watson R. T. (1977) Rate constants for reactions of CIO, ot
atmospheric interest. J. Phy.3. (‘hrrn Re$ Dutu 6, X71 918. Wilson W. E. and Levy A. (1970) A study of sulfur dioxtdc in
photochemical smog I. Etfect of SO, and water vapor concentration in the 1-butene NO, SO, system. ,I 41, Pollut. Control .4ss. 20, 3X5 390.
Wilson W. E., Levy A. and Wimmer D. B. (1972) A \ludq 01 sulfur dioxide in photochemical smog II. Effect of bulfur dioxide on oxidant formation in photochemical smog J Air Pollut. Control A.s. 22, 27 32.
Wongdontri-Stuper W., Simonatls R. and Heicklen J. (197X) The reaction of Cl00 with NO. Geophvs. Rrs. Lctt. 5, 1005 IOOX.
APPENDIX. REACTION VESSEL SURFACE EFFECTS
Surface effects were first suspected in mixtures contaming only nitrogen dioxide and air, since loss of nitrogen dioxide to the walls was apparently occurring. Accordingly, a term representing surface reaction of NOz was formulated by assuming that the rate of reaction of nitrogen dioxide at the surface was proportional to the instantaneous local nitrogen dioxide concentration and to the exposed surface area. Thus, the NO, lost due to surface reaction from a volume element of length AZ was expressed as
NO, concentration change per unit time due to = - k,[NO,] ;;:.; IA 1) interaction with the surface
where (NO,) is the instantaneous nitrogen dioxide con-
centration (ppm), r is the inside radius of the reaction vessel (m), and k, is the rate constant for the nitrogen dioxide reaction at the surface (m min ‘). The rate constant k, wab found to be a function of the mean velocity, and the irradiation time: k, = kl/‘t. The constant k was estimated ah follows. An arbitrary value of k was selected. Using this value and the rate constants given in Table 1, the consercation equations were solved for the desired initial nitrogen dioxide concentrations and flow rates. The ozone and nitric oxide concentrations thus calculated were compared to the mea- sured concentrations. The value of k was then adjusted until the best tit was found between the calculated and measured concentrations. This procedure was repeated at five different air flow rates (47.2.94.4, 188.8.377.7, and 755.1 cm3 s- ‘) w,ith mixtures containing either 1 ppm or 5 ppm nitrogen dioxide. In this manner k was found to be about 5 x IO -4 m
It is likely that a portion of the nitrogen dioxide rhat reacted at the surface was converted to nitric oxide and released back into the gas mixture. The mechanism by which the conversion from nitrogen dioxide to nitric oxide occurred is not known although surface photolysis is possible. Hou- ever, the effect was achieved in the model by arbitrartly Increasing the rate constant for reaction 4 (which converts nitrogen dioxide to nitric oxide in the gas phase) from L-37 x 104ppm-’ min-’ (its known value) to 2.5 x 10“ ppm-’ min- I. This latter value resulted in the best fit to the data and was subsequently used with the mathematical model.
Other products of the nitrogen dioxide surface reaction are not known. Studies by Gay and Bufalini (1971) and Spicer and Miller (1976) indicated that the major product was most likely nitric acid. Since nitric acid does not react at any appreciable rate with any of the species present in the test mixture, it was not included in the reaction mechanism.
The validity of the assumptions made here regarding k, and k, were assessed by comparing measured and calculated ozone and nitric oxide concentrations. These comparisons are shown in Fig. 7. The solid curves are the concentrations calculated for gas phase reactions only (Table 1). The data points in these figures were corrected for surface effects a\

Photochemical ozone and nitric oxide formation 1157
discussed below. The excellent agreement between the calcu- lated and measured ozone and nitric oxide concentrations suggest that the method used adequately, although arbit- rarily, accounts for the participation of the reaction surface in the reaction model.
The measured ozone and nitric oxide concentrations were corrected for losses on the surface of the reaction vessel in the following manner. First, the conservation equations cor- responding to the appropriate reaction mechanism were solved. Second, a term representing the loss of NO2 was included into the conservation equation for NO, and the conservation equations were solved again. The differences between the ozone concentrations given by the two solutions were added to the measured ozone concentrations at the appropriate irradiation time. The measured nitric oxide concentrations were adjusted in the same manner. The corrections thus applied change the measured values of the ozone and nitric oxide concentrations by lo-30% depending on the circumstances, but do not alter any predicted trends.
The sulfur dioxide data were corrected for NO, losses on
the surface in the same manner as for nitrogen dioxide-air mixtures. In chlorine-nitrogen dioxide-air mixtures the surface effects were also evaluated with the assumption that only nitrogen dioxide was lost at the surface. The effects of surface reactions involving chlorine were neglected, because it was found that when the chlorine flow was stopped the measured concentrations of ozone and nitric oxide returned within one residence time to the values obtained before the introduction of the chlorine. This observation suggested that chlorine did not significantly alter the surface. Therefore, only the term for the loss of nitrogen dioxide (Equation A.l) was included in the solution of the conservation equations formulated for the species in Table 3. It is interesting to note that the measured ozone and nitric oxide concentrations would not have changed appreciably, had the value of k, been affected slightly by chlorine reactions. Solutions of the conservation equations for chlorine-nitrogen dioxide-air mixtures showed that a 10% change in k, resulted in only a 2% change in the ozone concentration and a 5% change in the nitric oxide concentration after 4 mins of irradiation.