air quality monitoring and predicting system for
TRANSCRIPT

International Journal of Computing and Digital Systems ISSN (2210-142X)
Int. J. Com. Dig. Sys. 9, No.3 (May-2020)
E-mail: [email protected], [email protected], [email protected]
http://journals.uob.edu.bh
Air Quality Monitoring and Predicting System for Sustainable
Health Management using Multi-Linear Regression in IoT
Saritha1, Sarasvathi V1 and Smrithi S1
1Computer Science and Engineering, PESIT Bangalore South Campus, Bengaluru -560100 and affiliated to Visvesvaraya
Technological University, Belagavi, Karnataka, India
Received 2 Jan. 2020, Revised 19 Feb. 2020, Accepted 13 Apr. 2020, Published 1 May 2020
Abstract: Fresh Air is the preeminent requirement of each and every human being for a healthy living. With the increase in urbanization
and the number of vehicles on road, large amount of various poisonous gases and Particulate Matter is released into the environment,
causing global warming, rise in sea level, change in climatic condition, rainfall pattern, droughts and floods, etc. along with different
types of endemic and epidemic diseases. Air pollution has become non-trivial phenomena in the world and has a diverse effect on
every living being. In this paper, a model is built to provide a solution, to monitor the pollution level in air in any location and a warning
message is sent against the exposure of living beings to hazardous gases. System is built using Machine Learning technique, the real
time data collected from different locations is used as test data, and the model is trained with the current values to predict the future
gaseous values. A graphical representation of the air quality is presented to the user to display the current and predicted values. If
values exceed a certain predefined threshold, then possible symptoms are displayed to the user.
Keywords: Air Quality, Multi – Linear regression, Particulate Matter.
1. INTRODUCTION
Air Pollution is one of the biggest problems faced by both the developed and developing countries. Air pollution can be defined as the presence of contaminants or pollutant substances in the air that interfere in human health or produce harmful environmental effects. Polluted air contains either chemicals, any organisms or any kind of radiations or organic wastes. The health issues caused by air pollution are difficulty in breathing, asthma, lung infection, cancer, allergy, throat pain etc. Air pollution is both an environmental and a social problem, as it leads to a multitude of adverse effects on human health, ecosystems and the climate. According to survey due to air pollution 50,000 to 100,000 premature deaths per year occur in the U.S. alone. Whereas in European Union, number reaches to 300,000 and over 3,000,000 worldwide.
Monitoring the quality of air is a systematic approach for observing and studying the condition of environment. Every living being requires fresh air to breathe. With rapid industrialization, increase in population and transportation system, air pollution is now a common problem in many countries. Increase in number of vehicles on road makes a tremendous impact on environment. Major source of air pollution is from the vehicles on road emitting 97% of Carbon-Dioxide and 70% of Nitrogen-Oxide. Around 15-
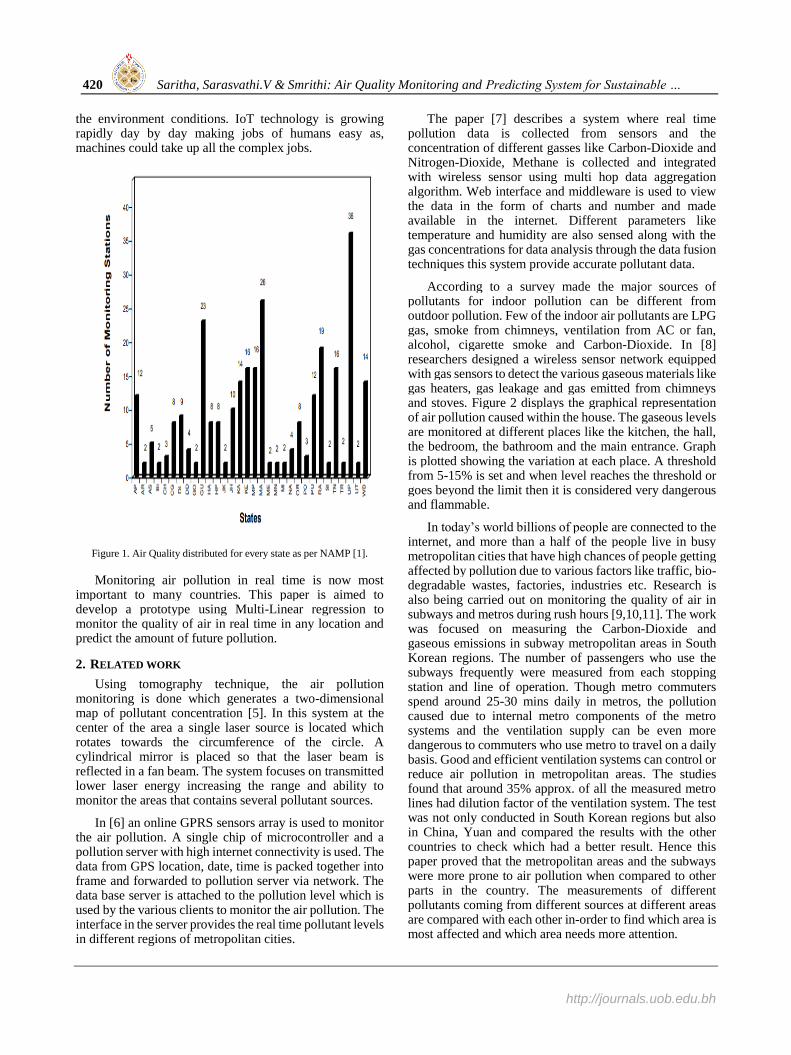
25% of the pollution is caused in the developing countries like India, China and Japan. The air pollutions may take 1% of the atmosphere and can spread globally in minutes or even few seconds [1]. Thus, these harmful radiations or chemicals can multiply in numbers and can affect each and every person inhaling or getting in contact with it. Figure 1 shows the air pollution monitoring systems installed at different places to detect the harmful poisonous gases. Highest number of monitoring system is installed in Uttar Pradesh, India [2].
Air pollution affects plants including our food crops and trees. The chemicals responsible for the pollution includes Carbon, Sulphur, and Nitrogen-Oxides. Effects of air pollution includes necrotic lesions, stunted plant growth or changing in colour including chlorosis, reddening, bronzing and mottling [3].
The Internet of Things (IoT) is interconnection of various computing devices that collects data over a system through network without human or human-computer interaction [4]. It is equipped with intelligent sensors, which helps in sending and receiving data using internet protocols. IoT is being used in city infrastructure, automobiles, health care such as remote monitoring of elderly persons health condition from any location. IoT helps in safety of personal lives and also helps in improving
http://dx.doi.org/10.12785/ijcds/090307
420 Saritha, Sarasvathi.V & Smrithi: Air Quality Monitoring and Predicting System for Sustainable …
http://journals.uob.edu.bh
the environment conditions. IoT technology is growing rapidly day by day making jobs of humans easy as, machines could take up all the complex jobs.
Figure 1. Air Quality distributed for every state as per NAMP [1].
Monitoring air pollution in real time is now most important to many countries. This paper is aimed to develop a prototype using Multi-Linear regression to monitor the quality of air in real time in any location and predict the amount of future pollution.
2. RELATED WORK
Using tomography technique, the air pollution monitoring is done which generates a two-dimensional map of pollutant concentration [5]. In this system at the center of the area a single laser source is located which rotates towards the circumference of the circle. A cylindrical mirror is placed so that the laser beam is reflected in a fan beam. The system focuses on transmitted lower laser energy increasing the range and ability to monitor the areas that contains several pollutant sources.
In [6] an online GPRS sensors array is used to monitor the air pollution. A single chip of microcontroller and a pollution server with high internet connectivity is used. The data from GPS location, date, time is packed together into frame and forwarded to pollution server via network. The data base server is attached to the pollution level which is used by the various clients to monitor the air pollution. The interface in the server provides the real time pollutant levels in different regions of metropolitan cities.
The paper [7] describes a system where real time pollution data is collected from sensors and the concentration of different gasses like Carbon-Dioxide and Nitrogen-Dioxide, Methane is collected and integrated with wireless sensor using multi hop data aggregation algorithm. Web interface and middleware is used to view the data in the form of charts and number and made available in the internet. Different parameters like temperature and humidity are also sensed along with the gas concentrations for data analysis through the data fusion techniques this system provide accurate pollutant data.
According to a survey made the major sources of pollutants for indoor pollution can be different from outdoor pollution. Few of the indoor air pollutants are LPG gas, smoke from chimneys, ventilation from AC or fan, alcohol, cigarette smoke and Carbon-Dioxide. In [8] researchers designed a wireless sensor network equipped with gas sensors to detect the various gaseous materials like gas heaters, gas leakage and gas emitted from chimneys and stoves. Figure 2 displays the graphical representation of air pollution caused within the house. The gaseous levels are monitored at different places like the kitchen, the hall, the bedroom, the bathroom and the main entrance. Graph is plotted showing the variation at each place. A threshold from 5-15% is set and when level reaches the threshold or goes beyond the limit then it is considered very dangerous and flammable.
In today’s world billions of people are connected to the internet, and more than a half of the people live in busy metropolitan cities that have high chances of people getting affected by pollution due to various factors like traffic, bio-degradable wastes, factories, industries etc. Research is also being carried out on monitoring the quality of air in subways and metros during rush hours [9,10,11]. The work was focused on measuring the Carbon-Dioxide and gaseous emissions in subway metropolitan areas in South Korean regions. The number of passengers who use the subways frequently were measured from each stopping station and line of operation. Though metro commuters spend around 25-30 mins daily in metros, the pollution caused due to internal metro components of the metro systems and the ventilation supply can be even more dangerous to commuters who use metro to travel on a daily basis. Good and efficient ventilation systems can control or reduce air pollution in metropolitan areas. The studies found that around 35% approx. of all the measured metro lines had dilution factor of the ventilation system. The test was not only conducted in South Korean regions but also in China, Yuan and compared the results with the other countries to check which had a better result. Hence this paper proved that the metropolitan areas and the subways were more prone to air pollution when compared to other parts in the country. The measurements of different pollutants coming from different sources at different areas are compared with each other in-order to find which area is most affected and which area needs more attention.

Int. J. Com. Dig. Sys. 9, No.3, 419-431 (May-2020) 421
http://journals.uob.edu.bh
Paper [12] focused on the emissions from photo-copy machines which is the basic amenity used in colleges and offices. The photo-copy machines emit harmful gases like CO, SO2, tiny paper particles, toxic gases and nano dust particles. Around the world more than billions of photo copy machines are sold. Today there is demand for digital color press, and special types of printers. The harmful gases emitted from photo-copy machines can be very dangerous to human health as these tiny dust particles can easily enter the human body through the lungs and cause cancer and infections. Figure 3 shows the graph representing the level of exposure of the photo copiers to pollution. The samples of air are taken from different centers of Coimbatore, India. The equipment used to measure the air quality was placed in front of each of these photo copiers at 5 places. For further assessment, environmental conditions, photo copy centers width, number of average photo copies done per day was collected. Though these photo-copy machines provide benefits to everyone, they can be harmful when living being often come in contact with these harmful gases. Hence along with the data collected from photo-copiers, research also focused on measuring the serum and the blood sugar levels. The increased serum levels indicated heart diseases and cardiovascular events. The test was conducted on people who are working in these centers. The toxic gases if inhaled on a frequent basis is considered dangerous as it could directly affect lungs and lead to cardiovascular diseases and events. Particulate matters were considered the most harmful from this study.
Figure 2. Indoor home AQ measurements.
In [13] different mobile sensing nodes are placed at different platforms to sense the pollutants in the atmosphere. Toxic gases like CO2, CO and tiny particulate matters which can easily enter a human body through lungs and cause lung infection, lung cancer is measured. Pollutants are sensed by the sensing nodes and are then sent to the cloud where it is stored for future purpose. From the cloud the information is available in the form of Map.
Various pollutants are tagged by their speed, time and GPS location and all these are available in the form of map. Various devices were used to support the accessing of map on their mobiles or through browsers. Hence any person can view the current status or view the whole illustration of the pollution level around them, so that they could avoid those areas which are more polluted. Figure 4 shows this process.
Figure 3. Level of exposure on the subjects
Figure 4. Sensing Nodes with Cloud connectivity
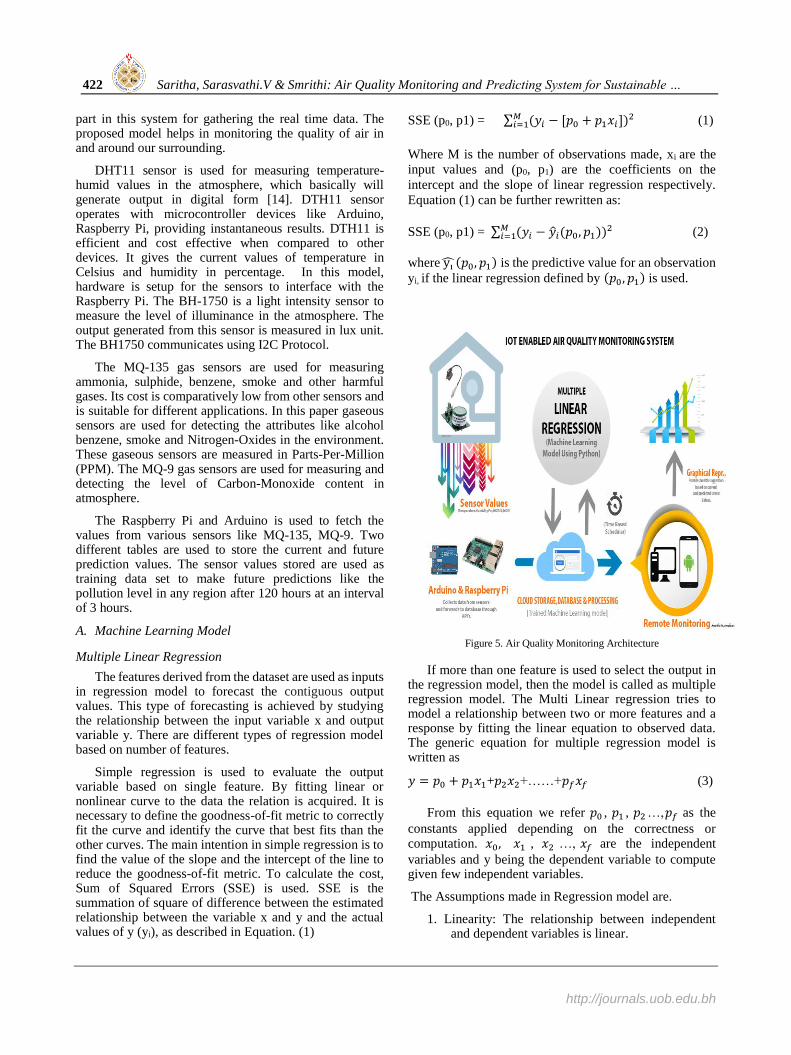
3. SYSTEM ARCHITECTURE
Figure 5 shows the system architecture of air quality monitoring system which has been designed and developed. Sensors DHT11, BH1750, light intensity sensor, MQ-9 CO gas sensor and MQ-135 form a major
422 Saritha, Sarasvathi.V & Smrithi: Air Quality Monitoring and Predicting System for Sustainable …
http://journals.uob.edu.bh
part in this system for gathering the real time data. The proposed model helps in monitoring the quality of air in and around our surrounding.
DHT11 sensor is used for measuring temperature-humid values in the atmosphere, which basically will generate output in digital form [14]. DTH11 sensor operates with microcontroller devices like Arduino, Raspberry Pi, providing instantaneous results. DTH11 is efficient and cost effective when compared to other devices. It gives the current values of temperature in Celsius and humidity in percentage. In this model, hardware is setup for the sensors to interface with the Raspberry Pi. The BH-1750 is a light intensity sensor to measure the level of illuminance in the atmosphere. The output generated from this sensor is measured in lux unit. The BH1750 communicates using I2C Protocol.
The MQ-135 gas sensors are used for measuring ammonia, sulphide, benzene, smoke and other harmful gases. Its cost is comparatively low from other sensors and is suitable for different applications. In this paper gaseous sensors are used for detecting the attributes like alcohol benzene, smoke and Nitrogen-Oxides in the environment. These gaseous sensors are measured in Parts-Per-Million (PPM). The MQ-9 gas sensors are used for measuring and detecting the level of Carbon-Monoxide content in atmosphere.
The Raspberry Pi and Arduino is used to fetch the values from various sensors like MQ-135, MQ-9. Two different tables are used to store the current and future prediction values. The sensor values stored are used as training data set to make future predictions like the pollution level in any region after 120 hours at an interval of 3 hours.
A. Machine Learning Model
Multiple Linear Regression
The features derived from the dataset are used as inputs in regression model to forecast the contiguous output values. This type of forecasting is achieved by studying the relationship between the input variable x and output variable y. There are different types of regression model based on number of features.
Simple regression is used to evaluate the output variable based on single feature. By fitting linear or nonlinear curve to the data the relation is acquired. It is necessary to define the goodness-of-fit metric to correctly fit the curve and identify the curve that best fits than the other curves. The main intention in simple regression is to find the value of the slope and the intercept of the line to reduce the goodness-of-fit metric. To calculate the cost, Sum of Squared Errors (SSE) is used. SSE is the summation of square of difference between the estimated relationship between the variable x and y and the actual values of y (yi), as described in Equation. (1)
SSE (p0, p1) = ∑ (𝑦𝑖 − [𝑝0 + 𝑝1𝑥𝑖])2𝑀𝑖=1 (1)
Where M is the number of observations made, xi are the
input values and (p0, p1) are the coefficients on the
intercept and the slope of linear regression respectively.
Equation (1) can be further rewritten as:
SSE (p0, p1) = ∑ (𝑦𝑖 − �̂�𝑖(𝑝0, 𝑝1))2𝑀𝑖=1 (2)
where yi ̂(𝑝0, 𝑝1) is the predictive value for an observation
yi, if the linear regression defined by (𝑝0 , 𝑝1) is used.
Figure 5. Air Quality Monitoring Architecture
If more than one feature is used to select the output in the regression model, then the model is called as multiple regression model. The Multi Linear regression tries to model a relationship between two or more features and a response by fitting the linear equation to observed data. The generic equation for multiple regression model is written as
𝑦 = 𝑝0 + 𝑝1𝑥1+𝑝2𝑥2+……+𝑝𝑓𝑥𝑓 (3)
From this equation we refer 𝑝0 , 𝑝1 , 𝑝2 …,𝑝𝑓 as the
constants applied depending on the correctness or computation. 𝑥0, 𝑥1 , 𝑥2 …, 𝑥𝑓 are the independent
variables and y being the dependent variable to compute given few independent variables.
The Assumptions made in Regression model are.
1. Linearity: The relationship between independent and dependent variables is linear.
Int. J. Com. Dig. Sys. 9, No.3, 419-431 (May-2020) 423
http://journals.uob.edu.bh
2. Multivariate normality: Multiple regression assumes residuals are distributed normally.
Steps involved in Multi Linear Regression Model
1. Data Pre-processing:
a) Importing Libraries and data set.
b) Encoding the categorial values.
c) Avoiding the dummy variables
d) Splitting the data set into trained and training.
2. Fitting the Multi Linear Regression to the training set.
3. Predicting the Test set Results.
In this model temperature (𝑥1) and humidity (𝑥2) are 2 independent variables. There are two instances of Multi Linear Regression.
1. Predicting MQ-135 (𝑦1) using the independent variable Temperature and Humidity( 𝑥1and 𝑥2)
2. Predicting MQ-9 (𝑦2) using the independent variable Temperature and Humidity ( 𝑥1and 𝑥2). The concept of multi-linear regression is used to predict the future values using training data and the test data fetched from the online weather map.
B. Visualization
Online weather map provides temperature and humidity values for the prediction of MQ-9 and MQ-135 values. GUI is provided in the model that acts as a web interface where any user can view the actual readings. User is provided with the login credentials to the web page to view the current and future readings. Once the user successfully logged in, user is redirected to dashboard page. A table showing current sensor values along with the level of danger and possible symptoms if any is displayed on the screen. Graphical representation shows the variation for around 20-30 values as shown in Figure 13 and Figure 14. Every time the user refreshes the page or logs in, the web page gets updated with current values and the predicted values. Here the model is trained to run every day at 12 a.m., fetch the data from the database and predicts the future values. These values are further stored in the database and the user can view the data in the webpage.
4. IMPLEMENTATION
In this model DHT-11 and BH-1750 sensors is used to interface with Raspberry Pi, to measure temperature-humidity and level of illuminance respectively. Arduino is used to monitor MQ-135 and MQ-9 gas sensor readings, as both these sensors will provide output using analog pins which are not supported or provided by Raspberry Pi. The model also aims at displaying and monitoring the current values such as temperature, humidity, MQ-9 and MQ-135 in a web browser. Figure 6 shows the complete hardware
setup. Raspbian is installed and loaded in the 32 GB SD card. Raspberry Pi 3 is connected to DHT11 and BH1750 light sensor.
Arduino Uno is connected to MQ-135 gas sensor that measures various combustible gases including benzene, alcohol, smoke, Nitrogen-Oxides etc. MQ-9 gas sensor is also connected to Arduino Uno that measures the amount of Carbon-Monoxide in the atmosphere. The Raspberry Pi and Arduino are connected to each other using a USB cable.
Initially, the values are fetched for every 15 seconds from sensors by interfacing with the Raspberry Pi and Arduino, the fetched values are stored in the database for future purpose. The information fetched from the sensors are stored in the database as the training data. Using online weather map stations, MQ-135 and MQ-9 readings of temperature and humidity is recorded and used as testing data, to compute and perform prediction analysis of poisonous gases for the next few hours. The values are represented using a graphical representation in the web browser. Probability of these predictions and accuracy is low initially but as the system gets trained, probabilities and efficiency increases.
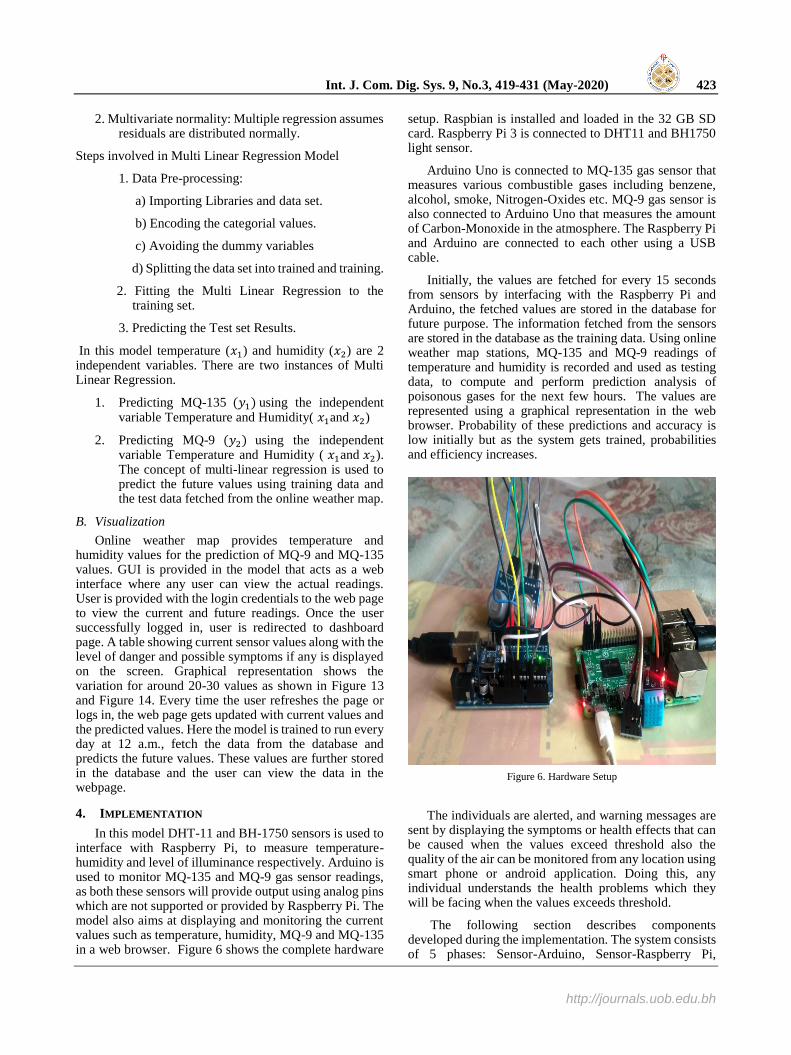
Figure 6. Hardware Setup
The individuals are alerted, and warning messages are sent by displaying the symptoms or health effects that can be caused when the values exceed threshold also the quality of the air can be monitored from any location using smart phone or android application. Doing this, any individual understands the health problems which they will be facing when the values exceeds threshold.
The following section describes components developed during the implementation. The system consists of 5 phases: Sensor-Arduino, Sensor-Raspberry Pi,
424 Saritha, Sarasvathi.V & Smrithi: Air Quality Monitoring and Predicting System for Sustainable …
http://journals.uob.edu.bh
Raspberry Pi-Arduino Interface, Django framework, Graphical User Interface.
A. Sensor-Arduino
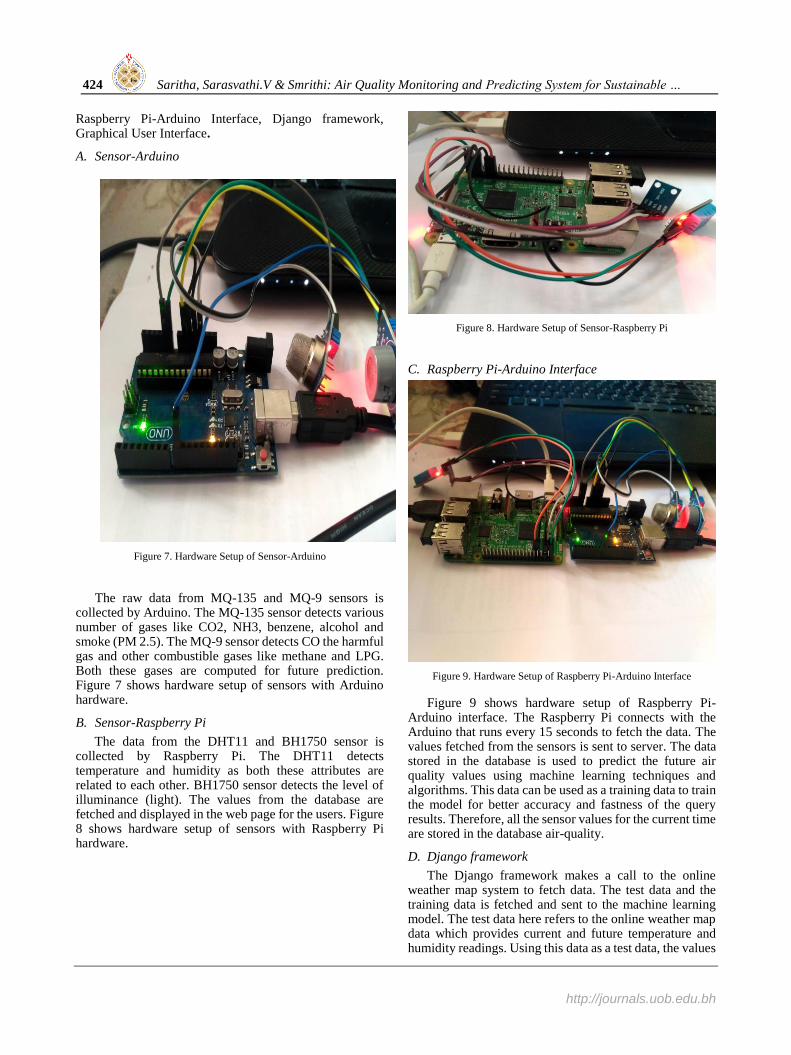
Figure 7. Hardware Setup of Sensor-Arduino
The raw data from MQ-135 and MQ-9 sensors is collected by Arduino. The MQ-135 sensor detects various number of gases like CO2, NH3, benzene, alcohol and smoke (PM 2.5). The MQ-9 sensor detects CO the harmful gas and other combustible gases like methane and LPG. Both these gases are computed for future prediction. Figure 7 shows hardware setup of sensors with Arduino hardware.
B. Sensor-Raspberry Pi
The data from the DHT11 and BH1750 sensor is collected by Raspberry Pi. The DHT11 detects temperature and humidity as both these attributes are related to each other. BH1750 sensor detects the level of illuminance (light). The values from the database are fetched and displayed in the web page for the users. Figure 8 shows hardware setup of sensors with Raspberry Pi hardware.
Figure 8. Hardware Setup of Sensor-Raspberry Pi
C. Raspberry Pi-Arduino Interface
Figure 9. Hardware Setup of Raspberry Pi-Arduino Interface
Figure 9 shows hardware setup of Raspberry Pi-Arduino interface. The Raspberry Pi connects with the Arduino that runs every 15 seconds to fetch the data. The values fetched from the sensors is sent to server. The data stored in the database is used to predict the future air quality values using machine learning techniques and algorithms. This data can be used as a training data to train the model for better accuracy and fastness of the query results. Therefore, all the sensor values for the current time are stored in the database air-quality.
D. Django framework
The Django framework makes a call to the online weather map system to fetch data. The test data and the training data is fetched and sent to the machine learning model. The test data here refers to the online weather map data which provides current and future temperature and humidity readings. Using this data as a test data, the values

Int. J. Com. Dig. Sys. 9, No.3, 419-431 (May-2020) 425
http://journals.uob.edu.bh
of MQ-135 and MQ-9 is predicted for the next 120 hours in an interval of 3 hours. The GUI is developed so that the user can view and monitor the status or level of air quality at any time.
E. Graphical User Interface
Interface provides a graphical representation of all the data collected using handheld devices or web interface. It displays the current sensor, present readings at the time of log in, level of danger as good, moderate, unhealthy or hazardous depending on the value and also possible health problems which may occur due to the pollution or if the air quality level reaches or crosses a certain threshold. Figure 10 shows the flow chart of GUI for displaying sensor values and plotting graphs from each sensor based on their values.
Figure 10. Flow chart for GUI Interface
The results displayed in the GUI or web interface can be viewed from anywhere using handheld devices or PC’s and laptops. GUI is designed to be flexible in any kind of devices like I-pads, laptops and desktop PC’s. The values from the database is displayed in the website.
GUI helps in displaying all the sensors readings fetched from the sensors. Any user who logins to the system can view the current sensor readings like temperature, humidity, gaseous substances like CO, CO2, SO3, smoke, alcohol etc. Along with the sensor readings, the status like good, unhealthy, slightly unhealthy and hazardous will be displayed according to the range of the readings.
5. RESULTS AND ANALYSIS
A. Database
Database “air-quality” consists of 4 tables namely current-sensor-data, predict-sensor-data, smart-suggestion and user-data.
TABLE I. CURRENT SENSOR VALUES
Curre
nt-id
Date-time Tempe
rature
Humi
dity
MQ_9 MQ-
135
1 2019-05-01
14:29:53 30 70 10.3 202
2 2019-05-01
14:30:08 30 70 11.6 203
3 2019-05-01
14:30:25 31 71 9.1 204
4 2019-05-01
14:30:120 31 71 8.3 204
5 2019-05-01
14:30:53 31 70 8.3 203
6 2019-05-01
14:31:23 31 69 8.3 203
7 2019-05-01
14:31:39 31 70 15.7 201
8 2019-05-01
14:31:54 31 68 12.6 209
9 2019-05-01
14:32:09 31 70 10.2 211
10 2019-05-01
14:32:25 30 70 9.4 214
The current-sensor-data displays all the current temperature, humidity, MQ-135 and MQ-9 gas values as shown in Table I. The smart-suggestion table shows the respective symptoms for each combination of values. For example, If the temperature falls in-between 25-27 degree Celsius and if humidity is in the range of 25-31%, then the suggestion-id is 1 as shown in Figure 13 and if the MQ-135 gas value exceeds 550ppm it is considered as danger as shown in Table V.
The user-data table shows the list of users who have access to the web page or the database. The database also contains the future predicted values of MQ-135 and MQ-9 that is calculated with the help of current sensor values.

426 Saritha, Sarasvathi.V & Smrithi: Air Quality Monitoring and Predicting System for Sustainable …
http://journals.uob.edu.bh
Figure 11. Current values stored in the database
Figure 11 displays current values captured by sensors through Raspberry Pi and Arduino in the database. Figure 12 shows the data computed from the machine learning model. The predicted values that is computed using Multiple Linear Regression gets stored in the database for further analyzation and accuracy. These values are basically calculated and stored for every 120 hours at a gap of 3 hours interval. The machine learning model is run every day at 12pm to predict the values of MQ-135 and MQ-9. Table II shows the predicted sensor values.
Figure 12. Predicted values stored in the database
Figure 13 and Table III shows the table containing suggestion such as possible symptoms or health effects that may occur if the values of any of the gas sensors reaches beyond the threshold. The current and predicted values are displayed in the web interface where the user or any individual can view along with the risk levels and possible symptoms. For example, If the MQ-135 value exceeds beyond 500-550ppm, then it may be dangerous and leads to heat stroke or aging of the lungs. The risk levels and suggestions are displayed based on the possible combination of values or also based on the individual value’s range and level. Depending on the level of danger each user can be alerted if the air quality becomes worse.
Table IV shows the good and worst ranges of temperature and humidity for human beings. Table V shows the ranges of MQ-135 sensor and possible levels of health concern in human beings according to the range.
Table VI shows the ranges of MQ-9 sensor that measures CO, and possible levels of health concern in humans and animals according to the range. Figure 14 shows the dashboard page after successful login. This page displays table as shown in Table VII containing current sensor readings and possible symptoms when the values reach beyond certain threshold. The risk levels and suggestions are displayed based on the possible combination of values or also based on the individual value’s range and level. Depending on the level of danger each user can be alerted if the air quality becomes worse.
Figure 13. Smart Suggestion table containing possible symptoms and health effects.

Int. J. Com. Dig. Sys. 9, No.3, 419-431 (May-2020) 427
http://journals.uob.edu.bh
TABLE II. PREDICTED SENSOR VALUES
Curre
nt-id
Date-time Tem
perat
ure
Humid
ity
MQ_9 MQ_1
35
1 2019-05-16
18:00:00 27 48 202 201
2 2019-05-16
21:00:00 26 65 203 200
3 2019-05-17
00:00:00 25 75 204 397
4 2019-05-17
03:00:00 28 59 204 398
5 2019-05-17
06:00:00 34 33 203 397
6 2019-07-11
09:00:00 30 120 203 202
7 2019-07-11
12:00:00 28 45 201 411
8 2019-07-11
15:00:00 26 53 209 410
9 2019-07-11
18:00:00 24 65 211 410
10 2019-07-
11-
21:00:00
29 72 214 410
Figure 14. Table showing current values with the possible symptoms.
TABLE III. SUGGESTION SHOWING POSSIBLE SYMPTOMS
Suggestion-id Suggestion
1 Nasal congestion and irritated sinus membrane
2 Dry eyes, Dry lips, deterioration of visual tasks like reading
3 All ok, nothing to worry
4 Hyperthermia or Overheating
5 Dehydration
6 Fatigue, Heat Stroke
7 Heat Exhaustion
8 Muscle cramps
9 heat cramps and exhaustion
10 heat swelling, fainting, nausea
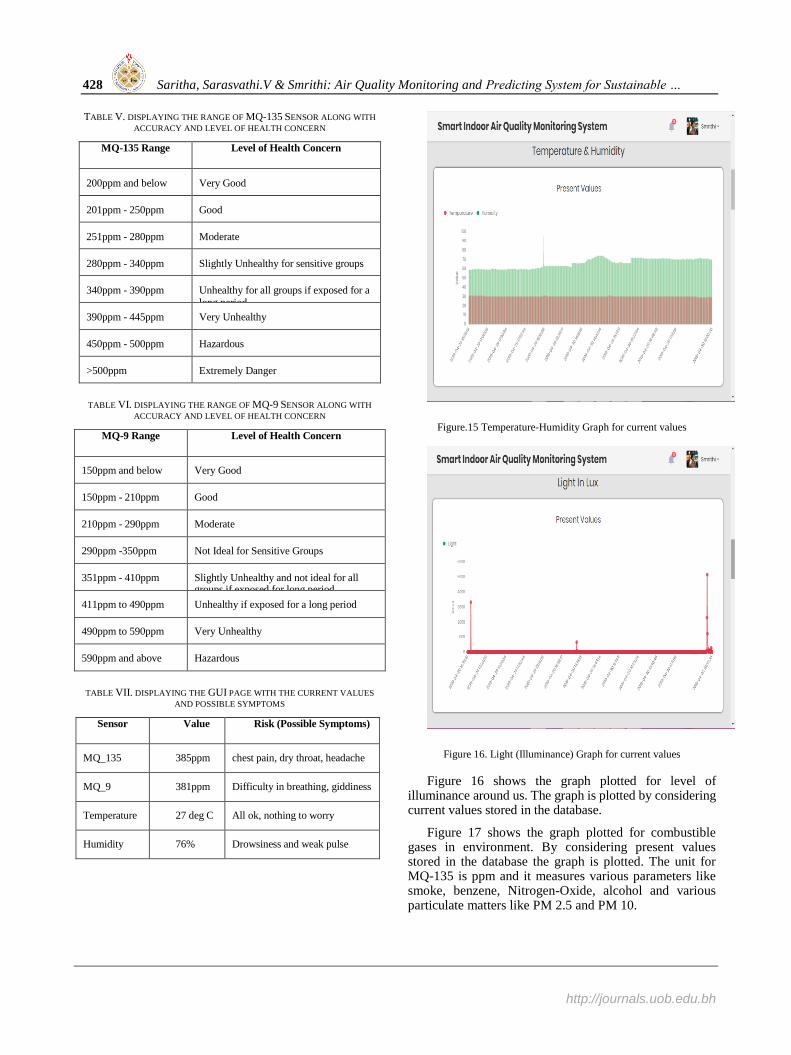
Figure 15 shows the graph plotted for temperature and humidity. The graph is plotted by considering present values stored in database. The green line shows the variation in humidity with respect to time and the red line shows the variation in temperature with respect to time. The values are fetched from the DHT11 sensor.
TABLE IV. DISPLAYING THE RANGE OF DHT11 SENSOR ALONG WITH
ACCURACY AND LEVEL OF HEALTH CONCERN
Temp range Humidity Level of Concern
27◦C-30◦C 30%-60% Good
31◦C-35◦C 61%-68% Moderate
36◦C-41◦C 68%-71% Unhealthy
41◦C-50◦C 71%-75% Very Unhealthy
>51◦C >75% Hazardous
20◦C-26◦C 25%-30% Low
20◦C< 25%< Extremely Low
428 Saritha, Sarasvathi.V & Smrithi: Air Quality Monitoring and Predicting System for Sustainable …
http://journals.uob.edu.bh
TABLE V. DISPLAYING THE RANGE OF MQ-135 SENSOR ALONG WITH
ACCURACY AND LEVEL OF HEALTH CONCERN
MQ-135 Range Level of Health Concern
200ppm and below Very Good
201ppm - 250ppm Good
251ppm - 280ppm Moderate
280ppm - 340ppm Slightly Unhealthy for sensitive groups
340ppm - 390ppm Unhealthy for all groups if exposed for a
long period
390ppm - 445ppm Very Unhealthy
450ppm - 500ppm Hazardous
>500ppm Extremely Danger
TABLE VI. DISPLAYING THE RANGE OF MQ-9 SENSOR ALONG WITH
ACCURACY AND LEVEL OF HEALTH CONCERN
MQ-9 Range Level of Health Concern
150ppm and below Very Good
150ppm - 210ppm Good
210ppm - 290ppm Moderate
290ppm -350ppm Not Ideal for Sensitive Groups
351ppm - 410ppm Slightly Unhealthy and not ideal for all groups if exposed for long period
411ppm to 490ppm Unhealthy if exposed for a long period
490ppm to 590ppm Very Unhealthy
590ppm and above Hazardous
TABLE VII. DISPLAYING THE GUI PAGE WITH THE CURRENT VALUES
AND POSSIBLE SYMPTOMS
Sensor Value Risk (Possible Symptoms)
MQ_135 385ppm chest pain, dry throat, headache
MQ_9 381ppm Difficulty in breathing, giddiness
Temperature 27 deg C All ok, nothing to worry
Humidity 76% Drowsiness and weak pulse
Figure.15 Temperature-Humidity Graph for current values
Figure 16. Light (Illuminance) Graph for current values
Figure 16 shows the graph plotted for level of illuminance around us. The graph is plotted by considering current values stored in the database.
Figure 17 shows the graph plotted for combustible gases in environment. By considering present values stored in the database the graph is plotted. The unit for MQ-135 is ppm and it measures various parameters like smoke, benzene, Nitrogen-Oxide, alcohol and various particulate matters like PM 2.5 and PM 10.

Int. J. Com. Dig. Sys. 9, No.3, 419-431 (May-2020) 429
http://journals.uob.edu.bh
Figure 17. MQ-135 Graph for current values
Figure 18. MQ-135 Graph for future predicted values
Figure 18 shows the graph plotted for combustible gases in environment. This graph is plotted by considering predicted values stored in the database. MQ-135 gas is measured considering the current temperature and humidity values from the online weather map. Using the values of temperature and humidity MQ-135 is predicted for the next 120 hours at a gap of 3 hours.
Figure 19. MQ-9 Graph for current values
Figure 19 shows the graph plotted for measuring CO in the environment. This graph is plotted by considering current values stored in the database.
Figure 20. MQ-9 Graph for future predicted values
Figure 20 shows the graph plotted for measuring CO. The graph is plotted by considering predicted values stored in the database. Once the user imitates the command Django framework will predicts the value of MQ-135 and MQ-9.
430 Saritha, Sarasvathi.V & Smrithi: Air Quality Monitoring and Predicting System for Sustainable …
http://journals.uob.edu.bh
Figure 21. GUI interface to operate manually
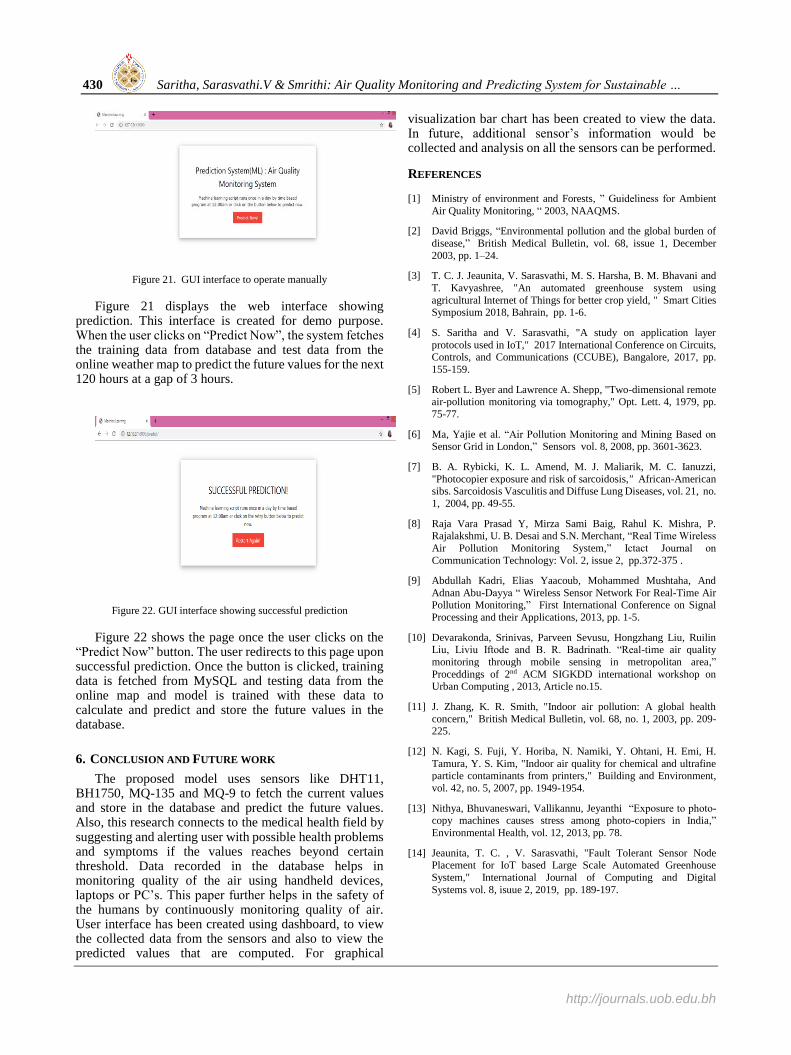
Figure 21 displays the web interface showing prediction. This interface is created for demo purpose. When the user clicks on “Predict Now”, the system fetches the training data from database and test data from the online weather map to predict the future values for the next 120 hours at a gap of 3 hours.
Figure 22. GUI interface showing successful prediction
Figure 22 shows the page once the user clicks on the “Predict Now” button. The user redirects to this page upon successful prediction. Once the button is clicked, training data is fetched from MySQL and testing data from the online map and model is trained with these data to calculate and predict and store the future values in the database.
6. CONCLUSION AND FUTURE WORK
The proposed model uses sensors like DHT11, BH1750, MQ-135 and MQ-9 to fetch the current values and store in the database and predict the future values. Also, this research connects to the medical health field by suggesting and alerting user with possible health problems and symptoms if the values reaches beyond certain threshold. Data recorded in the database helps in monitoring quality of the air using handheld devices, laptops or PC’s. This paper further helps in the safety of the humans by continuously monitoring quality of air. User interface has been created using dashboard, to view the collected data from the sensors and also to view the predicted values that are computed. For graphical
visualization bar chart has been created to view the data. In future, additional sensor’s information would be collected and analysis on all the sensors can be performed.
REFERENCES
[1] Ministry of environment and Forests, ” Guideliness for Ambient
Air Quality Monitoring, “ 2003, NAAQMS.
[2] David Briggs, “Environmental pollution and the global burden of
disease,” British Medical Bulletin, vol. 68, issue 1, December
2003, pp. 1–24.
[3] T. C. J. Jeaunita, V. Sarasvathi, M. S. Harsha, B. M. Bhavani and
T. Kavyashree, "An automated greenhouse system using
agricultural Internet of Things for better crop yield, " Smart Cities Symposium 2018, Bahrain, pp. 1-6.
[4] S. Saritha and V. Sarasvathi, "A study on application layer
protocols used in IoT," 2017 International Conference on Circuits, Controls, and Communications (CCUBE), Bangalore, 2017, pp.
155-159.
[5] Robert L. Byer and Lawrence A. Shepp, "Two-dimensional remote air-pollution monitoring via tomography," Opt. Lett. 4, 1979, pp.
75-77.
[6] Ma, Yajie et al. “Air Pollution Monitoring and Mining Based on Sensor Grid in London,” Sensors vol. 8, 2008, pp. 3601-3623.
[7] B. A. Rybicki, K. L. Amend, M. J. Maliarik, M. C. Ianuzzi,
"Photocopier exposure and risk of sarcoidosis," African-American sibs. Sarcoidosis Vasculitis and Diffuse Lung Diseases, vol. 21, no.
1, 2004, pp. 49-55.
[8] Raja Vara Prasad Y, Mirza Sami Baig, Rahul K. Mishra, P. Rajalakshmi, U. B. Desai and S.N. Merchant, “Real Time Wireless
Air Pollution Monitoring System,” Ictact Journal on
Communication Technology: Vol. 2, issue 2, pp.372-375 .
[9] Abdullah Kadri, Elias Yaacoub, Mohammed Mushtaha, And
Adnan Abu-Dayya “ Wireless Sensor Network For Real-Time Air Pollution Monitoring,” First International Conference on Signal
Processing and their Applications, 2013, pp. 1-5.
[10] Devarakonda, Srinivas, Parveen Sevusu, Hongzhang Liu, Ruilin Liu, Liviu Iftode and B. R. Badrinath. “Real-time air quality
monitoring through mobile sensing in metropolitan area,”
Proceddings of 2nd ACM SIGKDD international workshop on Urban Computing , 2013, Article no.15.
[11] J. Zhang, K. R. Smith, "Indoor air pollution: A global health
concern," British Medical Bulletin, vol. 68, no. 1, 2003, pp. 209-225.
[12] N. Kagi, S. Fuji, Y. Horiba, N. Namiki, Y. Ohtani, H. Emi, H.
Tamura, Y. S. Kim, "Indoor air quality for chemical and ultrafine
particle contaminants from printers," Building and Environment,
vol. 42, no. 5, 2007, pp. 1949-1954.
[13] Nithya, Bhuvaneswari, Vallikannu, Jeyanthi “Exposure to photo-copy machines causes stress among photo-copiers in India,”
Environmental Health, vol. 12, 2013, pp. 78.
[14] Jeaunita, T. C. , V. Sarasvathi, "Fault Tolerant Sensor Node Placement for IoT based Large Scale Automated Greenhouse
System," International Journal of Computing and Digital
Systems vol. 8, isuue 2, 2019, pp. 189-197.

Int. J. Com. Dig. Sys. 9, No.3, 419-431 (May-2020) 431
http://journals.uob.edu.bh
Saritha received the Bachelor of
Engineering in Information
Science and Engineering and
Masters from VTU, Belgaum. She
is pursuing her Ph.D degree under
the supervision of Dr.Sarasvathi
V. Her current research interests
are in the Internet of Things. She
is currently working as Assistant
Professor in Computer Science
and Engineering in PESIT
Bangalore South Campus, India.
Dr.Sarasvathi V is currently working
as Associate Professor in Computer
Science and Engineering in PESIT
Bangalore South Campus, Bangalore,
India. She has completed Ph.D in VIT
University, Vellore, Tamil Nadu. Her
research interest includes Wireless
Ad-Hoc, Sensor and Mesh Networks,
Internet of Things, Cloud Computing,
Network Optimization and
Performance computing.She had
nearly 12 research publications in
reputed peer reviewed international
journals and conferences.
Smrithi Surendran received the
B.E. degree in Information Science
and Engineering from Vemana
Institute of Technology, India, in the
year 2016. She worked as a Software
Engineer in Accord Software and
Systems Private Limited for one year
after which she pursued M. Tech in
Computer Science and Engineering
from PES Institute of Technology
Bangalore South Campus, India, in
the year 2019