different approaches for predicting air jet spun yarn …
TRANSCRIPT

I
DIFFERENT APPROACHES FOR
PREDICTING AIR JET SPUN YARN
STRENGTH
Moaaz Ahmed Samy Moustafa Eldeeb
SUMMARY OF THE THESIS

II
Title of the thesis: Different approaches for predicting air jet spun yarn strength
Author: Moaaz Ahmed Samy Moustafa Eldeeb
Field of study: Textile Technics and Materials Engineering
Mode of study: Full-time
Department: Department of Technology and Structures
Supervisor: Ing. Eva Moučková, Ph.D.
Committee for the defense of the dissertation:
Chairman:
prof. Ing. Bohuslav Neckář, DrSc. FT TUL, Department of Technology and
Structures
Vice-chairman:
doc. Ing. Maroš Tunák, Ph.D. FT TUL, Department of Textile Evaluation
prof. Ing. Michal Šejnoha, Ph.D., DSc. ČVUT Faculty of Civil Engineering, Department
of Mechanics
prof. Ing. Miroslav Václavík, CSc. VÚTS, a.s.
doc. Ing. Martin Bílek, Ph.D. FS TUL, Department of Textile Machine Design
doc. Ing. Lukáš Čapek, Ph.D. FT TUL, Department of Technology and
Structures
doc. Ing. Pavel Rydlo, Ph.D. FM TUL, Institute of Mechatronics and
Computer Engineering
doc. Ing. Jiří Sloupenský, CSc. (opponent) Rieter CZ, s.r.o
Ing. Gabriela Krupincová, Ph.D. FT TUL, Department of Technology and
Structures
The second opponent who is not a member of the committee is Associate Professor
Dipayan Das, Ph.D. z Indian Institute of Technology Delhi, Dept. of Textile Technology.
The dissertation is available at the Dean's Office FT TUL.
Liberec 2017

III
Abstract
Air jet spinning process has reached an industrial acceptance stage having developed through
half a century. This study aims to contribute to the knowledge of air-jet yarn formation
process by investigating the influence of selected technological parameters of the Rieter air-
jet spinning machine on yarn properties, especially its strength. Furthermore, to shed light on
the problem of the prediction of yarn strength. A three-dimensional numerical simulation of
the airflow field inside Rieter air jet spinning nozzle has been presented. The velocity and
pressure distribution were analyzed to describe the principle of yarn formation. The analysis
of velocity components and static pressure revealed how the air vortices are created inside the
nozzle as well as how the yarn is spun.
A numerical simulation along with experimental verification were performed to investigate
the influence of nozzle pressure on air jet yarn tenacity and the results were in good
agreement. The results show that increasing nozzle pressure resulted initially in improving
yarn tenacity, but at high-pressure, tenacity deteriorates.
Different approaches have been used to predict the tenacity of air jet yarn. One of these
approaches is a statistical model, where the effect of yarn linear density, delivery speed and
nozzle pressure on yarn strength were investigated and a multiple regression model was used
to study the combined effect of these parameters and response surfaces were obtained. Based
on the different combinations of processing variables, optimal running conditions for tested
materials were obtained.
As a second possible approach to predict yarn strength, a mathematical model that predicts
the strength of Viscose and Tencel air jet spun yarn at short gauge length has been presented
which is based on an earlier model. The model is based on calculating the core fiber strength
as a parallel bundle of fibers. Also, calculating the wrapper fiber strength as a bundle of fibers
in the form of helical path and considering the interaction effect between the wrapper and core
fibers. Fiber parameters in addition to yarn structural parameters were used to obtain the
theoretical yarn tenacity at short gauge length. Results showed that the accuracy of the
proposed model is satisfactory for the tested yarns set.
As an alternative approach to predict air jet yarn strength, a statistical model has been
presented. By using this model, the influence of the tensile tester gauge length on the ring,
rotor, and air jet spun yarn tenacity and its coefficient of variation has been investigated. The

IV
model correlates yarn tenacity and coefficient of variation of yarn tenacity to gauge length.
The model is based on Peirce model and assuming the 3-parameter Weibull distribution of
yarn strength values. A reasonable agreement has been shown between the experimental and
the predicted values. The model successfully captured the change in yarn strength and its
coefficient of variation at different gauge lengths. Results confirmed that at longer gauge
lengths, yarn strength decreases and its coefficient of variation decreases as well.
Keywords
Numerical simulation; mathematical modeling; statistical modeling; fibers; Rieter air jet
spinning; airflow; wrapper ratio; strength prediction; Viscose; Weibull distribution; gauge
length; linear density; nozzle pressure; delivery speed; structure.

V
Anotace
V současné době tryskové dopřádání dosáhlo po půlstoletí svého vývoje průmyslového uznání
a zaujalo své místo na trhu. Cílem této práce je přispět k poznání procesu tvorby příze,
zmapovat vliv vybraných technologických parametrů tryskového dopřádacího stroje na
vlastnosti příze, zejména její pevnost a především poskytnout širší náhled na problematiku
predikce pevnosti tryskové příze. V práci je provedena trojrozměrná numerická simulace
průtokového pole vzduchu uvnitř spřádací trysky tryskového dopřádacího stroje Rieter Air-
jet. Byla analyzována distribuce rychlosti a tlaku vzduchu s cílem popsat princip tvorby příze.
Analýza složek rychlosti a statického tlaku vzduchu ukázala, jak jsou uvnitř trysky tvořeny
vzduchové víry, a jakým způsobem se příze formuje.
Byla provedena numerická simulace spolu s experimentální verifikací, která zkoumala vliv
tlaku kroutícího vzduchu na pevnost příze. Výsledky simulace přinesly dobrou shodu s
experimentem. Výsledky ukázaly, že zvyšující se tlak v trysce vedl zpočátku ke zlepšení
pevnosti příze, ale při vysokém tlaku vzduchu se pevnost zhoršila.
Ve stěžejní části práci jsou prezentovány a popsány různé možnosti přístupů k predikce
pevnosti příze. Jedním z nich je statistické modelování založené na experimentálních
měřeních. V rámci tohoto přístupu byl sledován vliv délkové hmotnosti příze, odtahové
rychlosti a nastaveného spřádního tlaku vzduchu. Pro analýzu kombinovaného vlivu těchto
parametrů pomocí responzních povrchů byl použit vícenásobný regresní model. Na základě
různých kombinací mezi sledovanými technologickými veličinami byly získány optimální
parametry nastavení pro testovaný materiál.
Jako druhý z možných přístupů k predikci pevnosti tryskové příze je navržen matematický
model. Pomocí tohoto modelu lze predikovat pevnost 100% viskozové a 100% tencelové
tryskové příze na krátkých upínacích délkách. Model je založen na výpočtu pevnosti jádra
příze, jakožto paralelního svazku vláken, výpočtu pevnosti obalové vrstvy vláken jakožto
svazku vláken ovinutého ve šroubovici kolem jádra příze. V modelu je rovněž zohledněn
interakční účinek mezi vlákny v obalu a vlákny v jádru příze. Jako vstupní parametry modelu
pro výpočet teoretické pevnosti příze na krátkých upínacích délkách jsou použity parametry
vláken i strukturální parametry příze. Výsledky ukázaly, že přesnost navrhovaného modelu je
uspokojivá pro soubor experimentálních přízí.
Jako další z možných přístupů k predikci pevnosti příze (na krátkých úsečkách) je

VI
prezentován statistický model. Pomocí modelu je zkoumán vliv upínací délky příze v trhacím
přístroji na pevnost a variační koeficient pevnosti tryskové, prstencové a rotorové příze.
Model vychází z Peirceova modelu a předpokládá tříparametrové Weibullovo rozdělení
hodnot pevnosti příze. Mezi experimentálními a predikovanými hodnotami byla zaznamenána
přiměřená shoda. Model úspěšně zachytil změny pevnosti příze a její variační koeficient při
různých upínacích délkách. Výsledky potvrdily, že při větších upínacích délkách pevnost
příze klesá a její variační koeficient se rovněž snižuje.
Klíčová slova
Numerická simulace; matematické modelování; statistické modelování; vlákna; tryskové dopřádání
Rieter; proud vzduchu; podíl obalových vláken; predikce pevnosti; viskóza; Weibullovo rozdělení;
upínací délka; jemnost; tlak spřádního vzduchu; odváděcí rychlost; struktura

VII
Table of Contents
Abstract ........................................................................................................................... III
Anotace ............................................................................................................................ V
Table of Contents ........................................................................................................... VII
1. Introduction .................................................................................................................. 9
2. Overview of the Current State of the Problem ................................................................ 9
2.1 Literature review .......................................................................................................... 9
2.2 Purpose and aim of the thesis ..................................................................................... 11
3. Description of Principle of Yarn Formation Using Numerical Modeling ......................... 12
3.1 Numerical computation .............................................................................................. 12
3.2 Experimental verification ........................................................................................... 13
3.3 Numerical modeling results ........................................................................................ 14
3.3.1 Vortex creation .............................................................................................................. 14
3.3.2 Principle of yarn formation ........................................................................................... 15
3.3.2.1 Tangential velocity distribution ............................................................................ 15
3.3.2.2 Radial velocity distribution .................................................................................. 16
3.3.2.3 Axial velocity distribution .................................................................................... 16
3.3.3 Effect of nozzle pressure on structure and strength of the air jet yarn .......................... 16
4. Prediction of Air Jet Yarn Strength Based on Statistical Modeling............................... 20
4.1 Materials and methods ............................................................................................... 20
4.2 Regression model ........................................................................................................ 20
4.3 Effect of process parameters on yarn strength............................................................ 21
5. Prediction of Air Jet Yarn Strength Based on Mathematical Modeling ........................ 22
5.1 Model for the failure of the air jet spun yarn .............................................................. 22
5.1.1 Determination of core fiber strength ............................................................................. 22
5.1.2 Wrapper fiber strength component ................................................................................ 24
5.2 Experimental verification ........................................................................................... 24
5.3 Results of the mathematical model ............................................................................. 25
6. Prediction of Air Jet Yarn Strength at Different Gauge Lengths Based on Statistical
Modeling ........................................................................................................................ 27
6.1 Yarn strength in relation to gauge length ................................................................... 28
6.1.1 Calculating the mean yarn strength ............................................................................... 29
6.1.2 Calculating the standard deviation of yarn strength ...................................................... 30
6.1.3 Calculating the coefficient of variation of yarn strength ............................................... 31
6.1.4 Mathematical model validation ..................................................................................... 31

VIII
6.2 Results of the model.................................................................................................... 31
6.2.1 Yarn strength ................................................................................................................. 31
6.2.2 Coefficient of variation of yarn strength ....................................................................... 33
7. Evaluation of results and new findings ........................................................................ 34
References ...................................................................................................................... 35
Publications ................................................................................................................... 41
Curriculum Vitae ............................................................................................................ 43
Brief Description of the Current Expertise, Research, and Scientific Activities ................ 44

9
1. Introduction
Air jet spinning process has reached an industrial acceptance stage having developed through
half a century. Known as Fasciated spinning, air jet yarn was first introduced by DuPont
Company in 1971 using the principle of air vortices to form a yarn. In 1982, Murata jet
spinning "MJS" was introduced and achieved more commercial success. In this system, some
control was achieved over the distribution of the wrapper fibers leading to better yarn quality.
MJS has a major disadvantage of not being able to produce acceptable 100% cotton yarns.
Furthermore, MJS is restricted to finer counts, since yarn tenacity reduces as the yarn
becomes coarser. In 1997, Murata jet spinning "MVS" was introduced. The MVS system uses
a single nozzle with an inner needle and this system became able to produce 100% carded
cotton yarns [1]. In 2009, Rieter Company presented the latest method in air jet yarn
production. Both Rieter and MVS systems are based on a similar principle, but the nozzle
block in Rieter system does not contain the needle holder that works as a twisting guide [2].
2. Overview of the Current State of the Problem
2.1 Literature review
Since the yarn structure and properties in air jet spinning technology depend on the airflow
field distribution and its intensity inside the air jet nozzle, therefore, it is necessary to study
this airflow. The early system of air jet spinning was introduced by MJS. Investigations were
carried out to simulate numerically the airflow field on this system using computational fluid
dynamics “CFD” software [3]–[6]. Other researchers performed a numerical computation of
the airflow field in MVS in order to explain the principle of yarn formation [7], [8]. Also,
different numerical along with experimental investigations were carried out to study the
influence of MVS production and nozzle parameters on yarn structure and properties [9]–
[21]. There are differences in nozzle design between Murata and Rieter nozzle. Therefore, it is
interesting to simulate the airflow field inside the Rieter nozzle as this could give a better
understanding of this new technique. Furthermore, since the pressure is an important air jet
spinning process parameter, therefore its influence on airflow should be investigated. In this
way, the change in yarn strength as nozzle pressure changes can be predicted.
Also, experimental investigations were carried out on the influence of MVS machine
production parameters on yarn properties in order to optimize yarn quality. Those parameters
are nozzle (pressure and orifice angle), the distance between spindle and front roller nip point,
10
draft, spindle (cross-section, working period and diameter), yarn (linear density and delivery
speed) and fiber composition. Most of these parameters proved to have a significant effect on
final yarn properties [22]–[25]. Although these parameters have been investigated, the slight
differences in nozzle design for both Rieter and MVS systems may lead to a different trend.
Along with these experiments, response surface equations were obtained using multiple
regression that relates process parameters to yarn structure and its properties [26]–[28]. Yet
no regression model has been presented for Rieter air jet spun yarns. A possible model can be
presented that predicts yarn tenacity based on nozzle pressure, delivery velocity and yarn
linear density, which are considered as very important air jet spinning parameters.
There is no doubt that the strength is considered as a very important yarn property that
significantly influences its post-processing performance and final fabric quality. To engineer
air jet yarns aiming better quality, this requires knowing the relationship between fiber
properties, yarn structure, and yarn properties. The mathematical models are usually used to
describe and explain such relationships [29]. Numerous researchers presented a good
contribution to this topic. Many of them presented mathematical models for ring spun yarn
[30]–[42] and rotor yarn [32], [43]–[46]. Nevertheless, mathematical models of air jet spun
yarn are limited [47]–[50]. Rajamanickam et al. [51], [52] presented mathematical models that
describe the air jet yarn fracture behavior, including the failure mechanism of core and
wrapper fibers and predict the air jet yarn strength accordingly. They obtained a mathematical
relationship between yarn breaking load, its structural parameters, and fibers properties.
However, their model is a bit complicated as well as they obtained a prediction error which
was quite high. So, it is necessary to develop a model which can be simpler and more
accurate.
Generally yarn strength is measured at 500 mm gauge length, however, in fact, the yarn is
exposed to stresses at longer lengths in post-spinning processes particularly in sizing,
warping, and weaving. Therefore, it is interesting to know how yarn strength varies at
different gauge lengths. Substantial researches have been done to study experimentally the
effect of gauge length on different spun yarn tensile properties [53]–[59]. Some other
researchers studied this phenomenon theoretically and developed a model that relates yarn
tenacity to gauge length [38], [60]. Zurek et al. proposed empirical relationships between yarn
tenacity and gauge length [31], [56], [61]–[65]. Peirce proposed the weak link theory and
concluded that yarn strength decreases with the increase of gauge length [66]. By studying
Peirce model, it can be seen that it is based on Gaussian distribution, nevertheless, by
11
analyzing the model, it is observed that it is valid only on short gauge lengths. Therefore, a
new model can be established if another type of distribution for the yarn strength values is
assumed. If this distribution fits the data well, this could achieve more accurate model.
2.2 Purpose and aim of the thesis
The main aims of this thesis are to contribute to the knowledge of the air jet yarn formation
process, particularly Rieter air jet spinning technology, to investigate the influence of selected
technological parameters of the spinning machine on yarn properties, especially its strength.
Furthermore, to shed light on the problem of the prediction of yarn strength by trying different
approaches to establish models that can be used for prediction of air jet spun yarns strength.
Each model, whether statistical, mathematical or numerical could contribute to understanding
the air jet spinning process, yarn structure, yarn strength and the relationship between fibers
and yarns.
The first part of this work includes a 3-dimensional simulation of the airflow field inside the
Rieter air jet spinning nozzle using ANSYS software which is based on the finite volume
method. So, before embarking on prediction process, the principle of yarn formation is
initially explained using the numerical simulation approach. Afterward, the effect of nozzle
pressure has been studied using the simulation process, then experiments have been
conducted to verify the results obtained from the simulation process. Furthermore, predicting
the change in the air jet yarn strength as nozzle pressure changes.
The second part aims to investigate some process parameters in Rieter air jet spinning
technology, namely, yarn linear density, nozzle pressure, and delivery speed. These
parameters were proved to influence fiber configuration and yarn structure significantly.
Along with the experiment, a statistical model had been established based on multiple
regression to study the combined effect of process parameter on yarn tenacity as well as to
predict the air jet yarn strength.
In the third part, a mathematical model to predict the air jet yarn strength at short gauge length
is presented. An earlier mathematical model for air jet yarn strength has been modified
targeting simpler and more accurate model. And in the last part, an attempt has been made to
establish a statistical model to predict the air jet yarn strength at different gauge lengths. The
model is based on an earlier model but used a different type of the distribution function to fit
yarn strength values at all gauge lengths, hence, obtaining the more accurate model.
Moreover, the validation of the model was extended to include ring, rotor, and air jet yarns.

12
3. Description of Principle of Yarn Formation Using
Numerical Modeling
In this chapter, a 3D simulation process has been carried out to study the principle of yarn
formation of the Rieter air jet spinning machine. Along with the theoretical study, an
experimental investigation was carried out to study the effect of the nozzle pressure on yarn
tenacity.
3.1 Numerical computation
All dimensions of a Rieter air jet nozzle unit were measured and the cross-sectional view of
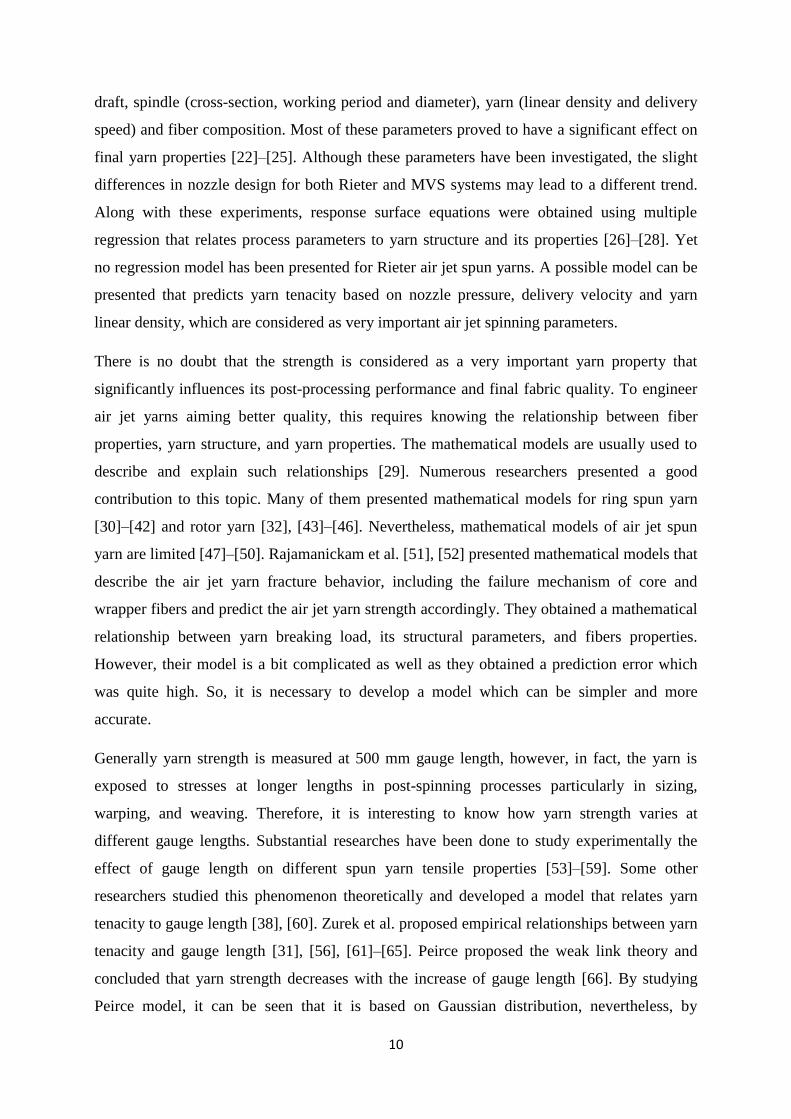
the nozzle is shown in Figure 3.1-a. The simulated region consists of all regions occupied by
the air (the existence of yarn was ignored seeking simplification). The mesh of the fluid field
was constructed using an unstructured tetrahedral grid. The computational grid of the airflow
field in Rieter air jet spinning nozzle is shown in Figure 3.1-b. Afterward, the mesh quality
was adjusted using inflation sizing and edge sizing. The steady state was employed in the
modeling process.
The characteristics of the flow in this nozzle pertain to the high swirling instruments which
have anisotropic airflow. Therefore, the realizable k-ε model was used to simulate this
turbulent airflow. Since nozzle inlet pressure is very high and the internal airflow speed is
very high, the air density change cannot be ignored (compressible fluid). Therefore, the
solution method in the Fluent module was density based. The governing equations are as
follows; the mass conservation equation in the differential form, the momentum conservation
equation in the form of Navier-Stokes equation for compressible flow and the ideal gas law.
The realizable k-ɛ turbulence model was adopted and combined with the implicit solver to
obtain the simulation results.
The boundary conditions were set as follows; the solid wall has the non-slip boundary
condition, nozzle outlet pressure is equal to the outside atmospheric pressure, nozzle inlet
pressure is equal to the external atmospheric pressure, hollow spindle outlet pressure is equal
to the external atmospheric pressure. Different pressures were applied for the four jet orifices
inlets; 0.4, 0.5 and 0.6 MPa. To simplify the modeling process, the process is assumed
adiabatic.
13
(a) (b) (c)
Figure 3.1 Rieter nozzle, (a) 2D cross-sectional view, (b) the computational grid of the
airflow field, (c) velocity components.
3.2 Experimental verification
100% Viscose fibers of 1.3 dtex and 38 mm length were spun to produce air jet spun yarns.
The drawn sliver with 3.5 ktex was spun using Rieter air jet spinning machine J20 to produce
23 Tex yarns with different nozzle pressure; 4, 5 and 6 bar. Yarn tensile properties were tested
using Instron 4411 instrument. One-way ANOVA test was performed to check the
significance of nozzle pressure on yarn tenacity. To verify the simulation process in a better
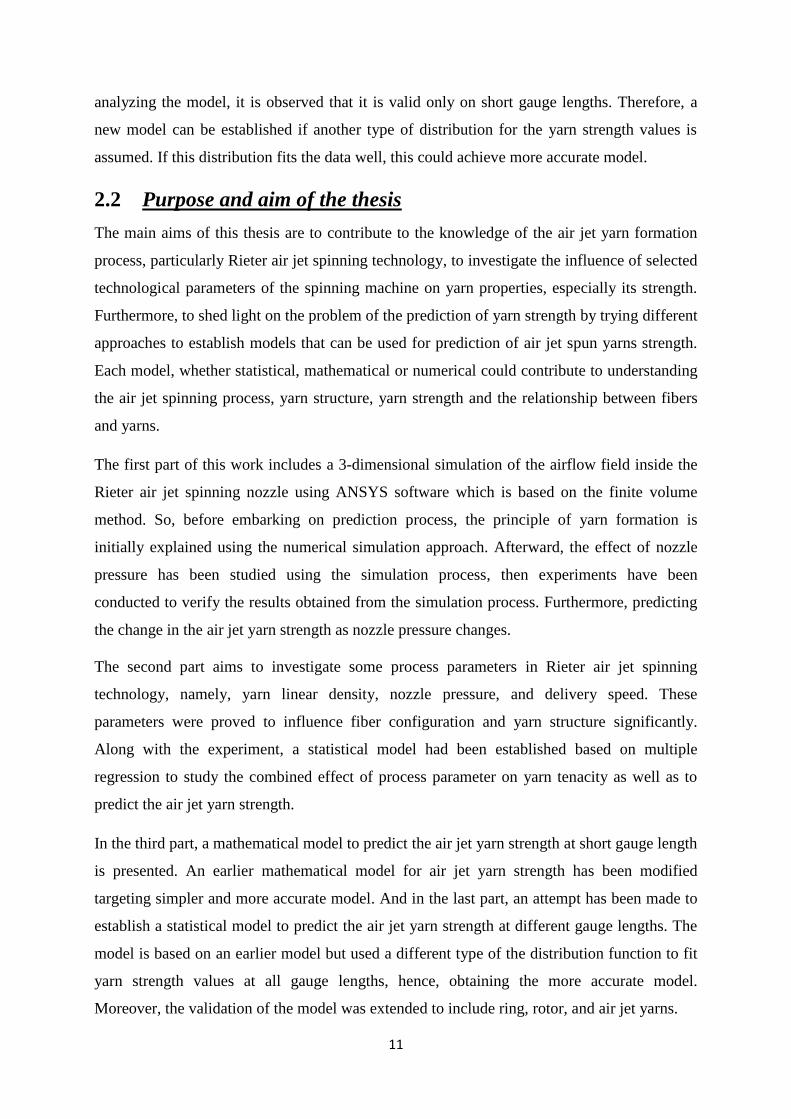
way, yarn structure was analyzed using scanning electron microscope SEM, where the yarn
wrapper ratio was calculated for each yarn as shown in Figure 3.2.
Figure 3.2 30 Tex Viscose yarn longitudinal view under SEM.
According to the ideal yarn structure, the volume of the core fibers can be calculated as a
cylindrical segment from both sides (also called a truncated cylinder). The volume of one
cylindrical section can be obtained by imagining that two sections are fitted together to form a
cylinder of diameter and height [67], Therefore, the wrapper ratio (%) can be obtained.
(3.1)
As shown in Figure 3.2, the longitudinal yarn view under the microscope for 70 yarn section
was captured, then merged to create the whole yarn image. The images were then analyzed
and parameters and were obtained.

14
3.3 Numerical modeling results
3.3.1 Vortex creation
Figure 3.3 shows the velocity vectors for the x-x axial cross-section. The air stream is ejected
from the 4 jet orifices at a speed exceeding 650 m/s. This speed decreases when it reaches the
vortex chamber to become less than 320 m/s. As a result, a swirling airflow is generated in a
thin layer near the vortex chamber wall. This airflow whirls inside the nozzle and move
downstream and finally is expelled from the nozzle outlet. In the twisting passage, a suction
airflow is created and flows into the vortex chamber enabling the drafted fiber strand to enter
the nozzle. It can be noticed also that another airflow is created inside the hollow spindle and
flows from the hollow spindle outlet upstream to the vortex chamber and this can help in
controlling the trailing ends of the spun yarn. Afterward, these two mentioned airflows meet
and become a single airflow. At this stage, the velocity of the airflow reduced to
approximately 80 m/s near the nozzle inlet and 200 m/s near the hollow spindle inlet. Finally,
the vortex is created inside the nozzle.
Figure 3.3 Velocity vectors (m/s) for the x-x axial cross-section (at 0.5 MPa pressure).
As shown in Figure 3.1-a, because of the specific geometry of the Rieter nozzle, the fiber
strand is not sucked uniformly at the nozzle inlet where fibers strand enters the nozzle
inclined to the nozzle axis so a certain number of fibers are separated from the main fiber
strand. These fiber ends are then twisted around the non-rotating yarn core at the entry of the
hollow spindle by the action of the mentioned air vortex [68].

15
3.3.2 Principle of yarn formation
The velocity magnitude is the resultant velocity of three velocity components; the axial
velocity, the tangential velocity, and the radial velocity. Results revealed that the tangential
velocity component has the maximum value, followed by the axial velocity, then the radial
velocity and this is ascribed to a big inclination angle of the jet orifices to nozzle axis (around
60o). The quality of the air jet yarn depends mainly on the wrapping process, i.e. higher
number of wrapper fibers along with tighter and regular wrapping contribute to better yarn
structure. After the wrapping process takes place inside the vortex chamber, the yarn is
formed and drawn through the hollow spindle.
3.3.2.1 Tangential velocity distribution
Figure 3.4-a shows the tangential velocity at different nozzle cross-sections. It can be
remarked that the value of the tangential velocity in the vicinity of the hollow spindle outer
wall is high while the tangential velocity value inside the hollow spindle is low and its
direction is opposite to the former. Because of this difference in value and direction, the hairs
on yarn surface could be embedded into the yarn body or blown away, consequently, yarn
hairiness and tenacity improve. This justifies that the air jet yarn is known for its relatively
low hairiness [69].
Figure 3.4 The tangential velocity; (a) contours (m/s) at different nozzle cross-sections, (b)
distribution curve at section D.
Figure 3.4-b shows the tangential velocity distribution curve at section D. It can be seen that
the tangential velocity increases slowly from the nozzle axis towards outside in both
directions, then a sudden and sharp increase in the tangential velocity takes place near the
edges of the nozzle wall. In the inner region, the core fibers strand is exposed and affected
slightly by this slow airflow, therefore, the core fibers in the final spun yarn have almost no
twist. While the fibers in the periphery of the strand are affected greatly by the high tangential
velocity that forces them to twist.

16
3.3.2.2 Radial velocity distribution
Figure 3.5 shows the radial velocity distributions at section D. The fiber separation process is
more likely in this zone. Results showed that the values of the radial velocity near the nozzle
wall are higher than that in the vicinity of the nozzle axis and this forces the fibers in the
strand periphery to be embedded towards the yarn axis. It is also clear that the values of the
radial velocity are less than the corresponding tangential velocity and its distribution is not
symmetric as the tangential velocity and this is due to the influence of the vortex.
Figure 3.5 The radial velocity distribution at section D.
3.3.2.3 Axial velocity distribution
Figure 3.6 shows the axial velocity for the x-x axial cross-section. Similar to the tangential
velocity distribution, the axial velocity direction inside the hollow spindle is in the opposite
direction of the axial velocity direction outside the hollow spindle. The reverse flow is evident
inside the hollow spindle from its inlet to its outlet.
Figure 3.6 Contours of the axial velocity (m/s) for the x-x axial cross-section.
3.3.3 Effect of nozzle pressure on structure and strength of the air jet yarn
Figure 3.7 shows the contours of the axial velocity distribution at different nozzle pressure. It
can be seen that the intensity of above-mentioned reverse flow in the hollow spindle which
contributes to the vortex creation increases with the increase of the nozzle pressure from 4 to

17
6 bar. When the pressure became 6 bar, it is obvious that the reverse flow reached the nozzle
inlet which obstructs the spinning process because its direction is opposite to the strand
movement direction. Figure 3.8 shows the contours of the tangential velocity distribution at
different nozzle pressure. The fiber separation process takes place in the region near the
nozzle entrance. By increasing nozzle pressure, the tangential velocity in this area increases
gradually which is good for fiber separation and twist. But at high pressure, the tangential
velocity becomes very high and fiber control could be deteriorated as the number of regular
wrapper fiber decreases while the irregular wrapping increases. Also, by increasing the nozzle
pressure to 6 bar, the tangential velocity in the region between the wall of the hollow spindle
and the inner wall of the nozzle increases and its area enlarges. This can lead to turbulence in
this zone, which consequently could affect yarn quality. This trend is also found similar when
MVS nozzle was investigated [11].
Figure 3.7 Contours of the axial velocity distribution (m/s) for the x-x axial cross-section at
different nozzle pressure.
The contours of the static pressure distribution at different nozzle pressure are shown in
Figure 3.9. By increasing the nozzle pressure, the negative pressure in the area in the vicinity
of the vortex chamber outlet increases and its area shifts towards outside, this is beneficial to
the fiber separation process. On the other hand, increasing the nozzle pressure resulted in
increasing the positive air pressure exists in the area between the outlets of the jet orifices
toward the hollow spindle outer wall. This could obstruct the fibers movement influencing
yarn formation process negatively. By combining the results presented in Figure 3.7, Figure
3.8, and Figure 3.9, the optimum yarn strength is anticipated when using a nozzle pressure of
5 bar.

18
Figure 3.8 Contours of the tangential velocity distribution (m/s) for the x-x axial cross-
section at different nozzle pressure.
Figure 3.10 shows the experimental results of the yarn tenacity at different nozzle pressure.
Statistical analyses showed that the differences in yarn tenacity are statically significant at
95% confidence level. It is clear that yarn tenacity increases when nozzle pressure increases
from 4 to 5 bar, then tenacity decreases gradually when it reaches 6 bar.
Figure 3.9 Contours of the static pressure distribution (Pa) for the x-x axial cross-section at
different nozzle pressure.
The structural analyses shown in Table 3.1 revealed that when spinning using nozzle air
pressure of 4, 5 and 6 bar, the corresponding wrapper fiber ratio is 30.7, 32.7 and 29.3%
respectively. The statistical analyses showed that the differences in wrapper ratio are statically
significant at 95% confidence level. However, the coefficient of variation is quite high (24.51-
29.44%). Nevertheless, considering the values of C and D, it can be seen that the coefficient
of variation is less (08.93-19.59%). Therefore, C/D ratio was calculated (it is the ratio
between one wrap width to the pitch at this yarn section). The values of C/D support the
previous results of wrapper ratio where it followed the same trend. When spinning using
nozzle air pressure of 4, 5 and 6 bar, the corresponding C/D ratio is 21.81, 33.33, and 26.94%
respectively.

19
Figure 3.10 Effect of nozzle pressure on 23 Tex yarn tenacity.
The initial increase in air pressure (4 and 5 bar) increases the intensity of the above-mentioned
reverse flow in the hollow spindle which contributes to the vortex creation, the tangential
velocity in the region near the nozzle entrance increases gradually, the negative pressure in
the area in the vicinity of the vortex chamber outlet increases and its area shifts towards
outside. All these factors contribute to fiber separation process and the regular twist.
Consequently, the yarn structure has tight regular wrappings and more wrapped portions
(more wrapper ratio 32.7%).
On the other hand, When the pressure reaches 6 bar, it is obvious that the reverse flow
reached the nozzle inlet which could obstruct the spinning process because its direction is
opposite to the strand movement direction, the tangential velocity becomes very high, the
tangential velocity in the region between the wall of the hollow spindle and the inner wall of
the nozzle increases and its area enlarges. This can lead to turbulence in this zone. All these
factors contribute to less fiber control and obstruction of fibers movement influencing yarn
formation process negatively. Consequently, the yarn structure contains wild fibers, irregular
wrapping, and less wrapped portions (less wrapper ratio 29.3%). By comparing the above-
mentioned results, it can be concluded that the experimental findings agree with the numerical
simulation results.
Table 3.1 Yarn structural parameters at different nozzle pressures.
Nozzle pressure 4 bar 5 bar 6 bar
Average (μm) CV%
Average
(μm) CV%
Average
(μm) CV%
A 175 32.29 105 36.82 168 34.17
B 241.5 31.74 133 36.04 207.9 24.29
C 287 18.12 273 9.16 431.9 16.23
D 1316 13.11 819 8.93 1603 19.59
C/D (%) 21.81 33.33 26.94
Wrapper ratio (%) 30.7 29.39 32.7 29.44 29.3 24.51
10
12
14
16
4 5 6 Yar
n t
enac
ity
(cN
/tex
)
Nozzle pressure (bar)

20
4. Prediction of Air Jet Yarn Strength Based on Statistical
Modeling
In this chapter, some process parameters of Rieter air jet spinning machine, namely, yarn
linear density, nozzle pressure, and delivery speed have been investigated. Along with the
experiment, a statistical model had been established based on multiple regression to study the
combined effect of those parameter on yarn tenacity as well as to predict the air jet yarn
strength.
4.1 Materials and methods
100% Viscose fibers were spun to produce air jet yarns with different counts and machine
parameters. The Box-Behnken factorial experimental design was used to obtain the
combination of yarn count, delivery speed, and nozzle pressure. Table 4.1 shows the chosen
parameters and their levels. It is notable to mention that spinning one sample with the level
coded (-1, 1, 0) was impractical because the end breakage rate was very high which
obstructed the spinning process. A total of 12 yarns were spun then placed in the standard
conditions prior to testing.
The yarn tenacity was tested using Instron 4411. Ordinary least squares regression model was
used to analyze the test results and to obtain the regression equation (4.1).
(4.1)
Where is the dependent variable, are independent variables, is the regression
equation constant, are the linear coefficients, are the interaction
coefficients and are the quadratic coefficients.
4.2 Regression model
Equation (4.2) Indicates the response surface equations for yarn tenacity obtained by using
multiple regression (the squared multiple regression coefficient =95.5%).
Table 4.1 Spun yarn production parameters.
The levels and their codes
Parameters -1 0 1
Yarn count (Tex) 16 23 30
Delivery speed (m/min) 350 400 450
Nozzle Pressure (bar) 4 5 6

21
(4.2)
By using this model, it is possible to predict air jet yarn tenacity based on yarn count ,
yarn delivery speed and nozzle pressure .
4.3 Effect of process parameters on yarn strength
Figure 4.1 shows the influence of linear density, delivery speed and nozzle pressure on yarn
tenacity. It is obvious that the linear density has the maximum effect on yarn tenacity. As
shown in Figure 4.1-a and b, coarser yarns 30 Tex have higher tenacity by about 29% than
finer yarns 16 Tex and this is due to the increase in the number of fibers in yarn cross-section,
thus, the number of core and wrapper fibers in yarn cross section that bear the load exerted on
the yarn. Nevertheless, results shown later in Table 5.3 reveal that wrapper ratio increases
slightly at coarser counts. The same trend also exists for MVS yarn [27]. Increasing the yarn
delivery speed from 350 to 400 m/min results in increasing yarn tenacity, but when using high
delivery speed of 450 m/min a deterioration in yarn tenacity occurs by about 3.5% and this is
a consequent of the insufficient time for the whirling action to take place in the vortex
chamber which could result in an increment of the number of the wild fibers and the regions
of unwrapped core fibers [26]. This effect is more obvious when producing 16 Tex yarn at
400 and 450 m/min where yarn tenacity is very low. Yarn tenacity increases when nozzle
pressure increases from 4 to 5 bar, then decreases gradually when it reaches 6 bar and this is
because the increase in air pressure initially causes tight regular wrappings and more wrapped
portions of the yarn (more wrapper ratio), but higher air pressure creates irregular wrappings
and increases the wild fibers (less wrapper ratio), (elaborate explanation is given in section
3.3.3). The same trend is also confirmed for MVS yarn [27].
(a) (b) (c)
Figure 4.1 Effect of (a) yarn linear density and delivery speed, (b) yarn linear density and
nozzle pressure, and (c) nozzle pressure and yarn delivery speed, on yarn tenacity.

22
5. Prediction of Air Jet Yarn Strength Based on
Mathematical Modeling
In this chapter, a prediction of air jet spun yarn strength at short gauge length has been
presented. Different models have been modified, combined and a new model has been
proposed and validated.
5.1 Model for the failure of the air jet spun yarn
Air jet yarn structure can be divided into the core which is almost parallel fibers and the
wrapper which is in a helical form. In the current model, the core strand strength has been
calculated as a parallel bundle of fibers. This strand is also subjected to the normal forces of
the wrapper fibers. Therefore, the frictional forces applied to the core fibers strand have been
calculated. In addition, the strength of the wrapper fiber strand has been calculated.
It is worth mentioning that the strength of the core fiber strand has been calculated based on
the assumption that the fibers are gripped between two jaws and the gauge length of the yarn
tensile tester is less than fiber length. Consequently, to verify the model, the air jet yarn
strength has been measured at a gauge length shorter than the fiber length. The yarn structure
is assumed to be ideal as shown in Figure 5.1. It is assumed that; wraps width and height are
constant and distributed regularly along the yarn axis, helix angle is constant, and core fibers
are straight and parallel to yarn axis.
Figure 5.1 Simplified model of short staple air jet spun yarn.
5.1.1 Determination of core fiber strength
The strength of the core fiber strand is the summation of the strength of a parallel bundle of
fibers gripped between two jaws of the tensile testing instrument and the strength of that
bundle originated from a fiber-to-fiber frictional force caused by the normal forces from the
wrapper fiber strand during the extension process.
Assuming a short staple spun yarn is gripped between tensile tester jaws with a gauge length
less than fiber length. This yarn is spun using short staple fibers. Assuming that these fibers

23
are straight, parallel to yarn axis, have equal circular diameters, no slippage occurs between
core fibers due to the usage of short gauge length, inter-fiber friction is so small that can be
ignored and individual fiber position in the yarn is random. Therefore, Neckář theory of
parallel fiber bundle can be used to find the strength of this parallel fiber bundle [61]. During
the tensile testing process, and due to the random distribution of fibers in the bundle, some
fibers are gripped between the jaws while some others aren’t. By using the same derivation
steps, it is valid that,
(5.1)
Where is fiber length utilization factor, is the mass fraction function, denotes the
gauge length, is fiber length and is maximum fiber length. Thus, we can deduce the
core fibers strength as a parallel bundle gripped between two jaws using equation (5.1) as
follows,
(5.2)
Where denotes fiber breaking load and denotes wrapper fibers percentage, is yarn
linear density and is fiber linear density. Assuming that the yarn cross-section is circular
and remains circular till break. To obtain the normal forces on core fibers, Krause et al. model
[47] was used and modified. By analyzing the forces acting on an element of a wrapper fiber
as shown in Figure 5.2, and using the same derivation steps,
(5.3)
(5.4)
(5.5)
Where is the average strained wrapper fiber helix angle, is fiber breaking elongation,
expresses yarn longitudinal strain, represents yarn lateral strain, and is the average
unstrained wrapper fiber helix angle. We can then deduce the total frictional forces on core
fibers as a result of the total normal forces exerted by wrappers fiber strand as follows,
(5.6)

24
Where is the fiber friction coefficient, is the average strained pitch of wrapper fibers, is
the average strained yarn radius, and is yarn packing density (assumed constant=0.6 [61]).
Figure 5.2 Force analysis of air jet yarn before and during axial tensile loading (adapted and
reproduced [47]).
5.1.2 Wrapper fiber strength component
Hypothesizing the existence of uniform normal pressure on core fibers due to the wrapping
effect, constant wrapping angle and fibers are breaking simultaneously due to extension at a
gauge length less than fiber length, total wrapper fibers strength can be deduced from
Krause et al. model [47].
(5.7)
Therefore, for a tensile drawing in a short nip gauge, the total tensile strength of air jet yarn is
contributed by the core fiber strength, the wrapper fiber strength and the friction force
between fibers. According to the proposed assumptions in the current model and using
equations (5.2), (5.6) and (5.7), it is possible to obtain yarn strength (cN) as follows,
(5.8)
5.2 Experimental verification
Air jet yarns were spun using different materials and machine parameters as shown in Table
5.1. Fibers strength and fineness were measured using Lenzing Vibrodyn-400 according to
EN ISO1973 [70]. Fiber length distribution was obtained using Sinus instrument according to
ASTM D1447 [71]. SEM analyses were performed to analyze the yarn structure. Yarn
number of wraps per meter, helix angle and parameters and were obtained. Yarn
diameter was measured using Uster tester according to ASTM D1425 [72]. Yarn strength was
measured at short gauge length using Labortech instrument according to ASTM D2256 [73].

25
5.3 Results of the mathematical model
By using the proposed model, it is possible to investigate theoretically the effect of both fibers
and yarn parameters on yarn breaking load as shown in Figure 5.3 and Figure 5.4. Figure 5.3-
a depicts the direct proportionality between fiber strength and yarn strength. It can be seen
from Figure 5.3-b that yarn strength improves significantly with the increase of interfiber
friction coefficient. Because the increase in friction reduces the slippage in the wrapper and
core fibers, hence, increases the number of the wrapper and core fibers that resist loading then
break during the extension process [74]. When spinning air jet yarn using coarser fibers, the
overall number of fibers in yarn cross-section decreases and yarn strength drops significantly.
(a) (b)
Figure 5.3 Influence of fiber (a) breaking load, (b) friction coefficient and fineness, on
predicted yarn breaking load.
Results in Figure 5.4-a show that yarn strength improves by increasing the wrapper ratio as
this increases the total number of wrapper fibers that exert the above-mentioned normal forces
on the core fiber strand causing more frictional forces that resist the tensile load. Generally,
130
230
330
430
530
0 10 20 30 40
Yar
n b
reak
ing
load
(cN
)
Fiber breaking load (cN)
150 250 350 450 550
0 0,1 0,2 0,3 0,4 0,5
Yar
n b
reak
ing
load
(cN
)
Fibre friction coefficient Fibre fineness (Tex)
Table 5.1 Yarn production plan.
Sample
No.
Material
type
Yarn
count
(Tex)
Delivery
speed
(m/min)
Nozzle
pressure
(bar)
1 Viscose 16 350 5
2 Viscose 30 350 5
3 Viscose 30 450 5
4 Viscose 16 400 4
5 Viscose 30 400 4
6 Viscose 16 400 6
7 Viscose 30 400 6
8 Viscose 23 350 4
9 Viscose 23 450 4
10 Viscose 23 350 6
11 Viscose 23 450 6
12 Viscose 23 400 5
13 Viscose 20 400 6
14 Viscose 25 400 6
15 Tencel 23 400 6

26
higher wrapper fiber ratio is desired, but it is mainly limited to the spinning technology.
Results also show that when the yarn gets coarser the breaking load increases.
As shown in Figure 5.4-b, when wraps per meter increase, yarn breaking load increases.
However, unlike ring and rotor yarns, the strength of air jet yarn does not decrease much, but
it levels off at high twist (wraps per meter). This is because approximately 70% of the yarn
structure is untwisted core fibers, this result also agrees with the finding of Krause et al. [47].
(a) (b)
Figure 5.4 Influence of yarn (a) linear density and wrapper ratio, (b) number of wraps per
meter, on predicted yarn breaking load.
The 15 yarn samples theoretical strength was calculated by obtaining the fiber length
distribution, fiber properties, yarn parameters under SEM and using equations (3.1), (5.1),
(5.2), (5.3), (5.4), (5.5), (5.6), (5.7) and (5.8). Fiber parameters, measured yarn parameters
under the microscope along with the predicted and experimental values of yarn strength are
shown in Table 5.2 and Table 5.3.
Table 5.2 Viscose and Tencel fiber properties.
Property Viscose Tencel
Fiber friction coefficient (-) 0.35 0.21
Fiber breaking elongation (%) 19.40 8.10
Fiber fineness (Tex) 0.13 0.13
Fiber breaking load (cN) 3.28 5.20
Fiber length utilization factor (-) 0.199 0.188
Results presented in Table 5.3 show that the proposed model exhibited good agreement with
the experimental results of yarn breaking load where the prediction error varies from (1.62-
16.17%). The higher values of prediction error could be ascribed to the variation (CV%) in the
measured values of wrapper fiber helix angle (CV%=08-31%), the measured values of pitch
(CV%=05-43%) and wrapper fiber ratio (CV%=09-42%).
170
270
370
470
570
0 10 20 30 40 Pre
dic
ted y
arn
bre
akin
g l
oad
(cN
)
Wrapper ratio (%)
Yarn linear density (Tex)
280
300
320
340
360
200 500 800 1100 P
redic
ted y
arn
bre
akin
g l
oad
(cN
) Yarn number of wraps (1/m)

27
Table 5.3 Theoretical and experimental yarn results.
Sam
ple
Act
ual
yar
n c
ou
nt
(Tex
)
Wra
pp
er f
iber
rat
io (
%)
Yar
n d
iam
eter
(m
m)
Av
erag
e un
stra
ined
wra
pp
er f
iber
hel
ix a
ng
le (
rad
)
Av
erag
e un
stra
ined
pit
ch (
mm
)
Yar
n w
rap
s p
er m
eter
Pre
dic
ted
yar
n b
reak
ing
lo
ad (
cN)
Ex
per
imen
tal
yar
n b
reak
ing
load
(cN
)
Pre
dic
tio
n e
rror
(%)
1 15.9 33.36
(19)
0.20 0.45
(23)
1.17
(42)
825 224.41 237.85 5.65
2 15.6 28.82
(42)
0.23 0.40
(31)
1.38
(40)
714 195.42 214.95 9.09
3 16.4 33.25
(18)
0.21 0.45
(19)
1.45
(18)
700 237.64 241.55 1.62
4 22.4 34.3
(21)
0.24 0.55
(13)
1.46
(34)
668 347.37 401.99 13.59
5 22.6 31.82
(27)
0.23 0.53
(18)
1.29
(43)
698 329.07 370.19 11.11
6 22.6 32.85
(28)
0.28 0.51
(22)
1.56
(38)
635 323.97 372.39 13.00
7 22.7 37.01
(20)
0.25 0.54
(16)
1.34
(29)
658 366.74 377.68 2.89
8 22.4 37.74
(15)
0.25 0.55
(15)
1.34
(30)
685 366.83 404.85 9.39
9 29.4 37.14
(18)
0.27 0.59
(17)
1.45
(35)
629 490.97 552.92 11.20
10 29.4 39.42
(9)
0.29 0.61
(18)
1.64
(24)
562 525.39 551.58 4.75
11 29.5 35.96
(18)
0.29 0.62
(19)
1.74
(22)
545 502.52 522.89 3.89
12 29.4 36.4
(21)
0.27 0.64
(10)
1.45
(37)
619 502.49 562.38 10.65
13 20 35.92
(25)
0.23 0.47
(20)
1.05
(15)
692 303.13 361.60 16.17
14 25 37.36
(21)
0.28 0.56
(16)
1.24
(5)
634 404.79 453.21 10.68
15 22.6 34.56
(18)
0.25 0.66
(8)
1.26
(24)
515 566.97 612.53 7.43
* The values in brackets indicate the coefficient of variation (CV%) of the measured parameter.
6. Prediction of Air Jet Yarn Strength at Different Gauge
Lengths Based on Statistical Modeling
In this chapter, step by step derivation of a statistical model that predicts air jet yarn strength
at different gauge length has been presented. The model has been derived by [75] in which,
the yarn strength, as well as its coefficient of variation at different gauge length, are being
calculated. Moreover, the model has been validated by [76].

28
6.1 Yarn strength in relation to gauge length
The current model uses the same assumptions of Peirce model which implies that the
principle of weakest link theory is valid and the probability that one short part of yarn breaks
is independent to the probabilities of breakage of all other short parts, i.e., the probability of
breakage of all short parts is mutually independent. But unlike Peirce model, it is assumed
that the yarn strength (cN) at a short gauge length (mm) follows the Weibull distribution
[75]. Let us assume a yarn is gripped between two jaws as shown in Figure 6.1. And let us
assume that the function is the probability that a yarn of a given length (mm) breaks
by a force and this function is non-decreasing function because if the value of is high,
value becomes high as well.
Figure 6.1 A yarn is gripped between the jaws of a tensile tester.
The probability of non-breaking of the long length can be formulated as follows,
(6.1)
Where, is the cumulative distribution function of yarn strength at gauge length (i.e.
the probability that a yarn with a given (short) gauge length breaks by a force ). Since
is a non-decreasing function ranges from to ,
so, is non-increasing function ranges from to
. In addition, equation (6.1) is a function of only. Thus, let us introduce
the risk function in the way that,
(6.2)
And,
(6.3)
Where , and are constants for a yarn. Then the
cumulative distribution function can be formulated by using equation (6.2) and (6.3),

29
(6.4)
The unit of and is (cN) and the unit of is , consequently, the cumulative
distribution function is a dimensionless unit. Let us assume a parameter of gauge length
where,
(6.5)
Furthermore, the probability density function is the differentiation of the cumulative
distribution function , therefore, by differentiating equation (6.4) in respect to , and
using equation (6.5),
(6.6)
Equation (6.6) characterizes the distribution of random variable by the parameters
and which can be expressed by 3-parameters Weibull distribution. Where represents
location, is shape and is scale. The variable also can be transformed in the way that,
(6.7)
The random variable can be calculated using equation (6.7),
(6.8)
By differentiating equation (6.8),
(6.9)
In Peirce model, the probability density function for the transformed value was obtained
assuming a Gaussian distribution. This distribution can’t fit the data at all cases of gauge
length. On the other hand, the Weibull distribution is one of the most widely used distribution
in survival and life time analyses because of its flexibility and versatility among other
distributions by changing the value of its shape parameter. Therefore, in the present model,
the 3-parameter Weibull distribution was assumed which could be valid at most of the cases,
hence, giving better accuracy [76].
6.1.1 Calculating the mean yarn strength
The mth
non-central statistical moment can be calculated as follows,
(6.10)
By using equations (6.6), (6.7), (6.8), (6.9), and the binomial theorem yields,
30
(6.11)
As Gamma function
, Therefore,
(6.12)
By substituting equation (6.12) in (6.11), the mean value of yarn strength can be obtained,
(6.13)
As , hence,
(6.14)
Based on equation (6.5) and (6.14), the mean yarn strength (cN) can be expressed also as
follows,
(6.15)
6.1.2 Calculating the standard deviation of yarn strength
Assume that is the probability density function of the transferred value , therefore it is
valid that,
(6.16)
Using equations (6.6), (6.7), (6.9) and (6.16), the probability density function can be obtained,
(6.17)
Analogically, the non-central moments of the transferred value is,
(6.18)
From equation (6.12) (6.17) and (6.18),
(6.19)
And the mth
central moment of yarn strength can be calculated using equation (6.8)
and applying the expectation operator of mean value as follows,
(6.20)
By using equation (6.14) and by using the same logic in equation (6.19),
(6.21)
The dispersion , which is the 2nd
central moment of yarn strength can be obtained, and

31
finally, the standard deviation of yarn strength can be calculated,
(6.22)
6.1.3 Calculating the coefficient of variation of yarn strength
Using the values of and from equation (6.14) and (6.22), the coefficient of variation of
yarn strength (%) can be obtained then expressed by parameter using equation (6.5),
(6.23)
6.1.4 Mathematical model validation
100% Tencel fibers of 1.3 dtex and 38 mm were spun to produce 23 Tex ring, rotor and air jet
spun yarns. Instron 4411 was used to measure yarn tensile properties at different gauge
lengths namely, 60, 100, 200, 300, 400, 500, 600 and 700 mm. The structure of rotor and air
jet spun yarns was investigated by analyzing the longitudinal view and the yarn cross-section
of these yarns using optical microscope according to the standard test method [77]. To
validate the model, the values of yarn strength at 300 mm gauge length were obtained and the
Weibull distribution along with its 3-parameters, , and were obtained using the
modified weighed least square estimators method [78]. Then the Weibull distribution was
obtained using the following equation,
(6.24)
Afterward, the parameter was calculated using equation (6.5), then yarn tenacity, and
coefficient of variation of yarn strength, were obtained at each gauge length by using
equation (6.15) and (6.23).
6.2 Results of the model
6.2.1 Yarn strength
To understand the behavior of the probability density function of the linearly transformed
yarn strength as defined according to Peirce model [66], it was calculated at different values
of . It can be seen from Figure 6.2 that the distribution shape changes at different gauge
lengths and it follows the Gaussian distribution approximately only at equal to .

32
Figure 6.2 Probability density function of the linearly transformed yarn strength.
Figure 6.3 shows the histogram and the equivalent 3-parameter Weibull distribution for yarn
tenacity measured at 300 mm gauge length. The values of , and for each yarn were
obtained and used for predicting yarn strength and its coefficient of variation. It is clear that
the Weibull distribution fit well the yarn strength values at 300 mm gauge length. By
observing Figure 6.3-b, it is obvious that the irregular nature and the variability in rotor yarn
structure causes difficulty in obtaining the Weibull distribution accurately.
Figure 6.4 shows the theoretical and experimental values of yarn strength at different gauge
lengths. It is evident that the predicted and experimental strength values are in a good
agreement for all tested spun yarns. It can be observed also that the ring spun yarn tenacity is
the strongest yarn followed by the air jet yarn then rotor yarn.
(a) (b) (c)
Figure 6.3 The probability density function of yarn tenacity at 300 mm gauge length; (a) ring,
(b) rotor, (c) air jet.
The high tenacity of ring spun yarn is attributed to the uniform twist which improves fiber
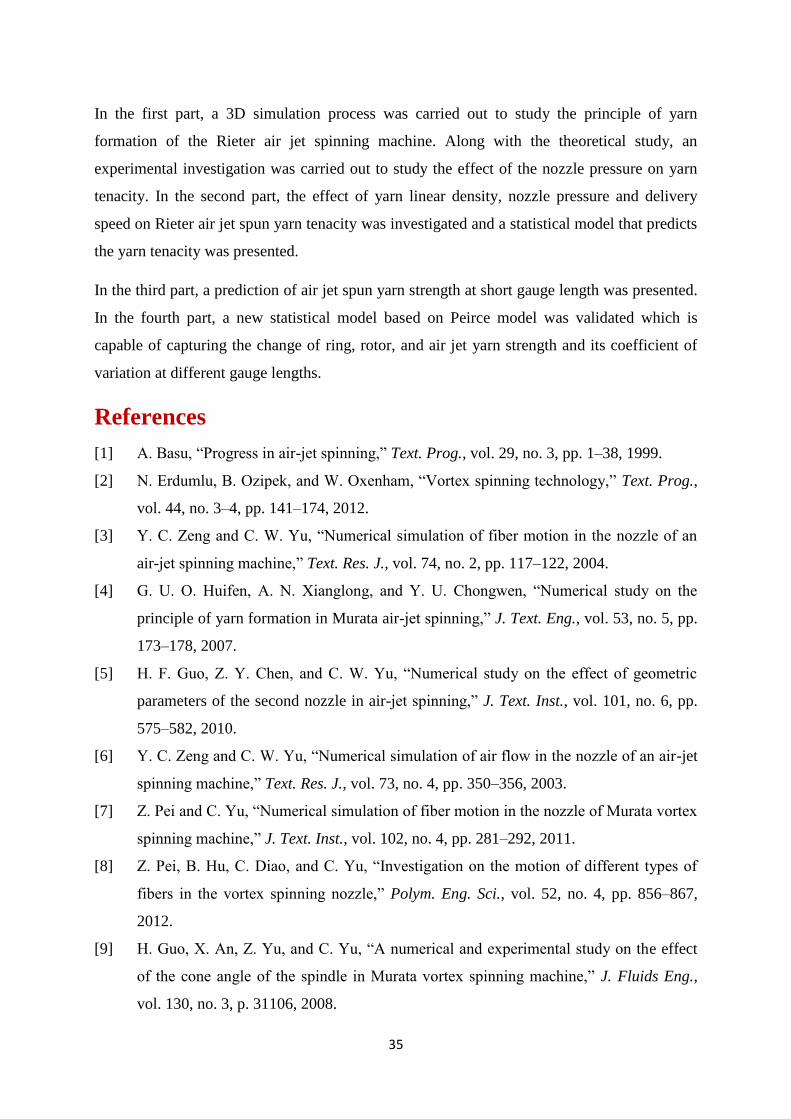
gripping, interlocking and migration characteristics [79]. By comparing both air jet and rotor
yarns longitudinal and cross-sectional view shown in Figure 6.5, and in case of the rotor yarn,
the thin strand of fibers (before twisting) has hooked ends as well as fibers migration is high,
therefore, the fiber length is not fully utilized. In case of the air jet yarn, the structure consists
of two layers – a core bundle without twist, in which fibers are arranged parallel to the yarn
0
0,25
0,5
0,75
1
1,25
-6 -4 -2 0 2 4 6
Pro
bab
ilit
y d
ensi
ty
funct
ion 𝑓
(𝑝,𝑙
)
Transformed value (𝑢)
L/lo=1000
L/lo=30
L/lo=1
L/lo=0.1
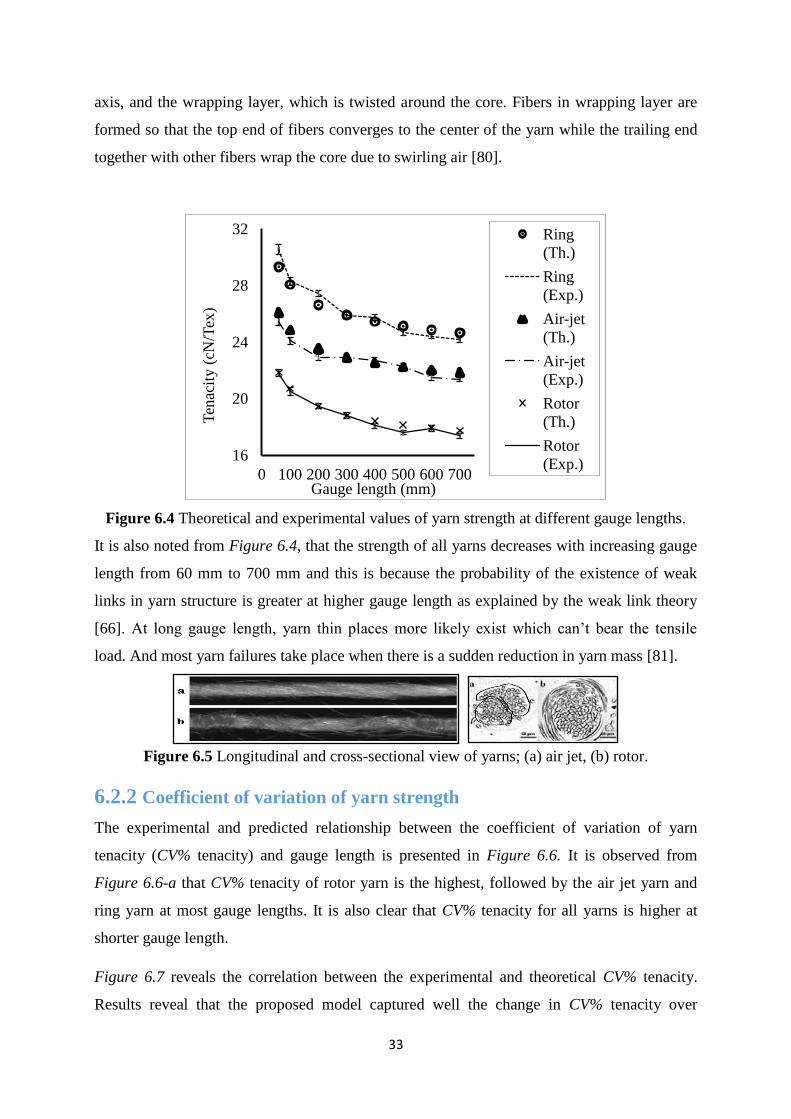
33
axis, and the wrapping layer, which is twisted around the core. Fibers in wrapping layer are
formed so that the top end of fibers converges to the center of the yarn while the trailing end
together with other fibers wrap the core due to swirling air [80].
Figure 6.4 Theoretical and experimental values of yarn strength at different gauge lengths.
It is also noted from Figure 6.4, that the strength of all yarns decreases with increasing gauge
length from 60 mm to 700 mm and this is because the probability of the existence of weak
links in yarn structure is greater at higher gauge length as explained by the weak link theory
[66]. At long gauge length, yarn thin places more likely exist which can’t bear the tensile
load. And most yarn failures take place when there is a sudden reduction in yarn mass [81].
Figure 6.5 Longitudinal and cross-sectional view of yarns; (a) air jet, (b) rotor.
6.2.2 Coefficient of variation of yarn strength
The experimental and predicted relationship between the coefficient of variation of yarn
tenacity (CV% tenacity) and gauge length is presented in Figure 6.6. It is observed from
Figure 6.6-a that CV% tenacity of rotor yarn is the highest, followed by the air jet yarn and
ring yarn at most gauge lengths. It is also clear that CV% tenacity for all yarns is higher at
shorter gauge length.
Figure 6.7 reveals the correlation between the experimental and theoretical CV% tenacity.
Results reveal that the proposed model captured well the change in CV% tenacity over
16
20
24
28
32
0 100 200 300 400 500 600 700
Ten
acit
y (
cN/T
ex)
Gauge length (mm)
Ring
(Th.)
Ring
(Exp.)
Air-jet
(Th.)
Air-jet
(Exp.)
Rotor
(Th.)
Rotor
(Exp.)

34
different gauge lengths for all tested yarns. The R-squared value is the highest in case of air
jet yarn followed by ring spun yarn, then rotor yarn. The low R-squared value of rotor yarns
may be explained by their high experimental values of CV% tenacity (08-11%) as well as the
irregular nature of rotor yarn structure.
(a) (b)
Figure 6.6 Coefficient of variation of yarn strength at different gauge lengths; (a)
experimental, (b) theoretical.
However, generally, the difference between experimental and theoretical values of coefficient
of variation is attributed to the assumption that the probability of breakage of all short yarn
segments is mutually independent. Another model that hypothesizes the dependency of each
segment on the adjacent segments may be developed to obtain more precise results.
(a) (b) (c)
Figure 6.7 Experimental versus calculated results of coefficient of variation of yarn strength
at different gauge lengths; (a) ring, (b) rotor, (c) air jet.
7. Evaluation of results and new findings
This thesis contributed to the knowledge of the air jet yarn formation process, particularly
Rieter air jet spinning technology by investigating the influence of selected technological
parameters of the spinning machine on yarn properties, especially its strength. Furthermore, it
shed light on the problem of the prediction of yarn strength by trying different approaches to
establish models that can be used for prediction of air jet spun yarns strength.
0
3
6
9
12
0 200 400 600
Ten
acit
y C
V(%
)
Gauge length (mm)
Rotor
Ring
Air-jet
0
3
6
9
12
0 200 400 600
Ten
acit
y C
V(%
)
Gauge length (mm)
Rotor Ring Air-jet
y = 1.1x - 0.8
R² = 0.8 4
6
8
10
12
6 8 10
Theo
reti
cal
Experimental
y = 1.3x - 2.1
R² = 0.7 4
6
8
10
12
7 9 11
Theo
reti
cal
Experimental
y = 1.5x - 3.9
R² = 0.9 4
6
8
10
12
6 7 8 9 10
Theo
reti
cal
Experimental
35
In the first part, a 3D simulation process was carried out to study the principle of yarn
formation of the Rieter air jet spinning machine. Along with the theoretical study, an
experimental investigation was carried out to study the effect of the nozzle pressure on yarn
tenacity. In the second part, the effect of yarn linear density, nozzle pressure and delivery
speed on Rieter air jet spun yarn tenacity was investigated and a statistical model that predicts
the yarn tenacity was presented.
In the third part, a prediction of air jet spun yarn strength at short gauge length was presented.
In the fourth part, a new statistical model based on Peirce model was validated which is
capable of capturing the change of ring, rotor, and air jet yarn strength and its coefficient of
variation at different gauge lengths.
References
[1] A. Basu, “Progress in air-jet spinning,” Text. Prog., vol. 29, no. 3, pp. 1–38, 1999.
[2] N. Erdumlu, B. Ozipek, and W. Oxenham, “Vortex spinning technology,” Text. Prog.,
vol. 44, no. 3–4, pp. 141–174, 2012.
[3] Y. C. Zeng and C. W. Yu, “Numerical simulation of fiber motion in the nozzle of an
air-jet spinning machine,” Text. Res. J., vol. 74, no. 2, pp. 117–122, 2004.
[4] G. U. O. Huifen, A. N. Xianglong, and Y. U. Chongwen, “Numerical study on the
principle of yarn formation in Murata air-jet spinning,” J. Text. Eng., vol. 53, no. 5, pp.
173–178, 2007.
[5] H. F. Guo, Z. Y. Chen, and C. W. Yu, “Numerical study on the effect of geometric
parameters of the second nozzle in air-jet spinning,” J. Text. Inst., vol. 101, no. 6, pp.
575–582, 2010.
[6] Y. C. Zeng and C. W. Yu, “Numerical simulation of air flow in the nozzle of an air-jet
spinning machine,” Text. Res. J., vol. 73, no. 4, pp. 350–356, 2003.
[7] Z. Pei and C. Yu, “Numerical simulation of fiber motion in the nozzle of Murata vortex
spinning machine,” J. Text. Inst., vol. 102, no. 4, pp. 281–292, 2011.
[8] Z. Pei, B. Hu, C. Diao, and C. Yu, “Investigation on the motion of different types of
fibers in the vortex spinning nozzle,” Polym. Eng. Sci., vol. 52, no. 4, pp. 856–867,
2012.
[9] H. Guo, X. An, Z. Yu, and C. Yu, “A numerical and experimental study on the effect
of the cone angle of the spindle in Murata vortex spinning machine,” J. Fluids Eng.,
vol. 130, no. 3, p. 31106, 2008.
36
[10] Z. Pei and C. Yu, “Numerical study on the effect of nozzle pressure and yarn delivery
speed on the fiber motion in the nozzle of Murata vortex spinning,” J. Fluids Struct.,
vol. 27, no. 1, pp. 121–133, 2011.
[11] Z. Pei and C. Yu, “Numerical and experimental research on the influence of parameters
on the tensile properties of Murata vortex yarn,” J. Text. Inst., vol. 101, no. 10, pp.
931–940, 2010.
[12] Zeguang Pei and Chongwen Yu, “Prediction of the vortex yarn tenacity from some
process and nozzle parameters based on numerical simulation and artificial neural
network,” Text. Res. J., vol. 81, no. 17, pp. 1796–1807, 2011.
[13] W. Oxenham and A. Basu, “Effect of jet design on the properties of air-jet spun yarns,”
Text. Res. J., vol. 63, no. 11, pp. 674–678, 1993.
[14] Z. Pei and C. Yu, “Investigation on the dynamic behavior of the fiber in the vortex
spinning nozzle and effects of some nozzle structure parameters,” J Eng Fiber Fabr,
vol. 6, pp. 16–29, 2011.
[15] Y. Suzuki and S. Sukigara, “Mechanical and tactile properties of plain knitted fabrics
produced from rayon vortex yarns,” Text. Res. J., vol. 83, no. 7, pp. 740–751, 2012.
[16] N. Erdumlu, B. Ozipek, and W. Oxenham, “The structure and properties of carded
cotton vortex yarns,” Text. Res. J., vol. 82, no. 7, pp. 708–718, 2012.
[17] K. R. Salhotra, S. M. Ishtiaque, and A. Kumar, “Analysis of spinning process using the
Taguchi method, part I: effect of spinning process variables on fibre orientation and
tenacities of sliver and roving,” J. Text. Inst., vol. 97, no. 4, pp. 271–284, 2006.
[18] S. M. Ishtiaque, K. R. Salhotra, and A. Kumar, “Analysis of spinning process using the
Taguchi method, part II: effect of spinning process variables on fibre extent and fibre
overlap in ring, rotor and air-jet yarns,” J. Text. Inst., vol. 97, no. 4, pp. 285–294, 2006.
[19] A. Kumar, S. M. Ishtiaque, and K. R. Salhotra, “Analysis of spinning process using the
Taguchi method, part III: effect of spinning process variables on migration parameters
of ring, rotor and air-jet yarn,” J. Text. Inst., vol. 97, no. 5, pp. 377–384, 2006.
[20] a. Kumar, S. M. Ishtiaque, and K. R. Salhotra, “Analysis of spinning process using the
Taguchi method, part IV: effect of spinning process variables on tensile properties of
ring, rotor and air-jet yarns,” J. Text. Inst., vol. 97, no. 5, pp. 385–390, 2006.
[21] A. Kumar, K. R. Salhotra, and S. M. Ishtiaque, “Analysis of spinning process using the
Taguchi method, part V: effect of spinning process variables on physical properties of
ring, rotor and air-jet yarns,” J. Text. Inst., vol. 97, no. 6, pp. 463–473, 2006.
[22] N. Erdumlu and B. Ozipek, “Effect of the draft ratio on the properties of vortex spun

37
yarn,” Fibres Text. East. Eur., vol. 80, no. 3, pp. 38–42, 2010.
[23] G. Basal, “Effects of some process parameters on the structure and properties of vortex
spun yarn,” Text. Res. J., vol. 76, no. 6, pp. 492–499, 2006.
[24] S. Gordon, “The effect of short fibre and nep levels on Murata vortex spinning
efficiency and product quality,” Final Rep. To CanC, CSIRO Text. Fibre Technol., no.
October, pp. 1–14, 2001.
[25] D. Sharma, “Performance and low-stress characteristics of polyester-cotton MVS
yarns,” Indian J. Fibre Text. Res., vol. 29, no. September, pp. 301–307, 2004.
[26] G. K. Tyagi, D. Sharma, and K. R. Salhotra, “Process-structure-property relationship of
polyester-cotton MVS yarns, part I: influence of processing variables on yarn structural
parameters,” Indian J. Fibre Text. Res., vol. 29, no. 4, pp. 419–428, 2004.
[27] G. K. Tyagi, D. Sharma, and K. R. Salhotra, “Process-structure-property relationship of
polyester-cotton MVS yarns: part II: influence of process variables on yarn
characteristics,” Indian J. Fibre Text. Res., vol. 29, no. 4, p. 429, 2004.
[28] R. J. Chasmawala, S. M. Hansen, and S. Jayaraman, “Structure and properties of air-jet
spun yarns,” Text. Res. J., vol. 60, no. 2, pp. 61–69, 1990.
[29] A. Ghosh, S. Ishtiaque, S. Rengasamy, P. Mal, and A. Patnaik, “Predictive models for
strength of spun yarns: an overview,” AUTEX Res. J., vol. 5, no. 1, pp. 20–29, 2005.
[30] E. Onder and G. Baser, “A comprehensive stress and breakage analysis of staple fiber
yarns, part I: stress analysis of a staple yarn based on a yarn geometry of conical helix
fiber paths,” Text. Res. J., vol. 66, no. 10, pp. 634–640, 1996.
[31] W. Zurek, I. Frydrych, and S. Zakrzewksi, “A method of predicting the strength and
breaking strain of cotton yarn,” Text. Res. J., vol. 57, no. 8, pp. 439–444, 1987.
[32] P. Ning, “Development of a constitutive theory for short fiber yarns, part II: mechanics
of staple yarn with slippage effect,” Text. Res. J., vol. 63, no. 9, pp. 504–514, 1993.
[33] S. K. Aggarwal, “A model to estimate the breaking elongation of high twist ring spun
cotton yarns, part I: derivation of the model for yarns from single cotton varieties,”
Text. Res. J., vol. 59, no. 11, pp. 691–695, 1989.
[34] I. Frydrych, “A new approach for predicting strength properties of yarn,” Text. Res. J.,
vol. 62, no. 6, pp. 340–348, 1992.
[35] A. Guha, R. Chattopadhyay, and Jayadeva, “Predicting yarn tenacity: a comparison of
mechanistic, statistical, and neural network models,” J. Text. Inst., vol. 92, no. 2, pp.
139–145, 2001.
[36] N. Pan, “Development of a constitutive theory for short fiber yarns: mechanics of

38
staple yarn without slippage effect,” Text. Res. J., vol. 62, no. 12, pp. 749–765, 1992.
[37] N. Pan, T. Hua, and Y. Qiu, “Prediction of statistical strengths of twisted fibre
structures,” Text. Res. J., vol. 28, no. 11, pp. 960–964, 2001.
[38] N. Pan, T. Hua, and Y. Qiu, “Relationship between fiber and yarn strength,” Text. Res.
J., vol. 71, no. 11, pp. 960–964, 2001.
[39] P. K. Majumdar and A. Majumdar, “Predicting the breaking elongation of ring spun
cotton yarns using mathematical, statistical, and artificial neural network models,”
Text. Res. J., vol. 74, no. 7, pp. 652–655, 2004.
[40] C. C. Chu, C. L. Cummings, and N. A. Teixeira, “Mechanics of elastic performance of
textile materials, part V: a study of the factors affecting the drape of fabrics-the
development of a drape meter,” Text. Res. J., vol. 20, no. 8, pp. 539–548, 1950.
[41] I. Frydrych, “Relation of single fiber and bundle strengths of cotton,” Text. Res. J., vol.
65, no. 9, pp. 513–521, 1995.
[42] J. F. Bogdan, “The characterization of spinning quality,” Text. Res. J., vol. 26, no. 9,
pp. 720–730, 1956.
[43] X. Y. Jiang, J. L. Hu, and R. Postle, “A new tensile model for rotor spun yarns,” Text.
Res. J., vol. 72, no. 10, pp. 892–898, 2002.
[44] B. Neckář and D. Das, “Tensile behavior of staple fiber yarns, part I: theoretical
models,” J. Text. Inst., vol. 108, no. 6, pp. 922–930, 2017.
[45] M. Zubair, M. Eldeeb, and B. Neckar, “Tensile behavior of staple fiber yarns, part III:
comparison of mathematical models,” J. Text. Inst., vol. 108, no. 7, pp. 1234–1237,
2017.
[46] G. A. B. Muhammad Zubair, Bohuslav Neckar, Moaz Eldeeb, “Tensile behavior of
staple fiber yarns, part IV: experimental verification of predicted stress–strain curves,”
J. Text. Inst., vol. 108, no. 8, pp. 1291–1296, 2017.
[47] H. W. Krause and H. a. Soliman, “Theoretical study of the strength of single jet false
twist spun yarns,” Text. Res. J., vol. 60, no. 6, pp. 309–318, 1990.
[48] Y. Xie, W. Oxenham, and P. Grosberg, “25—A study of the strength of wrapped yarns,
part II: computation and experimental,” J. Text. Inst., vol. 77, no. 5, pp. 305–313, 1986.
[49] Y. C. Zeng, Y.-Q. Wan, C. W. Yu, and J.-H. He, “Controlling the air vortex twist in
air-jet spinning,” Text. Res. J., vol. 75, no. 2, pp. 175–177, 2005.
[50] A. Ghosh, S. M. Ishtiaque, and R. S. Rengasamy, “Analysis of spun yarn failure, part
II: the translation of strength from fiber bundle to different spun yarns,” Text. Res. J.,
vol. 75, no. 10, pp. 741–744, 2005.

39
[51] R. Rajamanickam, S. M. Hansen, and S. Jayaraman, “Analysis of the modeling
methodologies for predicting the strength of air-jet spun yarns,” Text. Res. J., vol. 67,
no. 1, pp. 39–44, 1997.
[52] R. Rajamanickam, S. M. Hansen, and S. Jayaraman, “A model for the tensile fracture
behavior of air-jet spun yarns,” Text. Res. J., vol. 68, no. 9, pp. 654–662, 1998.
[53] A. Ghosh, S. M. Ishtiaque, R. S. Rengasamy, P. Mal, and A. Patnaik, “Spun yarn
strength as a function of gauge length and extension rate: a critical review,” Text
Apparel, Technol Manag., vol. 4, no. 2, pp. 1–13, 2004.
[54] A. Ghosh, S. M. Ishtiaque, and R. S. Rengasamy, “Stress–strain characteristics of
different spun yarns as a function of strain rate and gauge length,” J. Text. Inst., vol.
96, no. 2, pp. 99–104, 2005.
[55] S. K. Punj, A. Mukhopadhyay, and A. Chakraborty, “Effect of extension rate and
gauge length on tensile behaviour of ring and air-jet spun yarns,” Indian J. Fibre Text.
Res., vol. 23, pp. 19–24, 1998.
[56] G. F. S. Hussain, R. P. Nachane, K. R. Krishna Iyer, and B. Srinathan, “Weak-link
effect on tensile properties of cotton yarns,” Text. Res. J., vol. 60, no. 2, pp. 69–77,
1990.
[57] W. Oxenham, R. Y. Zhu, and G. A. V Leaf, “Observations on the tensile properties of
friction-spun yarns,” J. Text. Inst., vol. 83, pp. 621–623, 1992.
[58] a. Ghosh, “Analysis of spun yarn failure, part I: tensile failure of yarns as a function of
structure and testing parameters,” Text. Res. J., vol. 75, no. 10, pp. 731–740, 2005.
[59] M. H. Seo, M. L. Realff, N. Pan, M. Boyce, P. Schwartz, and S. Backer, “Mechanical
properties of fabric woven from yarns produced by different spinning technologies:
yarn failure in woven fabric,” Text. Res. J., vol. 63, no. 3, pp. 123–134, 1993.
[60] B. W. Rosen, “Mechanics of composite materials. recent advances, Pergamon Press,
Oxford,” p. 105, 1983.
[61] B. Neckar and D. Das, “A stochastic approach to yarn strength,” in Seventh Asian
Textile Conference, 2003.
[62] W. Zurek, L. Malinowski, and E. Plotka, “Analytical technological method of
prediction of strength and breaking strain of cotton yarn,” Tech. Univ. Lodz, vol. 33,
pp. 62–73, 1976.
[63] J. N. Grant and O. W. Morlier, “Relation of specific strength of cotton fibers to fiber
length and testing method,” Text. Res. J., vol. 18, no. 8, pp. 481–487, 1948.
[64] K. P. R. Pillay, “Seventh Tech. Conf.,” in ATIRA, BTRA, and SITRA, 1965, pp. 15–30.
40
[65] D. F. J. Kapadia, “.,” vol. 26, pp. T142–T266, 1935.
[66] F. T. Peirce, “Tensile tests for cotton yarns - the weakest link, theorems on the strength
of long and of composite specimens,” J. Text. Inst. Trans., vol. 17, no. 7, pp. T355–
T368, 1926.
[67] J. W. Harris and H. Stocker, “Maximum likelihood method,” Handb. Math. Comput.
Sci., vol. 1, p. 824, 1998.
[68] M. Eldeeb and E. Moučková, “Numerical simulation of the yarn formation process in
Rieter air jet spinning,” J. Text. Inst., vol. 108, no. 7, pp. 1219–1226, 2017.
[69] M. Li, C. Yu, and S. Shang, “A numerical and experimental study on the effect of the
orifice angle of vortex tube in vortex spinning machine,” J. Text. Inst., vol. 104, no. 12,
pp. 1303–1311, 2013.
[70] “ISO 1973:1995, Textile fibres, determination of linear density, gravimetric method
and vibroscope method,” 1995.
[71] “ASTM D 1447, Standard test method for length and length uniformity of cotton fibers
by photoelectric measurement,” 2012.
[72] “ASTM D1425, Standard test method for evenness of textile strands using capacitance
testing equipment,” 2009.
[73] “ASTM D2256 - 10(2015), Standard test method for tensile properties of yarns by the
single-strand method,” 2015.
[74] R. Rajamanickam, S. M. Hansen, and S. Jayaraman, “A computer simulation approach
for engineering air-jet spun yarns,” Text. Res. J., vol. 67, no. 3, pp. 223–230, 1997.
[75] Neckar B. and Das D., Theory of structure and mechanics of yarns, Manuscript of the
book. Technical University of Liberec, 2016.
[76] M. Eldeeb and B. Neckář, “Prediction of spun yarn strength at different gage lengths,”
J. Text. Inst., pp. 1–6, 2017.
[77] “Recommended procedure for preparation of samples. Soft and hard sections (slices).
Internal standard no. 46-108-01/01, Faculty of Textile, Technical University of
Liberec,” 2004.
[78] K. E. Ahmad, “Modified weighted least-squares estimators for the three-parameter
Weibull distribution,” Appl. Math. Lett., vol. 7, no. 5, pp. 53–56, 1994.
[79] Y. Huh, Y. R. Kim, and W. Oxenham, “Analyzing structural and physical properties of
ring, rotor, and friction spun yarns,” Text. Res. J., vol. 72, no. 2, p. 156, 2002.
[80] “Murata Machinery Ltd. Vortex yarn guide book, Retrieved 08 24, 2005, Web site:
http://www.muratec-vortex.com,” 2005.
41
[81] S. K. Sinha and P. Kumar, “An investigation of the behavior of thin places in ring spun
yarns,” J. Text. Apparel, Technol. Manag., vol. 8, no. 2, 2013.
Publications
Published articles
1. Eldeeb M., Ismael Rakha, Fawkia Fahim, and Eman Elshahat, "Comparative study
between plied "conventional and compact" spun yarns characteristics", Mansoura Engineering
Journal, 2010, Vol. 35(2).
2. Eldeeb M., Sayed Ibrahim, Ismael Rakha, Fawkia Fahim, and Eman Elshahat, “Effect of
finishing process on plied compact and conventional ring spun yarn properties”, Vlakna a
Textila, 2015, Vol. 22(1), 5-8. ISSN 1335-0617.
3. Eldeeb M., Ismael Rakha, Fawkia Fahim, and Eman Elshahat. "Optimizing the production
process of conventional ring spun and compact plied yarns", Journal of Textile & Apparel,
2016, Vol. 26(1), 48-54.
4. Eldeeb M., and Eva Moučková. "Numerical simulation of the yarn formation process in
Rieter air jet spinning", The Journal of The Textile Institute, 2017, Vol. 108(7), 1219-1226.
5. Eldeeb M. and Bohuslav Neckář, “Prediction of spun yarn strength at different gauge
lengths”, The Journal of the Textile Institute, 2017, Vol. 0(0), 1-6.
6. Eldeeb M., Eva Moučková, and Petr Ursíny, “Properties of Viscose Rieter air jet spun
plied yarns”, Indian Journal of Fiber & Textile Research, 2015, accepted.
7. Muhammad Zubair, Eldeeb M., and Bohuslav Neckar, "Tensile behavior of staple fiber
yarns, part III: comparison of mathematical models", The Journal of the Textile Institute,
2017, Vol. 108(7), 1234-1237.
8. Zuhaib Ahmed, Eldeeb M., Shoaib Iqbal, and Adnan Mazari, “Cover factor of airjet and
rotor fabrics by light transmission”, Industria Textila, 2017, accepted.
9. Zuhaib Ahmad, Brigita Kolčavová Sirková, and Eldeeb M. “Yarn cross-sectional
deformation in woven fabric”, Vlakna a Textil, 2016, Vol. 23(4), 36-41. ISSN 1335-0617.
10. Muhammad Zubair, Bohuslav Neckar, Eldeeb M., and Gulzar A. “Tensile behavior of
staple fiber yarns, part IV: experimental verification of predicted stress–strain curves”, The
Journal of the Textile Institute, 2016, Vol. 108(8), 1291-1296.
11. Hafiz Shahzad Maqsood, Jakub Wiener, Vijaykumar Baheti, Eldeeb M., and Jiri Militky.
“Ozonation: a green source for oxidized cotton”, FIBERS & TEXTILES in Eastern
Europe 2016, Vol. 24(1), 19-21.

42
Conferences and workshops
1. Eldeeb M., Sayed Ibrahim, Ismael Rakha, Fawkia Fahim, and Eman Elshahat, “Effect of
finishing process on plied compact and conventional ring spun yarn properties”, 20th
Conference STRUTEX (proceedings), Liberec: Technical University in Liberec, 2014. Not
paged 4 pages. ISBN 978-80-7494-139-9.
2. Eldeeb M., Sayed Ibrahim, Ismael Rakha, Fawkia Fahim, and Eman Elshahat,
“Comparative study on finished compact and conventional ring spun yarn properties”, 4th
International Conference of Applied Arts (proceedings). Damietta: Damietta University,
2015, not paged 11 pages.
3. Eldeeb M., "Theoretical analyses of air jet yarn strength”, 21st Conference STRUTEX
(proceedings), Liberec: Technical University in Liberec, 2016, 131-136 ISBN 978-80-7494-
269-3.
4. Eldeeb M., Eva Moučková, and Petr Ursíny, "Effect of plying process parameters on air jet
spun yarn properties”, Světlanka Workshop (Proceedings), Rokytnice Nad Jizerou: Světlanka,
2015, 37-42. ISBN 978-80-7494-229-7
5. Eldeeb M., “Air Jet yarn properties based on structure”, a presentation at the Bílá Voda
Workshop, Harrachov, 20th
- 23rd
September, 2016.
6. Zuhaib Ahmad, Brigita Kolčavová Sirková, and Eldeeb M., “Influence of weft setting on
shape of yarn cross-section in woven fabrics”, Světlanka Workshop (Proceedings), Rokytnice
Nad Jizerou: Světlanka, 2015, 08-14. ISBN 978-80-7494-229-7.
Quotation
As on 26.05.2017
Article: Hafiz Shahzad Maqsood, Jakub Wiener, Vijaykumar Baheti, Eldeeb M., and Jiri
Militky. “Ozonation: a Green Source for Oxidized Cotton”, FIBRES & TEXTILES in Eastern
Europe 2016, Vol. 24(1), 19-21.
Cited in: Maqsood, H. S., Bashir, U., Wiener, J., Puchalski, M., Sztajnowski, S., & Militky, J.
Ozone treatment of jute fibers. Cellulose, 1-11.
43
Curriculum Vitae
Personal information
Name Moaaz Eldeeb
Address 5 Elmotaz Bellah St,
Mansoura, Egypt
Phone +420 776 714 456
E-mail [email protected]
Nationality Egyptian
Marital status Married
Date of birth 23.11.1983
Work Experience
Textile Technology Department, Faculty of
Textile Engineering, Technical University of
Liberec, Liberec, Czech Republic.
PhD scholar 2013-2017
Textile Technology Department, Faculty of
Engineering, Mansoura University, Mansoura,
Egypt.
Teacher 2011-2013
Teaching assistant 2009-2011
K.C.G Textile Egypt S.A.E Company for
home textiles, El Asher men Ramadan, Egypt. Quality assurance supervisor 2008-2009
Oriental Weavers Company for carpets, El
Asher men Ramadan, Egypt.
Maintenance and production
Engineer 2006-2008
El Gazar Company for ready-made garments,
Mansoura, Egypt. Planning Engineer 2005-2006
Academic Profile and Fellowship Period
Mansoura University, Mansoura, Egypt
Textile Engineering
Department, Faculty of
Engineering
MSc
Degree,
Awarded
2011
Küçükçalık company for home textiles, İnegöl,
Turkey Quality control Training 2008
Mansoura University, Mansoura, Egypt
Textile Engineering
Department, Faculty of
Engineering
BSc
Degree,
Very Good
with honor
(First of
class)
2005
Masr Company for spinning and weaving, El
Mahala El Kobra, Egypt. Maintenance Training 2004
El Nasr Company for spinning, weaving and
dying, El Mahala El Kobra, Egypt Production Training 2003
44
Brief Description of the Current Expertise, Research, and
Scientific Activities
Doctoral Studies: Full-time student at the Faculty of Textile Engineering,
Department of Textile Technology, Specialization: Textile
Technics and Material Engineering
Exams: Heat and Mass Transfer in Porous Media KHT/D17, 21.02.2014
Textiles Projection KMI/D20, 13.03.2014
Structural Theory of Fibrous Assemblies KTT/D11, 02.06.2014
Numerical Methods KAP/D40, 09.12.2014
Experimental Technique of the Textile DFT/D33, 13.02.2017
State Doctoral Examination: Completed on 16.05.2017 with the overall result passed.
Research projects:
1. Eldeeb M. (leader), Shoaib Iqbal, and Zuhaib Ahmed, A project entitled, “Effect of plying
process on air jet yarn properties”, supported by “Student Grant Competition 2015”,
Technical University of Liberec, Czech Republic, project no. 21086.
2. Zuhaib Ahmed, Eldeeb M. (member), and Shoaib Iqbal, A project entitled, “3D
construction and structure of woven fabric”, supported by “Student Grant Competition 2015”,
Technical University of Liberec, Czech Republic, project no. 21153.
45
Record of the state exam

46
Recommendation of the supervisor

47

48
Opponent’s reviews
49

50

51
52