air quality analysis for lead - missouri … quality analysis for lead to determine if an area...
TRANSCRIPT
Air Quality Analysis for Lead
To determine if an area surrounding a monitor complies with the national ambient air quality standard (NAAQS) for lead, EPA and the Missouri Department of Natural Resources look at the average of three months of data. Does that average exceed the standard? The lead standard has been 0.15 micrograms per cubic meter (μg/m3) since 2008, when EPA tightened the standard by a factor of ten. The standard had been 1.5 micrograms per cubic meter.
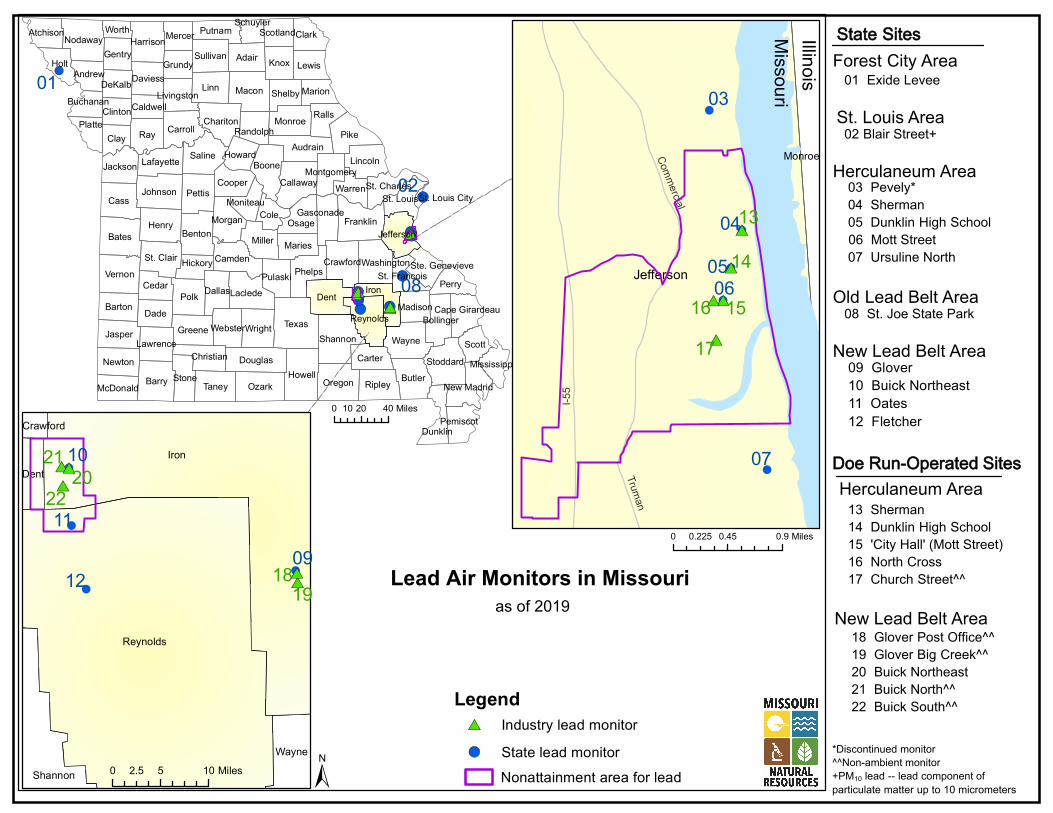
Also in 2008, EPA required states to operate source-oriented monitors, particularly near sources with one ton or more of annual lead emissions. Two years later, EPA strengthened the mandate, requiring states to operate monitors near sources annually emitting a half ton or more of lead. Today, the state of Missouri operates 10 lead monitoring stations near sources of lead emissions and one lead monitoring site in St. Louis. In addition, the department provides oversight and quality assurance for 10 lead monitoring sites operated by the Doe Run Co. The following map indicates these sites.
The following table lists three-month average concentrations for airborne lead during the last 12 months. The data become part of EPA's Air Quality System database. Yellow highlighting draws attention to concentrations that exceeded the standard. In the past, data exceeded the lead standard near Doe Run's primary lead smelter in Herculaneum, which closed in 2013; near the Buick secondary smelter; and near the Forest City secondary smelter. Data from Glover and from Herculaneum after closure of that facility also exceeded the standard; however, those upswings resulted from demolition at the facilities. By modifying its demolition procedure, Doe Run reduced the ambient air concentration of lead.
Since 2014, one only air monitoring station near the Buick and Herculaneum facilities has produced data exceeding the standard. Both Doe Run and the state operate lead air monitors near these facilities. The department's Air Pollution Control Program continues to work with Doe Run to help it come into compliance at all locations.
For more information about lead, see the following EPA website, which includes links to
additional information on health effects, standards, implementation and other information:
epa.gov/lead-air-pollution
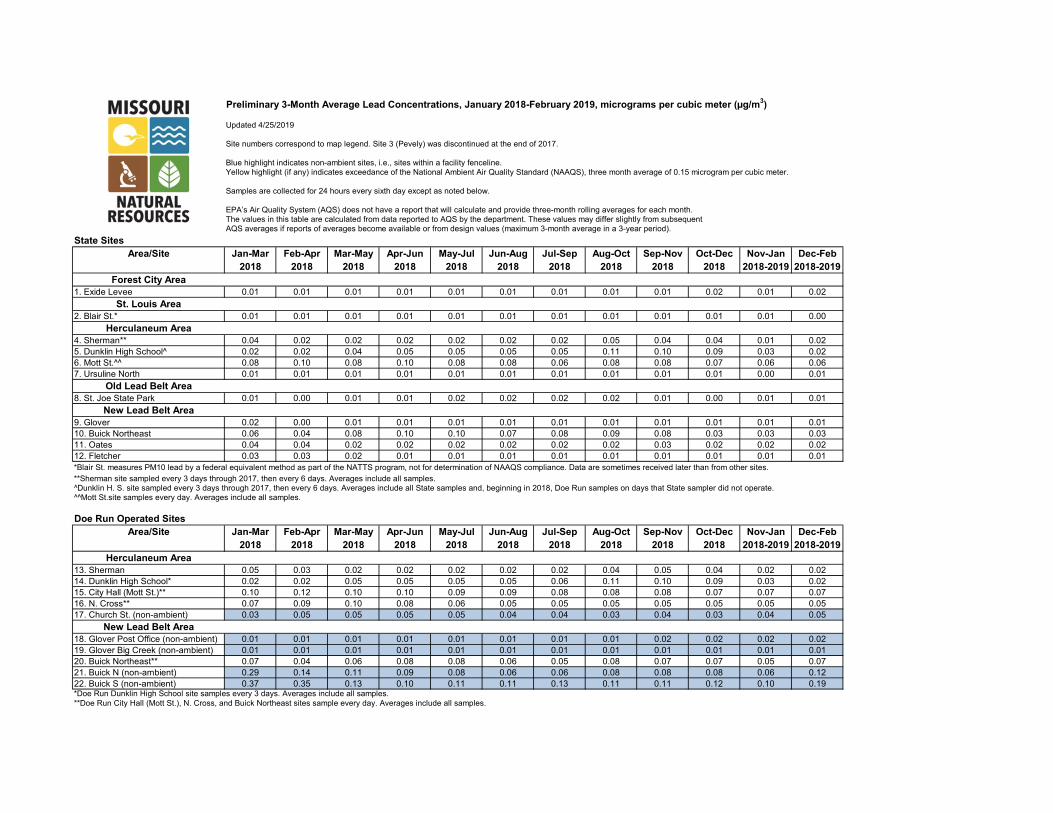
Preliminary 3-Month Average Lead Concentrations, January 2018-February 2019, micrograms per cubic meter (µg/m3)
Updated 4/25/2019
Site numbers correspond to map legend. Site 3 (Pevely) was discontinued at the end of 2017.
Blue highlight indicates non-ambient sites, i.e., sites within a facility fenceline.Yellow highlight (if any) indicates exceedance of the National Ambient Air Quality Standard (NAAQS), three month average of 0.15 microgram per cubic meter.
Samples are collected for 24 hours every sixth day except as noted below.
EPA’s Air Quality System (AQS) does not have a report that will calculate and provide three-month rolling averages for each month.The values in this table are calculated from data reported to AQS by the department. These values may differ slightly from subsequentAQS averages if reports of averages become available or from design values (maximum 3-month average in a 3-year period).
State SitesArea/Site Jan-Mar Feb-Apr Mar-May Apr-Jun May-Jul Jun-Aug Jul-Sep Aug-Oct Sep-Nov Oct-Dec Nov-Jan Dec-Feb
2018 2018 2018 2018 2018 2018 2018 2018 2018 2018 2018-2019 2018-2019Forest City Area
1. Exide Levee 0.01 0.01 0.01 0.01 0.01 0.01 0.01 0.01 0.01 0.02 0.01 0.02St. Louis Area
2. Blair St.* 0.01 0.01 0.01 0.01 0.01 0.01 0.01 0.01 0.01 0.01 0.01 0.00Herculaneum Area
4. Sherman** 0.04 0.02 0.02 0.02 0.02 0.02 0.02 0.05 0.04 0.04 0.01 0.025. Dunklin High School^ 0.02 0.02 0.04 0.05 0.05 0.05 0.05 0.11 0.10 0.09 0.03 0.026. Mott St.^^ 0.08 0.10 0.08 0.10 0.08 0.08 0.06 0.08 0.08 0.07 0.06 0.067. Ursuline North 0.01 0.01 0.01 0.01 0.01 0.01 0.01 0.01 0.01 0.01 0.00 0.01
Old Lead Belt Area8. St. Joe State Park 0.01 0.00 0.01 0.01 0.02 0.02 0.02 0.02 0.01 0.00 0.01 0.01
New Lead Belt Area9. Glover 0.02 0.00 0.01 0.01 0.01 0.01 0.01 0.01 0.01 0.01 0.01 0.0110. Buick Northeast 0.06 0.04 0.08 0.10 0.10 0.07 0.08 0.09 0.08 0.03 0.03 0.0311. Oates 0.04 0.04 0.02 0.02 0.02 0.02 0.02 0.02 0.03 0.02 0.02 0.0212. Fletcher 0.03 0.03 0.02 0.01 0.01 0.01 0.01 0.01 0.01 0.01 0.01 0.01*Blair St. measures PM10 lead by a federal equivalent method as part of the NATTS program, not for determination of NAAQS compliance. Data are sometimes received later than from other sites.**Sherman site sampled every 3 days through 2017, then every 6 days. Averages include all samples.^Dunklin H. S. site sampled every 3 days through 2017, then every 6 days. Averages include all State samples and, beginning in 2018, Doe Run samples on days that State sampler did not operate.^^Mott St.site samples every day. Averages include all samples.
Doe Run Operated SitesArea/Site Jan-Mar Feb-Apr Mar-May Apr-Jun May-Jul Jun-Aug Jul-Sep Aug-Oct Sep-Nov Oct-Dec Nov-Jan Dec-Feb
2018 2018 2018 2018 2018 2018 2018 2018 2018 2018 2018-2019 2018-2019Herculaneum Area
13. Sherman 0.05 0.03 0.02 0.02 0.02 0.02 0.02 0.04 0.05 0.04 0.02 0.0214. Dunklin High School* 0.02 0.02 0.05 0.05 0.05 0.05 0.06 0.11 0.10 0.09 0.03 0.0215. City Hall (Mott St.)** 0.10 0.12 0.10 0.10 0.09 0.09 0.08 0.08 0.08 0.07 0.07 0.0716. N. Cross** 0.07 0.09 0.10 0.08 0.06 0.05 0.05 0.05 0.05 0.05 0.05 0.0517. Church St. (non-ambient) 0.03 0.05 0.05 0.05 0.05 0.04 0.04 0.03 0.04 0.03 0.04 0.05
New Lead Belt Area18. Glover Post Office (non-ambient) 0.01 0.01 0.01 0.01 0.01 0.01 0.01 0.01 0.02 0.02 0.02 0.0219. Glover Big Creek (non-ambient) 0.01 0.01 0.01 0.01 0.01 0.01 0.01 0.01 0.01 0.01 0.01 0.0120. Buick Northeast** 0.07 0.04 0.06 0.08 0.08 0.06 0.05 0.08 0.07 0.07 0.05 0.0721. Buick N (non-ambient) 0.29 0.14 0.11 0.09 0.08 0.06 0.06 0.08 0.08 0.08 0.06 0.1222. Buick S (non-ambient) 0.37 0.35 0.13 0.10 0.11 0.11 0.13 0.11 0.11 0.12 0.10 0.19*Doe Run Dunklin High School site samples every 3 days. Averages include all samples.**Doe Run City Hall (Mott St.), N. Cross, and Buick Northeast sites sample every day. Averages include all samples.
±
0 20 4010 Miles
Nonattainment area for lead
!(
!(!(!(
!(!(!(
!(!(
!(!(
#*
#*#*#*#*
#*#*#*#*
#*
!(
Texas
Dent
Pike
Barry
Polk
Linn
Bates
Ray
Iron
Howell
Cass
Ozark
Saline
Henry
Pettis
Macon
Butler
Franklin
Vernon
Holt
Wayne
Taney
Shannon
Miller
Oregon
Boone
Adair
Wright
Benton
Carroll
Ripley
Douglas
Knox
Phelps
Johnson
Laclede
Clark
Ralls
Dade
Nodaway
Jasper
Stoddard
Osage
Clay
Lincoln
Chariton
Barton
Lewis
Greene
Perry
Audrain
St. Clair
Monroe
Cole
Scott
Camden
Newton Carter
Sullivan
Cedar
Maries
CooperJackson
Platte
Shelby
Lafayette
Putnam
Marion
Warren
Hickory
Worth
Callaway
Stone
Reynolds
Dallas
Harrison
Morgan
CrawfordPulaski
Gentry
Daviess
Webster
Dunklin
Jefferson
Bollinger
Mercer
Washington
Christian
Atchison
Lawrence
Howard
DeKalb
St. Louis
Grundy
Clinton
Madison
Andrew
New Madrid
Pemiscot
McDonald
St. Charles
Livingston
Randolph
Scotland
Caldwell
GasconadeMoniteau
Montgomery
Mississippi
Buchanan
St. Francois
Cape Girardeau
Schuyler
Ste. Genevieve
St. Louis City
0 0.45 0.90.225 Miles
State SitesForest City Area
01 Exide Levee
St. Louis Area 02 Blair Street+
Herculaneum Area 03 Pevely* 04 Sherman 05 Dunklin High School 06 Mott Street 07 Ursuline North
Old Lead Belt Area 08 St. Joe State Park
New Lead Belt Area 09 Glover 10 Buick Northeast 11 Oates 12 Fletcher
Doe Run-Operated SitesHerculaneum Area 13 Sherman 14 Dunklin High School 15 'City Hall' (Mott Street) 16 North Cross 17 Church Street^^
New Lead Belt Area 18 Glover Post Office^^ 19 Glover Big Creek^^ 20 Buick Northeast 21 Buick North^^ 22 Buick South^^
*Discontinued monitor^^Non-ambient monitor+PM10 lead -- lead component ofparticulate matter up to 10 micrometers
!
!
!
!
!
!
!
!
!
!
#*
#*
#*
#*
#*
#*
#*
#*
#*
#*
Monroe
I-55
Commercial
Truman
Jefferson 0504
03
07
061516
14
17
Illinois01
08
0 5 102.5 Miles
Missouri
!
!!!
!
!
!
!
!
!#*#*
#*#*
#*Iron
Reynolds
ShannonWayne
Dent
Crawford
120919
18
212211
2010
13
0 5 102.5 Miles
02
Legend#* Industry lead monitor!( State lead monitor
Lead Air Monitors in Missourias of 2019