air quality conformity analysis report - · pdf file21.05.2016 · air quality...
TRANSCRIPT

Air Quality Conformity Analysis Report Johnstown Area Transportation Study (JATS) 20175 TIP and 2040 LRTP
NAAQS Addressed: Cambria County Portion of Maintenance Area
- 1997 Annual PM2.5
- 2006 24-Hour PM2.5
Prepared by:
JATS and Pennsylvania Department of Transportation
Public Review: May 21, 2016 through June 22, 2016
Public Meeting: June 9, 2016
MPO Approval: June 22, 2016
May 2016 (DRAFT)


JATS: Transportation Conformity Analysis
2017 TIP and 2040 LRTP
Air Quality Conformity Report Page |i
Table of Contents
Overview ................................................................................................................................................... 1
Background on Transportation Conformity .......................................................................................... 1
Report Contents .................................................................................................................................... 2
National Ambient Air Quality Standard Designations ............................................................................... 2
Final Particulate Matter ........................................................................................................................ 2
Ozone .................................................................................................................................................... 3
Interagency Consultation .......................................................................................................................... 4
Analysis Methodology and Data ............................................................................................................... 5
Key MOVES Input Data ......................................................................................................................... 7
Analysis Process Details ...................................................................................................................... 13
Conformity Analysis Results .................................................................................................................... 19
Conformity Determination ...................................................................................................................... 21
Resources ................................................................................................................................................ 23
Highway Vehicle Emissions Analysis Glossary ........................................................................................ 24
Table of Exhibits
Exhibit 1: Summary of Attachments ............................................................................................................. 2
Exhibit 2: Local Data Inputs Used for Conformity Runs ................................................................................ 6
Exhibit 3: Emission Calculation Process ........................................................................................................ 7
Exhibit 4: MOVES Source Types and HPMS Vehicle Groups ....................................................................... 10
Exhibit 5: PPSUITE Speed/Emission Estimation Procedure......................................................................... 15
Exhibit 6: Emission Factor vs. Speed Variances (VOC, NOx, and PM2.5) ...................................................... 16
Exhibit 7: MOVES Run Specification File Parameter Settings ..................................................................... 18
Exhibit 8: Annual PM2.5 Motor Vehicle Emission Budgets ........................................................................... 19
Exhibit 9: Transportation Conformity Analysis Years.................................................................................. 20
Exhibit 10: ANNUAL PM2.5 EMISSION ANALYSIS RESULTS AND CONFORMITY TEST ............................................. 21
Summary of Attachments
Attachment A: Project List
Attachment B: Detailed Emission Results
Attachment C: Sample MOVES Input Files


JATS: Transportation Conformity Analysis
2017 TIP and 2040 LRTP
Air Quality Conformity Report Page |1
Overview
This report provides an analysis of the air quality implications of the current Johnstown Area
Transportation Study (JATS) 2017-2020 Transportation Improvement Program (TIP) and 2040 Long
Range Transportation Plan (LRTP). The analysis demonstrates transportation conformity under the 1997
annual fine particulate (PM2.5) and 2006 24-hour PM2.5 National Ambient Air Quality Standards (NAAQS).
The air quality conformity analysis reflects an assessment of the regionally significant, non-exempt
transportation projects included in both the TIP and the LRTP for Cambria County.
This document replaces the previously approved conformity demonstration of the TIP and LRTP, and
ensures that the findings meet all current criteria established by the U.S. Environmental Protection
Agency (EPA) for the applicable NAAQS. A new conformity determination has been completed to
provide a regional forecast of emissions based on planned air quality significant projects and the latest
available planning assumptions.
Background on Transportation Conformity
Transportation conformity is a way to ensure that federal funding and approval are awarded to
transportation activities that are consistent with air quality goals. Under the Clean Air Act (CAA),
transportation and air quality modeling procedures must be coordinated to ensure that the TIP and the
LRTP are consistent with the area’s applicable State Implementation Plan (SIP). The SIP is a federally
approved and enforceable plan by which each area identifies how it will attain and/or maintain the
health-related primary and welfare-related secondary NAAQS.
In order to receive transportation funding and approvals from the Federal Highway Administration
(FHWA) or the Federal Transit Administration (FTA), state and local transportation agencies must
demonstrate that the plans, programs, or projects meet the transportation conformity requirements of
the CAA as set forth in the transportation conformity rule. Under the transportation conformity rule,
transportation plans are expected to conform to the applicable SIP in nonattainment or maintenance
areas. The integration of transportation and air quality planning is intended to ensure that
transportation plans, programs, and projects will not:
• Cause or contribute to any new violation of any applicable NAAQS.
• Increase the frequency or severity of any existing violation of any applicable NAAQS.
• Delay timely attainment of any applicable NAAQS, any required interim emissions reductions, or
other NAAQS milestones.
The transportation conformity determination includes an assessment of future highway emissions for
defined analysis years, including the end year of the LRTP. Emissions are estimated using the latest
available planning assumptions and available analytical tools, including EPA’s latest approved on-
highway mobile sources emissions model, the Motor Vehicle Emission Simulator (MOVES). The
conformity determination provides a tabulation of the analysis results for applicable precursor
pollutants, showing that the required conformity test was met for each analysis year.
JATS: Transportation Conformity Analysis
2017 TIP and 2040 LRTP
Page |2 Air Quality Conformity Report
Report Contents
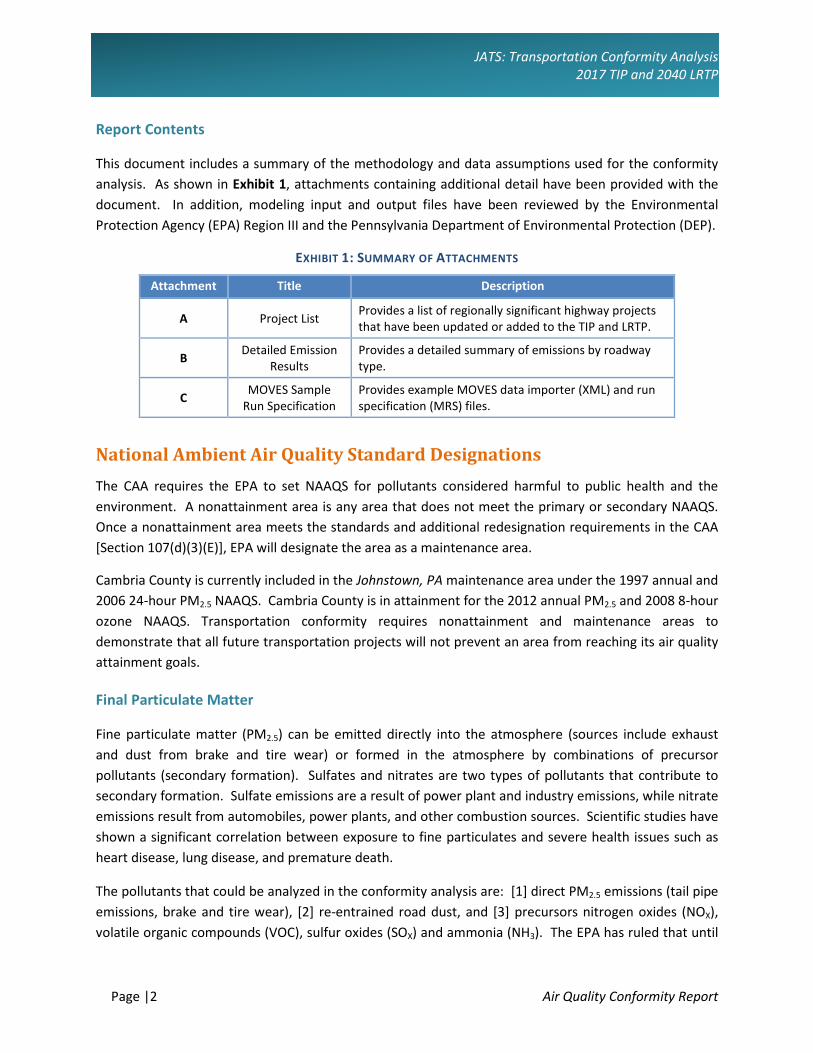
This document includes a summary of the methodology and data assumptions used for the conformity
analysis. As shown in Exhibit 1, attachments containing additional detail have been provided with the
document. In addition, modeling input and output files have been reviewed by the Environmental
Protection Agency (EPA) Region III and the Pennsylvania Department of Environmental Protection (DEP).
EXHIBIT 1: SUMMARY OF ATTACHMENTS
Attachment Title Description
A Project List Provides a list of regionally significant highway projects
that have been updated or added to the TIP and LRTP.
B Detailed Emission
Results
Provides a detailed summary of emissions by roadway
type.
C MOVES Sample
Run Specification
Provides example MOVES data importer (XML) and run
specification (MRS) files.
National Ambient Air Quality Standard Designations
The CAA requires the EPA to set NAAQS for pollutants considered harmful to public health and the
environment. A nonattainment area is any area that does not meet the primary or secondary NAAQS.
Once a nonattainment area meets the standards and additional redesignation requirements in the CAA
[Section 107(d)(3)(E)], EPA will designate the area as a maintenance area.
Cambria County is currently included in the Johnstown, PA maintenance area under the 1997 annual and
2006 24-hour PM2.5 NAAQS. Cambria County is in attainment for the 2012 annual PM2.5 and 2008 8-hour
ozone NAAQS. Transportation conformity requires nonattainment and maintenance areas to
demonstrate that all future transportation projects will not prevent an area from reaching its air quality
attainment goals.
Final Particulate Matter
Fine particulate matter (PM2.5) can be emitted directly into the atmosphere (sources include exhaust
and dust from brake and tire wear) or formed in the atmosphere by combinations of precursor
pollutants (secondary formation). Sulfates and nitrates are two types of pollutants that contribute to
secondary formation. Sulfate emissions are a result of power plant and industry emissions, while nitrate
emissions result from automobiles, power plants, and other combustion sources. Scientific studies have
shown a significant correlation between exposure to fine particulates and severe health issues such as
heart disease, lung disease, and premature death.
The pollutants that could be analyzed in the conformity analysis are: [1] direct PM2.5 emissions (tail pipe
emissions, brake and tire wear), [2] re-entrained road dust, and [3] precursors nitrogen oxides (NOX),
volatile organic compounds (VOC), sulfur oxides (SOX) and ammonia (NH3). The EPA has ruled that until
JATS: Transportation Conformity Analysis
2017 TIP and 2040 LRTP
Air Quality Conformity Report Page |3
the EPA or DEP find that other precursor pollutants are significant contributors, and a SIP revision is
approved stating such findings, direct PM2.5 emissions and NOx are the only pollutants that must be
analyzed for transportation conformity (40 CFR 93.119(f)(8)–(10)).
1997 Annual PM2.5 and 2006 24-hour PM2.5 Standards
The EPA published the 1997 annual PM2.5 NAAQS on July 18, 1997, (62 FR 38652), with an effective date
of September 16, 1997. An area is in nonattainment of this standard if the 3 year average of the annual
mean PM2.5 concentrations (for designated monitoring sites within an area) exceed 15.0 micrograms per
cubic meter (µg/m3). Cambria County was designated as part of the Johnstown nonattainment area
under the 1997 annual PM2.5 NAAQS, effective April 5, 2005 (70 FR 944).
The EPA published the 2006 24-hour PM2.5 NAAQS on October 17, 2006, (71 FR 61144), with an effective
date of December 18, 2006. The rulemaking strengthened the 1997 24-hour standard of 65 µg/m3 (62
FR 38652) to 35 µg/m3 and retained the 1997 annual PM2.5 NAAQS of 15 µg/m
3. An area is in
nonattainment of the 2006 24-hour PM2.5 NAAQS if the 98th
percentile of the annual 24-hour
concentrations, averaged over three years, is greater than 35 µg/m3. Cambria County was designated as
a nonattainment area as part of the Johnstown nonattainment area under the 2006 24-hour PM2.5
NAAQS, effective December 14, 2009 (74 FR 58688).
A redesignation request and maintenance plan applicable to both the 1997 annual and 2006 24-hour
PM2.5 NAAQS was approved by EPA and effective July 16, 2015 (80 FR 42046). The maintenance plan
includes 2017 and 2025 PM2.5 and NOx mobile vehicle emission budgets (MVEBs) for transportation
conformity purposes.
2012 Annual PM2.5 Standard
The EPA published the 2012 annual PM2.5 NAAQS on January 15, 2013, (78 FR 3086), with an effective
date of March 18, 2013. The EPA revised the annual PM2.5 NAAQS by strengthening the standard from
15 µg/m3 to 12 µg/m
3. An area is in nonattainment of this standard if the 3 year average of the annual
mean PM2.5 concentrations for designated monitoring sites in an area is greater than 12.0 µg/m3. On
December 18, 2014, EPA issued final designations for the standard that were revised on April 7, 2015 (80
FR 18535). Cambria County was designated in attainment of the standard.
Ozone
Ozone is formed by chemical reactions occurring under specific atmospheric conditions. Precursor
pollutants that contribute to the formation of ozone include VOC and NOX, both of which are
components of vehicle exhaust. VOCs may also be produced through the evaporation of vehicle fuel, as
well as by displacement of vapors in the gas tank during refueling. By controlling VOC and NOX
emissions, ozone formation can be mitigated.

JATS: Transportation Conformity Analysis
2017 TIP and 2040 LRTP
Page |4 Air Quality Conformity Report
1997 and 2008 8-hour Ozone NAAQS
The EPA published the 1997 8-hour ozone NAAQS on July, 18, 1997, (62 FR 38856), with an effective
date of September 16, 1997. An area was in nonattainment of the 1997 8-hour ozone NAAQS if the 3-
year average of the individual fourth highest air quality monitor readings, averaged over 8 hours
throughout the day, exceeded the NAAQS of 0.08 parts per million (ppm). On May 21, 2013, the EPA
published a rule revoking the 1997 8-hour ozone NAAQS, for the purposes of transportation conformity,
effective one year after the effective date of the 2008 8-hour ozone NAAQS area designations (77 FR
30160). As of July 20, 2013, Cambria County no longer needs to demonstrate conformity to the 1997 8-
hour ozone NAAQS. However, future SIP revisions must address EPA’s anti-backsliding requirements.
The EPA published the 2008 8-hour Ozone NAAQS on March 27, 2008, (73 FR 16436), with an effective
date of May 27, 2008. EPA revised the ozone NAAQS by strengthening the standard to 0.075 ppm.
Thus, an area is in nonattainment of the 2008 8-hour ozone NAAQS if the 3-year average of the
individual fourth highest air quality monitor readings, averaged over 8 hours throughout the day,
exceeds the NAAQS of 0.075 ppm. Cambria County was designated as an attainment area under the
2008 8-hour ozone NAAQS, effective July 20, 2012 (77 FR 30088). As a result, transportation conformity
is not required for the standard.
2015 8-hour Ozone NAAQS
In October 2015, based on its review of the air quality criteria for ozone and related photochemical
oxidants, the EPA revised the primary and secondary NAAQS for ozone to provide requisite protection of
public health and welfare, respectively (80 FR 65292). The EPA revised the levels of both standards to
0.070 ppm, and retained their indicators, forms (fourth-highest daily maximum, averaged across three
consecutive years) and averaging times (eight hours). Area designations under this NAAQS are not
expected until October 2017. Transportation conformity would be required within 12 months for any
areas designated nonattainment under the standard.
Interagency Consultation
As required by the federal transportation conformity rule, the conformity process includes a significant
level of cooperative interaction among federal, state, and local agencies. For this air quality conformity
analysis, interagency consultation was conducted as required by the Pennsylvania Conformity SIP. This
included conference call(s) or meeting(s) of the Pennsylvania Transportation-Air Quality Work Group
(including the Pennsylvania Department of Transportation (PennDOT), DEP, EPA, FHWA, FTA and
representatives from larger MPOs within the state).
Meeting and conference calls where conducted on September 30, 2015; December 16, 2015 and March
16, 2016 to review all input planning assumptions, methodologies and analysis years.

JATS: Transportation Conformity Analysis
2017 TIP and 2040 LRTP
Air Quality Conformity Report Page |5
Analysis Methodology and Data
This transportation conformity analysis was conducted using EPA’s MOVES model. MOVES is an upgrade
to EPA’s modeling tools and replaced MOBILE6.2 as the official model for estimating emissions from
highway vehicles for SIP emission inventories and transportation conformity (75 FR 9411), effective
March 2, 2010. MOVES2014 has been used for this conformity determination and is the latest approved
model version for SIP and transportation conformity purposes (79 FR 60343).
Planning assumptions are updated following EPA and FHWA joint guidance (EPA420-B-08-901) that
clarifies the implementation of the latest planning assumption requirements in 40 CFR 92.110. This
analysis utilizes the latest available traffic, vehicle fleet and environmental data to estimate regional
highway emissions. Pennsylvania updates state-level planning assumptions on a 3-year cycle and this
information is integrated into the conformity analyses.
The analysis methodology and data inputs for this analysis were developed through interagency
consultation and used available EPA guidance documents that included:
• Policy Guidance on the Use of MOVES2014 for State Implementation Plan Development,
Transportation Conformity, and Other Purposes, US EPA Office of Air and Radiation, EPA-
420-B-14-008, July 2014.
• MOVES2014 and MOVES2014a Technical Guidance: Using MOVES to Prepare Emission
Inventories in State Implementation Plans and Transportation Conformity. US EPA Office
of Air and Radiation, and Office of Transportation and Air Quality, EPA-420-B-15-093,
November 2015.
• Motor Vehicle Emission Simulator (MOVES) – User Guide for MOVES2014, US EPA Office
of Transportation and Air Quality, EPA-420-B-14-055; July 2014.
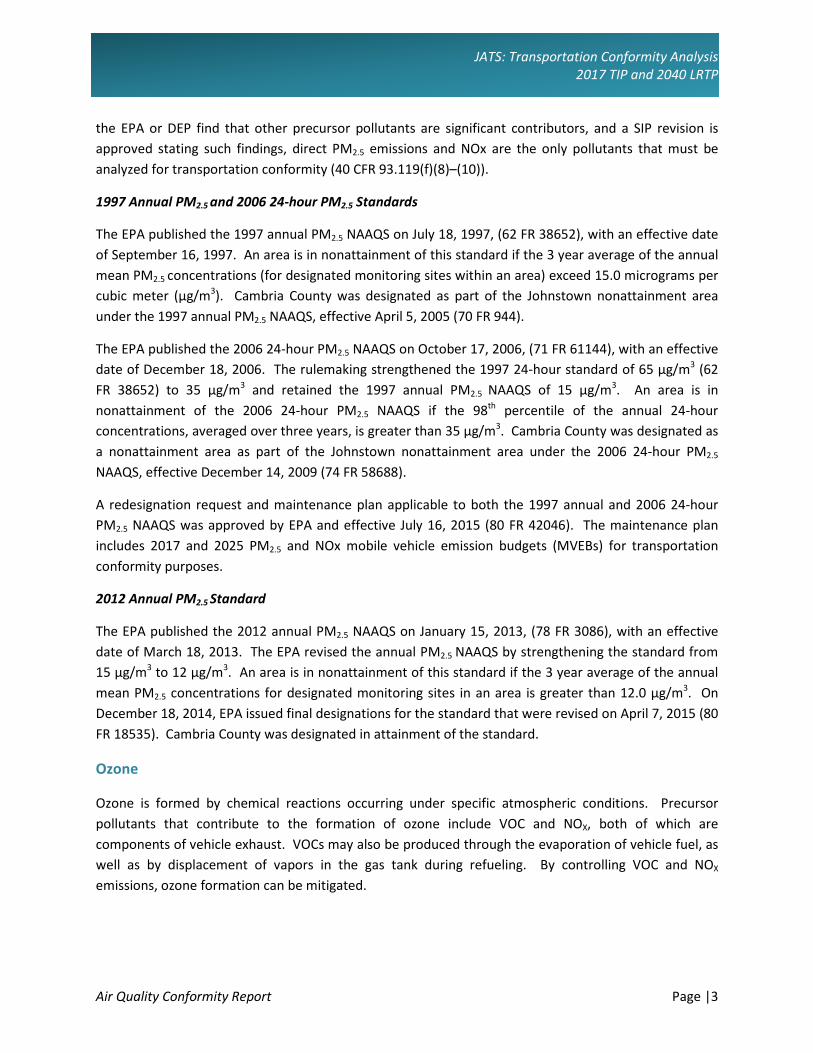
A mix of local and national default (internal to MOVES) data are used in the analysis. As illustrated in
Exhibit 2, local data has been used for data items that have a significant impact on emissions, including:
vehicle miles of travel (VMT), vehicle population, congested speeds, and vehicle type mix, as well as
environmental and fuel assumptions. Local data inputs to the analysis process reflect the latest
available planning assumptions using information obtained from PennDOT, DEP and other local/national
sources.
The methodology used for this analysis is consistent with the methodology used to develop SIP
inventories. This includes the use of custom post-processing software (PPSUITE) to calculate hourly
speeds and prepare key traffic input files to the MOVES emission model. PPSUITE consists of a set of
programs that perform the following functions:
• Analyzes highway operating conditions.
• Calculates highway speeds.
• Compiles VMT and vehicle type mix data.
• Prepares MOVES runs and processes MOVES outputs.
JATS: Transportation Conformity Analysis
2017 TIP and 2040 LRTP
Page |6 Air Quality Conformity Report
EXHIBIT 2: LOCAL DATA INPUTS USED FOR CONFORMITY RUNS
PPSUITE is a widely used and accepted tool for estimating speeds and processing emissions rates. The
PPSUITE tool has been used for developing on-highway mobile source inventories in SIP revisions,
control strategy analyses, and conformity analyses in other states. The software was developed to
utilize accepted transportation engineering methodologies. The PPSUITE process is integral to
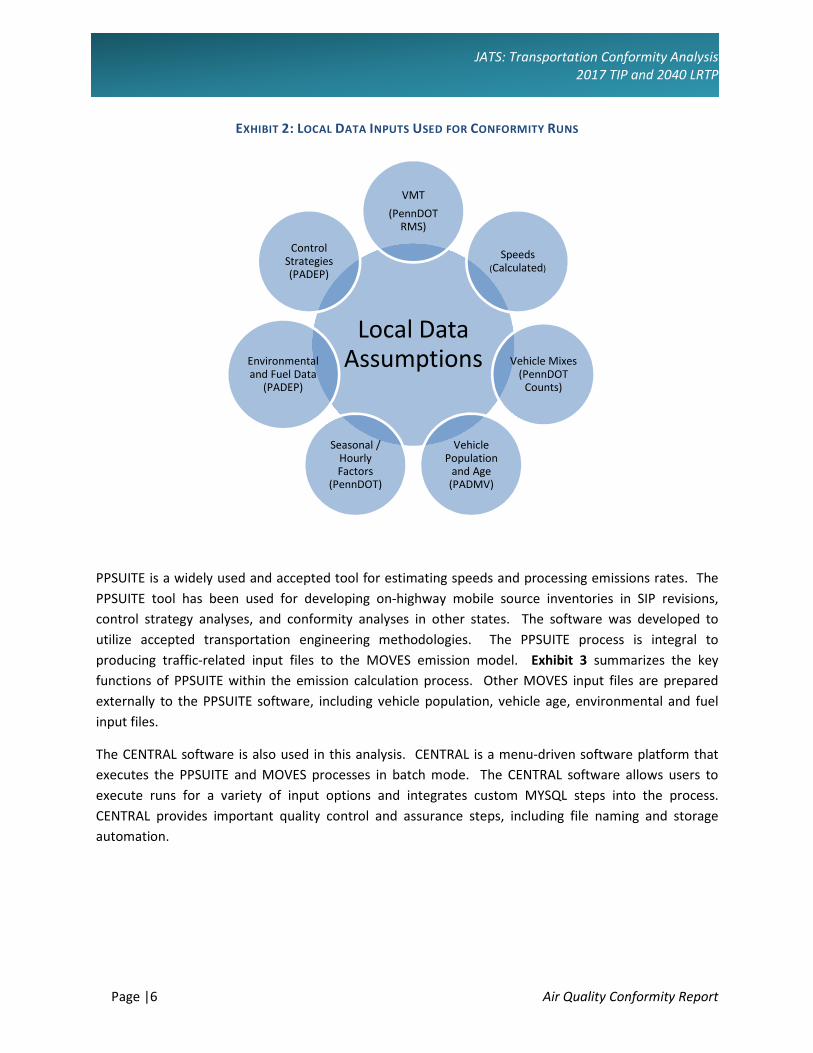
producing traffic-related input files to the MOVES emission model. Exhibit 3 summarizes the key
functions of PPSUITE within the emission calculation process. Other MOVES input files are prepared
externally to the PPSUITE software, including vehicle population, vehicle age, environmental and fuel
input files.
The CENTRAL software is also used in this analysis. CENTRAL is a menu-driven software platform that
executes the PPSUITE and MOVES processes in batch mode. The CENTRAL software allows users to
execute runs for a variety of input options and integrates custom MYSQL steps into the process.
CENTRAL provides important quality control and assurance steps, including file naming and storage
automation.
Local Data Assumptions
VMT
(PennDOT RMS)
Speeds (Calculated)
Vehicle Mixes (PennDOT
Counts)
Vehicle Population
and Age (PADMV)
Seasonal / Hourly Factors
(PennDOT)
Environmental and Fuel Data
(PADEP)
Control Strategies (PADEP)
JATS: Transportation Conformity Analysis
2017 TIP and 2040 LRTP
Air Quality Conformity Report Page |7
EXHIBIT 3: EMISSION CALCULATION PROCESS
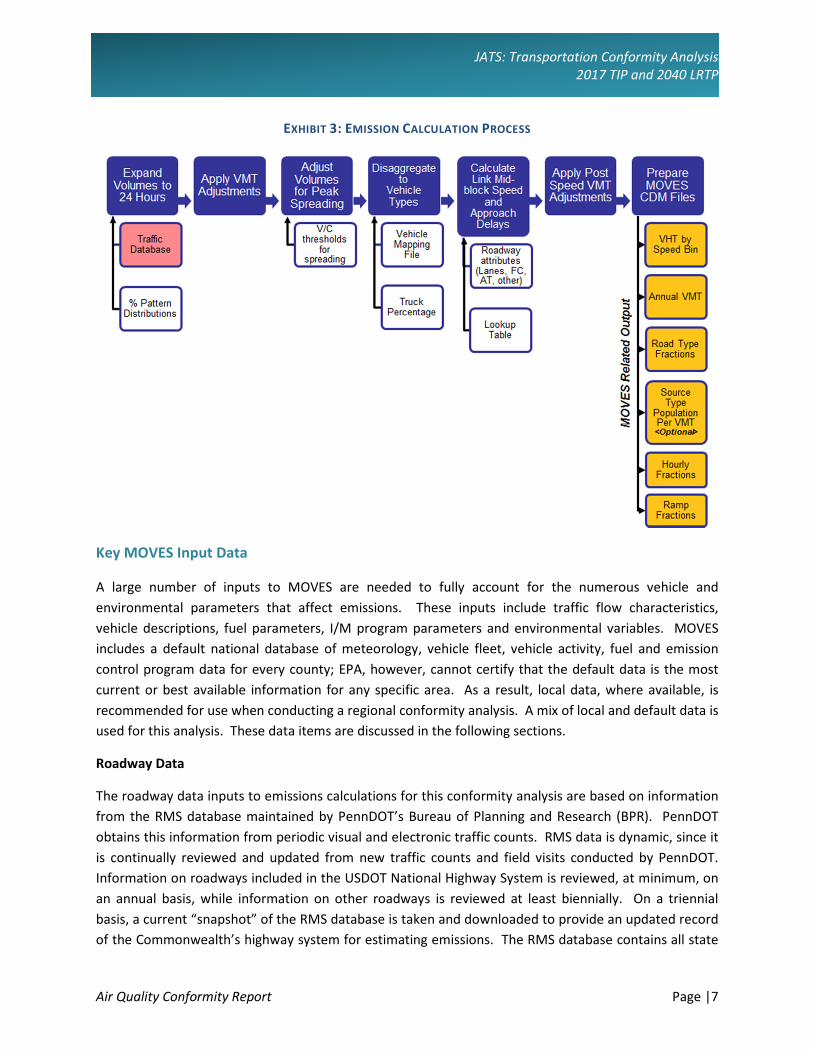
Key MOVES Input Data
A large number of inputs to MOVES are needed to fully account for the numerous vehicle and
environmental parameters that affect emissions. These inputs include traffic flow characteristics,
vehicle descriptions, fuel parameters, I/M program parameters and environmental variables. MOVES
includes a default national database of meteorology, vehicle fleet, vehicle activity, fuel and emission
control program data for every county; EPA, however, cannot certify that the default data is the most
current or best available information for any specific area. As a result, local data, where available, is
recommended for use when conducting a regional conformity analysis. A mix of local and default data is
used for this analysis. These data items are discussed in the following sections.
Roadway Data
The roadway data inputs to emissions calculations for this conformity analysis are based on information
from the RMS database maintained by PennDOT’s Bureau of Planning and Research (BPR). PennDOT
obtains this information from periodic visual and electronic traffic counts. RMS data is dynamic, since it
is continually reviewed and updated from new traffic counts and field visits conducted by PennDOT.
Information on roadways included in the USDOT National Highway System is reviewed, at minimum, on
an annual basis, while information on other roadways is reviewed at least biennially. On a triennial
basis, a current “snapshot” of the RMS database is taken and downloaded to provide an updated record
of the Commonwealth’s highway system for estimating emissions. The RMS database contains all state

JATS: Transportation Conformity Analysis
2017 TIP and 2040 LRTP
Page |8 Air Quality Conformity Report
highways, including the Pennsylvania Turnpike, divided into segments approximately 0.5 miles in length.
These segments are usually divided at important intersections or locations where there is a change in
the physical characteristics of the roadway (e.g. the number of lanes changes). There are approximately
82,000 state highway segments across all 67 Pennsylvania counties. The following information is
extracted from RMS for emission calculations:
• Lanes.
• Distances.
• Volumes representing Average Annual Daily Traffic (AADT).
• Truck percentages.
• PennDOT urban/rural classifications.
• PennDOT functional class codes.
• Number of signals (based on linkage to PennDOT’s Geographic Information System (GIS) signal
location data).
RMS volumes and distances are used in calculating highway VMT totals for each county. As discussed in
the next section, adjustments are needed to convert the volumes to an average summer weekday,
winter weekday, and monthly day (including weekends and weekdays), as applicable to the
pollutant/precursor being analyzed. In addition, the traffic volumes must be forecast to support future
years. Lane values and traffic signals are important inputs for determining the congestion and speeds
for individual highway segments. Truck percentages are used in the speed determination process in
order to split volumes to individual vehicle types used by MOVES software. Road segments are classified
not only by function, but also by whether it is located in an urban, small urban or rural area. The
PennDOT urban/rural (UR) and functional classes (FC) designations are important indicators of the type
and function of each roadway segment. These variables provide valuable insights into other
characteristics not contained in the RMS data, which are used for speed and emission calculations.
VMT forecast growth rates are based on PennDOT’s VMT forecasting system, as documented in the
report “Statistical Evaluation of Projected Traffic Growth, Traffic Growth Forecasting System: Final
Report, March 14, 2005”. The PennDOT forecasting system includes the development of VMT forecasts
and growth rates for four functional classifications in each Pennsylvania county: urban interstate, urban
non-interstate, rural interstate, and rural non-interstate. The forecasts use statistical relationships
based on historic HPMS VMT trends and future county socioeconomic projections based on the 2012
Woods and Poole Economics, Inc. State Profile (http://www.woodsandpoole.com/). The statistical
models incorporate historical VMT trends, socioeconomic data (households, mean household income),
and a relative measure of transportation capacity (lane miles per capita). PennDOT’s BPR maintains and
updates these growth rates on a periodic basis based on new demographic projections and updated
information on HPMS VMT. The results of the updated VMT forecasts have been shared with the
participants in the Pennsylvania Transportation-Air Quality Working Group.

JATS: Transportation Conformity Analysis
2017 TIP and 2040 LRTP
Air Quality Conformity Report Page |9
Other Supporting Traffic Data
Other traffic data is used to adjust and disaggregate traffic volumes. Key sources used in these
processes include the following:
• Highway Performance Monitoring System (HPMS VMT): According to EPA guidance, baseline
inventory VMT computed from the RMS highway segment volumes must be adjusted to be
consistent with HPMS VMT totals. The VMT contained in the HPMS reports are considered to
represent average annual daily traffic (AADT), an average of all days in the year, including weekends
and holidays. Adjustment factors are calculated for the 2014 analysis year. These factors are used
to adjust locally modeled roadway data VMT to be consistent with the reported HPMS totals, and
are applied to all county and facility group combinations within the region. These adjustments are
important to account for local roadway VMT not represented within the regional travel demand
model.
• Seasonal Factors: The traffic volumes estimated from the RMS are adjusted to summer or average
monthly conditions (as needed for annual processing), using seasonal adjustment factors prepared
by PennDOT’s BPR in their annual traffic data report published on the BPR website
(http://www.dot.state.pa.us/ Search: Research and Planning). The seasonal factors are also used to
develop MOVES daily and monthly VMT fraction files, allowing MOVES to determine the portion of
annual VMT that occurs in each month of the year.
• Hourly Patterns: Speeds and emissions vary considerably depending on the time of day. In order to
produce accurate emission estimates, it is important to estimate the pattern by which roadway
volume varies by breaking the data down into hourly increments. Pattern data is in the form of a
percentage of the daily volumes for each hour. Distributions are provided for all the counties within
the region and by each facility type grouping. The hourly pattern data has been developed from 24-
hour vehicle count data compiled by PennDOT’s BPR, using the process identified in PennDOT’s
annual traffic data report. The same factors are also used to develop the MOVES hourly fraction file.
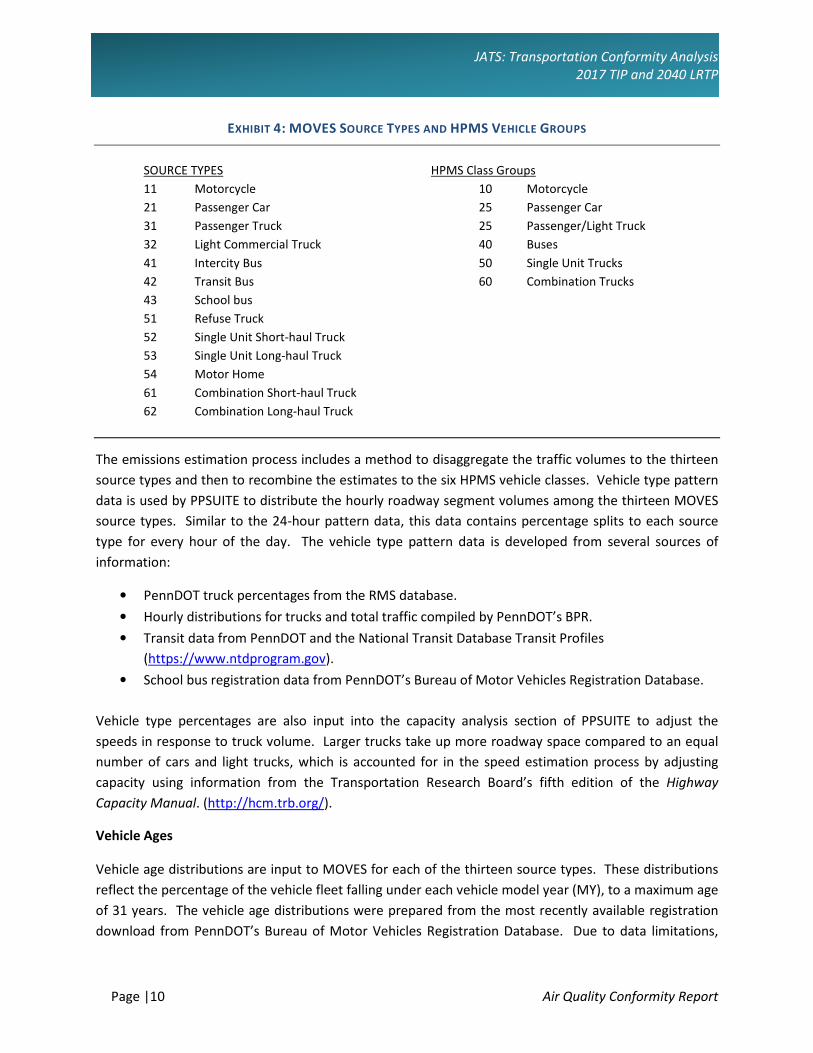
Vehicle Class
Emission rates within MOVES also vary significantly by vehicle type. MOVES produces emission rates for
thirteen MOVES vehicle source input types. VMT, however, is input to MOVES by six HPMS vehicle
groups (note that passenger cars and light trucks are grouped for input to MOVES2014). Exhibit 4
summarizes the distinction between each classification scheme.
JATS: Transportation Conformity Analysis
2017 TIP and 2040 LRTP
Page |10 Air Quality Conformity Report
EXHIBIT 4: MOVES SOURCE TYPES AND HPMS VEHICLE GROUPS
SOURCE TYPES HPMS Class Groups
11 Motorcycle 10 Motorcycle
21 Passenger Car 25 Passenger Car
31 Passenger Truck 25 Passenger/Light Truck
32 Light Commercial Truck 40 Buses
41 Intercity Bus 50 Single Unit Trucks
42 Transit Bus 60 Combination Trucks
43 School bus
51 Refuse Truck
52 Single Unit Short-haul Truck
53 Single Unit Long-haul Truck
54 Motor Home
61 Combination Short-haul Truck
62 Combination Long-haul Truck
The emissions estimation process includes a method to disaggregate the traffic volumes to the thirteen
source types and then to recombine the estimates to the six HPMS vehicle classes. Vehicle type pattern
data is used by PPSUITE to distribute the hourly roadway segment volumes among the thirteen MOVES
source types. Similar to the 24-hour pattern data, this data contains percentage splits to each source
type for every hour of the day. The vehicle type pattern data is developed from several sources of
information:
• PennDOT truck percentages from the RMS database.
• Hourly distributions for trucks and total traffic compiled by PennDOT’s BPR.
• Transit data from PennDOT and the National Transit Database Transit Profiles
(https://www.ntdprogram.gov).
• School bus registration data from PennDOT’s Bureau of Motor Vehicles Registration Database.
Vehicle type percentages are also input into the capacity analysis section of PPSUITE to adjust the
speeds in response to truck volume. Larger trucks take up more roadway space compared to an equal
number of cars and light trucks, which is accounted for in the speed estimation process by adjusting
capacity using information from the Transportation Research Board’s fifth edition of the Highway
Capacity Manual. (http://hcm.trb.org/).
Vehicle Ages
Vehicle age distributions are input to MOVES for each of the thirteen source types. These distributions
reflect the percentage of the vehicle fleet falling under each vehicle model year (MY), to a maximum age
of 31 years. The vehicle age distributions were prepared from the most recently available registration
download from PennDOT’s Bureau of Motor Vehicles Registration Database. Due to data limitations,

JATS: Transportation Conformity Analysis
2017 TIP and 2040 LRTP
Air Quality Conformity Report Page |11
information for light duty vehicles (including source types 11, 21, 31 and 32) was used as local data for
MOVES inputs, while heavy-duty vehicles (including source types 41, 42, 43, 51, 52, 53, 54, 61, and 62)
used the internal MOVES national default data. The registration data download is based on MOBILE6.2
vehicle categories. The data was converted to source types using the EPA convertor spreadsheets
provided with the MOVES emission model.
Vehicle Population
The vehicle population information, including the number and age of vehicles, impacts forecasted start
and evaporative emissions within MOVES. Similar to vehicle ages, MOVES requires vehicle populations
for each of the thirteen source type categories. County vehicle registration data was used to estimate
vehicle population for light-duty vehicles, transit buses, and school buses. Other heavy-duty vehicle
population values were based on VMT for each source type using the vehicle mix and pattern data
discussed previously. PPSUITE automatically applies MOVES default ratios of VMT and source type
population (e.g. the number of miles per vehicle by source type) to the local VMT estimates to produce
vehicle population.
For the preparation of source type population for other required conformity analysis years, base values
were adjusted using forecast population and household data for the area. Growth rates were limited so
as to not exceed the VMT growth assumptions.
Meteorology Data
Average monthly minimum temperatures, maximum temperatures, and humidity values are consistent
with the regional State Implementation Plan (SIP) modeling conducted by DEP. The data was obtained
from WeatherBank, Inc. EPA’s MOBILE6.2-MOVES meteorological data convertor spreadsheet
(http://www.epa.gov/oms/models/moves/tools.htm) was used to prepare the hourly temperature
inputs needed for the MOVES model, based on the available data.
Fuel Parameters
The MOVES default fuel formulation and fuel supply data were reviewed and updated based on
available local volumetric fuel property information. The gasohol market penetration and Reid Vapor
Pressure (RVP) values were updated, but MOVES default data was used for the remaining parameters.
Key assumptions include:
• 10.0 RVP used for summer months [Local data].
• 10% ethanol used throughout the year [MOVES defaults].
I/M Program Parameters
The inspection maintenance (I/M) program inputs to the MOVES model are based on previous and
current programs within each county (all PA I/M programs are based on county boundaries). All analysis
years include Pennsylvania’s statewide I/M program. The default I/M program parameters included in

JATS: Transportation Conformity Analysis
2017 TIP and 2040 LRTP
Page |12 Air Quality Conformity Report
MOVES were examined for each county and necessary changes were made to the default parameters to
match the actual local program.
The I/M program requirements vary by region (five regions) and include on-board diagnostics (OBD)
technology that uses the vehicle’s computer for model years 1996 and newer to identify potential
engine and exhaust system problems that could affect emissions. The program, named PAOBDII, is
implemented by region as follows:
• Philadelphia Region - Bucks, Chester, Delaware, Montgomery and Philadelphia Counties
[Includes tailpipe exhaust testing using ASM2015 or equipment for pre-1996 vehicles up to 25 years old]
• Pittsburgh Region - Allegheny, Beaver, Washington and Westmoreland Counties.
[Includes tailpipe exhaust testing using PA 97 equipment for pre-1996 vehicles up to 25 years old]
• South Central and Lehigh Valley Region - Berks, Cumberland, Dauphin, Lancaster, Lebanon,
Lehigh, Northampton and York Counties.
[Gas cap and visual inspection only]
• North Region - Blair, Cambria, Centre, Erie, Lackawanna, Luzerne, Lycoming, and Mercer
Counties.
[Gas cap and visual inspection only]
• Other 42 Counties – Includes the remaining 42 counties not included above.
[Visual inspection only]
Other Vehicle Technology and Control Strategy Data
Current federal vehicle emissions control and fuel programs are incorporated into the MOVES software.
These include the National Program standards covering vehicles MY2012-MY2016. Modifications of
default emission rates are required to reflect the early implementation of the National Low Emission
Vehicle (NLEV) Program in Pennsylvania. To reflect these impacts, EPA has released instructions and
input files that can be used to model these impacts.
The Pennsylvania Clean Vehicles (PCV) Program, adopted in 1998, incorporated the California Low
Emission Vehicle Regulations (CA LEV II) by reference. The PCV Program allowed automakers to comply
with the NLEV program as an alternative to this Pennsylvania program until MY2006. Beginning with
MY2008, all “new” passenger cars and light-duty trucks with a gross vehicle weight rating (GVWR) of
8,500 pounds or less sold/leased and titled in Pennsylvania must be certified by the California Air
Resources Board (CARB) or be certified for sale in all 50 states. For this program, a “new” vehicle is a
qualified vehicle with an odometer reading less than 7,500 miles. DEP and PennDOT both work with the
public, including manufacturers, vehicle dealers and consumers, to ensure that vehicles sold and
purchased in Pennsylvania or vehicles purchased from other states by Pennsylvania residents comply
with the requirements of the PCV Program, in order to be titled in Pennsylvania. Additionally, PennDOT
ensures that paperwork for title and registration includes proof of CARB- or 50-state emission
certification or that the vehicle owner qualifies for an exemption to the requirements, as listed on
PennDOT’s MV-9 form and in the PCV Program regulation. When necessary, information from

JATS: Transportation Conformity Analysis
2017 TIP and 2040 LRTP
Air Quality Conformity Report Page |13
PennDOT’s title and registration process may be used to audit vehicle title transactions to determine
program compliance.
The impacts of this program are modeled for all analysis years beyond 2008 using the same instructions
and tools downloaded for the early NLEV analysis. EPA provided input files to reflect state programs
similar to the CAL LEV II program. Modifications to those files were made to reflect a 2008 program start
date for Pennsylvania.
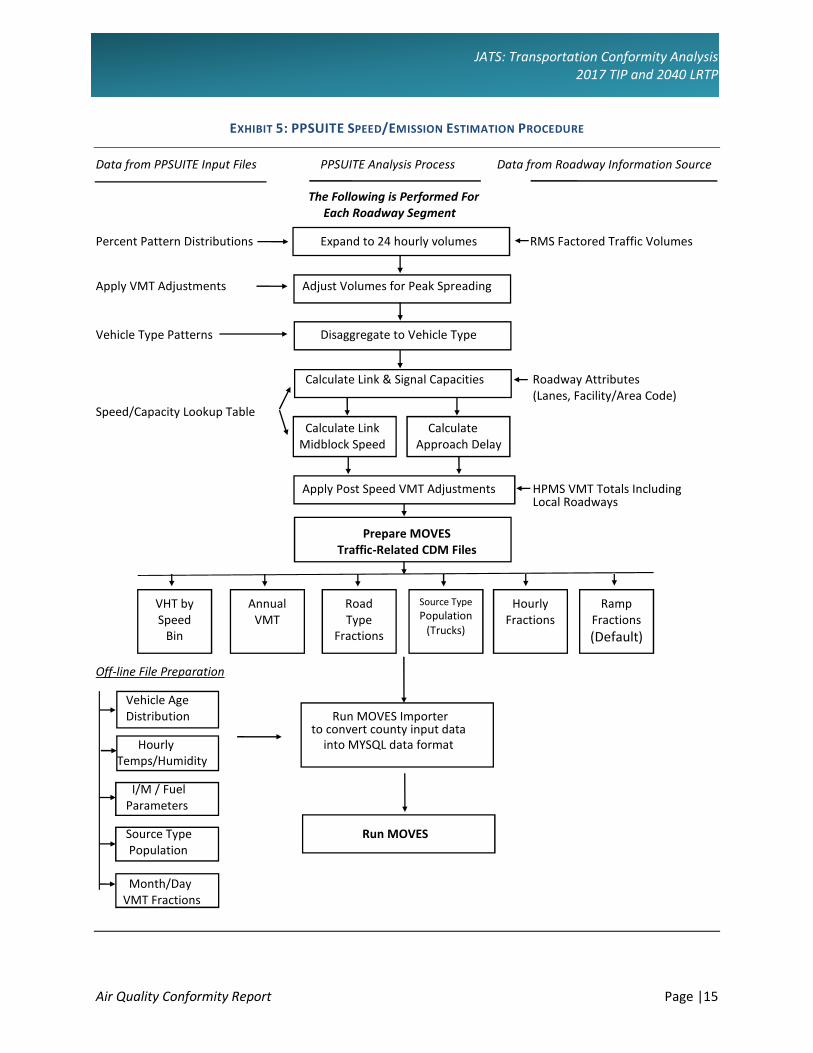
Analysis Process Details
The previous sections have summarized the input data used for computing speeds and emission rates
for this conformity analysis. This section explains how PPSUITE and MOVES use that input data to
produce emission estimates. Exhibit 5 provides a more detailed overview of the PPSUITE analysis
procedure using the available traffic data information described in the previous sections.
VMT Preparation
Producing an emissions inventory with PPSUITE requires a process of disaggregation and aggregation.
Data is available and used on a very detailed scale – individual roadway segments for each of the 24
hours of the day. This data needs to be processed individually to determine the distribution of vehicle
hours of travel (VHT) by speed and then aggregated by vehicle class to determine the input VMT to the
MOVES emission model. Key steps in the preparation of VMT include:
• Assemble VMT - The RMS database contains the roadway segments, distances and travel volumes
needed to estimate VMT. PPSUITE processes each segment by simply multiplying the assigned
travel volume by the distance to obtain VMT.
• Apply Seasonal Adjustments – PPSUITE adjusts the traffic volumes to the appropriate analysis season
using an average monthly day to support annual PM2.5 analyses. These traffic volumes are
assembled by PPSUITE and extrapolated over the course of a year to produce the annual VMT file
input to MOVES.
• Disaggregate to Hours - After seasonal adjustments are applied, the traffic volumes are distributed
to each hour of the day. This allows for more accurate speed calculations (effects of congested
hours) and allows PPSUITE to prepare the hourly VMT and speeds for input to MOVES.
• Peak Spreading - After distributing the daily volumes to each hour of the day, PPSUITE identifies
hours that are unreasonably congested. For those hours, PPSUITE then spreads a portion of the
volume to other hours within the same peak period, thereby approximating the “peak spreading”
that normally occurs in such over-capacity conditions. This process also helps prevent hours with
unreasonably congested speeds from disproportionately impacting emission calculations.
• Disaggregation to Vehicle Types - EPA requires VMT estimates to be prepared by the six HPMS
vehicle groups, reflecting specific local characteristics. As described in the previous section, the
hourly volumes are disaggregated into thirteen MOVES source types based on data from PennDOT

JATS: Transportation Conformity Analysis
2017 TIP and 2040 LRTP
Page |14 Air Quality Conformity Report
and NTD, in combination with MOVES defaults. The thirteen MOVES source types are then
recombined into six HPMS vehicle classes.
• Apply HPMS VMT Adjustments - Volumes must also be adjusted to account for differences with the
HPMS VMT totals, as described in previous sections. VMT adjustment factors are provided as inputs
to PPSUITE and are applied to each of the roadway segment volumes. VMT adjustment factors are
also applied to runs for future years.
• Apply VMT Growth Adjustments Volumes must also be adjusted to estimate future year VMT. VMT
growth factors are provided as inputs to PPSUITE, and are applied to each of the roadway segment
volumes. The VMT growth factors were developed from the PennDOT BPR Growth Rate forecasting
system.
Speed Estimation
Emissions for many pollutants (including VOC and NOx) vary significantly with travel speed. VOC
emissions generally decrease as speed increases, while NOX emissions decrease at low speeds and
increases at higher speeds, as illustrated in Exhibit 6. Because emissions are so sensitive to speed
changes, EPA recommends special attention be given to developing reasonable and consistent speed
estimates. EPA also recommends that VMT be disaggregated into subsets that have roughly equal
speeds, with separate emission factors for each subset. At a minimum, speeds should be estimated
separately by road type.
The computational framework used for this analysis meets and exceeds the recommendation above
relating to speed estimates. Speeds are individually calculated for each roadway segment and hour.
Rather than accumulating the roadway segments into a particular road type and calculating an average
speed, each individual link hourly speed is represented in the MOVES vehicle hours of travel (VHT) by a
speed bin file. This MOVES input file allows the specification of a distribution of hourly speeds. For
example, if 5% of a county’s arterial VHT operates at 5 mph during the AM peak hour and the remaining
95% operates at 65 mph, this can be represented in the MOVES speed input file. For the roadway
vehicle emissions calculations, speed distributions are input to MOVES by road type and source type for
each hour of the day.
To calculate speeds, PPSUITE first obtains initial capacities (i.e., how much volume the roadway can
serve before heavy congestion) and free-flow speeds (speeds assuming no congestion) from a
speed/capacity lookup table. As described previously, this data contains default roadway information
indexed by the area and facility type codes. For areas with known characteristics, values can be directly
coded to the database and the speed/capacity default values can be overridden. For most areas where
known information is unavailable, the speed/capacity lookup tables provide valuable default
information regarding speeds, capacities, signal characteristics, and other capacity adjustment
information used for calculating congested delays and speeds. The result of this process is an estimated
average travel time for each hour of the day for each highway segment. The average travel time
multiplied by traffic volume produces vehicle hours of travel (VHT).
JATS: Transportation Conformity Analysis
2017 TIP and 2040 LRTP
Air Quality Conformity Report Page |15
EXHIBIT 5: PPSUITE SPEED/EMISSION ESTIMATION PROCEDURE
Data from PPSUITE Input Files PPSUITE Analysis Process Data from Roadway Information Source
The Following is Performed For
Each Roadway Segment
Percent Pattern Distributions Expand to 24 hourly volumes RMS Factored Traffic Volumes
Apply VMT Adjustments Adjust Volumes for Peak Spreading
Vehicle Type Patterns Disaggregate to Vehicle Type
Calculate Link & Signal Capacities Roadway Attributes
(Lanes, Facility/Area Code)
Speed/Capacity Lookup Table
Calculate Link Calculate
Midblock Speed Approach Delay
Apply Post Speed VMT Adjustments HPMS VMT Totals Including Local Roadways
Prepare MOVES
Traffic-Related CDM Files
Off-line File Preparation
Vehicle Age
Distribution Run MOVES Importer to convert county input data
Hourly into MYSQL data format
Temps/Humidity
I/M / Fuel
Parameters
Source Type Run MOVES
Population
Month/Day
VMT Fractions
VHT by
Speed
Bin
Annual
VMT
Road
Type
Fractions
Source Type
Population
(Trucks)
Hourly
Fractions
Ramp
Fractions
(Default)

JATS: Transportation Conformity Analysis
2017 TIP and 2040 LRTP
Page |16 Air Quality Conformity Report
EXHIBIT 6: EMISSION FACTOR VS. SPEED VARIANCES (VOC, NOX, AND PM2.5)
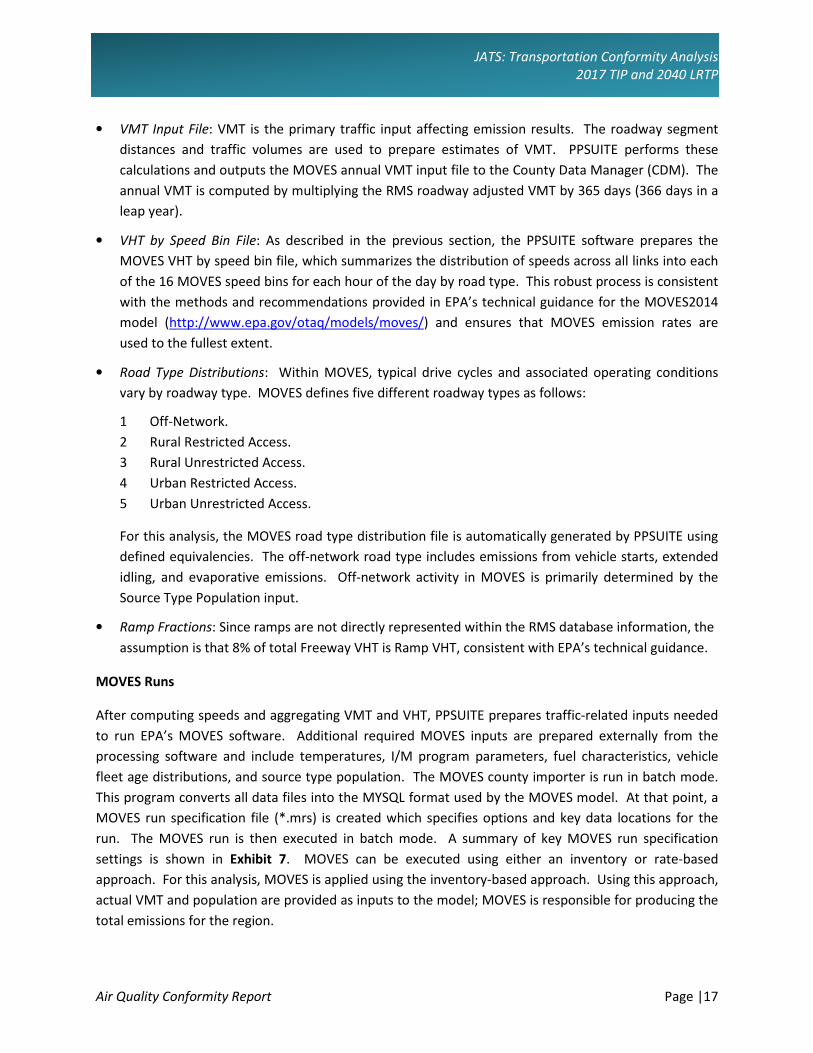
Developing the MOVES Traffic Input Files
The PPSUITE software is responsible for producing the following MOVES input files during any analysis
run:
• VMT by HPMS vehicle class.
• VHT by speed bin.
• Road type distributions.
• Hourly VMT fractions.
• Ramp fractions.
These files are text formatted files with a *.csv extension. The files are provided as inputs within the
MOVES County Data Manager (CDM) and are described below:
Source: Figure 3 from Implications of the MOVES2010 Model on Mobile Source
Emission Estimates, Air & Waste Management Association, July 2010.
JATS: Transportation Conformity Analysis
2017 TIP and 2040 LRTP
Air Quality Conformity Report Page |17
• VMT Input File: VMT is the primary traffic input affecting emission results. The roadway segment
distances and traffic volumes are used to prepare estimates of VMT. PPSUITE performs these
calculations and outputs the MOVES annual VMT input file to the County Data Manager (CDM). The
annual VMT is computed by multiplying the RMS roadway adjusted VMT by 365 days (366 days in a
leap year).
• VHT by Speed Bin File: As described in the previous section, the PPSUITE software prepares the
MOVES VHT by speed bin file, which summarizes the distribution of speeds across all links into each
of the 16 MOVES speed bins for each hour of the day by road type. This robust process is consistent
with the methods and recommendations provided in EPA’s technical guidance for the MOVES2014
model (http://www.epa.gov/otaq/models/moves/) and ensures that MOVES emission rates are
used to the fullest extent.
• Road Type Distributions: Within MOVES, typical drive cycles and associated operating conditions
vary by roadway type. MOVES defines five different roadway types as follows:
1 Off-Network.
2 Rural Restricted Access.
3 Rural Unrestricted Access.
4 Urban Restricted Access.
5 Urban Unrestricted Access.
For this analysis, the MOVES road type distribution file is automatically generated by PPSUITE using
defined equivalencies. The off-network road type includes emissions from vehicle starts, extended
idling, and evaporative emissions. Off-network activity in MOVES is primarily determined by the
Source Type Population input.
• Ramp Fractions: Since ramps are not directly represented within the RMS database information, the
assumption is that 8% of total Freeway VHT is Ramp VHT, consistent with EPA’s technical guidance.
MOVES Runs
After computing speeds and aggregating VMT and VHT, PPSUITE prepares traffic-related inputs needed
to run EPA’s MOVES software. Additional required MOVES inputs are prepared externally from the
processing software and include temperatures, I/M program parameters, fuel characteristics, vehicle
fleet age distributions, and source type population. The MOVES county importer is run in batch mode.
This program converts all data files into the MYSQL format used by the MOVES model. At that point, a
MOVES run specification file (*.mrs) is created which specifies options and key data locations for the
run. The MOVES run is then executed in batch mode. A summary of key MOVES run specification
settings is shown in Exhibit 7. MOVES can be executed using either an inventory or rate-based
approach. For this analysis, MOVES is applied using the inventory-based approach. Using this approach,
actual VMT and population are provided as inputs to the model; MOVES is responsible for producing the
total emissions for the region.

JATS: Transportation Conformity Analysis
2017 TIP and 2040 LRTP
Page |18 Air Quality Conformity Report
EXHIBIT 7: MOVES RUN SPECIFICATION FILE PARAMETER SETTINGS
Parameter Setting
MOVES Version MOVES2014
MOVES Default Database Version MOVESDB20141021
Scale COUNTY
Analysis Mode Inventory
Time Span Annual Runs:
12 months, Weekday and Weekend, 24 hours
Input Time Aggregation Hour
Geographic Selection County [FIPS]
Vehicle Selection All source types
Gasoline, Diesel, CNG, E85
Road Type All road types including off-network
Pollutants and Processes All PM2.5 categories, NOX
Database selection Early NLEV database
PA-Specific CAL LEVII database
General Output
Units:
Emission = grams; Distance = miles;
Time = hours; Energy = Million BTU
Output Emissions Time = Month, Emissions by Process ID, Source Type
and Road Type
JATS: Transportation Conformity Analysis
2017 TIP and 2040 LRTP
Air Quality Conformity Report Page |19
Conformity Analysis Results
Transportation conformity analyses of the current TIP and LRTP have been completed for Cambria
County. The analyses were performed according to the requirements of the Federal transportation
conformity rule at 40 CFR Part 93, Subpart A. The analyses utilized the methodologies, assumptions and
data as presented in previous sections. Interagency consultation has been used to determine applicable
emission models, analysis years and emission tests.
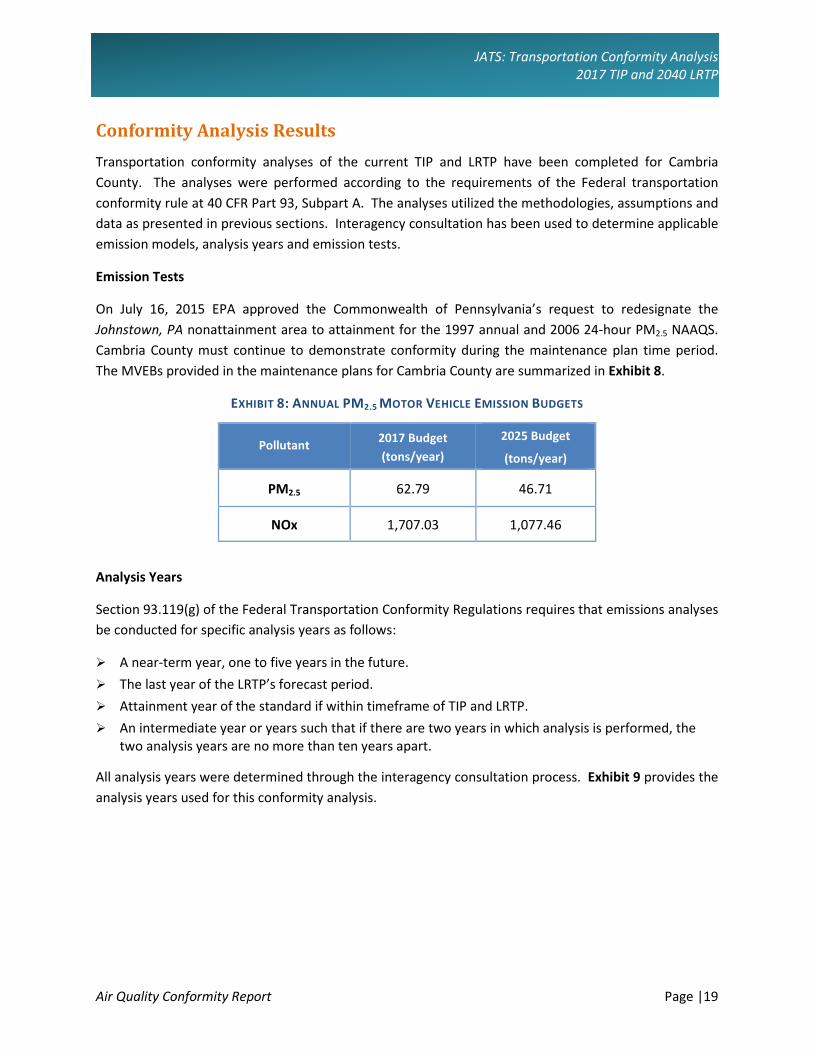
Emission Tests
On July 16, 2015 EPA approved the Commonwealth of Pennsylvania’s request to redesignate the
Johnstown, PA nonattainment area to attainment for the 1997 annual and 2006 24-hour PM2.5 NAAQS.
Cambria County must continue to demonstrate conformity during the maintenance plan time period.
The MVEBs provided in the maintenance plans for Cambria County are summarized in Exhibit 8.
EXHIBIT 8: ANNUAL PM2.5 MOTOR VEHICLE EMISSION BUDGETS
Analysis Years
Section 93.119(g) of the Federal Transportation Conformity Regulations requires that emissions analyses
be conducted for specific analysis years as follows:
� A near-term year, one to five years in the future.
� The last year of the LRTP’s forecast period.
� Attainment year of the standard if within timeframe of TIP and LRTP.
� An intermediate year or years such that if there are two years in which analysis is performed, the
two analysis years are no more than ten years apart.
All analysis years were determined through the interagency consultation process. Exhibit 9 provides the
analysis years used for this conformity analysis.
Pollutant 2017 Budget
(tons/year)
2025 Budget
(tons/year)
PM2.5 62.79 46.71
NOx 1,707.03 1,077.46

JATS: Transportation Conformity Analysis
2017 TIP and 2040 LRTP
Page |20 Air Quality Conformity Report
EXHIBIT 9: TRANSPORTATION CONFORMITY ANALYSIS YEARS
Components of the PM2.5 Regional Emissions Analysis
PM2.5 can be the result of either direct or indirect emissions. Direct transportation emissions can be the
result of brake or tire-wear, particulates in exhaust emissions, or dust raised by on-road vehicles or
construction equipment. Possible indirect transportation related emissions of PM2.5 include: NH3, NOX,
SOX, and VOC. The EPA has ruled that regional analysis of direct PM2.5 emissions must include both
exhaust and brake/tire-wear emissions. EPA’s current regulations specify that road dust should be
included in the regional analysis of direct PM2.5 emissions only if the EPA or the state air agency have
found it to be a significant contributor to the region’s nonattainment. Neither the EPA nor the state air
agency has determined road dust to be a significant contributor in the nonattainment area for this
conformity determination.
Until a SIP revision is approved proving that NOX is insignificant, EPA’s current regulations state that
indirect PM2.5 emissions must be analyzed for NOX. Conversely, VOC, SOX and NH3 must be analyzed only
if the state(s) or the EPA determines one or more of these pollutants significant. Therefore, NOX is the
only indirect PM2.5 component analyzed for the nonattainment area in this conformity determination.
Regionally Significant Highway Projects
For the purposes of conformity analysis, model highway networks are created for each analysis year.
For the horizon years, regionally significant projects from the LRTP were coded onto the networks.
Detailed assessments were only performed for those new projects which may have a significant effect
on emissions in accordance with 40 CFR Parts 51 and 93. Only those projects which would increase
capacity or significantly impact vehicular speeds were considered. Projects such as bridge replacements
and roadway restoration projects, which constitute the majority of the TIP and LRTP list, have been
excluded from consideration since they are considered exempt under 40 CFR 93.126-127. A list of
highway projects is shown in Attachment A.
Analysis Year Description
2017 Budget Year
2025 Budget Year
2035 Interim Year
2040 Last Year of LRTP
JATS: Transportation Conformity Analysis
2017 TIP and 2040 LRTP
Air Quality Conformity Report Page |21
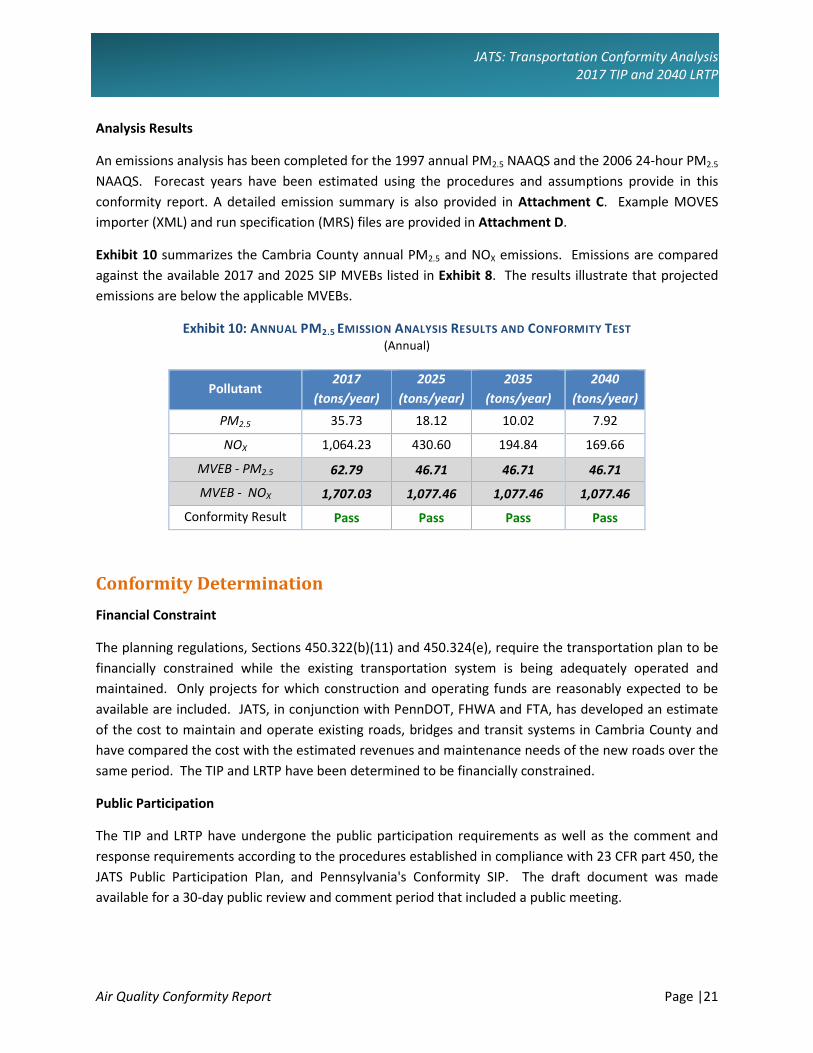
Analysis Results
An emissions analysis has been completed for the 1997 annual PM2.5 NAAQS and the 2006 24-hour PM2.5
NAAQS. Forecast years have been estimated using the procedures and assumptions provide in this
conformity report. A detailed emission summary is also provided in Attachment C. Example MOVES
importer (XML) and run specification (MRS) files are provided in Attachment D.
Exhibit 10 summarizes the Cambria County annual PM2.5 and NOX emissions. Emissions are compared
against the available 2017 and 2025 SIP MVEBs listed in Exhibit 8. The results illustrate that projected
emissions are below the applicable MVEBs.
Exhibit 10: ANNUAL PM2.5 EMISSION ANALYSIS RESULTS AND CONFORMITY TEST
(Annual)
Conformity Determination
Financial Constraint
The planning regulations, Sections 450.322(b)(11) and 450.324(e), require the transportation plan to be
financially constrained while the existing transportation system is being adequately operated and
maintained. Only projects for which construction and operating funds are reasonably expected to be
available are included. JATS, in conjunction with PennDOT, FHWA and FTA, has developed an estimate
of the cost to maintain and operate existing roads, bridges and transit systems in Cambria County and
have compared the cost with the estimated revenues and maintenance needs of the new roads over the
same period. The TIP and LRTP have been determined to be financially constrained.
Public Participation
The TIP and LRTP have undergone the public participation requirements as well as the comment and
response requirements according to the procedures established in compliance with 23 CFR part 450, the
JATS Public Participation Plan, and Pennsylvania's Conformity SIP. The draft document was made
available for a 30-day public review and comment period that included a public meeting.
Pollutant 2017
(tons/year)
2025
(tons/year)
2035
(tons/year)
2040
(tons/year)
PM2.5 35.73 18.12 10.02 7.92
NOX 1,064.23 430.60 194.84 169.66
MVEB - PM2.5 62.79 46.71 46.71 46.71
MVEB - NOX 1,707.03 1,077.46 1,077.46 1,077.46
Conformity Result Pass Pass Pass Pass

JATS: Transportation Conformity Analysis
2017 TIP and 2040 LRTP
Page |22 Air Quality Conformity Report
Conformity Statement
The conformity rule requires that the TIP and LRTP conform to the applicable SIP(s) and be adopted by
the MPO/RPO before any federal agency may approve, accept, or fund projects. Conformity is
determined by applying criteria outlined in the transportation conformity regulations to the analysis.
The TIP and LRTP for Cambria County are found to conform to the applicable air quality SIP(s) or EPA
conformity requirements. This finding of conformity positively reflects on the efforts of the JATS and its
partners in meeting the regional air quality goals, while maintaining and building an effective
transportation system.

JATS: Transportation Conformity Analysis
2017 TIP and 2040 LRTP
Air Quality Conformity Report Page |23
Resources
MOVES Model
Modeling Page within EPA’s Office of Mobile Sources Website contains a downloadable model, MOVES
users guide and other information. See (http://www.epa.gov/omswww/models.htm)
Policy Guidance on the Use of MOVES2014 for State Implementation Plan Development, Transportation
Conformity, and Other Purposes, US EPA Office of Air and Radiation, EPA-420-B-14-008, July 2014.
MOVES2014 and MOVES2014a Technical Guidance: Using MOVES to Prepare Emission Inventories in
State Implementation Plans and Transportation Conformity. US EPA Office of Air and Radiation, and
Office of Transportation and Air Quality, EPA-420-B-15-093, November 2015.
Motor Vehicle Emission Simulator (MOVES) – User Guide for MOVES2014, US EPA Office of
Transportation and Air Quality, EPA-420-B-14-055; July 2014.
Traffic Engineering
Highway Capacity Manual, fifth edition (HCM2010), Transportation Research Board, presents current
knowledge and techniques for analyzing the transportation system.
Traffic Data Collection and Factor Development Report, 2014 Data, Pennsylvania Department of
Transportation, Bureau of Planning and Research.

JATS: Transportation Conformity Analysis
2017 TIP and 2040 LRTP
Page |24 Air Quality Conformity Report
Highway Vehicle Emissions Analysis Glossary
AADT: Average Annual Daily Traffic, average of ALL days.
CAA: Clean Air Act as amended.
CARB: California Air Resources Board.
CFR: Code of Federal Regulations.
County Data Manager (CDM): User interface developed to simplify importing specific local data for a single county
or a user-defined custom domain without requiring direct interaction with the underlying MySQL database in the
MOVES emission model.
Emission rate or factor: Expresses the amount of pollution emitted per unit of activity. For highway vehicles, this
is usually expressed in grams of pollutant emitted per mile driven.
FC: Functional code. Applied to road segments to identify their type (freeway, local, etc.).
FHWA: Federal Highway Administration.
FR: Federal Register.
FTA: Federal Transit Administration.
Growth factor: Factor used to convert volumes to future years.
HPMS: Highway Performance Monitoring System.
I/M: Vehicle emissions inspection/maintenance programs are required in certain areas of the country. The
programs ensure that vehicle emission controls are in good working order throughout the life of the vehicle. The
programs require vehicles to be tested for emissions. Most vehicles that do not pass must be repaired.
MOVES: Motor Vehicle Emission Simulator. The latest model EPA has developed to estimate emissions from
highway vehicles.
MVEB: motor vehicle emissions budget.
Pattern data: Extrapolations of traffic patterns (such as how traffic volume on road segment types varies by time
of day, or what kinds of vehicles tend to use a road segment type) from segments with observed data to similar
segments.
PPSUITE: Post-Processor for Air Quality. A set of programs that estimate speeds and prepares MOVES inputs and
processes MOVES outputs.
Road Type: Functional code, applied in data management to road segments to identify their type (rural/urban
highways, rural/urban arterials, etc.).
RMS: Roadway Management System.
Source Type: One of thirteen vehicle types used in MOVES modeling.
VHT: Vehicle hours traveled.
VMT: Vehicle miles traveled. In modeling terms, it is the simulated traffic volumes multiplied by link length.
JATS: Transportation Conformity Analysis
2017 TIP and 2040 LRTP
Air Quality Conformity Report Page |25
ATTACHMENT A
Project List

JATS: Transportation Conformity Analysis
2017 TIP and 2040 LRTP
Page |26 Air Quality Conformity Report
FY2017 TIP Completion
year
99282 Franklin Street Signals
Signal improvements on Franklin Street (SR
3011) at the intersections with Akers Street,
Osborne Street, and PA 403 in the City of
Johnstown, Cambria County.
2025
99291 Dtown Jtown Signal Imp
Signal improvements at the following
intersections in the City of Johnstown, Cambria
County: Main St/SR 271; SR 3044 (Washington
St)/SR 3023(Johns St); SR 271/SR 3044
(Washington St); SR 3016 (Vine St)/Walnut St;
SR 3016(Vine St)/Market St; SR 271/Locust St;
SR 3024(Main St)/Market St; SR 3024(Main
St)/Walnut St; SR 3055(Franklin St)/Locust St;
SR 3024 (Main St)/SR 3055(Franklin St); SR
3044(Washington St)/SR 3055(Franklin St); SR
3055(Franklin St)/Vine St; SR 56/SR
403/Walnut St; SR 3044(Washington
St)/Market St; SR 3044(Washington St)/Walnut
St; SR 403/Market St; Walnut st/Locust St
2018
2040 LRTP Completion
year
Urban Replacement
Replace heavy-duty buses with CNG fueled buses. These vehicles will have exceeded their estimated useful life expectancy and mileage requirements.
2022-2030
Rural Replacement
Replace small buses with CNG fueled buses. These vehicles will have exceeded their estimated useful life expectancy and mileage requirements.
2023-2030
Urban Bus Mid-Life Overhauls
Mid-life overhauls on Urban heavy-duty buses.
2021-2030

JATS: Transportation Conformity Analysis
2017 TIP and 2040 LRTP
Air Quality Conformity Report Page |27
Elton Road II
Improvements: Donalds
Ln.-Industrial Park Rd.
Congestion mitigation and safety
improvements on approximately .7 miles of PA
Route 756, between segment 130 (Donald
Lane) and Segment 150 (Industrial Park Rd.)
Proposed improvements include upgrades at
the existing signal at Donald Lane, the addition
of a new signal at Industrial Park Road, as well
as the addition of turning lanes at the
Industrial Park Road and Vo-Tech Drive
intersections. 2027-2040
Bedford St. Corridor TSM
Improvements: Belmont St.
to Luther Rd.
Congestion mitigation and safety
improvements along approximately 1.4 miles
PA Route 756 (Bedford Street) from Belmont
Street to Luther Road. Proposed improvements
include widening along the existing alignment,
signalization and intersection improvements,
possibly including new turning lanes 2027-2040
Benshoff Hill Widen Widening along the existing alignment and
smoothing of an "S-curve" section of SR 3039
(Benshoff Hill Road) 2027-2040
No. 9 Rd. Reconstruction
US 219-Hastings
Widening along approximately 2.3 miles of the
existing two-lane alignment of SR 4021
(Number Nine Rd.) Between US Route 219 and
Hastings Borough, to accommodate access to
the Hastings Industrial Park for larger trucks. 2027-2040
Hastings Access Road East-
PA Route 36
Construction of a new two-lane roadway
approximately 1-2 miles in length, connecting
PA Route 36 to the Hastings Industrial Park. 2027-2040
Highway and Bridge
Reserve
Reserve funding line item for highway and
bridge projects. 2040

JATS: Transportation Conformity Analysis
2017 TIP and 2040 LRTP
Page |28 Air Quality Conformity Report
ATTACHMENT B
Detailed Emission Results

JATS: Transportation Conformity Analysis
2017 TIP and 2040 LRTP
Air Quality Conformity Report Page |29
Detailed Emission Results for Annual PM2.5 Analysis
Emissions (Tons/Year)
NOx PM2.5
Off-Network N/A N/A 324.30 7.31
Rural Restricted 0 N/A 0.00 0.00
Rural UnRestricted 401,226,994 48.8 312.28 10.98
Urban Restricted 234,010,073 55.4 210.51 8.20
Urban UnRestricted 340,428,246 35.5 217.15 9.24
Subtotal 975,665,313 1,064.23 35.73
Off-Model Project
Emission Benefits0.00 0.00
Region Total 975,665,313 1,064.23 35.73
(Kg/Year) 965,450 32,417
Cambria
Annual VMTSpeed
(mph)
Cambria County PM2.5 Annual Emission Summary2017 FFY17 TIP Conformity (By Road Type)
County Road Type
Emissions (Tons/Year)
NOx PM2.5
Motorcycle 6,296,759 5.71 0.19
Passenger Car 493,230,330 159.39 6.85
Passenger Truck 325,339,620 407.89 9.64
Light Commercial Truck 82,185,790 108.40 2.70
Intercity Bus 51,555 0.56 0.03
Transit Bus 3,828,188 27.87 1.30
School Bus 988,467 5.36 0.33
Refuse Truck 1,076,686 6.14 0.27
Single Unit Short-haul Truck 22,404,779 56.09 2.81
Single Unit Long-haul Truck 1,222,397 3.14 0.17
Motor Home 854,603 3.02 0.13
Combination Short-haul Truck 8,665,800 50.52 2.07
Combination Long-haul Truck 29,520,340 230.12 9.27
Subtotal 975,665,313 1,064.23 35.73
Off-Model Project
Emission Benefits0.00 0.00
Region Total 975,665,313 1,064.23 35.73
(Kg/Year) 965,450 32,417
Cambria
Cambria County PM2.5 Annual Emission Summary2017 FFY17 TIP Conformity (By Source Type)
County Source Type Annual VMT

JATS: Transportation Conformity Analysis
2017 TIP and 2040 LRTP
Page |30 Air Quality Conformity Report
Emissions (Tons/Year)
NOx PM2.5
Running Exhaust 739.66 20.60
Start Exhaust 299.31 6.82
Brakewear 0.00 3.34
Tirewear 0.00 1.57
Evap Permeation 0.00 0.00
Evap Fuel Vapor Venting 0.00 0.00
Evap Fuel Leaks 0.00 0.00
Crankcase Running Exhaust 0.27 2.91
Crankcase Start Exhaust 0.01 0.07
Crankcase Extended Idle Exhaust 0.01 0.07
Extended Idle Exhaust 24.61 0.34
Auxiliary Power Exhaust 0.34 0.02
Subtotal 1,064.23 35.73
Off-Model Project
Emission Benefits0.00 0.00
Region Total 1,064.23 35.73
(Kg/Year) 965,450 32,417
Cambria
Cambria County PM2.5 Annual Emission Summary2017 FFY17 TIP Conformity (By Emission Process)
County Emission Process
JATS: Transportation Conformity Analysis
2017 TIP and 2040 LRTP
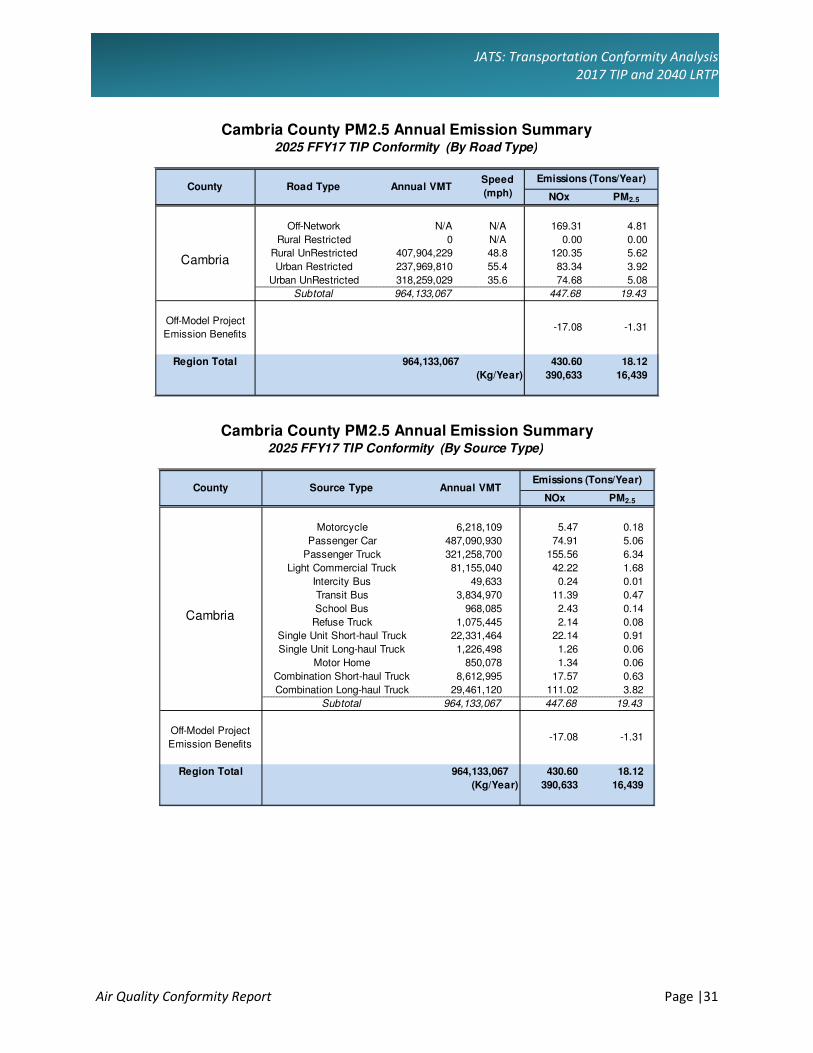
Air Quality Conformity Report Page |31
Emissions (Tons/Year)
NOx PM2.5
Off-Network N/A N/A 169.31 4.81
Rural Restricted 0 N/A 0.00 0.00
Rural UnRestricted 407,904,229 48.8 120.35 5.62
Urban Restricted 237,969,810 55.4 83.34 3.92
Urban UnRestricted 318,259,029 35.6 74.68 5.08
Subtotal 964,133,067 447.68 19.43
Off-Model Project
Emission Benefits-17.08 -1.31
Region Total 964,133,067 430.60 18.12
(Kg/Year) 390,633 16,439
Cambria
Annual VMTSpeed
(mph)
Cambria County PM2.5 Annual Emission Summary2025 FFY17 TIP Conformity (By Road Type)
County Road Type
Emissions (Tons/Year)
NOx PM2.5
Motorcycle 6,218,109 5.47 0.18
Passenger Car 487,090,930 74.91 5.06
Passenger Truck 321,258,700 155.56 6.34
Light Commercial Truck 81,155,040 42.22 1.68
Intercity Bus 49,633 0.24 0.01
Transit Bus 3,834,970 11.39 0.47
School Bus 968,085 2.43 0.14
Refuse Truck 1,075,445 2.14 0.08
Single Unit Short-haul Truck 22,331,464 22.14 0.91
Single Unit Long-haul Truck 1,226,498 1.26 0.06
Motor Home 850,078 1.34 0.06
Combination Short-haul Truck 8,612,995 17.57 0.63
Combination Long-haul Truck 29,461,120 111.02 3.82
Subtotal 964,133,067 447.68 19.43
Off-Model Project
Emission Benefits-17.08 -1.31
Region Total 964,133,067 430.60 18.12
(Kg/Year) 390,633 16,439
Cambria
Cambria County PM2.5 Annual Emission Summary2025 FFY17 TIP Conformity (By Source Type)
County Source Type Annual VMT

JATS: Transportation Conformity Analysis
2017 TIP and 2040 LRTP
Page |32 Air Quality Conformity Report
Emissions (Tons/Year)
NOx PM2.5
Running Exhaust 278.30 8.72
Start Exhaust 146.06 4.48
Brakewear 0.00 3.23
Tirewear 0.00 1.54
Evap Permeation 0.00 0.00
Evap Fuel Vapor Venting 0.00 0.00
Evap Fuel Leaks 0.00 0.00
Crankcase Running Exhaust 0.07 1.13
Crankcase Start Exhaust 0.01 0.04
Crankcase Extended Idle Exhaust 0.01 0.05
Extended Idle Exhaust 22.57 0.20
Auxiliary Power Exhaust 0.67 0.04
Subtotal 447.68 19.43
Off-Model Project
Emission Benefits-17.08 -1.31
Region Total 430.60 18.12
(Kg/Year) 390,633 16,439
Cambria
Cambria County PM2.5 Annual Emission Summary2025 FFY17 TIP Conformity (By Emission Process)
County Emission Process

JATS: Transportation Conformity Analysis
2017 TIP and 2040 LRTP
Air Quality Conformity Report Page |33
Emissions (Tons/Year)
NOx PM2.5
Off-Network N/A N/A 94.60 2.69
Rural Restricted 0 N/A 0.00 0.00
Rural UnRestricted 415,832,981 48.8 54.37 3.42
Urban Restricted 243,022,052 55.4 38.98 2.18
Urban UnRestricted 292,519,032 35.7 28.41 3.22
Subtotal 951,374,065 216.36 11.51
Off-Model Project
Emission Benefits-21.52 -1.49
Region Total 951,374,065 194.84 10.02
(Kg/Year) 176,754 9,091
Cambria
Annual VMTSpeed
(mph)
Cambria County PM2.5 Annual Emission Summary2035 FFY17 TIP Conformity (By Road Type)
County Road Type
Emissions (Tons/Year)
NOx PM2.5
Motorcycle 6,128,688 5.36 0.17
Passenger Car 480,086,000 43.83 3.40
Passenger Truck 316,636,370 55.04 4.17
Light Commercial Truck 79,990,780 15.44 1.09
Intercity Bus 59,221 0.09 0.00
Transit Bus 3,860,423 4.92 0.13
School Bus 943,746 0.91 0.03
Refuse Truck 1,078,047 1.39 0.05
Single Unit Short-haul Truck 22,366,690 14.26 0.56
Single Unit Long-haul Truck 1,230,674 0.85 0.03
Motor Home 852,679 0.62 0.03
Combination Short-haul Truck 8,653,788 11.25 0.35
Combination Long-haul Truck 29,486,959 62.41 1.51
Subtotal 951,374,065 216.36 11.51
Off-Model Project
Emission Benefits-21.52 -1.49
Region Total 951,374,065 194.84 10.02
(Kg/Year) 176,754 9,091
Cambria
Cambria County PM2.5 Annual Emission Summary2035 FFY17 TIP Conformity (By Source Type)
County Source Type Annual VMT

JATS: Transportation Conformity Analysis
2017 TIP and 2040 LRTP
Page |34 Air Quality Conformity Report
Emissions (Tons/Year)
NOx PM2.5
Running Exhaust 121.76 3.63
Start Exhaust 73.29 2.53
Brakewear 0.00 3.11
Tirewear 0.00 1.52
Evap Permeation 0.00 0.00
Evap Fuel Vapor Venting 0.00 0.00
Evap Fuel Leaks 0.00 0.00
Crankcase Running Exhaust 0.00 0.56
Crankcase Start Exhaust 0.00 0.02
Crankcase Extended Idle Exhaust 0.00 0.02
Extended Idle Exhaust 20.27 0.05
Auxiliary Power Exhaust 1.03 0.06
Subtotal 216.36 11.51
Off-Model Project
Emission Benefits-21.52 -1.49
Region Total 194.84 10.02
(Kg/Year) 176,754 9,091
Cambria
Cambria County PM2.5 Annual Emission Summary2035 FFY17 TIP Conformity (By Emission Process)
County Emission Process

JATS: Transportation Conformity Analysis
2017 TIP and 2040 LRTP
Air Quality Conformity Report Page |35
Emissions (Tons/Year)
NOx PM2.5
Off-Network N/A N/A 85.30 1.97
Rural Restricted 0 N/A 0.00 0.00
Rural UnRestricted 421,407,795 48.8 47.98 3.16
Urban Restricted 246,273,013 55.4 34.76 1.96
Urban UnRestricted 281,207,147 35.8 23.21 2.89
Subtotal 948,887,954 191.26 9.98
Off-Model Project
Emission Benefits-21.60 -2.06
Region Total 948,887,954 169.66 7.92
(Kg/Year) 153,914 7,183
Cambria
Annual VMTSpeed
(mph)
Cambria County PM2.5 Annual Emission Summary2040 FFY17 TIP Conformity (By Road Type)
County Road Type
Emissions (Tons/Year)
NOx PM2.5
Motorcycle 6,109,861 5.35 0.17
Passenger Car 478,610,020 39.49 2.93
Passenger Truck 315,663,310 41.99 3.45
Light Commercial Truck 79,746,690 11.89 0.92
Intercity Bus 58,516 0.07 0.00
Transit Bus 3,881,729 4.60 0.11
School Bus 942,226 0.78 0.02
Refuse Truck 1,077,001 1.37 0.05
Single Unit Short-haul Truck 22,454,264 13.93 0.55
Single Unit Long-haul Truck 1,224,283 0.82 0.03
Motor Home 855,452 0.57 0.02
Combination Short-haul Truck 8,672,494 10.98 0.34
Combination Long-haul Truck 29,592,108 59.42 1.38
Subtotal 948,887,954 191.26 9.98
Off-Model Project
Emission Benefits-21.60 -2.06
Region Total 948,887,954 169.66 7.92
(Kg/Year) 153,914 7,183
Cambria
Cambria County PM2.5 Annual Emission Summary2040 FFY17 TIP Conformity (By Source Type)
County Source Type Annual VMT

JATS: Transportation Conformity Analysis
2017 TIP and 2040 LRTP
Page |36 Air Quality Conformity Report
Emissions (Tons/Year)
NOx PM2.5
Running Exhaust 105.96 2.89
Start Exhaust 64.39 1.85
Brakewear 0.00 3.07
Tirewear 0.00 1.51
Evap Permeation 0.00 0.00
Evap Fuel Vapor Venting 0.00 0.00
Evap Fuel Leaks 0.00 0.00
Crankcase Running Exhaust 0.00 0.53
Crankcase Start Exhaust 0.00 0.02
Crankcase Extended Idle Exhaust 0.00 0.01
Extended Idle Exhaust 19.75 0.02
Auxiliary Power Exhaust 1.16 0.07
Subtotal 191.26 9.98
Off-Model Project
Emission Benefits-21.60 -2.06
Region Total 169.66 7.92
(Kg/Year) 153,914 7,183
Cambria
Cambria County PM2.5 Annual Emission Summary2040 FFY17 TIP Conformity (By Emission Process)
County Emission Process
JATS: Transportation Conformity Analysis
2017 TIP and 2040 LRTP
Air Quality Conformity Report Page |37
ATTACHMENT C
Sample MOVES Data Importer (XML) Input File
and
Run Specification (MRS) Input File
(Sample for 2017 Annual Runs)

JATS: Transportation Conformity Analysis
2017 TIP and 2040 LRTP
Page |38 Air Quality Conformity Report
MOVES County Data Manager Importer File – Annual Run (MOVESIMPORTER.XML) <moves>
<importer mode="county" >
<filters>
<geographicselections>
<geographicselection type="COUNTY" key="42021" description="PENNSYLVANIA - Cambria County"/>
</geographicselections>
<timespan>
<year key="2017"/>
<month id="00"/>
<day id="2"/>
<day id="5"/>
<beginhour id="1"/>
<endhour id="24"/>
<aggregateBy key="Hour"/>
</timespan>
<onroadvehicleselections>
<onroadvehicleselection fueltypeid="2" fueltypedesc="Diesel Fuel" sourcetypeid="62" sourcetypename="Combination Long-haul
Truck"/>
<onroadvehicleselection fueltypeid="2" fueltypedesc="Diesel Fuel" sourcetypeid="61" sourcetypename="Combination Short-haul
Truck"/>
<onroadvehicleselection fueltypeid="2" fueltypedesc="Diesel Fuel" sourcetypeid="41" sourcetypename="Intercity Bus"/>
<onroadvehicleselection fueltypeid="2" fueltypedesc="Diesel Fuel" sourcetypeid="32" sourcetypename="Light Commercial Truck"/>
<onroadvehicleselection fueltypeid="2" fueltypedesc="Diesel Fuel" sourcetypeid="54" sourcetypename="Motor Home"/>
<onroadvehicleselection fueltypeid="2" fueltypedesc="Diesel Fuel" sourcetypeid="11" sourcetypename="Motorcycle"/>
<onroadvehicleselection fueltypeid="2" fueltypedesc="Diesel Fuel" sourcetypeid="21" sourcetypename="Passenger Car"/>
<onroadvehicleselection fueltypeid="2" fueltypedesc="Diesel Fuel" sourcetypeid="31" sourcetypename="Passenger Truck"/>
<onroadvehicleselection fueltypeid="2" fueltypedesc="Diesel Fuel" sourcetypeid="51" sourcetypename="Refuse Truck"/>
<onroadvehicleselection fueltypeid="2" fueltypedesc="Diesel Fuel" sourcetypeid="43" sourcetypename="School Bus"/>
<onroadvehicleselection fueltypeid="2" fueltypedesc="Diesel Fuel" sourcetypeid="53" sourcetypename="Single Unit Long-haul
Truck"/>
<onroadvehicleselection fueltypeid="2" fueltypedesc="Diesel Fuel" sourcetypeid="52" sourcetypename="Single Unit Short-haul
Truck"/>
<onroadvehicleselection fueltypeid="2" fueltypedesc="Diesel Fuel" sourcetypeid="42" sourcetypename="Transit Bus"/>
<onroadvehicleselection fueltypeid="1" fueltypedesc="Gasoline" sourcetypeid="62" sourcetypename="Combination Long-haul
Truck"/>
<onroadvehicleselection fueltypeid="1" fueltypedesc="Gasoline" sourcetypeid="61" sourcetypename="Combination Short-haul
Truck"/>
<onroadvehicleselection fueltypeid="1" fueltypedesc="Gasoline" sourcetypeid="41" sourcetypename="Intercity Bus"/>
<onroadvehicleselection fueltypeid="1" fueltypedesc="Gasoline" sourcetypeid="32" sourcetypename="Light Commercial Truck"/>
<onroadvehicleselection fueltypeid="1" fueltypedesc="Gasoline" sourcetypeid="54" sourcetypename="Motor Home"/>
<onroadvehicleselection fueltypeid="1" fueltypedesc="Gasoline" sourcetypeid="11" sourcetypename="Motorcycle"/>
<onroadvehicleselection fueltypeid="1" fueltypedesc="Gasoline" sourcetypeid="21" sourcetypename="Passenger Car"/>
<onroadvehicleselection fueltypeid="1" fueltypedesc="Gasoline" sourcetypeid="31" sourcetypename="Passenger Truck"/>
<onroadvehicleselection fueltypeid="1" fueltypedesc="Gasoline" sourcetypeid="51" sourcetypename="Refuse Truck"/>
<onroadvehicleselection fueltypeid="1" fueltypedesc="Gasoline" sourcetypeid="43" sourcetypename="School Bus"/>
<onroadvehicleselection fueltypeid="1" fueltypedesc="Gasoline" sourcetypeid="53" sourcetypename="Single Unit Long-haul Truck"/>
<onroadvehicleselection fueltypeid="1" fueltypedesc="Gasoline" sourcetypeid="52" sourcetypename="Single Unit Short-haul Truck"/>
<onroadvehicleselection fueltypeid="1" fueltypedesc="Gasoline" sourcetypeid="42" sourcetypename="Transit Bus"/>
<onroadvehicleselection fueltypeid="3" fueltypedesc="Compressed Natural Gas (CNG)" sourcetypeid="62"
sourcetypename="Combination Long-haul Truck"/>
<onroadvehicleselection fueltypeid="3" fueltypedesc="Compressed Natural Gas (CNG)" sourcetypeid="61"
sourcetypename="Combination Short-haul Truck"/>
<onroadvehicleselection fueltypeid="3" fueltypedesc="Compressed Natural Gas (CNG)" sourcetypeid="41"
sourcetypename="Intercity Bus"/>
<onroadvehicleselection fueltypeid="3" fueltypedesc="Compressed Natural Gas (CNG)" sourcetypeid="32" sourcetypename="Light
Commercial Truck"/>
<onroadvehicleselection fueltypeid="3" fueltypedesc="Compressed Natural Gas (CNG)" sourcetypeid="54" sourcetypename="Motor
Home"/>
<onroadvehicleselection fueltypeid="3" fueltypedesc="Compressed Natural Gas (CNG)" sourcetypeid="11"
sourcetypename="Motorcycle"/>
<onroadvehicleselection fueltypeid="3" fueltypedesc="Compressed Natural Gas (CNG)" sourcetypeid="21"
sourcetypename="Passenger Car"/>
<onroadvehicleselection fueltypeid="3" fueltypedesc="Compressed Natural Gas (CNG)" sourcetypeid="31"

JATS: Transportation Conformity Analysis
2017 TIP and 2040 LRTP
Air Quality Conformity Report Page |39
sourcetypename="Passenger Truck"/>
<onroadvehicleselection fueltypeid="3" fueltypedesc="Compressed Natural Gas (CNG)" sourcetypeid="51" sourcetypename="Refuse
Truck"/>
<onroadvehicleselection fueltypeid="3" fueltypedesc="Compressed Natural Gas (CNG)" sourcetypeid="43" sourcetypename="School
Bus"/>
<onroadvehicleselection fueltypeid="3" fueltypedesc="Compressed Natural Gas (CNG)" sourcetypeid="53" sourcetypename="Single
Unit Long-haul Truck"/>
<onroadvehicleselection fueltypeid="3" fueltypedesc="Compressed Natural Gas (CNG)" sourcetypeid="52" sourcetypename="Single
Unit Short-haul Truck"/>
<onroadvehicleselection fueltypeid="3" fueltypedesc="Compressed Natural Gas (CNG)" sourcetypeid="42" sourcetypename="Transit
Bus"/>
<onroadvehicleselection fueltypeid="5" fueltypedesc="Ethanol (E-85)" sourcetypeid="62" sourcetypename="Combination Long-haul
Truck"/>
<onroadvehicleselection fueltypeid="5" fueltypedesc="Ethanol (E-85)" sourcetypeid="61" sourcetypename="Combination Short-haul
Truck"/>
<onroadvehicleselection fueltypeid="5" fueltypedesc="Ethanol (E-85)" sourcetypeid="41" sourcetypename="Intercity Bus"/>
<onroadvehicleselection fueltypeid="5" fueltypedesc="Ethanol (E-85)" sourcetypeid="32" sourcetypename="Light Commercial
Truck"/>
<onroadvehicleselection fueltypeid="5" fueltypedesc="Ethanol (E-85)" sourcetypeid="54" sourcetypename="Motor Home"/>
<onroadvehicleselection fueltypeid="5" fueltypedesc="Ethanol (E-85)" sourcetypeid="11" sourcetypename="Motorcycle"/>
<onroadvehicleselection fueltypeid="5" fueltypedesc="Ethanol (E-85)" sourcetypeid="21" sourcetypename="Passenger Car"/>
<onroadvehicleselection fueltypeid="5" fueltypedesc="Ethanol (E-85)" sourcetypeid="31" sourcetypename="Passenger Truck"/>
<onroadvehicleselection fueltypeid="5" fueltypedesc="Ethanol (E-85)" sourcetypeid="51" sourcetypename="Refuse Truck"/>
<onroadvehicleselection fueltypeid="5" fueltypedesc="Ethanol (E-85)" sourcetypeid="43" sourcetypename="School Bus"/>
<onroadvehicleselection fueltypeid="5" fueltypedesc="Ethanol (E-85)" sourcetypeid="53" sourcetypename="Single Unit Long-haul
Truck"/>
<onroadvehicleselection fueltypeid="5" fueltypedesc="Ethanol (E-85)" sourcetypeid="52" sourcetypename="Single Unit Short-haul
Truck"/>
<onroadvehicleselection fueltypeid="5" fueltypedesc="Ethanol (E-85)" sourcetypeid="42" sourcetypename="Transit Bus"/>
</onroadvehicleselections>
<offroadvehicleselections>
</offroadvehicleselections>
<offroadvehiclesccs>
</offroadvehiclesccs>
<roadtypes>
<roadtype roadtypeid="1" roadtypename="Off-Network"/>
<roadtype roadtypeid="2" roadtypename="Rural Restricted Access"/>
<roadtype roadtypeid="3" roadtypename="Rural Unrestricted Access"/>
<roadtype roadtypeid="4" roadtypename="Urban Restricted Access"/>
<roadtype roadtypeid="5" roadtypename="Urban Unrestricted Access"/>
</roadtypes>
</filters>
<databaseselection servername="localhost" databasename="42021_2017_00_25_PM_mi"/>
<agedistribution>
<description><![CDATA[]]></description>
<parts>
<sourceTypeAgeDistribution>
<filename>C:\PAMOVES14\MOVESInputs\AgeDistribution\MOVES2014\14Reg_RepCty\2017\42027_2017_SourceTypeAgeDistribution.csv</file
name>
</sourceTypeAgeDistribution>
</parts>
</agedistribution>
<avgspeeddistribution>
<description><![CDATA[]]></description>
<parts>
<avgSpeedDistribution>
<filename>C:\PAMOVES14\Out\Cambria\\42021_2017_00_25_PM\CDM\avgSpeedDistribution.csv</filename>
</avgSpeedDistribution>
</parts>
</avgspeeddistribution>
<imcoverage>
<description><![CDATA[]]></description>
<parts>
JATS: Transportation Conformity Analysis
2017 TIP and 2040 LRTP
Page |40 Air Quality Conformity Report
<imcoverage>
<filename>C:\PAMOVES14\MOVESInputs\IM\42000_2017_IMCoverage.csv</filename>
</imcoverage>
</parts>
</imcoverage>
<fuel>
<description><![CDATA[]]></description>
<parts>
<FuelSupply>
<filename>C:\PAMOVES14\MOVESInputs\Fuel\MOVES2014\42000_FuelSupply_2011_2050.csv</filename>
</FuelSupply>
<FuelFormulation>
<filename>C:\PAMOVES14\MOVESInputs\Fuel\MOVES2014\42000_FuelFormulation_2011_2050.csv</filename>
</FuelFormulation>
<FuelUsageFraction>
<filename>C:\PAMOVES14\MOVESInputs\Fuel\MOVES2014\MOVESDefaults\42000_fuelusagefraction_MOVES2014Defaults.csv</filename>
</FuelUsageFraction>
<AVFT>
<filename></filename>
</AVFT>
</parts>
</fuel>
<zonemonthhour>
<description><![CDATA[]]></description>
<parts>
<zoneMonthHour>
<filename>C:\PAMOVES14\MOVESInputs\Meteorology\2008\42021_2008_met.csv</filename>
</zoneMonthHour>
</parts>
</zonemonthhour>
<roadtypedistribution>
<description><![CDATA[]]></description>
<parts>
<roadTypeDistribution>
<filename>C:\PAMOVES14\Out\Cambria\\42021_2017_00_25_PM\CDM\roadTypeDistribution.csv</filename>
</roadTypeDistribution>
</parts>
</roadtypedistribution>
<sourcetypepopulation>
<description><![CDATA[]]></description>
<parts>
<sourceTypeYear>
<filename>C:\PAMOVES14\Out\Cambria\\42021_2017_00_25_PM\CDM\SourceTypePopulation.csv</filename>
</sourceTypeYear>
</parts>
</sourcetypepopulation>
<rampfraction>
<description><![CDATA[]]></description>
<parts>
<roadType>
<filename>C:\PAMOVES14\MOVESInputs\RampFraction\rampfraction_defaults.csv</filename>
</roadType>
</parts>
</rampfraction>
<vehicletypevmt>
<description><![CDATA[]]></description>
<parts>
<hpmsVTypeYear>
<filename>C:\PAMOVES14\Out\Cambria\\42021_2017_00_25_PM\CDM\hpmsVTypeYear.csv</filename>
</hpmsVTypeYear>
<monthvmtfraction>
<filename>C:\PAMOVES14\Out\Cambria\\42021_2017_00_25_PM\CDM\NotUsed\MonthVMTFraction_M2014AB_Import.csv</filename>
</monthvmtfraction>
<dayvmtfraction>
JATS: Transportation Conformity Analysis
2017 TIP and 2040 LRTP
Air Quality Conformity Report Page |41
<filename>C:\PAMOVES14\MOVESInputs\MonthDayHourFractions\dayvmtfraction_avgday.csv</filename>
</dayvmtfraction>
<hourvmtfraction>
<filename>C:\PAMOVES14\Out\Cambria\\42021_2017_00_25_PM\CDM\hourvmtfraction.csv</filename>
</hourvmtfraction>
</parts>
</vehicletypevmt>
<starts>
<description><![CDATA[]]></description>
<parts>
<startsPerDay>
<filename></filename>
</startsPerDay>
<startsHourFraction>
<filename></filename>
</startsHourFraction>
<startsSourceTypeFraction>
<filename></filename>
</startsSourceTypeFraction>
<startsMonthAdjust>
<filename></filename>
</startsMonthAdjust>
<importStartsOpModeDistribution>
<filename></filename>
</importStartsOpModeDistribution>
<Starts>
<filename></filename>
</Starts>
</parts>
</starts>
<hotelling>
<description><![CDATA[]]></description>
<parts>
<hotellingActivityDistribution>
<filename>C:\PAMOVES14\MOVESInputs\Hotelling_Hours\42000_Hotelling.txt</filename>
</hotellingActivityDistribution>
<hotellingHours>
<filename>C:\PAMOVES14\MOVESInputs\Hotelling_Hours\High_GFact\2017\42021_2017_HotellingHours.txt</filename>
</hotellingHours>
</parts>
</hotelling>
<onroadretrofit>
<description><![CDATA[]]></description>
<parts>
<onRoadRetrofit>
<filename></filename>
</onRoadRetrofit>
</parts>
</onroadretrofit>
<generic>
<description><![CDATA[]]></description>
<parts>
<anytable>
<tablename>regioncounty</tablename>
<filename>C:\PAMOVES14\MOVESInputs\Fuel\MOVES2014\MOVESDefaults\42000_RegionCounty_MOVES2014Defaults.csv</filename>
</anytable>
</parts>
</generic>
</importer>
</moves>

JATS: Transportation Conformity Analysis
2017 TIP and 2040 LRTP
Page |42 Air Quality Conformity Report
MOVES Run Specification File – Annual Run (MOVESRUN.MRS)
<runspec version="MOVES2014-20141021">
<description><![CDATA[MOVES2014 RunSpec Created by CENTRAL4 Scenario: CAMB 2017 ANNUAL AVG PM Emission Inventory with user's
data]]></description>
<models>
<model value="ONROAD"/>
</models>
<modelscale value="INV"/>
<modeldomain value="SINGLE"/>
<geographicselections>
<geographicselection type="COUNTY" key="42021" description="PENNSYLVANIA - Cambria County"/>
</geographicselections>
<timespan>
<year key="2017"/>
<month id="1"/>
<month id="2"/>
<month id="3"/>
<month id="4"/>
<month id="5"/>
<month id="6"/>
<month id="7"/>
<month id="8"/>
<month id="9"/>
<month id="10"/>
<month id="11"/>
<month id="12"/>
<day id="2"/>
<day id="5"/>
<beginhour id="1"/>
<endhour id="24"/>
<aggregateBy key="Hour"/>
</timespan>
<onroadvehicleselections>
<onroadvehicleselection fueltypeid="3" fueltypedesc="Compressed Natural Gas (CNG)" sourcetypeid="11" sourcetypename="Motorcycle"/>
<onroadvehicleselection fueltypeid="3" fueltypedesc="Compressed Natural Gas (CNG)" sourcetypeid="21" sourcetypename="Passenger Car"/>
<onroadvehicleselection fueltypeid="3" fueltypedesc="Compressed Natural Gas (CNG)" sourcetypeid="31" sourcetypename="Passenger
Truck"/>
<onroadvehicleselection fueltypeid="3" fueltypedesc="Compressed Natural Gas (CNG)" sourcetypeid="32" sourcetypename="Light Commercial
Truck"/>
<onroadvehicleselection fueltypeid="2" fueltypedesc="Diesel Fuel" sourcetypeid="11" sourcetypename="Motorcycle"/>
<onroadvehicleselection fueltypeid="2" fueltypedesc="Diesel Fuel" sourcetypeid="21" sourcetypename="Passenger Car"/>
<onroadvehicleselection fueltypeid="2" fueltypedesc="Diesel Fuel" sourcetypeid="31" sourcetypename="Passenger Truck"/>
<onroadvehicleselection fueltypeid="2" fueltypedesc="Diesel Fuel" sourcetypeid="32" sourcetypename="Light Commercial Truck"/>
<onroadvehicleselection fueltypeid="1" fueltypedesc="Gasoline" sourcetypeid="11" sourcetypename="Motorcycle"/>
<onroadvehicleselection fueltypeid="1" fueltypedesc="Gasoline" sourcetypeid="21" sourcetypename="Passenger Car"/>
<onroadvehicleselection fueltypeid="1" fueltypedesc="Gasoline" sourcetypeid="31" sourcetypename="Passenger Truck"/>
<onroadvehicleselection fueltypeid="1" fueltypedesc="Gasoline" sourcetypeid="32" sourcetypename="Light Commercial Truck"/>
<onroadvehicleselection fueltypeid="5" fueltypedesc="Ethanol (E-85)" sourcetypeid="11" sourcetypename="Motorcycle"/>
<onroadvehicleselection fueltypeid="5" fueltypedesc="Ethanol (E-85)" sourcetypeid="21" sourcetypename="Passenger Car"/>
<onroadvehicleselection fueltypeid="5" fueltypedesc="Ethanol (E-85)" sourcetypeid="31" sourcetypename="Passenger Truck"/>
<onroadvehicleselection fueltypeid="5" fueltypedesc="Ethanol (E-85)" sourcetypeid="32" sourcetypename="Light Commercial Truck"/>
<onroadvehicleselection fueltypeid="3" fueltypedesc="Compressed Natural Gas (CNG)" sourcetypeid="41" sourcetypename="Intercity Bus"/>
<onroadvehicleselection fueltypeid="3" fueltypedesc="Compressed Natural Gas (CNG)" sourcetypeid="42" sourcetypename="Transit Bus"/>
<onroadvehicleselection fueltypeid="3" fueltypedesc="Compressed Natural Gas (CNG)" sourcetypeid="43" sourcetypename="School Bus"/>
<onroadvehicleselection fueltypeid="2" fueltypedesc="Diesel Fuel" sourcetypeid="41" sourcetypename="Intercity Bus"/>
<onroadvehicleselection fueltypeid="2" fueltypedesc="Diesel Fuel" sourcetypeid="42" sourcetypename="Transit Bus"/>
<onroadvehicleselection fueltypeid="2" fueltypedesc="Diesel Fuel" sourcetypeid="43" sourcetypename="School Bus"/>
<onroadvehicleselection fueltypeid="1" fueltypedesc="Gasoline" sourcetypeid="41" sourcetypename="Intercity Bus"/>
<onroadvehicleselection fueltypeid="1" fueltypedesc="Gasoline" sourcetypeid="42" sourcetypename="Transit Bus"/>
<onroadvehicleselection fueltypeid="1" fueltypedesc="Gasoline" sourcetypeid="43" sourcetypename="School Bus"/>
<onroadvehicleselection fueltypeid="5" fueltypedesc="Ethanol (E-85)" sourcetypeid="41" sourcetypename="Intercity Bus"/>

JATS: Transportation Conformity Analysis
2017 TIP and 2040 LRTP
Air Quality Conformity Report Page |43
<onroadvehicleselection fueltypeid="5" fueltypedesc="Ethanol (E-85)" sourcetypeid="42" sourcetypename="Transit Bus"/>
<onroadvehicleselection fueltypeid="5" fueltypedesc="Ethanol (E-85)" sourcetypeid="43" sourcetypename="School Bus"/>
<onroadvehicleselection fueltypeid="3" fueltypedesc="Compressed Natural Gas (CNG)" sourcetypeid="51" sourcetypename="Refuse Truck"/>
<onroadvehicleselection fueltypeid="3" fueltypedesc="Compressed Natural Gas (CNG)" sourcetypeid="52" sourcetypename="Single Unit Short-
haul Truck"/>
<onroadvehicleselection fueltypeid="3" fueltypedesc="Compressed Natural Gas (CNG)" sourcetypeid="53" sourcetypename="Single Unit Long-
haul Truck"/>
<onroadvehicleselection fueltypeid="3" fueltypedesc="Compressed Natural Gas (CNG)" sourcetypeid="54" sourcetypename="Motor Home"/>
<onroadvehicleselection fueltypeid="3" fueltypedesc="Compressed Natural Gas (CNG)" sourcetypeid="61" sourcetypename="Combination
Short-haul Truck"/>
<onroadvehicleselection fueltypeid="3" fueltypedesc="Compressed Natural Gas (CNG)" sourcetypeid="62" sourcetypename="Combination
Long-haul Truck"/>
<onroadvehicleselection fueltypeid="2" fueltypedesc="Diesel Fuel" sourcetypeid="51" sourcetypename="Refuse Truck"/>
<onroadvehicleselection fueltypeid="2" fueltypedesc="Diesel Fuel" sourcetypeid="52" sourcetypename="Single Unit Short-haul Truck"/>
<onroadvehicleselection fueltypeid="2" fueltypedesc="Diesel Fuel" sourcetypeid="53" sourcetypename="Single Unit Long-haul Truck"/>
<onroadvehicleselection fueltypeid="2" fueltypedesc="Diesel Fuel" sourcetypeid="54" sourcetypename="Motor Home"/>
<onroadvehicleselection fueltypeid="2" fueltypedesc="Diesel Fuel" sourcetypeid="61" sourcetypename="Combination Short-haul Truck"/>
<onroadvehicleselection fueltypeid="2" fueltypedesc="Diesel Fuel" sourcetypeid="62" sourcetypename="Combination Long-haul Truck"/>
<onroadvehicleselection fueltypeid="1" fueltypedesc="Gasoline" sourcetypeid="51" sourcetypename="Refuse Truck"/>
<onroadvehicleselection fueltypeid="1" fueltypedesc="Gasoline" sourcetypeid="52" sourcetypename="Single Unit Short-haul Truck"/>
<onroadvehicleselection fueltypeid="1" fueltypedesc="Gasoline" sourcetypeid="53" sourcetypename="Single Unit Long-haul Truck"/>
<onroadvehicleselection fueltypeid="1" fueltypedesc="Gasoline" sourcetypeid="54" sourcetypename="Motor Home"/>
<onroadvehicleselection fueltypeid="1" fueltypedesc="Gasoline" sourcetypeid="61" sourcetypename="Combination Short-haul Truck"/>
<onroadvehicleselection fueltypeid="1" fueltypedesc="Gasoline" sourcetypeid="62" sourcetypename="Combination Long-haul Truck"/>
<onroadvehicleselection fueltypeid="5" fueltypedesc="Ethanol (E-85)" sourcetypeid="51" sourcetypename="Refuse Truck"/>
<onroadvehicleselection fueltypeid="5" fueltypedesc="Ethanol (E-85)" sourcetypeid="52" sourcetypename="Single Unit Short-haul Truck"/>
<onroadvehicleselection fueltypeid="5" fueltypedesc="Ethanol (E-85)" sourcetypeid="53" sourcetypename="Single Unit Long-haul Truck"/>
<onroadvehicleselection fueltypeid="5" fueltypedesc="Ethanol (E-85)" sourcetypeid="54" sourcetypename="Motor Home"/>
<onroadvehicleselection fueltypeid="5" fueltypedesc="Ethanol (E-85)" sourcetypeid="61" sourcetypename="Combination Short-haul Truck"/>
<onroadvehicleselection fueltypeid="5" fueltypedesc="Ethanol (E-85)" sourcetypeid="62" sourcetypename="Combination Long-haul Truck"/>
</onroadvehicleselections>
<offroadvehicleselections>
</offroadvehicleselections>
<offroadvehiclesccs>
</offroadvehiclesccs>
<roadtypes separateramps="false">
<roadtype roadtypeid="1" roadtypename="Off-Network" modelCombination="M1"/>
<roadtype roadtypeid="2" roadtypename="Rural Restricted Access" modelCombination="M1"/>
<roadtype roadtypeid="3" roadtypename="Rural Unrestricted Access" modelCombination="M1"/>
<roadtype roadtypeid="4" roadtypename="Urban Restricted Access" modelCombination="M1"/>
<roadtype roadtypeid="5" roadtypename="Urban Unrestricted Access" modelCombination="M1"/>
</roadtypes>
<pollutantprocessassociations>
<pollutantprocessassociation pollutantkey="3" pollutantname="Oxides of Nitrogen" processkey="1" processname="Running Exhaust"/>
<pollutantprocessassociation pollutantkey="3" pollutantname="Oxides of Nitrogen" processkey="2" processname="Start Exhaust"/>
<pollutantprocessassociation pollutantkey="3" pollutantname="Oxides of Nitrogen" processkey="15" processname="Crankcase Running
Exhaust"/>
<pollutantprocessassociation pollutantkey="3" pollutantname="Oxides of Nitrogen" processkey="16" processname="Crankcase Start
Exhaust"/>
<pollutantprocessassociation pollutantkey="3" pollutantname="Oxides of Nitrogen" processkey="17" processname="Crankcase Extended Idle
Exhaust"/>
<pollutantprocessassociation pollutantkey="3" pollutantname="Oxides of Nitrogen" processkey="90" processname="Extended Idle Exhaust"/>
<pollutantprocessassociation pollutantkey="3" pollutantname="Oxides of Nitrogen (NOx)" processkey="91" processname="Auxiliary Power
Exhaust"/>
<pollutantprocessassociation pollutantkey="79" pollutantname="Non-Methane Hydrocarbons" processkey="1" processname="Running
Exhaust"/>
<pollutantprocessassociation pollutantkey="79" pollutantname="Non-Methane Hydrocarbons" processkey="2" processname="Start Exhaust"/>
<pollutantprocessassociation pollutantkey="79" pollutantname="Non-Methane Hydrocarbons" processkey="11" processname="Evap
Permeation"/>
<pollutantprocessassociation pollutantkey="79" pollutantname="Non-Methane Hydrocarbons" processkey="12" processname="Evap Fuel
Vapor Venting"/>

JATS: Transportation Conformity Analysis
2017 TIP and 2040 LRTP
Page |44 Air Quality Conformity Report
<pollutantprocessassociation pollutantkey="79" pollutantname="Non-Methane Hydrocarbons" processkey="13" processname="Evap Fuel
Leaks"/>
<pollutantprocessassociation pollutantkey="79" pollutantname="Non-Methane Hydrocarbons" processkey="15" processname="Crankcase
Running Exhaust"/>
<pollutantprocessassociation pollutantkey="79" pollutantname="Non-Methane Hydrocarbons" processkey="16" processname="Crankcase
Start Exhaust"/>
<pollutantprocessassociation pollutantkey="79" pollutantname="Non-Methane Hydrocarbons" processkey="17" processname="Crankcase
Extended Idle Exhaust"/>
<pollutantprocessassociation pollutantkey="79" pollutantname="Non-Methane Hydrocarbons" processkey="90" processname="Extended Idle
Exhaust"/>
<pollutantprocessassociation pollutantkey="1" pollutantname="Total Gaseous Hydrocarbons" processkey="1" processname="Running
Exhaust"/>
<pollutantprocessassociation pollutantkey="1" pollutantname="Total Gaseous Hydrocarbons" processkey="2" processname="Start Exhaust"/>
<pollutantprocessassociation pollutantkey="1" pollutantname="Total Gaseous Hydrocarbons" processkey="11" processname="Evap
Permeation"/>
<pollutantprocessassociation pollutantkey="1" pollutantname="Total Gaseous Hydrocarbons" processkey="12" processname="Evap Fuel Vapor
Venting"/>
<pollutantprocessassociation pollutantkey="1" pollutantname="Total Gaseous Hydrocarbons" processkey="13" processname="Evap Fuel
Leaks"/>
<pollutantprocessassociation pollutantkey="1" pollutantname="Total Gaseous Hydrocarbons" processkey="15" processname="Crankcase
Running Exhaust"/>
<pollutantprocessassociation pollutantkey="1" pollutantname="Total Gaseous Hydrocarbons" processkey="16" processname="Crankcase Start
Exhaust"/>
<pollutantprocessassociation pollutantkey="1" pollutantname="Total Gaseous Hydrocarbons" processkey="17" processname="Crankcase
Extended Idle Exhaust"/>
<pollutantprocessassociation pollutantkey="1" pollutantname="Total Gaseous Hydrocarbons" processkey="90" processname="Extended Idle
Exhaust"/>
<pollutantprocessassociation pollutantkey="87" pollutantname="Volatile Organic Compounds" processkey="1" processname="Running
Exhaust"/>
<pollutantprocessassociation pollutantkey="87" pollutantname="Volatile Organic Compounds" processkey="2" processname="Start Exhaust"/>
<pollutantprocessassociation pollutantkey="87" pollutantname="Volatile Organic Compounds" processkey="11" processname="Evap
Permeation"/>
<pollutantprocessassociation pollutantkey="87" pollutantname="Volatile Organic Compounds" processkey="12" processname="Evap Fuel
Vapor Venting"/>
<pollutantprocessassociation pollutantkey="87" pollutantname="Volatile Organic Compounds" processkey="13" processname="Evap Fuel
Leaks"/>
<pollutantprocessassociation pollutantkey="87" pollutantname="Volatile Organic Compounds" processkey="15" processname="Crankcase
Running Exhaust"/>
<pollutantprocessassociation pollutantkey="87" pollutantname="Volatile Organic Compounds" processkey="16" processname="Crankcase
Start Exhaust"/>
<pollutantprocessassociation pollutantkey="87" pollutantname="Volatile Organic Compounds" processkey="17" processname="Crankcase
Extended Idle Exhaust"/>
<pollutantprocessassociation pollutantkey="87" pollutantname="Volatile Organic Compounds" processkey="90" processname="Extended Idle
Exhaust"/>
<pollutantprocessassociation pollutantkey="79" pollutantname="Non-Methane Hydrocarbons" processkey="91" processname="Auxiliary
Power Exhaust"/>
<pollutantprocessassociation pollutantkey="1" pollutantname="Total Gaseous Hydrocarbons" processkey="91" processname="Auxiliary Power
Exhaust"/>
<pollutantprocessassociation pollutantkey="87" pollutantname="Volatile Organic Compounds" processkey="91" processname="Auxiliary
Power Exhaust"/>
<pollutantprocessassociation pollutantkey="118" pollutantname="Composite - NonECPM" processkey="1" processname="Running Exhaust"/>
<pollutantprocessassociation pollutantkey="118" pollutantname="Composite - NonECPM" processkey="2" processname="Start Exhaust"/>
<pollutantprocessassociation pollutantkey="118" pollutantname="Composite - NonECPM" processkey="90" processname="Extended Idle
Exhaust"/>
<pollutantprocessassociation pollutantkey="118" pollutantname="Composite - NonECPM" processkey="91" processname="Auxiliary Power
Exhaust"/>
<pollutantprocessassociation pollutantkey="112" pollutantname="Elemental Carbon" processkey="1" processname="Running Exhaust"/>
<pollutantprocessassociation pollutantkey="112" pollutantname="Elemental Carbon" processkey="2" processname="Start Exhaust"/>
<pollutantprocessassociation pollutantkey="112" pollutantname="Elemental Carbon" processkey="90" processname="Extended Idle
Exhaust"/>
<pollutantprocessassociation pollutantkey="112" pollutantname="Elemental Carbon" processkey="91" processname="Auxiliary Power
Exhaust"/>
<pollutantprocessassociation pollutantkey="119" pollutantname="H2O (aerosol)" processkey="1" processname="Running Exhaust"/>

JATS: Transportation Conformity Analysis
2017 TIP and 2040 LRTP
Air Quality Conformity Report Page |45
<pollutantprocessassociation pollutantkey="119" pollutantname="H2O (aerosol)" processkey="2" processname="Start Exhaust"/>
<pollutantprocessassociation pollutantkey="119" pollutantname="H2O (aerosol)" processkey="90" processname="Extended Idle Exhaust"/>
<pollutantprocessassociation pollutantkey="119" pollutantname="H2O (aerosol)" processkey="91" processname="Auxiliary Power Exhaust"/>
<pollutantprocessassociation pollutantkey="110" pollutantname="Primary Exhaust PM2.5 - Total" processkey="1" processname="Running
Exhaust"/>
<pollutantprocessassociation pollutantkey="110" pollutantname="Primary Exhaust PM2.5 - Total" processkey="2" processname="Start
Exhaust"/>
<pollutantprocessassociation pollutantkey="110" pollutantname="Primary Exhaust PM2.5 - Total" processkey="15" processname="Crankcase
Running Exhaust"/>
<pollutantprocessassociation pollutantkey="110" pollutantname="Primary Exhaust PM2.5 - Total" processkey="16" processname="Crankcase
Start Exhaust"/>
<pollutantprocessassociation pollutantkey="110" pollutantname="Primary Exhaust PM2.5 - Total" processkey="17" processname="Crankcase
Extended Idle Exhaust"/>
<pollutantprocessassociation pollutantkey="110" pollutantname="Primary Exhaust PM2.5 - Total" processkey="90" processname="Extended
Idle Exhaust"/>
<pollutantprocessassociation pollutantkey="110" pollutantname="Primary Exhaust PM2.5 - Total" processkey="91" processname="Auxiliary
Power Exhaust"/>
<pollutantprocessassociation pollutantkey="116" pollutantname="Primary PM2.5 - Brakewear Particulate" processkey="9"
processname="Brakewear"/>
<pollutantprocessassociation pollutantkey="117" pollutantname="Primary PM2.5 - Tirewear Particulate" processkey="10"
processname="Tirewear"/>
<pollutantprocessassociation pollutantkey="115" pollutantname="Sulfate Particulate" processkey="1" processname="Running Exhaust"/>
<pollutantprocessassociation pollutantkey="115" pollutantname="Sulfate Particulate" processkey="2" processname="Start Exhaust"/>
<pollutantprocessassociation pollutantkey="115" pollutantname="Sulfate Particulate" processkey="90" processname="Extended Idle
Exhaust"/>
<pollutantprocessassociation pollutantkey="115" pollutantname="Sulfate Particulate" processkey="91" processname="Auxiliary Power
Exhaust"/>
</pollutantprocessassociations>
<databaseselections>
<databaseselection servername="localhost" databasename="MOVES2014_early_NLEV" description=""/>
<databaseselection servername="localhost" databasename="MOVES2014_calevii08" description=""/>
</databaseselections>
<inputdatabase servername="" databasename="" description=""/>
<uncertaintyparameters uncertaintymodeenabled="false" numberofrunspersimulation="0" numberofsimulations="0"/>
<geographicoutputdetail description="COUNTY"/>
<outputemissionsbreakdownselection>
<modelyear selected="false"/>
<fueltype selected="false"/>
<emissionprocess selected="true"/>
<onroadoffroad selected="true"/>
<roadtype selected="true"/>
<sourceusetype selected="true"/>
<movesvehicletype selected="false"/>
<onroadscc selected="false"/>
<offroadscc selected="false"/>
<estimateuncertainty selected="false" numberOfIterations="2" keepSampledData="false" keepIterations="false"/>
<sector selected="false"/>
<engtechid selected="false"/>
<hpclass selected="false"/>
<regclassid selected="false"/>
</outputemissionsbreakdownselection>
<outputdatabase servername="localhost" databasename="42021_2017_00_25_PM_mo" description=""/>>
<outputtimestep value="Month"/>
<outputvmtdata value="true"/>
<outputsho value="true"/>
<outputsh value="true"/>
<outputshp value="true"/>
<outputshidling value="true"/>
<outputstarts value="true"/>
<outputpopulation value="true"/>
<scaleinputdatabase servername="localhost" databasename="42021_2017_00_25_PM_mi" description=""/>
<pmsize value="0"/>
<outputfactors>
<timefactors selected="true" units="Hours"/>

JATS: Transportation Conformity Analysis
2017 TIP and 2040 LRTP
Page |46 Air Quality Conformity Report
<distancefactors selected="false" units="Miles"/>
<massfactors selected="false" units="Grams" energyunits="Million BTU"/>
</outputfactors>
<savedata>
</savedata>
<donotexecute>
</donotexecute>
<generatordatabase shouldsave="false" servername="" databasename="" description=""/>
<donotperformfinalaggregation selected="false"/>
<lookuptableflags scenarioid="" truncateoutput="false" truncateactivity="false"/>
<internalcontrolstrategies>
<internalcontrolstrategy
classname="gov.epa.otaq.moves.master.implementation.ghg.internalcontrolstrategies.rateofprogress.RateOfProgressStrategy"><![CDATA[
useParameters No
]]></internalcontrolstrategy>
</internalcontrolstrategies>
</runspec>