standard operating procedures for lead monitoring … · • extension cord ... compliance with the...
TRANSCRIPT

Standard Operating Procedures
for Lead Monitoring Using a TSP High-Volume Sampler
State of Alaska Department of Environmental Conservation Division of Air Quality
Air Monitoring and Quality Assurance Section 619 East Ship Creek Ave., Suite 249
Anchorage, AK 99501


Alaska Department of Environmental Conservation Division of Air Quality
Air Monitoring & Quality Assurance 619 East Ship Creek Ave. Suite 249
Anchorage, Alaska 99501 Title: Standard Operating Procedures for Lead Monitoring Using a TSP High-Volume Sampler Version: 1.0 Revision Dated: June 8, 2011
3
Contents 1 General Information............................................................................................................................................ 5
1.1 Introduction ................................................................................................................................................ 5 1.2 Principles of Operation .............................................................................................................................. 5 1.3 Safety Precautions ..................................................................................................................................... 6 1.4 Interferences/Limitations ........................................................................................................................... 6
2 Installation ........................................................................................................................................................... 6 2.1 List of Tools, Equipment and Materials.................................................................................................... 6 2.2 Physical inspection .................................................................................................................................... 7 2.3 Siting Requirements .................................................................................................................................. 7 2.4 Sampler Installation ................................................................................................................................... 7 2.5 Sampler Assembly ..................................................................................................................................... 8
3 TSP Calibration Procedures ............................................................................................................................. 10 3.1 List of Tools, Equipment and Materials.................................................................................................. 10 3.2 Leak check ............................................................................................................................................... 11 3.3 Multi-point calibration ............................................................................................................................. 12 3.4 Single-point Flow Verification Check .................................................................................................... 16
4 TSP Sample Procedures ................................................................................................................................... 17 4.1 List of Tools, Equipment, and Materials................................................................................................. 17 4.2 Preparatory Procedure for Filter Changes ............................................................................................... 17 4.3 On-site Installation and Setup for a Sample Run .................................................................................... 19 4.4 Recovery Procedures for Post Sampling ................................................................................................. 21 4.5 Sample Handling and Shipping Procedures ............................................................................................ 21
5 Sampler Maintenance ....................................................................................................................................... 22 5.1 Mass Flow Sensor .................................................................................................................................... 23 5.2 Dickson Chart Recorder .......................................................................................................................... 25 5.3 Motor Maintenance.................................................................................................................................. 26
6 Performance Audits .......................................................................................................................................... 34 6.1 Audit Criteria Table ................................................................................................................................. 34 6.2 Performance Audit Reporting ................................................................................................................. 34
7 Laboratory Analysis for Lead ........................................................................................................................... 34 8 Data Calculations and Validation ..................................................................................................................... 35
8.1 Calibration Calculations .......................................................................................................................... 35 8.2 Data Calculations ..................................................................................................................................... 35

Alaska Department of Environmental Conservation Division of Air Quality
Air Monitoring & Quality Assurance 619 East Ship Creek Ave. Suite 249
Anchorage, Alaska 99501 Title: Standard Operating Procedures for Lead Monitoring Using a TSP High-Volume Sampler Version: 1.0 Revision Dated: June 8, 2011
4
8.3 Data Validation ........................................................................................................................................ 37 8.4 Quarterly Reports..................................................................................................................................... 38
9 References Cited ............................................................................................................................................... 38

Alaska Department of Environmental Conservation Division of Air Quality
Air Monitoring & Quality Assurance 619 East Ship Creek Ave. Suite 249
Anchorage, Alaska 99501 Title: Standard Operating Procedures for Lead Monitoring Using a TSP High-Volume Sampler Version: 1.0 Revision Dated: June 8, 2011
5
1 General Information
1.1 Introduction
To comply with the November 12, 2008 revision to the National Ambient Air Quality Standard (NAAQS) for lead, the Alaska Department of Environmental Conservation (ADEC), Division of Air Quality, Air Monitoring & Quality Assurance Section established a lead monitoring program. The purpose of this Standard Operating Procedure (SOP) document is to describe the field procedures used to sample for lead in Total Suspended Particulate (TSP) that is particulate matter which is suspended in ambient air and has a mean aerodynamic diameter of up to 25 to 50 micrometers. The objective of this SOP is to formalize procedures to insure the consistent collection of samples and data that meet the data quality required by the revised NAAQS for lead. This SOP manual will encompass all aspects of field operations associated with the collection of the TSP samples. The federal reference method for the determination of suspended particulate matter in the atmosphere (High-Volume Method) is presented in 40 CFR Part 50, Appendix B. Sampler siting, operation and quality assurance regulations are presented in 40 CFR Part 58. The operating procedures presented in this SOP are derived from the above cited regulations, guidance presented in equipment manufacturer instructions, and the EPA Quality Assurance Handbook for Air Pollution Measurement Systems Volumes I and II. The procedures used to analyze TSP samples for the presence of lead will be documented in a separate SOP prepared by the ADEC Environmental Health (EH) Laboratory.
1.2 Principles of Operation
An electrical blower motor draws ambient air into the air sampler where the suspended particulate matter is collected onto a glass-fiber filter. The air flow through the filter is maintained at a constant volumetric flow rate over a 24-hour period from midnight to midnight. Each high volume (Hi-Vol) sampler consists of:
• a shelter housing which is constructed of aluminum; • a rectangular gabled roof inlet that directs air flow onto an 8-inch by 10-inch glass-fiber filter, • a filter cassette that holds the filter in place on a support that draws air through the filter down and
through an attached blower motor; • a flow controller which electronic senses the flow and controls the motor speed to maintain a constant
volumetric flow rate; • a chart recorder to document any variation in flow rate, • a mechanical day timer to automatically start and stop sampler operation; and • an elapse timer to document the sampling period.

Alaska Department of Environmental Conservation Division of Air Quality
Air Monitoring & Quality Assurance 619 East Ship Creek Ave. Suite 249
Anchorage, Alaska 99501 Title: Standard Operating Procedures for Lead Monitoring Using a TSP High-Volume Sampler Version: 1.0 Revision Dated: June 8, 2011
6
The flow controller and blower motor are calibrated with a certified critical orifice flow device (a flow transfer standard) to insure that the required volumetric flow rate is maintained between 1.1 to 1.7 cubic meters of air per minute (m3/min). In English units the flow rate is from 39 to 60 cubic feet per minute (ft3/min). The calibrated elapse time indicator provides an accurate time in minutes for each sample run. The flow data, elapsed time, and data for temperature and pressure are recorded for each sample run day and the data are later used to calculate the total volume of air sampled. Samples are collected according to an EPA schedule and once a month all the collected filter samples are sent to a laboratory for analysis to determine the lead content of particulate matter on each filter. The lead content of the particulate matter on the filter, the flow data, and the sample time collected for each sample are calculated to determine the concentration of lead in the ambient air. The results are expressed as micrograms per cubic meter (µg/m3). As revised in 2008 the NAAQS for lead was established at 0.15 µg/m3 based on a 3-month average.
1.3 Safety Precautions
Only properly trained personnel should perform the TSP Hi Vol filter changes, installation, testing, operation, maintenance or calibration. As with all monitoring equipment, precautions should be taken when working around electricity, power tools and elevated platforms. Repair should be done by properly trained service personnel. Proper protective clothing is also essential when working in wintertime Arctic conditions.
1.4 Interferences/Limitations
The absolute accuracy of the method is undefined because of the complex nature of atmospheric particulate matter and the difficulty in determining the “true” particulate matter concentration. The TSP sampler does not have as sophisticated of a mechanism for distinguishing the largest particle size measured as the Hi-Vol sampler used to measure particulate matter equal to or less than 10 micrometers (PM10).
2 Installation
2.1 List of Tools, Equipment and Materials
• TSP High Vol Sampler System • 8” x 10” Glass-fiber filters which meet EPA Method requirements • Filter cartridge (or filter cassette) • Additional sampler parts and supplies including additional gaskets/seals, spare blower motors, motor
housings, wire nuts, and other items as discussed in Section 6 • Miscellaneous hand tools including: hammer, screwdrivers, wrenches, nut drivers, hex key wrenches,
wire strippers, voltmeter

Alaska Department of Environmental Conservation Division of Air Quality
Air Monitoring & Quality Assurance 619 East Ship Creek Ave. Suite 249
Anchorage, Alaska 99501 Title: Standard Operating Procedures for Lead Monitoring Using a TSP High-Volume Sampler Version: 1.0 Revision Dated: June 8, 2011
7
• Power tools, electric drill, power screwdriver, bits • Extension cord • Personal protective equipment and clothing/footwear for work in wintertime Arctic conditions
2.2 Physical inspection
Upon receipt of all shipped sampling equipment, parts and supplies, inspect equipment and accessories for completeness and/or damage. If a shortage or damage is found, immediately notify the ADEC project manager and/or the equipment vendor to repair or replace damaged equipment or missing supplies.
2.3 Siting Requirements
Samplers should be sited to meet the goals of the specific monitoring project. For routine sampling to determine compliance with the Lead NAAQS, the sample location is described in the Quality Assurance Project Plan (QAPP) for the Alaska Lead Monitoring Program. Samplers will be mounted on a safe, suitable monitoring platform according to the following guidelines:
• TSP samplers must be exposed to unobstructed airflow in all directions. • The sampler inlet must be vertically placed between 2 and 15 meters (m) above ground level. • If a sampler is collocated with other samplers, the minimum spacing between sampler inlets is as
follows: o If collocated with other PM10 or PM2.5 or other low-volume samplers (flow rate < 16.7
L/min), maintain a minimum distance between sampler inlets of 2 m. o If collocated with other total suspended particulate samplers (TSP) or other high-volume
samplers (flow > 1.13 m3/min), maintain a minimum distance between sampler inlets of 2 m. • The site security is to be maintained with a locked fence.
2.4 Sampler Installation
The location of the Hi-Vol sampler will have already been identified as part of the monitoring site selection and is discussed in the QAPP. The sampler will be located on a raised wooden platform or scaffolding. Position the shelter housings to meet the siting requirements as stated above and secure the shelter housing directly to the roof desk or platform surface. Make that sure the shelter housing and the platform are sufficiently secured to withstand high wind conditions.
Alaska Department of Environmental Conservation Division of Air Quality
Air Monitoring & Quality Assurance 619 East Ship Creek Ave. Suite 249
Anchorage, Alaska 99501 Title: Standard Operating Procedures for Lead Monitoring Using a TSP High-Volume Sampler Version: 1.0 Revision Dated: June 8, 2011
8
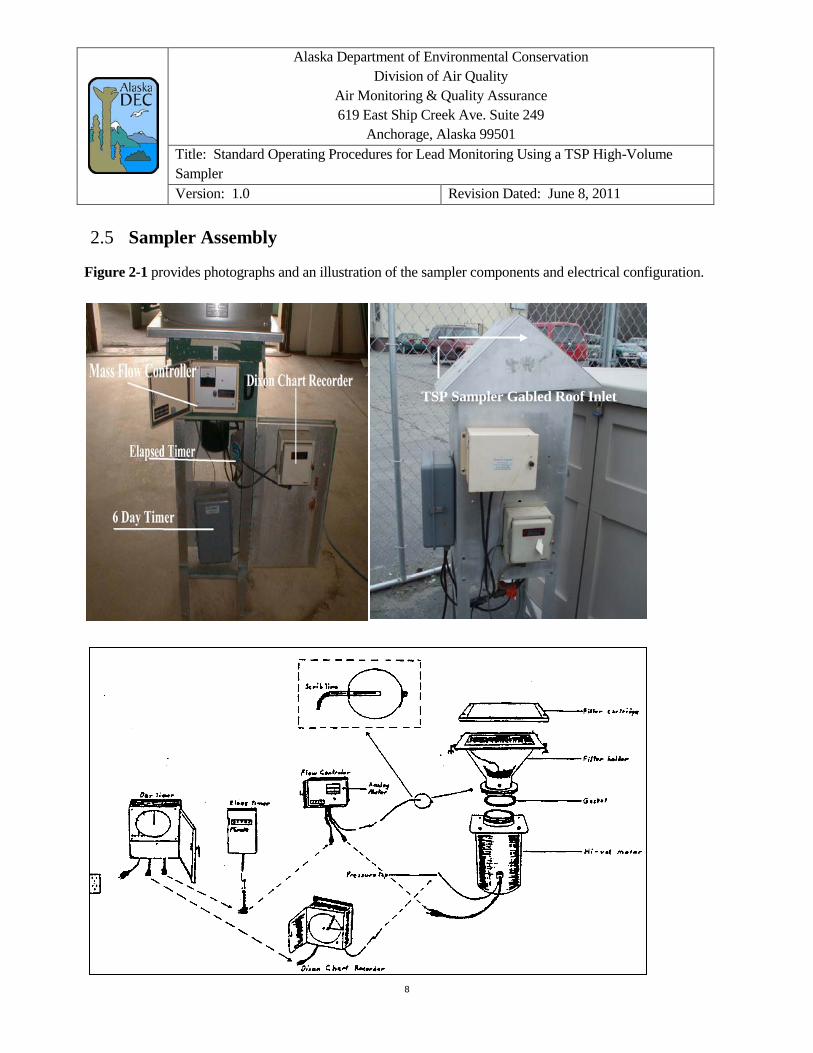
2.5 Sampler Assembly
Figure 2-1 provides photographs and an illustration of the sampler components and electrical configuration.
TSP Sampler Gabled Roof Inlet

Alaska Department of Environmental Conservation Division of Air Quality
Air Monitoring & Quality Assurance 619 East Ship Creek Ave. Suite 249
Anchorage, Alaska 99501 Title: Standard Operating Procedures for Lead Monitoring Using a TSP High-Volume Sampler Version: 1.0 Revision Dated: June 8, 2011
9
Peripheral Equipment Hi-Vol systems may be operated in several different configurations. The following describes component function and typical configuration used in Hi-Vol Sampler systems. See the illustration in Figure 2-1 for the typical connection sequence. Day timer: Alaska uses six day or seven-day mechanical timers. These timing devices have been reliable in a wide range of weather conditions. The day timer is the first piece of equipment installed in the Hi-Vol sampler (see figure 2-1) and, providing electrical power to the other sampler components and the timer automatically starts and stops sampler operation. Unless otherwise documented, the day-timer is installed and operated following the manufacturer’s operating instructions. NOTE: The electrical GUARD plate provides a safeguard against electrical shock. If the plate is to be removed, unplug the unit. Upon completion of maintenance, always re-install the safety guard plate. Elapsed timer: The elapsed timer is the indicating device that accurately records the time period that electrical power is provided to the sampler components. Unless otherwise documented, the timer is installed and operated according to the manufacturer’s instructions. The elapse timer plugs inline between the day-timer and the flow controller. NOTE: A mechanical or electrical failure down-line of the elapsed time indicator will have no effect on the elapsed time indicator. This can result in inaccurate time measurements and inaccurate daily particle loading calculations. Flow Controller: Alaska monitoring network uses flow controllers, which senses the air flowing through the sampler and controls the voltage to the blower motor. The flow controller is calibrated with critical orifice flow device which will allow for calculation of the air flow during the sample run. The flow controller consists of a meter display which indicates air flow and a screw to adjust air flow by varying the voltage to the blower-motor. Installation and operation, unless otherwise documented, will follow the manufacturer’s operating instructions. NOTE: When installing a flow controller probe into the filter holder, make sure the probe scribe mark is facing up as shown in the Figure 2-1 illustration. Blower-Motor & Housing: The blower-motor is the driving force of the sampling system. The blower-motor a combination of an electrical motor attached to a circular impeller that draws air flow into the sampler inlet, collecting any suspended particulate matter onto the glass-fiber filter in the filter cassette. The air flow continues down through the throat of the filter support assembly and attached to the blower-motor housing. The air flow passes through the blow-motor and out an orifice plate in the bottom of the blower-motor housing. The housing has a pressure tap to determine differential pressure which is a measurement used in the calibration of the flow controller and blower-motor to calculate volumetric air flow.

Alaska Department of Environmental Conservation Division of Air Quality
Air Monitoring & Quality Assurance 619 East Ship Creek Ave. Suite 249
Anchorage, Alaska 99501 Title: Standard Operating Procedures for Lead Monitoring Using a TSP High-Volume Sampler Version: 1.0 Revision Dated: June 8, 2011
10
Flow indicators: The Dickson chart recorder provides a visual record of the air flow (differential pressure) through the Hi-Vol sampler during the sample period that is a pen trace on a circular chart for period of operation. The chart trace indicates if the sample flow rate was consistent and uninterrupted, showing if the power failed or it the blower- motor malfunctioned during the 24-hour sample run. The Dickson chart recorder is connected to the pressure tap on blower-motor housing with rubber tubing. The chart movement is electrical and plugs into the day timer. To assemble, connect the filter support to the Hi-Vol blower motor assembly and ensure the gasket is in place for proper seal. Place the Hi-Vol motor assembly in the Hi-Vol shelter. In most cases, the peripheral equipment is mounted in the Hi-Vol shelter at the factory. If, however, an update is required, the second photograph in Figure 2-1 shows a typical configuration. Attach the electric connections and pressure connections as configured in the Figure 2-1 illustration.
3 TSP Calibration Procedures Calibrations are to be performed: when the sampler is initially installed at the sampling location prior to initial operation; when the sampler malfunctions or the blower motor fails; and when the sampler fails any monthly flow check or audit flow check. Sections 3.1 through 3.3 describe procedures multipoint flows calibrations and single point flow verification checks. Following established EPA methods and procedures, all calibration devices (i.e. temperature, pressure and flow) must be certified against NIST-traceable standards at least once per year. Calibration of a Hi-Vol sampler refers to establishing a mathematical relationship between the sampler’s flow rate as indicated by the meter on the flow controller and a known flow as determined by a critical orifice flow device. This calibration provides an accurate measurement of the sampler flow rate during a sample run.
3.1 List of Tools, Equipment and Materials
• Logbooks , TSP-Field Calibration form (Figure 3-1), TSP-Monthly 1-Point Flow Check form (Figure 3-3), and ink pens
• Flow calibration orifice capable of measuring volumetric flow rates from 1.0 to 1.8 m3/min, which is certified as traceable to the National Institute of Standards and Technology (NIST)
• Digital manometer with traceability to NIST and a measurement range of (at least) 0 to 12 inches H2O inches to the nearest ±0.05 inches Note: Digital manometers are typically certified for accurate operation to a minimum temperature of degrees Celsius (°C ). For cold weather conditions (< 0 °C ) use
Alaska Department of Environmental Conservation Division of Air Quality
Air Monitoring & Quality Assurance 619 East Ship Creek Ave. Suite 249
Anchorage, Alaska 99501 Title: Standard Operating Procedures for Lead Monitoring Using a TSP High-Volume Sampler Version: 1.0 Revision Dated: June 8, 2011
11
a liquid U-tube manometer with a measurement range of (at least) 0-12 inches H2O inches to the nearest ± 0.1 inches. The manometer fluid is a 50/50 mixed solution of water and antifreeze which will not freeze until approximately -40°C.
• Leak-free flexible tubing of sufficient length to connect the pressure tap on the flow calibrator to the manometer
• A thermometer capable of measuring temperature over the range of -40 to 50°C to the nearest ± 2°C and traceability to NIST. Note: In rural village locations, temperature data from the local National Weather Service airport flight station may be used.
• A barometer capable of measuring barometric pressure over the range of 500 to 800 millimeters (mm) of mercury (Hg) ± 5 mm and traceable to NIST. Note: In rural village locations, barometric pressure (altimeter) data from the local National Weather Service airport flight station will be used.
• Personal computer with MS Excel® flow calculation spreadsheet (Figure 3-2) or hand calculator • Personal protective equipment and winter clothing/footwear for work in wintertime Arctic conditions.
3.2 Leak check
1. Take the critical orifice flow calibrator out of its black case and attach the flow calibrator onto the filter cassette screen. Be sure that the flow calibrator is centered over the filter so the gaskets will properly seal and tighten the screws sealing the flow calibrator onto the filter support screen.
2. Turn on the blower motor via the switch on the mechanical day-timer and allow 5 minutes for warm up of the blower motor. Using duct tape, prepare a patch to place over the inlet to the flow transfer standard. Place the duct tape patch over the inlet of the flow calibrator and make sure the inlet is completely sealed preventing any air flow through the flow calibrator and into the blower motor. Place your thumb over the pressure tap where the manometer tubing attaches to the flow calibrator. With the other hand, check the bottom of the blower-motor housing to check for any air flow passing out of the orifice in the bottom of the housing.
3. If there is a slight leak, tighten the screw knobs which hold the flow calibrator onto the filter support screen and repeat the leak test. If there is still a leak check the entire system (motor, tubing, connection tightness, and gaskets) to find the leak. Repeat this procedure until the leak test is successful.
4. Turn off the sampler. The leak check is now completed. Caution: Running the sampler for too long (1 – 2 minutes) with the air flow blocked can increase the chance that the blower motor will overheat due to the lack of cooling air. Overheating can shorten the lifetime of the blower motor and can also result with damage to the motor’s electrical insulation, which could cause a fire or electric shock to the user.
Alaska Department of Environmental Conservation Division of Air Quality
Air Monitoring & Quality Assurance 619 East Ship Creek Ave. Suite 249
Anchorage, Alaska 99501 Title: Standard Operating Procedures for Lead Monitoring Using a TSP High-Volume Sampler Version: 1.0 Revision Dated: June 8, 2011
12
3.3 Multi-point calibration
A multi-point flow calibration must be performed upon initial installation and at least once per year thereafter. In addition, the multi-point calibration must be performed whenever a single-point flow verification check indicates that the sampler flow deviates from the flow calibration device by more than ± 4% or following routine maintenance or repairs. The multi-point calibration is performed as follows:
1. After the leak check is done, leave the flow calibrator on the sampler, removing the duct tape over the inlet. Turn on the digital manometer and re-zero it using the dial between the two ports or zero the liquid manometer.
2. Inspect the tubing for any cracks and unusual wear which may cause a leak. Replace as necessary. 3. Connect one end of the tubing to the negative port of the manometer. Connect the other end to the
pressure port of the flow calibrator. 4. Turn on the sampler and allow it to warm up to normal operating temperature (about 5 minutes). 5. While the sampler is warming up, record the following information on the TSP-Field Calibration form:
(Figure 3-1) a. Date and name of operator doing the calibration b. Sampler ID c. Ambient temperature ( in °C) d. Ambient barometric pressure (in inches of mercury, Hg) e. Flow calibrator serial number, certification date
6. Once the sampler is properly warmed up, the approximate set point needs to be established. Note: The ADEC has established a spreadsheet program in Microsoft (MS) Excel which can calculate set points with some basic information from the user. A laptop computer is necessary while out in the field otherwise the formulas are listed below and in the section titled “Calibration Calculations” for hand calculations. (Figure 3 – 2)
7. To calculate an approximate set point when flow is at 1.3 m3/min you need to use the following equation:

Alaska Department of Environmental Conservation Division of Air Quality
Air Monitoring & Quality Assurance 619 East Ship Creek Ave. Suite 249
Anchorage, Alaska 99501 Title: Standard Operating Procedures for Lead Monitoring Using a TSP High-Volume Sampler Version: 1.0 Revision Dated: June 8, 2011
13
Equation 3-1 Estimated set point, in inches =
Tamb [(1.3 x mact) + bact]2 x Pamb
Where: mact = slope (from calibration sheet in calibration kit) bact = intercept (from calibration data sheet in calibration kit) Pamb = ambient pressure, inches Hg converted to mm Hg) Tamb = ambient temperature (degrees Kelvin, °K = °C + 273)
8. Input the data recorded in Step 5 into the calculation spreadsheet. 9. Using a small screwdriver adjust the flow controller screw so the manometer reads what you calculated
above in equation 3-1.(e.g. 5.2 inches of water) 10. Record the reading from the flow controller meter which the is “Indicated Flow” (e.g. when the
manometer reads 5.2 the meter reading or ”Indicated Flow” may read 41). 11. Choose two additional calibration points above and two additional calibration points below “Indicate
Flow” from the step above. (e.g. 38, 40, 41, 42, and 44). 12. Adjust the flow rate using the flow controller screw for each of the four addition calibration points
recording the manometer readings and the corresponding flow meter reading (“Indicated Flow”). 13. In the MS Excel calculation spreadsheet input the manometer reading under the column for “Hd” and
the flow meter readings under the column for “Indicated flow”. Enter this data for each of the four additional calibration points.
14. The spreadsheet will automatically calculate a linear regression of the flow rate calibration creating a slope and intercept equation (y = mx + b) to represent flow rate of the “Indicated Flow”. Regression equations will be generated for flow rates at standard conditions (Qstd) for 25° C, 760 mm Hg and at actual site condition (Qact) for ambient temperature and pressure. Note: The resulting linear regression equation will be specifically for this TSP sampler for this date forward. The linear regression spreadsheet also creates a graphic plot of the calibration. Check to see that the correlation coefficient is greater than 0.99 and visually to see if any points are questionable. This should be done in the field as the calibration procedure is occurring so adjustments can be made immediately. Save the spreadsheet file identifying the sampler ID and date.
15. Repeat the last two steps for any data points that are questionable on the plot. Running additional calibration points at differing flow rates is encouraged to improve the precision of the calibration.

Alaska Department of Environmental Conservation Division of Air Quality
Air Monitoring & Quality Assurance 619 East Ship Creek Ave. Suite 249
Anchorage, Alaska 99501 Title: Standard Operating Procedures for Lead Monitoring Using a TSP High-Volume Sampler Version: 1.0 Revision Dated: June 8, 2011
14
Figure 3-1 TSP – Field Calibration Form

Alaska Department of Environmental Conservation Division of Air Quality
Air Monitoring & Quality Assurance 619 East Ship Creek Ave. Suite 249
Anchorage, Alaska 99501 Title: Standard Operating Procedures for Lead Monitoring Using a TSP High-Volume Sampler Version: 1.0 Revision Dated: June 8, 2011
15
Figure 3 – 2 TSP Calibration Calculation Spreadsheet

Alaska Department of Environmental Conservation Division of Air Quality
Air Monitoring & Quality Assurance 619 East Ship Creek Ave. Suite 249
Anchorage, Alaska 99501 Title: Standard Operating Procedures for Lead Monitoring Using a TSP High-Volume Sampler Version: 1.0 Revision Dated: June 8, 2011
16
16. Once you are assured that precision is established, a set point can be determined using the following
formula. This calculation is also performed in the spreadsheet by entering quarterly seasonal temperature averages as determined by local meteorological records.
Equation 3-2 Set point = (mQstd x 1.3 x 760/ TS x 298/760) + bQst
Where: mQstd = slope (calculated based on 5 calibration points)
TS = seasonal temperature in ° K bQstd = intercept (calculated based on 5 calibration points
17. Once the set point has been calculated using the formula above, adjust the flow to the seasonal setpoint. 18. Make sure all sections of the calibration sheet are filled out including ambient (or seasonal in some
cases) temperature, ambient (or seasonal) barometric pressure, manometer readings, flow recordings, etc…
19. Turn off the sampler. Remove the tubing from the calibration orifice and manometer. Remove the flow calibrator. Note: The flow calibrator should be stored in its case with the wing nuts as loose as possible otherwise damage to the gasket may occur if the wing nuts are too tight.
20. Set up the monitor for the next sampling run.
3.4 Single-point Flow Verification Check
A single-point flow verification check must be performed at least every month. The monthly flow check is performed as follows:
1. After the leak check is done, leave the calibration orifice on the sampler, removing the duct tape over the inlet. Turn on the digital manometer and re-zero it using the dial between the two ports. If using a liquid manometer leak the manometer and zero the movable scale.
2. Inspect the tubing for any cracks and unusual wear. Replace as necessary. 3. Connect one end of the tubing to the negative port of the manometer. Connect the other end to the
pressure port of the calibration orifice. 4. Turn on the sampler and allow it to warm up to normal operating temperature (about 5 minutes). 5. While the sampler is warming up, record the following information on the calibration data sheet:
a. Location, date, time and name of individual doing the calibration b. Sampler serial number, model and designation c. Ambient temperature (°C)
Alaska Department of Environmental Conservation Division of Air Quality
Air Monitoring & Quality Assurance 619 East Ship Creek Ave. Suite 249
Anchorage, Alaska 99501 Title: Standard Operating Procedures for Lead Monitoring Using a TSP High-Volume Sampler Version: 1.0 Revision Dated: June 8, 2011
17
d. Ambient barometric pressure (mm Hg) e. Calibration orifice serial number, calibration, date and actual flow conditions calibration
relationship. 6. When the motor is warm, record the reading from the flow controller meter and from the manometer
(eg. when the manometer reads 5.2 the meter will read 41). Note: Take a reading by looking at the meter needle straight on eye level. If the reading is made while looking down on the MFC of at an angle, the reading will not be correct.
7. Using the calibration regression equation from the most recent valid 5-point calibration calculate the sampler flow rate.
8. Using the calibration regression equation from the calibration orifice calculate the orifice flow rate. 9. Calculate the percent difference between the sampler flow rate as compared to the orifice flow rate. (see
equation 3-3) If the percent difference is ≤ 7% the flow check is within QC criteria and all of the data from the previous flow check to date is valid. If the percent difference is > 7%, then corrective action is required; troubleshoot, repair, and perform a new 5-point calibration.
Equation 3-3
4 TSP Sample Procedures
4.1 List of Tools, Equipment, and Materials
• EPA sampling calendar • Clean, unexposed, EPA approved glass-fiber filters • Disposable gloves for handling the filters (powder free) • Blank Dickson (circular) flow chart • Ink Stamp to label Dickson chart • Logbook and ink pens • Filter cassette • Filter envelops & Filter Mailers
4.2 Preparatory Procedure for Filter Changes
Find an available work area and surface which is clean, as dust free as possible that can be designated for sample setup and recovery. The following are the procedures to set up the filter cassette and label the Dickson chart in preparation for installing the sample filters on-site.

Alaska Department of Environmental Conservation Division of Air Quality
Air Monitoring & Quality Assurance 619 East Ship Creek Ave. Suite 249
Anchorage, Alaska 99501 Title: Standard Operating Procedures for Lead Monitoring Using a TSP High-Volume Sampler Version: 1.0 Revision Dated: June 8, 2011
18
1. Review the sampling calendar to confirm the run date. 2. Before setting up the samples, clean and dry the working surface on any dust or other contaminants. 3. Label the Dickson (circular) chart so sample data can be recorded. On the back (non-grid) side of the
chart, use the provided ink stamp to label the chart. ( See Figure 4-1) 4. Open a filter cassette by removing the protective cover and unscrewing the thumbscrew which secure
the top of the frame to the screen support. (See Figure 4-2) 5. After clean hands and putting on a clean pair of disposable gloves, select a clean sample filter from the
box. Each filter will be marked with an identification (ID) number located on the back of the filter in the upper right corner. Inspect the filter for pinholes, tears, abrasions, loose material, discoloration, and other non-uniformity. Discard any defective or damaged filters and make note of the discarded filter ID number in the logbook.
6. On the back of the Dickson chart record the sampler ID next to “SAMPLER:” (e.g. Noatak B), filter ID number next to “FILTER#:”, and the next sample “RUN DAY:” as confirmed from the EPA sample calendar.
7. Also record the filter number and run date on the log sheet. (See Figure 4-3 TSP Sample-Log Sheet) 8. Place the filter into an open filter cassette centering the filter over the support screen. Ensure that the
filter ID number is facing down. The upward or exposed side of the filter has a textured surface. Close the filter cassette by replacing the top of the frame over the filter ensuring that the gasket material covers the outer edges of the filter. Tighten the thumbscrews until the gasket material seal down firmly on the filter and bottom support. (Note: The seal should be firm but do not over-tighten the thumbscrews, this may damage the filter material.) Replace the cassette cover. The cassette cover must be in place to protect the filter during transport to and from the sample site.
Figure 4-1 Dickson Chart

Alaska Department of Environmental Conservation Division of Air Quality
Air Monitoring & Quality Assurance 619 East Ship Creek Ave. Suite 249
Anchorage, Alaska 99501 Title: Standard Operating Procedures for Lead Monitoring Using a TSP High-Volume Sampler Version: 1.0 Revision Dated: June 8, 2011
19
Figure 4-2 Filter Cassette Loading
4.3 On-site Installation and Setup for a Sample Run
Upon arrival at the monitoring site unlock the security fencing and inspect the equipment. Note any items needing maintenance or any irregularities that may affect data quality in the comment section on the log sheets. 1. Open the main door to sampler; open the doors to the 6-day timer, the Dickson chart recorder and the
mass flow controller 2. Record current time on the log sheet in the comment section. (Note: Statewide air monitoring will be
conducted based on Alaska Standard Time year round. The samplers run time will not be adjusted for daylight savings time.)
3. Compare the current time to the time on the 6-day timer, if the time on the 6-day timer is off more than ½ hour you will need to adjust the 6-day timer to the current time. Make a note on the log sheet of any adjustment.
4. Check the Dickson chart – Did the sampler run properly? Did the sampler run for 24 hours (complete red circle)? Remove the chart and note any problems in the log book and call
5. Manually turn on the sampler. After the mass flow controller stabilizes (approximately 5 minutes) check the flow meter reading. On the back of the Dickson chart, under the “POST” column, record the current date “DATE” and the flow meter reading next to “FLOW.” Record this same information in the log book. Turn sampler off.
DEC if a problem is noted.
6. Record the stop time from the elapse timer in the filter log sheet and on the back of the Dickson chart. 7. Unlatch and open the top of the sampler. 8. Remove the old filter cassette by unscrewing the thumb screws until the studs can be pushed out of the
notches and away from the cassette. 9. Install the new filter cassette: slide studs into notches and tighten thumb screws. Tighten the nuts evenly
until they are snug. Do not over-tighten. 10. Be sure to remove the metal cover from the new filter cassette and use it to cover the used filter cassette. 11. Close and latch the top of the sampler 12. Manually turn the sampler on

Alaska Department of Environmental Conservation Division of Air Quality
Air Monitoring & Quality Assurance 619 East Ship Creek Ave. Suite 249
Anchorage, Alaska 99501 Title: Standard Operating Procedures for Lead Monitoring Using a TSP High-Volume Sampler Version: 1.0 Revision Dated: June 8, 2011
20
13. After the mass flow controller stabilizes (approximately 5 minutes), check flow meter reading. On the back of the new Dickson chart, under the “PRE” column, record the flow meter reading “FLOW” and the current date “DATE.” Record this same information on the log sheet.
14. Also record the current time shown on the elapsed timer (sample start time) on the back of the Dickson chart in the “pre” column and on the log sheet.
15. Install the “new” Dickson chart in the Dickson Chart Recorder. (Grid side out with the chart installed so that it runs midnight to midnight). Make sure the little tab in the center is not ripped!
16. Before leaving the monitoring site make sure the 6-day timer is set to “run” on the correct day and close all doors to the sampler and lock the security fence.
Figure 4-3 TSP Lead Sample – Log Sheet
Alaska Department of Environmental Conservation Division of Air Quality
Air Monitoring & Quality Assurance 619 East Ship Creek Ave. Suite 249
Anchorage, Alaska 99501 Title: Standard Operating Procedures for Lead Monitoring Using a TSP High-Volume Sampler Version: 1.0 Revision Dated: June 8, 2011
21
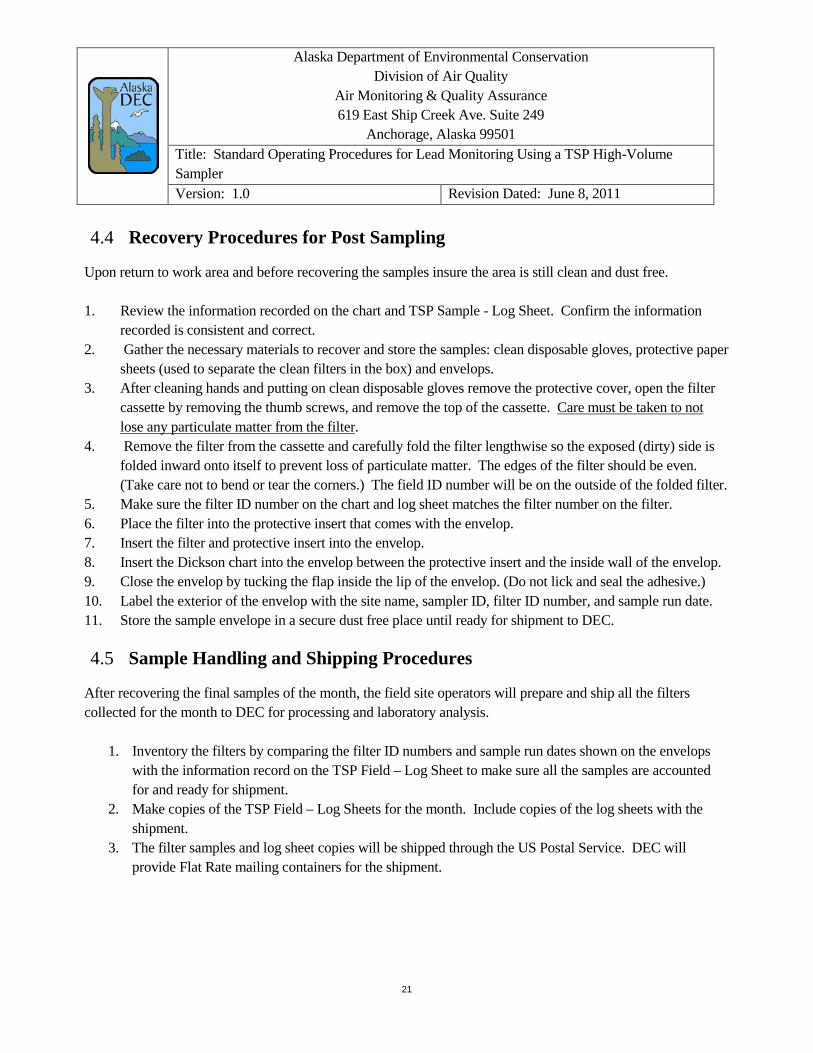
4.4 Recovery Procedures for Post Sampling
Upon return to work area and before recovering the samples insure the area is still clean and dust free. 1. Review the information recorded on the chart and TSP Sample - Log Sheet. Confirm the information
recorded is consistent and correct. 2. Gather the necessary materials to recover and store the samples: clean disposable gloves, protective paper
sheets (used to separate the clean filters in the box) and envelops. 3. After cleaning hands and putting on clean disposable gloves remove the protective cover, open the filter
cassette by removing the thumb screws, and remove the top of the cassette. Care must be taken to not lose any particulate matter from the filter
4. Remove the filter from the cassette and carefully fold the filter lengthwise so the exposed (dirty) side is folded inward onto itself to prevent loss of particulate matter. The edges of the filter should be even. (Take care not to bend or tear the corners.) The field ID number will be on the outside of the folded filter.
.
5. Make sure the filter ID number on the chart and log sheet matches the filter number on the filter. 6. Place the filter into the protective insert that comes with the envelop. 7. Insert the filter and protective insert into the envelop. 8. Insert the Dickson chart into the envelop between the protective insert and the inside wall of the envelop. 9. Close the envelop by tucking the flap inside the lip of the envelop. (Do not lick and seal the adhesive.) 10. Label the exterior of the envelop with the site name, sampler ID, filter ID number, and sample run date. 11. Store the sample envelope in a secure dust free place until ready for shipment to DEC.
4.5 Sample Handling and Shipping Procedures
After recovering the final samples of the month, the field site operators will prepare and ship all the filters collected for the month to DEC for processing and laboratory analysis.
1. Inventory the filters by comparing the filter ID numbers and sample run dates shown on the envelops with the information record on the TSP Field – Log Sheet to make sure all the samples are accounted for and ready for shipment.
2. Make copies of the TSP Field – Log Sheets for the month. Include copies of the log sheets with the shipment.
3. The filter samples and log sheet copies will be shipped through the US Postal Service. DEC will provide Flat Rate mailing containers for the shipment.

Alaska Department of Environmental Conservation Division of Air Quality
Air Monitoring & Quality Assurance 619 East Ship Creek Ave. Suite 249
Anchorage, Alaska 99501 Title: Standard Operating Procedures for Lead Monitoring Using a TSP High-Volume Sampler Version: 1.0 Revision Dated: June 8, 2011
22
4. Mail the filter samples to: ADEC DIVISION OF AIR QUALITY 619 EAST SHIP CREEK DRIVE STE 249 ANCHORAGE AK 99501 ATTN: LEAD MONITORING PROJECT MANAGER
5. Upon arrival at DEC the filters will be logged and inspected for damage. 6. The Dickson charts and field log sheets will be reviewed and filed in preparation for data review and
report development. 7. The filter samples information will be entered onto Chain of Custody forms for submittal to the DEC
Environmental Health (EH) Laboratory. (see Figure 4-4) 8. Upon transfer of the sample from the Air Quality to the EH laboratory, a copy of the Chain of Custody
form will be retained for the lead monitoring file.
5 Sampler Maintenance The EPA Reference Method for TSP-lead specifies a large number of maintenance items to ensure that the collected samples meet the TSP-lead monitoring program Data Quality Objectives. These maintenance items are listed below, grouped by the frequency of required maintenance. All maintenance activities should be logged into a station logbook making sure to record on the log sheets the operator ID, specific sites, dates, and times of servicing or maintenance. Log books should be kept in a dry, secure but convenient location. The cleaning frequencies of the air sampler will vary greatly from site to site. Location will play the biggest part as to how detailed and how often the cleaning process will take place. Keeping the air sampler clean insures the quality of the sample. The high volume shelter should be routinely inspected and maintained. Power cords should be checked for crimps, cracks, frayed or exposed wiring each sample day. Power cords with cracked cord casings should be taped with electrical tape and replaced as soon as possible. Do not allow power cords to be immersed in water;
if necessary raise the power cords above the ground by taping them to the legs of the shelter.
Alaska Department of Environmental Conservation Division of Air Quality
Air Monitoring & Quality Assurance 619 East Ship Creek Ave. Suite 249
Anchorage, Alaska 99501 Title: Standard Operating Procedures for Lead Monitoring Using a TSP High-Volume Sampler Version: 1.0 Revision Dated: June 8, 2011
23
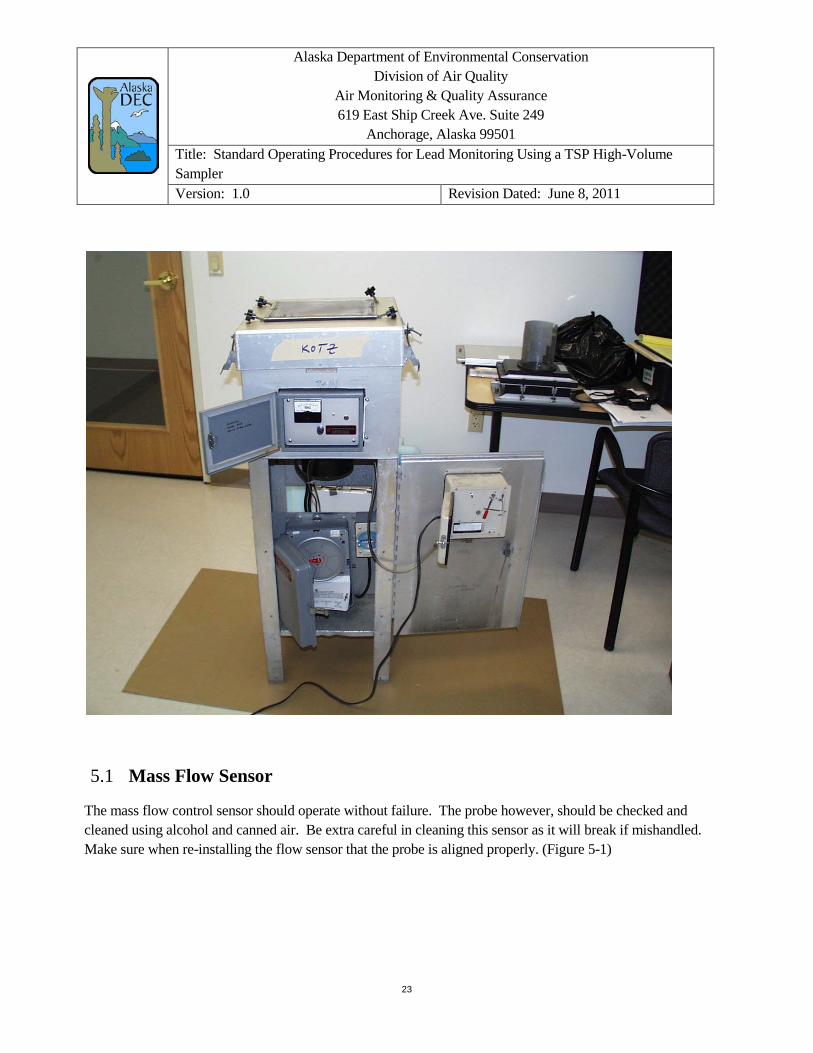
5.1 Mass Flow Sensor
The mass flow control sensor should operate without failure. The probe however, should be checked and cleaned using alcohol and canned air. Be extra careful in cleaning this sensor as it will break if mishandled. Make sure when re-installing the flow sensor that the probe is aligned properly. (Figure 5-1)

Alaska Department of Environmental Conservation Division of Air Quality
Air Monitoring & Quality Assurance 619 East Ship Creek Ave. Suite 249
Anchorage, Alaska 99501 Title: Standard Operating Procedures for Lead Monitoring Using a TSP High-Volume Sampler Version: 1.0 Revision Dated: June 8, 2011
24
Figure 5-1 Mass Flow Controller Sensor
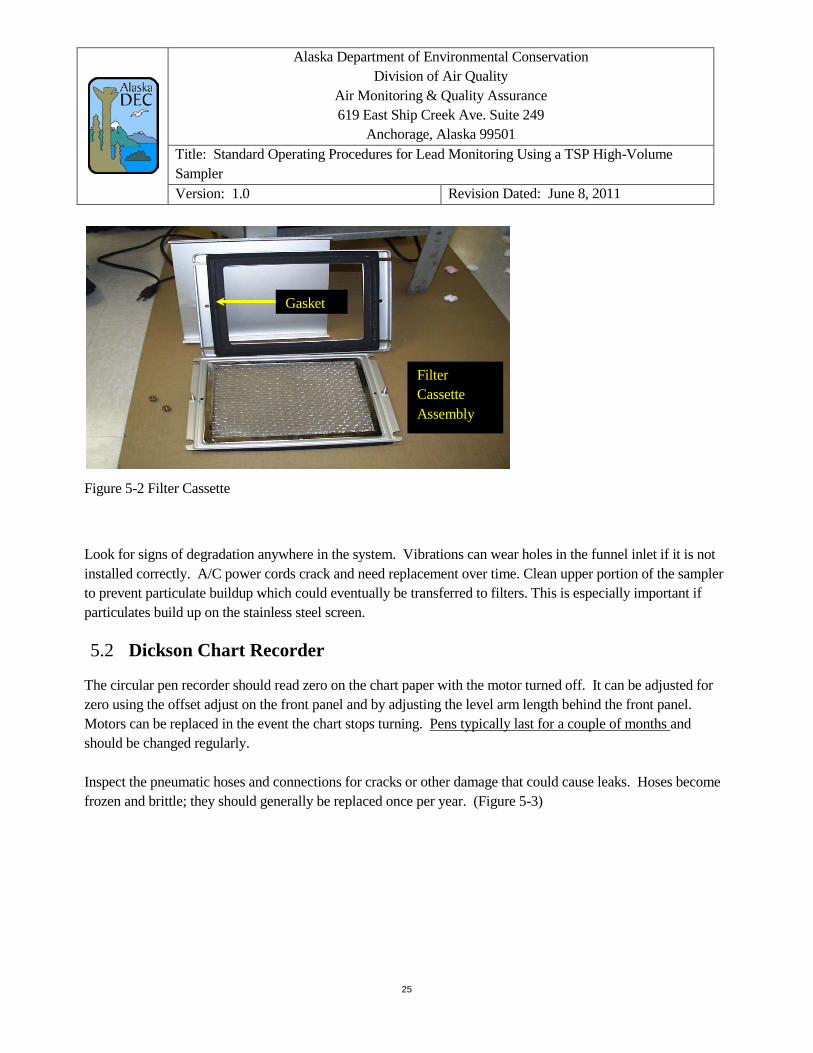
The filter cartridge or cassette used to support the sample filter and rubber gaskets should be checked for physical damage, compression or degradation each time a filter is installed. Replace the gasket as necessary. (Figure 5-2)
Blower Motor Housing
Filter Holder Gasket
Filter Holder
MASS FLOW SENSOR PROBE Filter Holder to Motor Seal
Funnel Inlet
¼” Filter Holder Screws
Knurled Nut
Alaska Department of Environmental Conservation Division of Air Quality
Air Monitoring & Quality Assurance 619 East Ship Creek Ave. Suite 249
Anchorage, Alaska 99501 Title: Standard Operating Procedures for Lead Monitoring Using a TSP High-Volume Sampler Version: 1.0 Revision Dated: June 8, 2011
25
Figure 5-2 Filter Cassette
Look for signs of degradation anywhere in the system. Vibrations can wear holes in the funnel inlet if it is not installed correctly. A/C power cords crack and need replacement over time. Clean upper portion of the sampler to prevent particulate buildup which could eventually be transferred to filters. This is especially important if particulates build up on the stainless steel screen.
5.2 Dickson Chart Recorder
The circular pen recorder should read zero on the chart paper with the motor turned off. It can be adjusted for zero using the offset adjust on the front panel and by adjusting the level arm length behind the front panel. Motors can be replaced in the event the chart stops turning. Pens typically last for a couple of months
and should be changed regularly.
Inspect the pneumatic hoses and connections for cracks or other damage that could cause leaks. Hoses become frozen and brittle; they should generally be replaced once per year. (Figure 5-3)
Gasket
Filter Cassette Assembly

Alaska Department of Environmental Conservation Division of Air Quality
Air Monitoring & Quality Assurance 619 East Ship Creek Ave. Suite 249
Anchorage, Alaska 99501 Title: Standard Operating Procedures for Lead Monitoring Using a TSP High-Volume Sampler Version: 1.0 Revision Dated: June 8, 2011
26
Figure 5-3 Dickson Flow Chart Recorder
All maintenance activities should be logged into a station logbook making sure to record on the log sheets the specific site, dates, and times of servicing or maintenance. Log books should be kept in a convenient, dry, safe location.
5.3 Motor Maintenance
TSP motors are durable and have a long life if properly cared for and maintained. If not maintained they will be a constant problem in the sampling program. The maintenance requirements are; inspecting and replacing the neoprene gaskets routinely, replacing the motor’s carbon brushes, cleaning the motor’s rotor or bearings.
Chart Holder
Paper Chart
Ink Pen
Adjustment Arm
Alaska Department of Environmental Conservation Division of Air Quality
Air Monitoring & Quality Assurance 619 East Ship Creek Ave. Suite 249
Anchorage, Alaska 99501 Title: Standard Operating Procedures for Lead Monitoring Using a TSP High-Volume Sampler Version: 1.0 Revision Dated: June 8, 2011
27
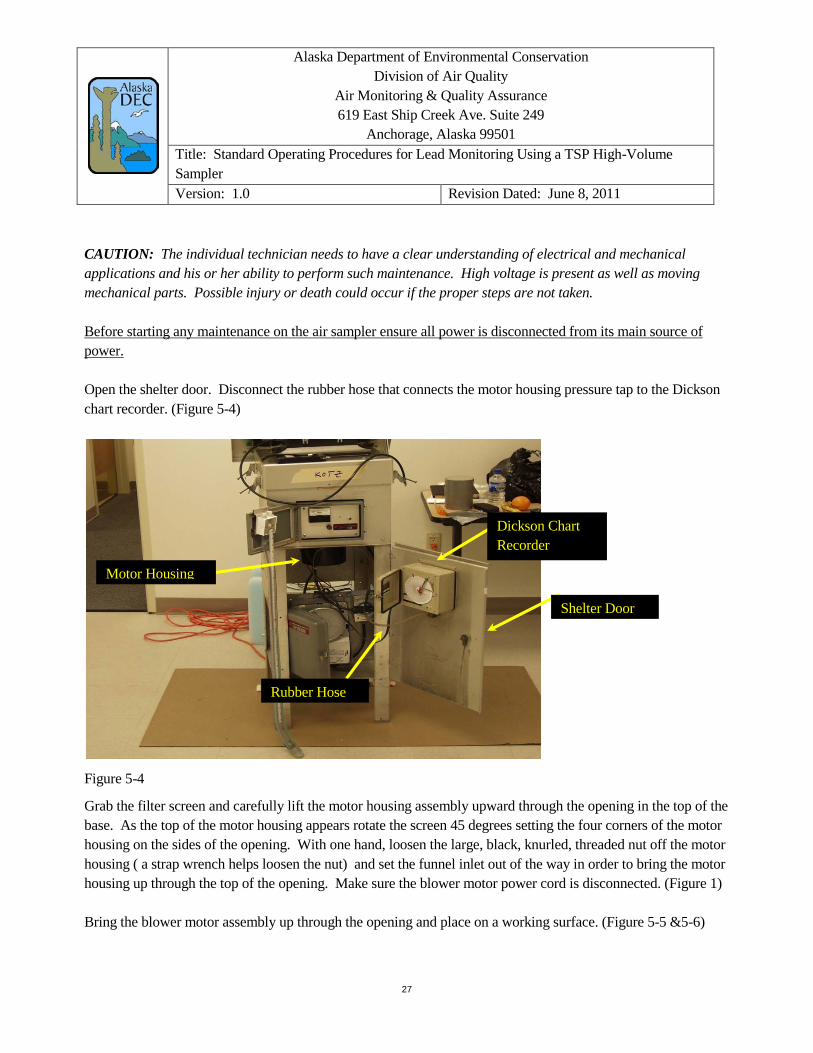
CAUTION: The individual technician needs to have a clear understanding of electrical and mechanical applications and his or her ability to perform such maintenance. High voltage is present as well as moving mechanical parts. Possible injury or death could occur if the proper steps are not taken.
Before starting any maintenance on the air sampler ensure all power is disconnected from its main source of power.
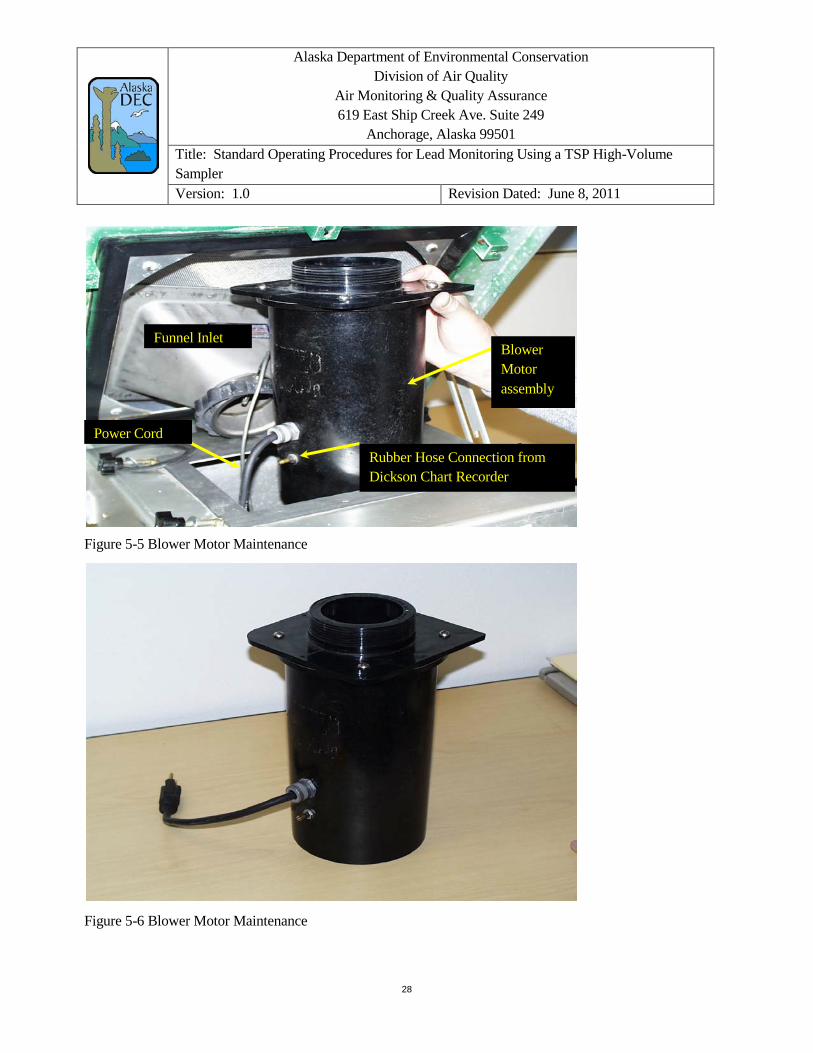
Open the shelter door. Disconnect the rubber hose that connects the motor housing pressure tap to the Dickson chart recorder. (Figure 5-4)
Figure 5-4
Grab the filter screen and carefully lift the motor housing assembly upward through the opening in the top of the base. As the top of the motor housing appears rotate the screen 45 degrees setting the four corners of the motor housing on the sides of the opening. With one hand, loosen the large, black, knurled, threaded nut off the motor housing ( a strap wrench helps loosen the nut) and set the funnel inlet out of the way in order to bring the motor housing up through the top of the opening. Make sure the blower motor power cord is disconnected. (Figure 1) Bring the blower motor assembly up through the opening and place on a working surface. (Figure 5-5 &5-6)
Shelter Door
Dickson Chart Recorder
Rubber Hose
Motor Housing
Alaska Department of Environmental Conservation Division of Air Quality
Air Monitoring & Quality Assurance 619 East Ship Creek Ave. Suite 249
Anchorage, Alaska 99501 Title: Standard Operating Procedures for Lead Monitoring Using a TSP High-Volume Sampler Version: 1.0 Revision Dated: June 8, 2011
28
Figure 5-5 Blower Motor Maintenance
Figure 5-6 Blower Motor Maintenance
Blower Motor assembly
Rubber Hose Connection from Dickson Chart Recorder
Power Cord
Funnel Inlet
Alaska Department of Environmental Conservation Division of Air Quality
Air Monitoring & Quality Assurance 619 East Ship Creek Ave. Suite 249
Anchorage, Alaska 99501 Title: Standard Operating Procedures for Lead Monitoring Using a TSP High-Volume Sampler Version: 1.0 Revision Dated: June 8, 2011
29
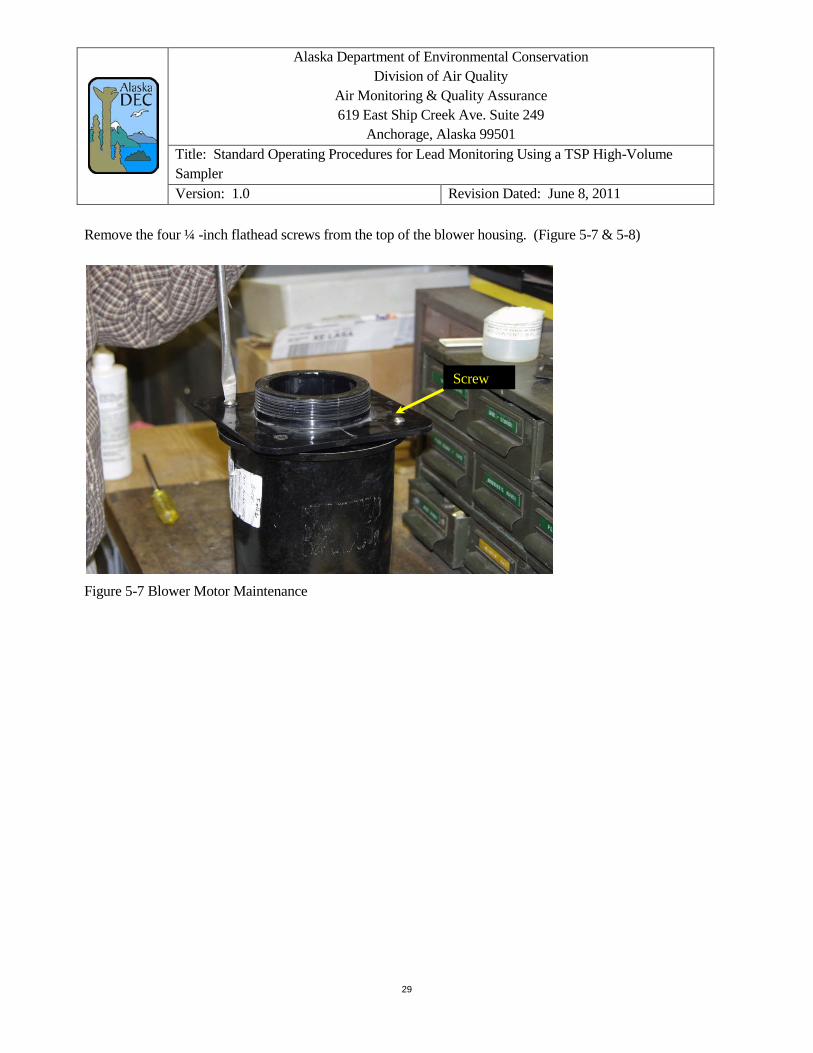
Remove the four ¼ -inch flathead screws from the top of the blower housing. (Figure 5-7 & 5-8)
Figure 5-7 Blower Motor Maintenance
Screw

Alaska Department of Environmental Conservation Division of Air Quality
Air Monitoring & Quality Assurance 619 East Ship Creek Ave. Suite 249
Anchorage, Alaska 99501 Title: Standard Operating Procedures for Lead Monitoring Using a TSP High-Volume Sampler Version: 1.0 Revision Dated: June 8, 2011
30
Figure 5-8 Blower Motor Maintenance Loosen the power cord tightening nut off of the housing to allow the blower motor to be taken out of the housing. Bring motor up out of the housing and disconnect the wiring nuts from the motor. Check rubber seal and replace if needed. (Figures 5-9 through 5-11)
Figure 5-9 Blower Motor Maintenance
Blower Housing Mounting Plate
Rubber Seal
Blower Motor
Rubber Seal
Metal Holding Ring

Alaska Department of Environmental Conservation Division of Air Quality
Air Monitoring & Quality Assurance 619 East Ship Creek Ave. Suite 249
Anchorage, Alaska 99501 Title: Standard Operating Procedures for Lead Monitoring Using a TSP High-Volume Sampler Version: 1.0 Revision Dated: June 8, 2011
31
Figure 5-10 Blower Motor Maintenance
Figure 5-11 Blower Motor Maintenance
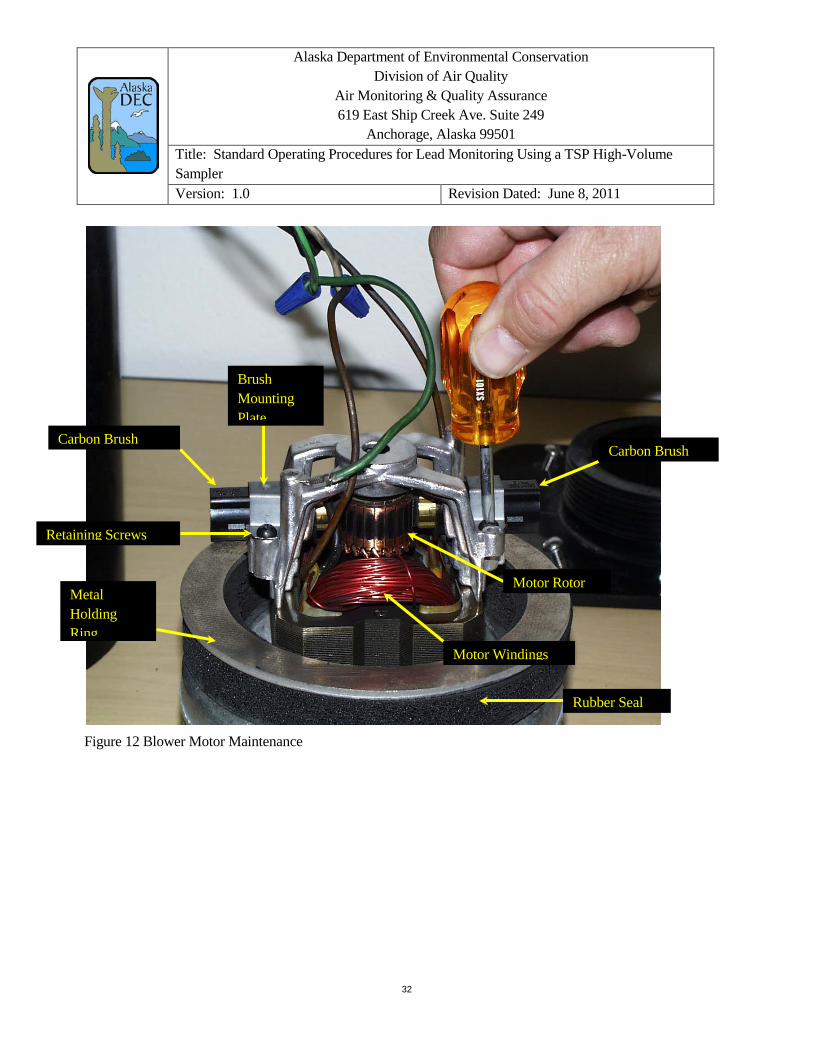
The carbon brushes must be replaced after 600 hours
of run time. They should be replaced either after a quarterly audit or before calibration of the air sampler for the next quarter.
To replace the brushes, stand the motor up to expose the brushes, motor rotor and motor windings. Using a small flat screw driver gently pry the brush electrical connection out of the brushes. If the brushes have been loosened from their mounting plates this may be a difficult task to accomplish. Once this is done remove the 2 Philips head retaining screws from the brush retainer holders and remove the carbon brushes. (Figures 5-12 & 5-13)
Motor Assembly
Wire Nuts
Alaska Department of Environmental Conservation Division of Air Quality
Air Monitoring & Quality Assurance 619 East Ship Creek Ave. Suite 249
Anchorage, Alaska 99501 Title: Standard Operating Procedures for Lead Monitoring Using a TSP High-Volume Sampler Version: 1.0 Revision Dated: June 8, 2011
32
Figure 12 Blower Motor Maintenance
Rubber Seal
Metal Holding Ring
Carbon Brush Carbon Brush
Retaining Screws
Brush Mounting Plate
Motor Windings
Motor Rotor
Alaska Department of Environmental Conservation Division of Air Quality
Air Monitoring & Quality Assurance 619 East Ship Creek Ave. Suite 249
Anchorage, Alaska 99501 Title: Standard Operating Procedures for Lead Monitoring Using a TSP High-Volume Sampler Version: 1.0 Revision Dated: June 8, 2011
33
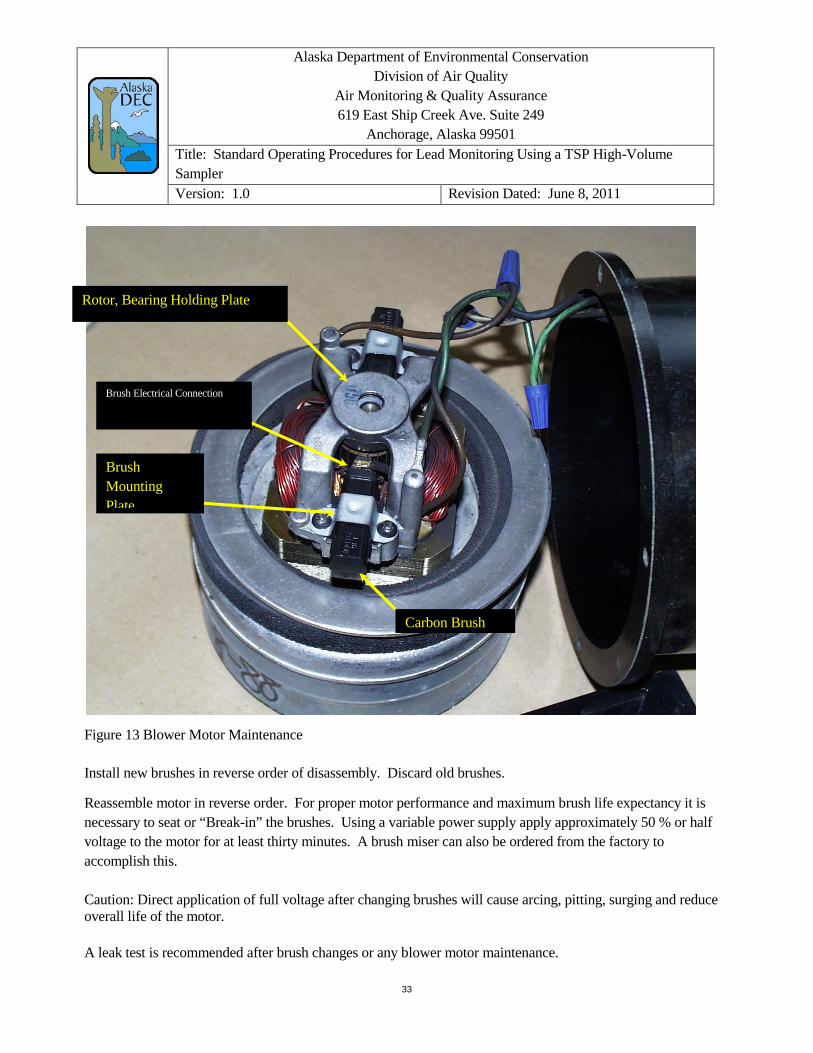
Figure 13 Blower Motor Maintenance Install new brushes in reverse order of disassembly. Discard old brushes. Reassemble motor in reverse order. For proper motor performance and maximum brush life expectancy it is necessary to seat or “Break-in” the brushes. Using a variable power supply apply approximately 50 % or half voltage to the motor for at least thirty minutes. A brush miser can also be ordered from the factory to accomplish this. Caution: Direct application of full voltage after changing brushes will cause arcing, pitting, surging and reduce overall life of the motor. A leak test is recommended after brush changes or any blower motor maintenance.
Brush Electrical Connection
Carbon Brush
Brush Mounting Plate
Rotor, Bearing Holding Plate

Alaska Department of Environmental Conservation Division of Air Quality
Air Monitoring & Quality Assurance 619 East Ship Creek Ave. Suite 249
Anchorage, Alaska 99501 Title: Standard Operating Procedures for Lead Monitoring Using a TSP High-Volume Sampler Version: 1.0 Revision Dated: June 8, 2011
34
6 Performance Audits Performance audits are designed to evaluate the accuracy of the sampler in measuring the key parameters involved in collecting a valid TSP lead sample. Performance audits should be conducted in accordance with the frequency and personnel requirements specified in the QAPP. In general, however, performance audits are to be conducted by personnel not directly involved in the routine operation, data processing or reporting of the TSP-lead monitoring network. Furthermore, performance audits are to be conducted using transfer standards different from those used in the routine calibration and operation of the sampler. It is acceptable for the audit transfer standards to be certified against the same local primary standard as the routine transfer standards.
6.1 Audit Criteria Table
Parameter Tolerance Frequency Comments TSP Hi-Volume Sampler design flow rate audit
Percent Difference ≤ 7 % within 1.1 to 1.7 m3/min
Once per quarter
Flow rate audit Percent Difference ≤ 10 %
Semi-annually (2/year)
6.2 Performance Audit Reporting
Upon completion of the performance audit, immediately inform the site operator of the audit results so that corrective action may be taken, if necessary. An audit report should be prepared for submittal to the ADEC-AMQA within 30 days of the completion of the audit.
7 Laboratory Analysis for Lead The DEC Environmental Health Laboratory will analyze the TSP samples for lead content using inductively coupled plasma-mass spectrometry (ICP-MS). All procedures applicable to the sample preparation and quantitative determination of lead in the TSP filter samples will be conducted in accordance with the Standard Operating Procedure titled Standard Operating Procedure – Determination of Lead ion TSP by Inductively Coupled Plasma Mass Spectrometry (ICP-MS) with Heated Ultrasonic Nitric and Hydrochloric Acid Filter Extraction.
Alaska Department of Environmental Conservation Division of Air Quality
Air Monitoring & Quality Assurance 619 East Ship Creek Ave. Suite 249
Anchorage, Alaska 99501 Title: Standard Operating Procedures for Lead Monitoring Using a TSP High-Volume Sampler Version: 1.0 Revision Dated: June 8, 2011
35
The DEC EH laboratory will analyze the TSP lead samples on a quarterly basis. The resulting data package will reviewed in accordance with QA/QC procedures as specified in the above SOP. The data package provide by the EH lab to DEC Air Quality will consist of a data table generated by the Laboratory Information Management System (LIMS) and a QA/QC report.
8 Data Calculations and Validation The following subsections describe the routine procedures used to calculate 24-hour TSP lead concentrations and to validate individual samples.
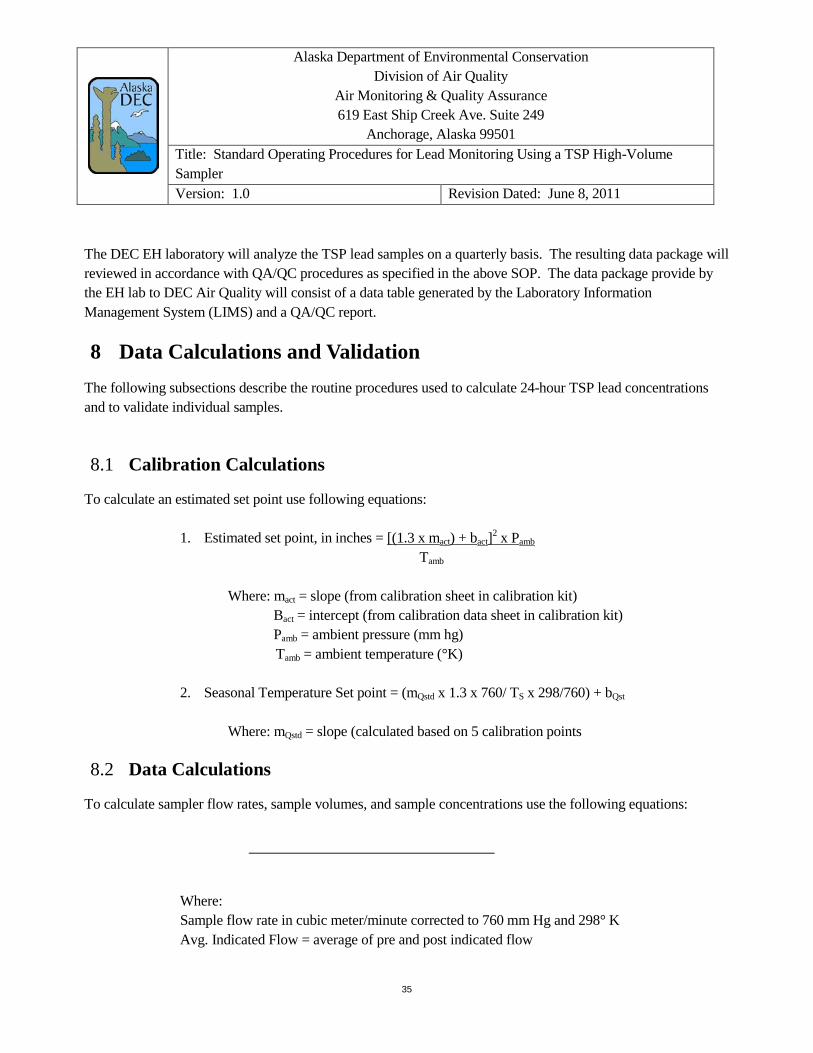
8.1 Calibration Calculations
To calculate an estimated set point use following equations:
1. Estimated set point, in inches = Tamb
[(1.3 x mact) + bact]2 x Pamb
Where: mact = slope (from calibration sheet in calibration kit) Bact = intercept (from calibration data sheet in calibration kit) Pamb = ambient pressure (mm hg)
Tamb = ambient temperature (°K)
2. Seasonal Temperature Set point = (mQstd x 1.3 x 760/ TS x 298/760) + bQst
Where: mQstd = slope (calculated based on 5 calibration points
8.2 Data Calculations
To calculate sampler flow rates, sample volumes, and sample concentrations use the following equations:
Where: Sample flow rate in cubic meter/minute corrected to 760 mm Hg and 298° K Avg. Indicated Flow = average of pre and post indicated flow
Alaska Department of Environmental Conservation Division of Air Quality
Air Monitoring & Quality Assurance 619 East Ship Creek Ave. Suite 249
Anchorage, Alaska 99501 Title: Standard Operating Procedures for Lead Monitoring Using a TSP High-Volume Sampler Version: 1.0 Revision Dated: June 8, 2011
36
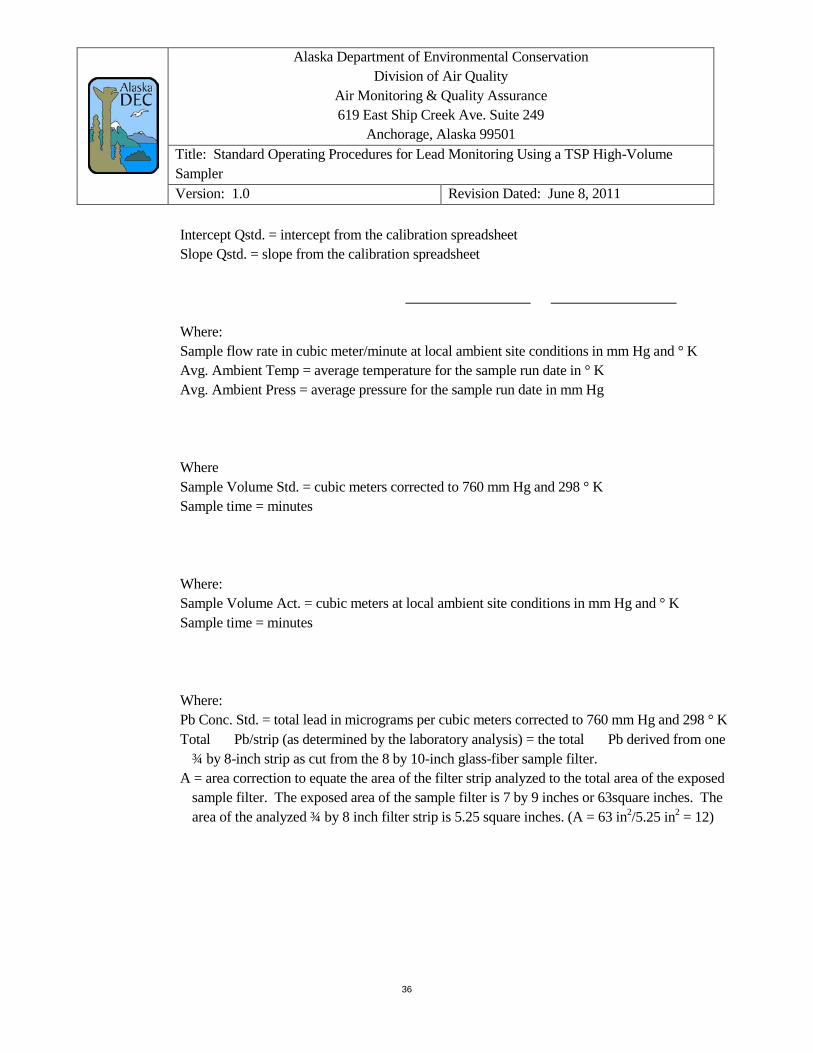
Intercept Qstd. = intercept from the calibration spreadsheet Slope Qstd. = slope from the calibration spreadsheet
Where: Sample flow rate in cubic meter/minute at local ambient site conditions in mm Hg and ° K Avg. Ambient Temp = average temperature for the sample run date in ° K Avg. Ambient Press = average pressure for the sample run date in mm Hg
Where Sample Volume Std. = cubic meters corrected to 760 mm Hg and 298 ° K Sample time = minutes
Where: Sample Volume Act. = cubic meters at local ambient site conditions in mm Hg and ° K Sample time = minutes
Where: Pb Conc. Std. = total lead in micrograms per cubic meters corrected to 760 mm Hg and 298 ° K Total Pb/strip (as determined by the laboratory analysis) = the total Pb derived from one
¾ by 8-inch strip as cut from the 8 by 10-inch glass-fiber sample filter. A = area correction to equate the area of the filter strip analyzed to the total area of the exposed
sample filter. The exposed area of the sample filter is 7 by 9 inches or 63square inches. The area of the analyzed ¾ by 8 inch filter strip is 5.25 square inches. (A = 63 in2/5.25 in2 = 12)
Alaska Department of Environmental Conservation Division of Air Quality
Air Monitoring & Quality Assurance 619 East Ship Creek Ave. Suite 249
Anchorage, Alaska 99501 Title: Standard Operating Procedures for Lead Monitoring Using a TSP High-Volume Sampler Version: 1.0 Revision Dated: June 8, 2011
37
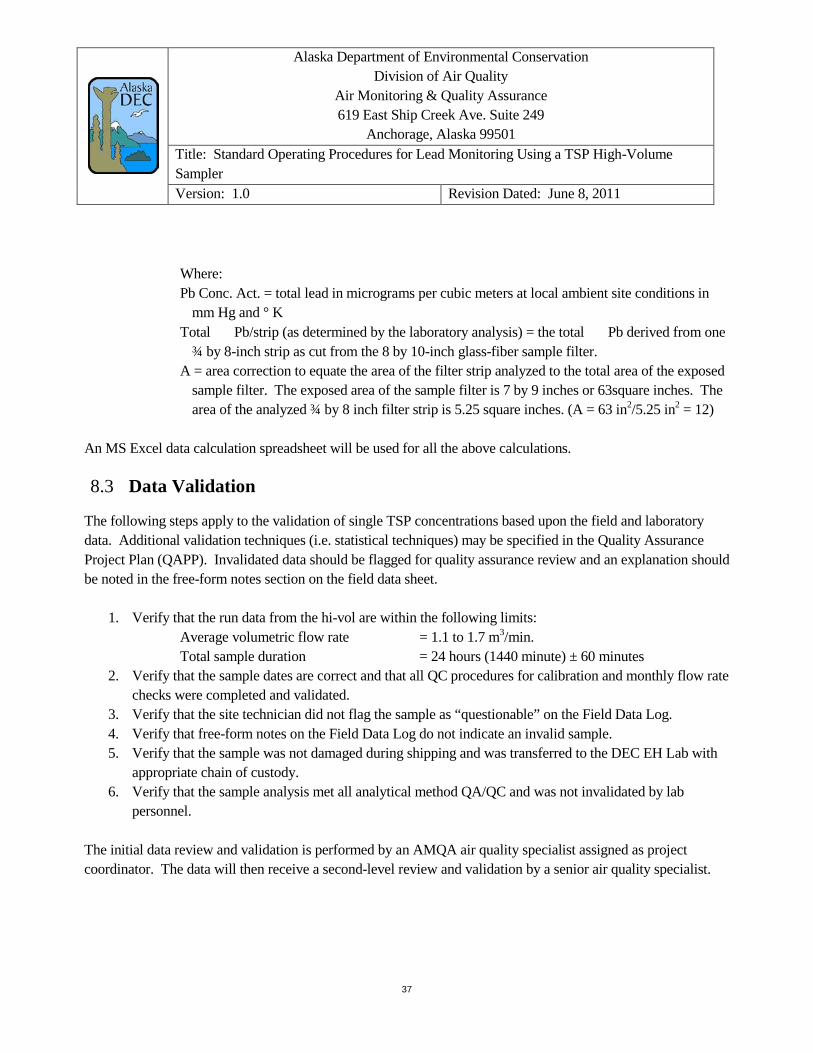
Where: Pb Conc. Act. = total lead in micrograms per cubic meters at local ambient site conditions in
mm Hg and ° K Total Pb/strip (as determined by the laboratory analysis) = the total Pb derived from one
¾ by 8-inch strip as cut from the 8 by 10-inch glass-fiber sample filter. A = area correction to equate the area of the filter strip analyzed to the total area of the exposed
sample filter. The exposed area of the sample filter is 7 by 9 inches or 63square inches. The area of the analyzed ¾ by 8 inch filter strip is 5.25 square inches. (A = 63 in2/5.25 in2 = 12)
An MS Excel data calculation spreadsheet will be used for all the above calculations.
8.3 Data Validation
The following steps apply to the validation of single TSP concentrations based upon the field and laboratory data. Additional validation techniques (i.e. statistical techniques) may be specified in the Quality Assurance Project Plan (QAPP). Invalidated data should be flagged for quality assurance review and an explanation should be noted in the free-form notes section on the field data sheet.
1. Verify that the run data from the hi-vol are within the following limits: Average volumetric flow rate = 1.1 to 1.7 m3/min. Total sample duration = 24 hours (1440 minute) ± 60 minutes
2. Verify that the sample dates are correct and that all QC procedures for calibration and monthly flow rate checks were completed and validated.
3. Verify that the site technician did not flag the sample as “questionable” on the Field Data Log. 4. Verify that free-form notes on the Field Data Log do not indicate an invalid sample. 5. Verify that the sample was not damaged during shipping and was transferred to the DEC EH Lab with
appropriate chain of custody. 6. Verify that the sample analysis met all analytical method QA/QC and was not invalidated by lab
personnel. The initial data review and validation is performed by an AMQA air quality specialist assigned as project coordinator. The data will then receive a second-level review and validation by a senior air quality specialist.
Alaska Department of Environmental Conservation Division of Air Quality
Air Monitoring & Quality Assurance 619 East Ship Creek Ave. Suite 249
Anchorage, Alaska 99501 Title: Standard Operating Procedures for Lead Monitoring Using a TSP High-Volume Sampler Version: 1.0 Revision Dated: June 8, 2011
38
8.4 Quarterly Reports
A lead TSP quarterly report is a report that puts all of the operational information recorded from each calendar quarter into one file for review, processing, and data submission. The lead quarterly reports must include copies of all of the data used to calculate µg/m3. The quarterly report is a MS Excel® workbook with individual worksheets as labels tabs. The quarterly report will consist of the following individual worksheets:
• Comments tab with explanation of data invalidation or qualifiers • Quarterly Data tab with all parameters and equations used to calculate TSP Lead in µg/m3. • Flow Orifice Calibration spreadsheet and certification of traceability • TSP calibration spreadsheet • Monthly Flow Rate Check spreadsheet • Copies of TSP Field Log Sheets and Dickson Charts • QA Performance Audit spreadsheet • Calculation of Network Precision
9 References Cited Code of Federal Regulation
, Title 40, Parts 50, 53, and 58
Quality Assurance Handbook for Air Pollution Measurement Systems, Volume II
, EPA-454/B-08-003, December, 2008