aim: why are graphs important in the field of science?
Post on 19-Dec-2015
224 views
TRANSCRIPT
Aim: Why are graphs important in the field of science?

What is the purpose of a graph?
• Graphs provide an organized way to display data.
• They provide an easier way to see patterns.
• Graphs can be used to make predictions.

Creating a Line Graph• Create a title• Each axis must be properly labeled
along with respective units• Independent Variable: (the cause)
is represented on the horizontal axis (x-axis)
• Dependent Variable: (the effect of result) is represented on the vertical axis (y-axis)
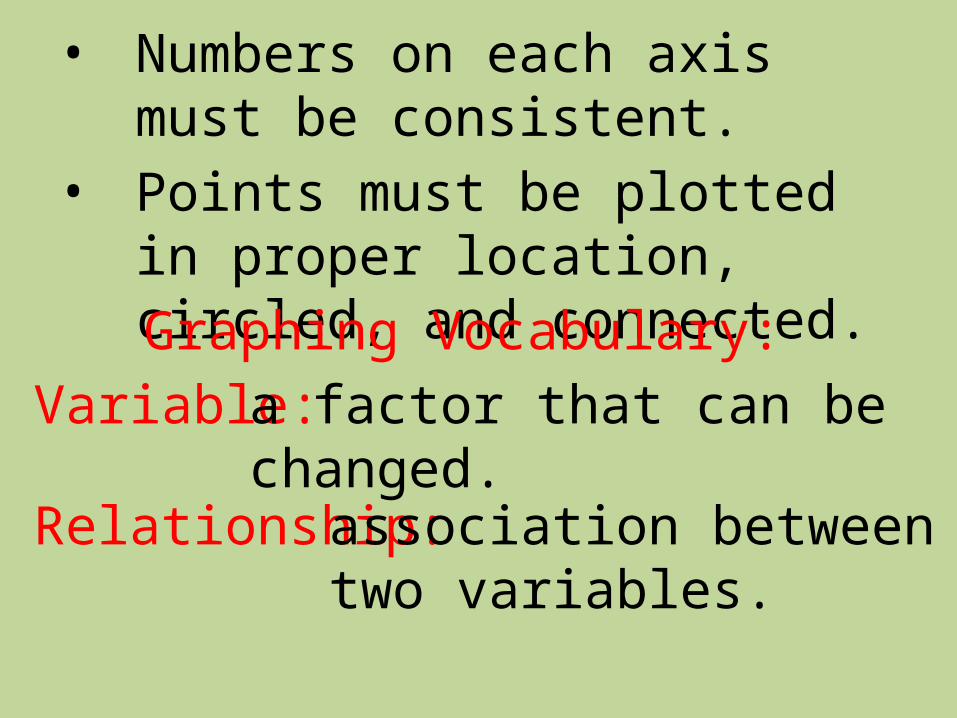
• Numbers on each axis must be consistent.
• Points must be plotted in proper location, circled, and connected.
Graphing Vocabulary:Variable:
Relationship:
a factor that can be changed.
association between two variables.
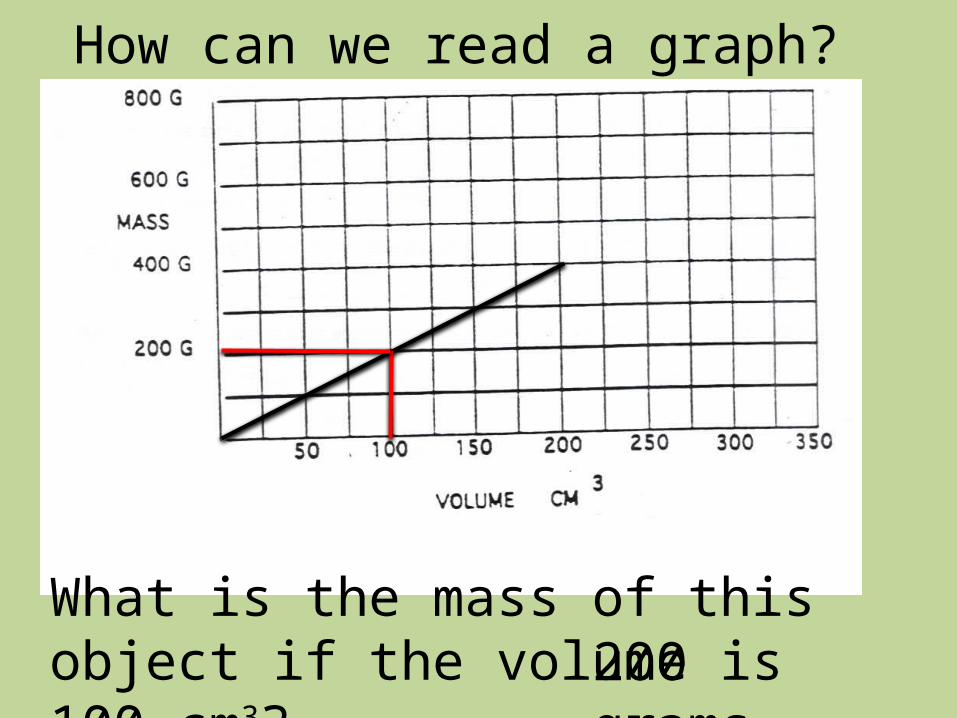
How can we read a graph?
What is the mass of this object if the volume is 100 cm3? 200 grams

A is heavier than BA is shorter than BB weighs less than AB is taller than A
A is faster than BA is younger than BB is slower than AB is older than A

What are the four types of line graphs?
1. Direct Relationship: Te
mp.
(°C)
Time (Hour)
As time increases, the temperature
increases

2. Inverse or Indirect Relationship: Te
mp.
(°C)
Time (Hour)
As time increases, the temperature
decreases
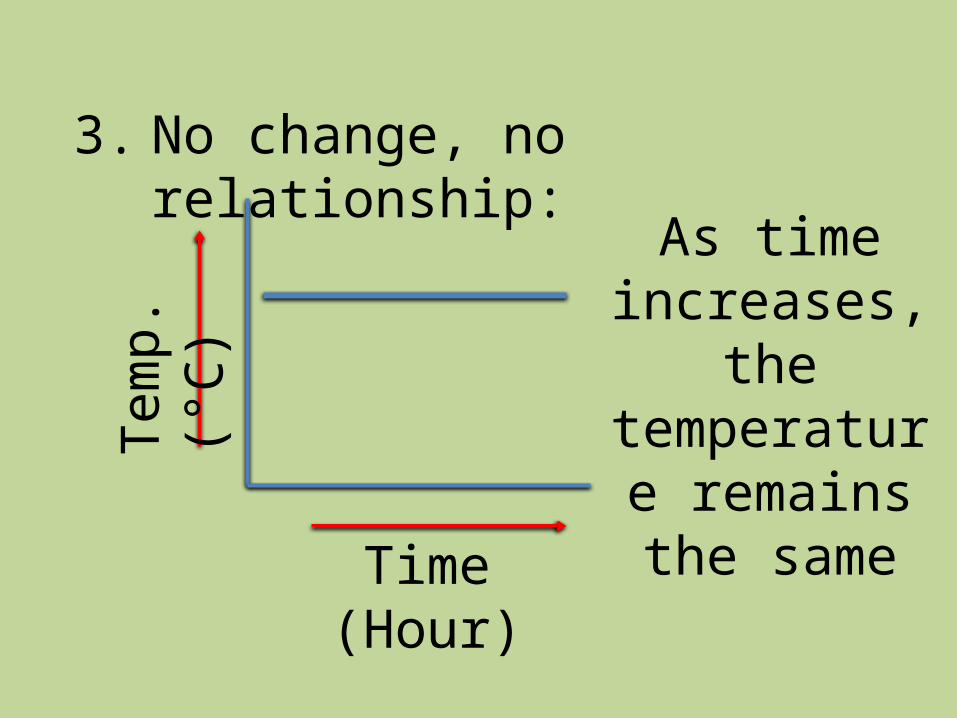
3. No change, no relationship: Te
mp.
(°C)
Time (Hour)
As time increases, the temperature remains the
same

4. Cyclic Event: Te
mp.
(°C)
Time (Hour)
As time increases, the temperature
increases then decreases

How can we extrapolate information from our graph?
Extrapolate: To infer or estimate by extending or projecting known information.
Extend the line of your graph using a straight edge (ruler).

What is the volume of this object if the mass is 400 g?

Summary1. Why are graphs useful?2. What are the two variables plotted
on a graph?3. How many types of graphs are
there? What are their names?4. What does it mean to extrapolate
information from a graph?
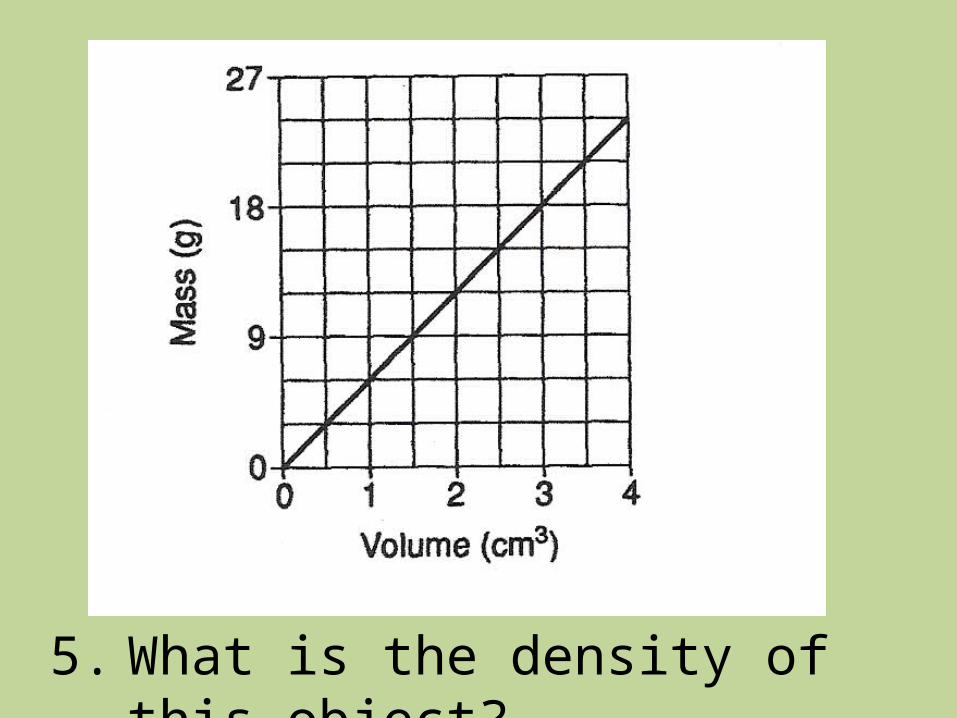
5. What is the density of this object?