aim conference · supplements in liquid form food supplements in solid form 5 plants on 19,500 sm,...
TRANSCRIPT
AIM ConferenceMilan May 27, 2019

2
BioDue Group
BioDueSpA
LaBiotreSrl
51.2%Two Bee
Srl50%
PharcomedMexico SA
50%
PharcomedCorp.
50%
Two Bee ALShpk (Albania)
100%
FarcodermaSrl
43.4%
P. Guasti18.1%
V. Benedetti37.2% Turnover
41.0 mln€
EBITDA margin17.8%
Production19,500 smOffices
1,500 sm
Employees160
EBITDA7.4 mln€
NFI10.5 mln€
Floating20.7%
R. Benedetti23.1%
Consolidated data2018
ALSSrl40%

0
5
10
15
20
25
30
35
40
4519
86
198
7
198
8
198
9
199
0
199
1
199
2
199
3
199
4
199
5
199
6
199
7
199
8
199
9
20
00
20
01
20
02
20
03
20
04
20
05
20
06
20
07
20
08
20
09
20
10
20
11
20
12
20
13
20
14
20
15
20
16
20
17
20
18
20
19
20
20
ANNO
3
Milestones and RevenuesConsolidated Revenues 3M199.9 mln€ (+1.4%)
Consolidated Revenues 201841.0 mln€ (+14.8%)
Purchasebrand
Pharcos VanniBenedettiChairman
IdeationbrandBiOfta
merger ofSelerbe
FoundationLaBiotre
IPO AIM
patentREWCAP
TM
mln€
Expansion ofLiquid food
supplement plant
Purchase Logistics plant and Envelops plant
Purchaseownership inFarcoderma

4
Divisions
CONTRACTMANUFACTURING
OWN BRANDSPharcos, BiOfta, Selerbe
FLEXIBILITY 140 production lines
WIDE RANGE pharmaceutical forms
VERTICAL integration
INTEGRATED offer of customer services
3 BUSINESS LINES
Pharcos dermatology
BiOfta ophthalmology
Selerbe phytotherapic products
BioDue Group develops, manufactures and commercializesfood supplements, cosmetics, Medical Devices for
main national and international companies and for its own brands
Revenues 3M195.3 mln€ (-4.5%)
Revenues 201820.4 mln€ (+4.9%)
Revenues 3M193.8 mln€ (+6.4%)
Revenues 201818.0 mln€ (+11.0%)

5
Industrial DivisionMedicalDevices
Dermo-cosmetics
Foodsupplements
in liquid form
Foodsupplementsin solid form
5 plants on 19,500 sm, in Tavarnelle Val di Pesa (Florence)Certifications GMP, EN ISO 13485 DM, reg. FDA USA
Customers national and international leading pharmaceutical companies(3.5/4.5 mln€ 5 years exclusive with a global healthcare company, see 9/5 press rel.)
RewcapTM new patented pharmaceutical form

6
Own Brands DivisionITALY
REST OF THE WORLD
approx. 4o monomandatory pharmaceutical informants
who reach exclusively dermatologists and ophthalmologists
American Continent JV Pharcomed Corp.
Europe, Asia and Arab countries: agreements with local distributors
Revenues 3M191.5 mln€ (+7.4%)
Revenues 20188.4 mln€ (+2.8%)
7
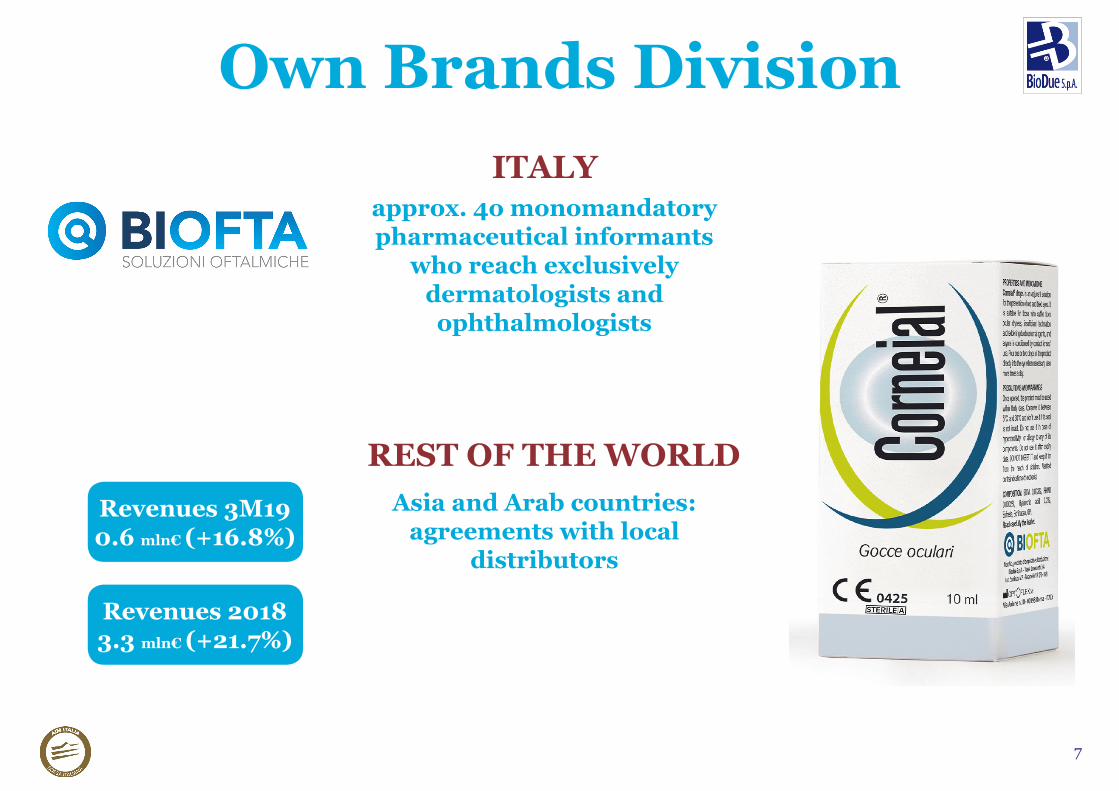
Own Brands DivisionITALY
approx. 4o monomandatory pharmaceutical informants
who reach exclusively dermatologists and ophthalmologists
Asia and Arab countries: agreements with local
distributors
Revenues 3M190.6 mln€ (+16.8%)
Revenues 20183.3 mln€ (+21.7%)
REST OF THE WORLD

8
Own Brands DivisionITALY
approx 40 monomandatary and plurimandatory agents
with a full coverage of Italian territory
Private-label products on pharmacists
Agreemeents with local distributors in Europe
and in Extra-UE countries
Revenues 3M191.7 mln€ (+2.1%)
Revenues 20186.3 mln€ (+18.2%)
REST OF THE WORLD
9
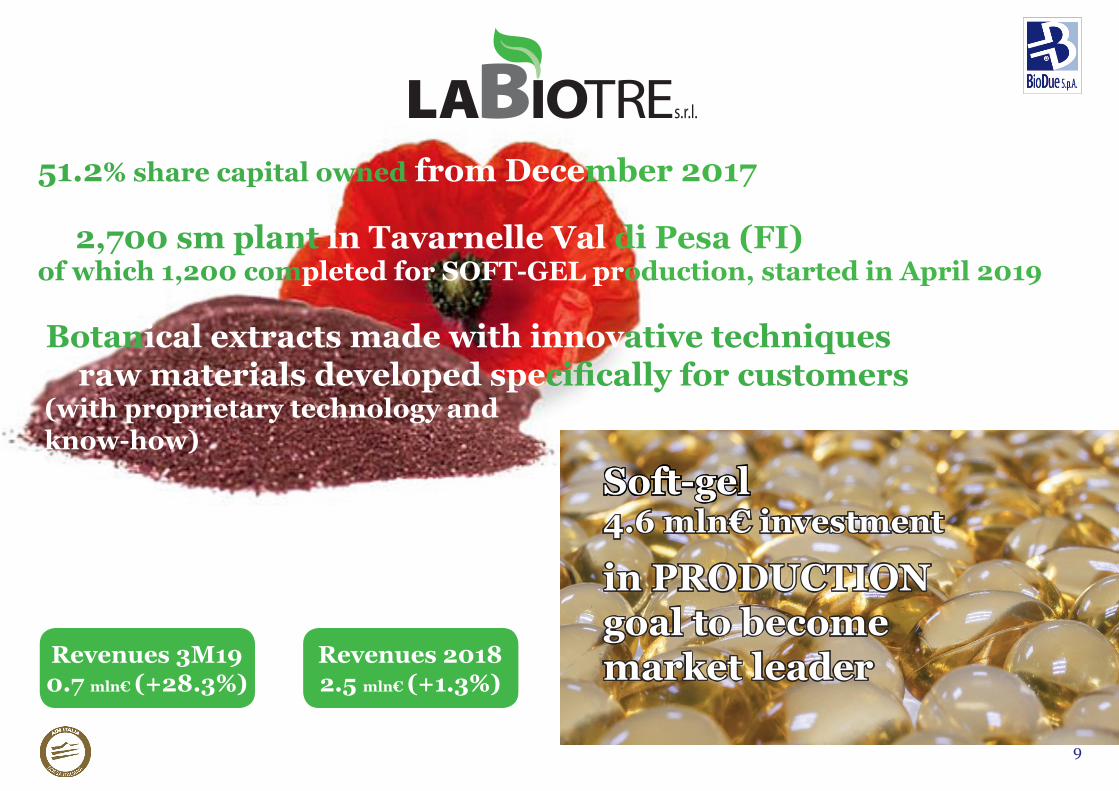
51.2% share capital owned from December 2017
2,700 sm plant in Tavarnelle Val di Pesa (FI)of which 1,200 completed for SOFT-GEL production, started in April 2019
Botanical extracts made with innovative techniques raw materials developed specifically for customers (with proprietary technology and know-how)
Soft-gel 4.6 mln€ investment
in PRODUCTIONgoal to becomemarket leaderRevenues 3M19
0.7 mln€ (+28.3%)Revenues 20182.5 mln€ (+1.3%)

ContractManufacturing
10
Turnover Evolution
mln€
34.635.7
41.0
19.619.520.4
7.8 8.2 8.4
4.45.3
6.3
2.5 2.73.3
2.5
2016 2017 2018
ContractManufacturing
11
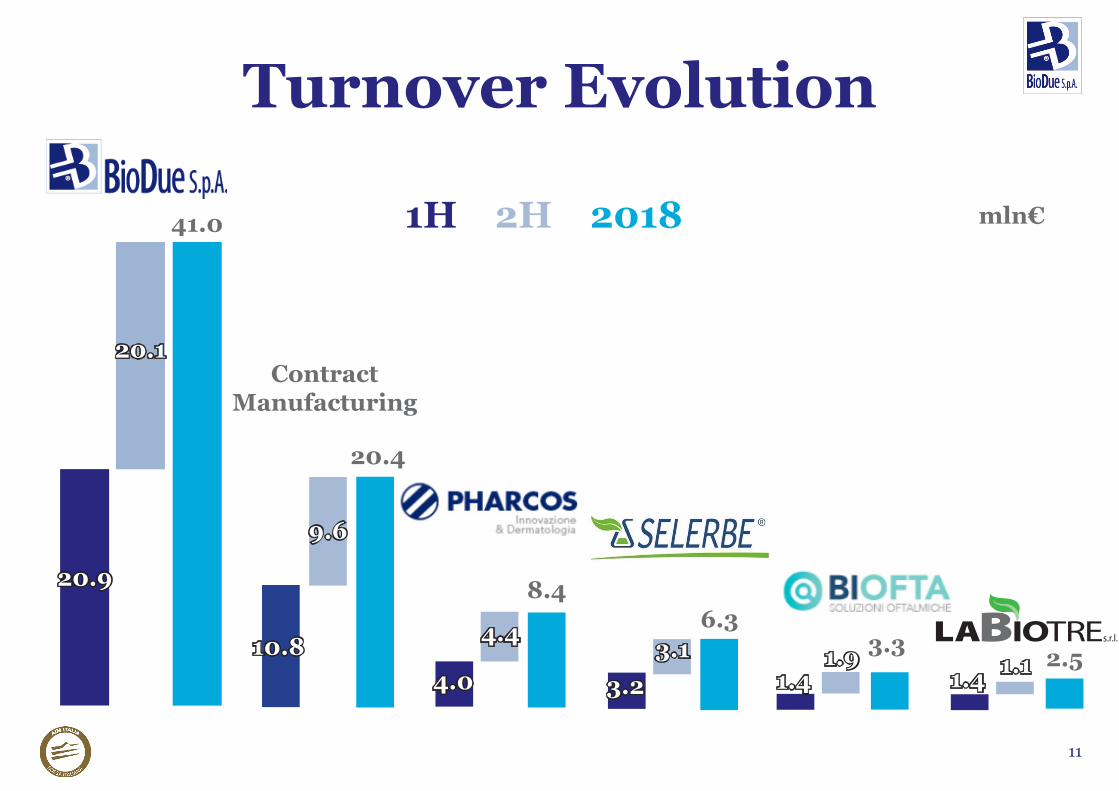
Turnover Evolution
mln€
20.9
20.1
41.0
10.8
9.6
20.4
4.0
4.4
8.4
3.23.1
6.3
1.41.9 3.3 2.5
1H 2H 2018
1.4 1.1

12
43.42% share capital owned from July 2018
5,000 sm plant in Torre Pallavicina (BG) of which 2,500 sm nearing completion
1,500 sm plant in Calcio (BG)
Production of Medical Devices, Cosmetics,Food supplements and veterinary products
• High production technology in pharma-grade environments• Access to new pharmaceutical forms (stick pack, vials with airless technology)
Deep industrial integration
Revenues 3M192.4 mln€ (+30.0%)
EBITDA 20181.3 mln€ (-24.0%)
EBITDA Margin 201818.2%
NFI 20183.9 mln€
Revenues 20186.9 mln€ (+16.4%)

13
40% share capital owned from April 2019
Merger of ALS Srl and AUTOMA Srl
Specialization in pharmaceutical industrymachine building
Better efficiency due to machines programmedmaintenance and purchase
Greater commercial development inAsian markets
EBITDA Margin 20186.7% 13.8%
NFI 2018zero 1.3 mln€
Revenues 20181.2 mln€ 1.3 mln€
ALS AUTOMA Srl Srl
14
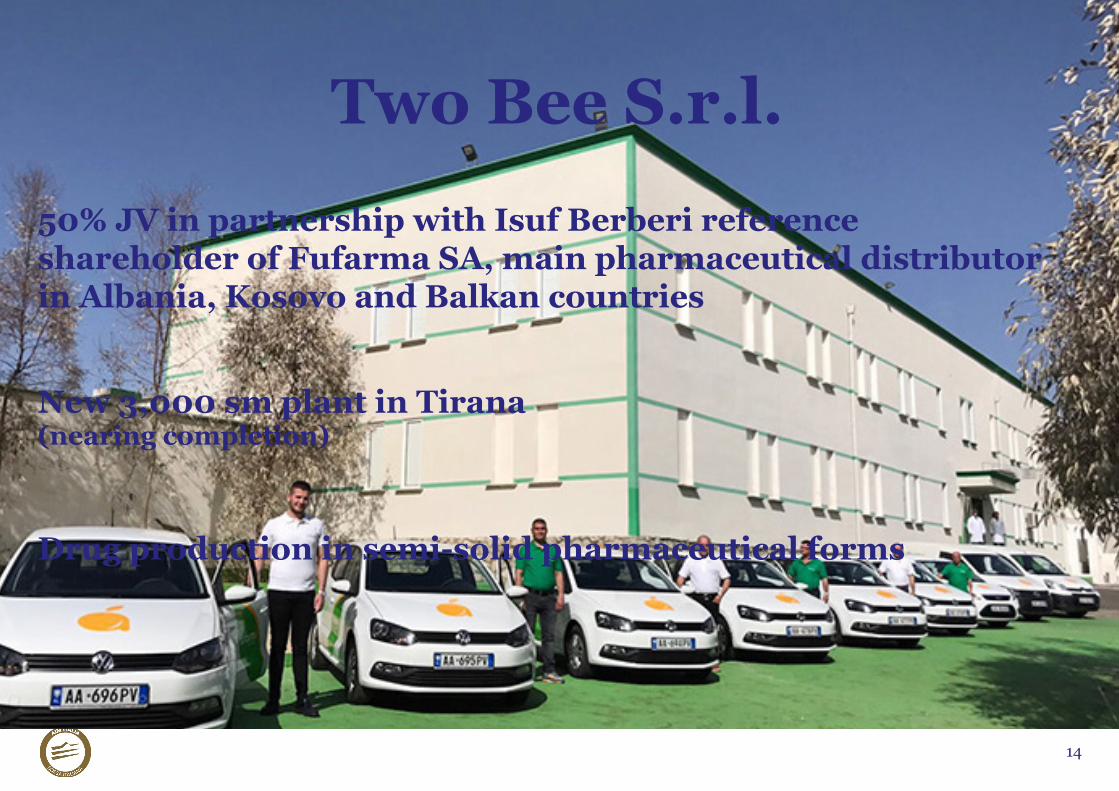
Two Bee S.r.l.
50% JV in partnership with Isuf Berberi referenceshareholder of Fufarma SA, main pharmaceutical distributorin Albania, Kosovo and Balkan countries
New 3,000 sm plant in Tirana (nearing completion)
Drug production in semi-solid pharmaceutical forms
15
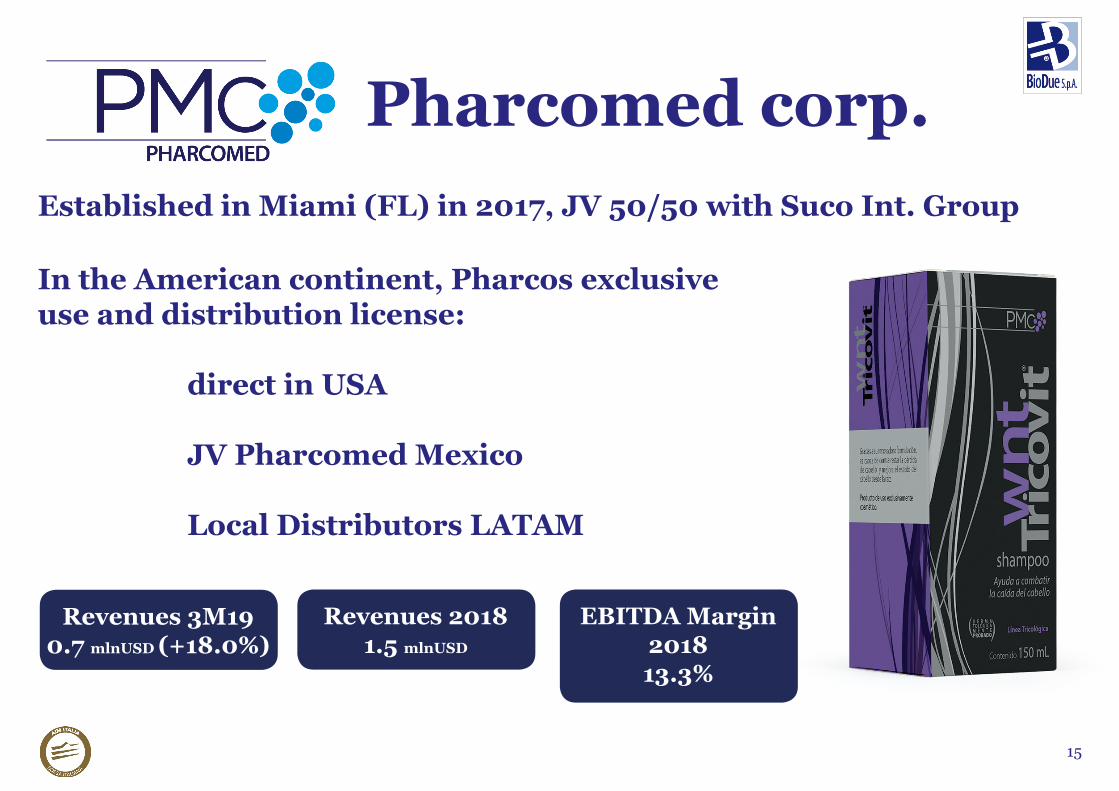
Pharcomed corp.Established in Miami (FL) in 2017, JV 50/50 with Suco Int. Group
In the American continent, Pharcos exclusiveuse and distribution license:
direct in USA
JV Pharcomed Mexico
Local Distributors LATAM
Revenues 3M190.7 mlnUSD (+18.0%)
Revenues 20181.5 mlnUSD
EBITDA Margin201813.3%

16
Trademarks and PatentsBioDue continuously invests in the registration of trademarks and patents
150 owned brands, of which8 with European extension18 with extra-European extension9 patented formulations with national, European and international extension
17
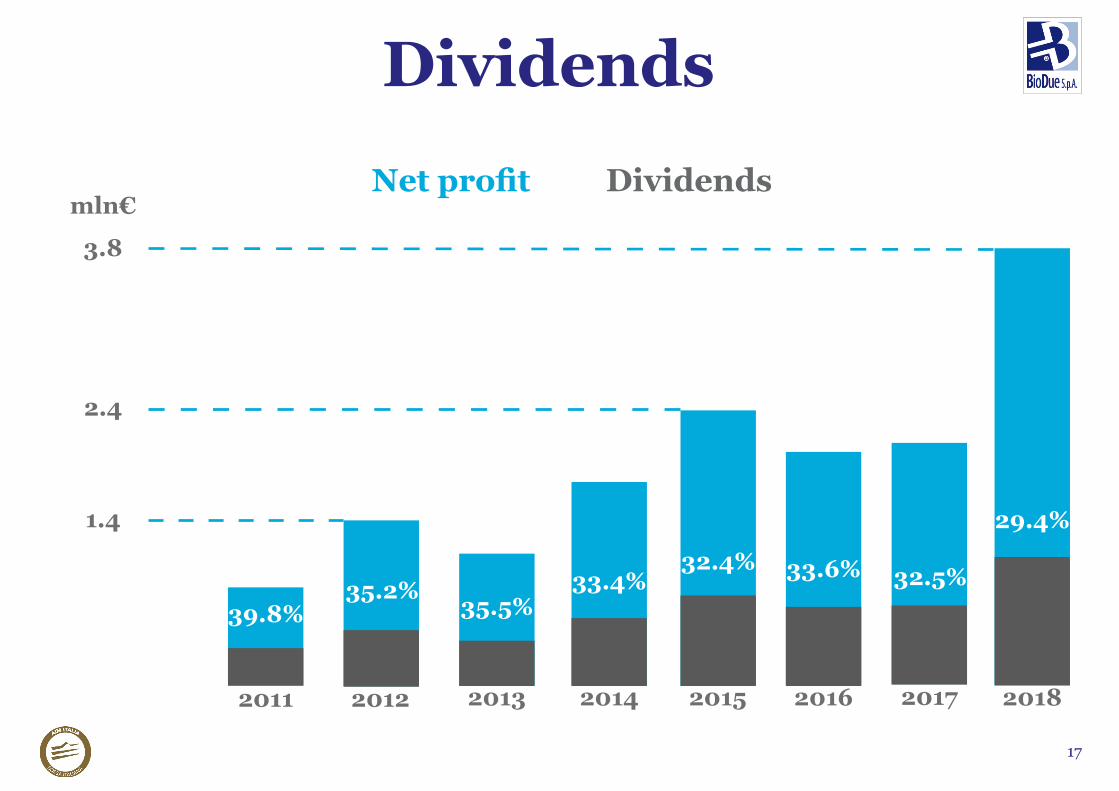
Dividends
mln€Net profit Dividends
29.4%
3.8
32.5%33.6%32.4%33.4%
35.5%35.2%
39.8%
2.4
1.4
20182017201620152014201320122011

18
Income data(in millions of Euro)
December 31
2018 % December 31 2017 % Change %
TOTAL REVENUES 41.5 100.0% 36.3 100.0% 14.5%
EBITDA 7.4 17.8% 4.6 12.6% 62.3%
EBIT 5.4 12.9% 3.2 8.7% 69.1%
Net Profit 4.1 9.9% 4.1 11.4% -0.3%
Net Profit attributable to equity holders of the parent 4.0 9.6% 4.1 11.4% -3.3%
(income data of LaBiotre Srl are consolidated from 2018)
19
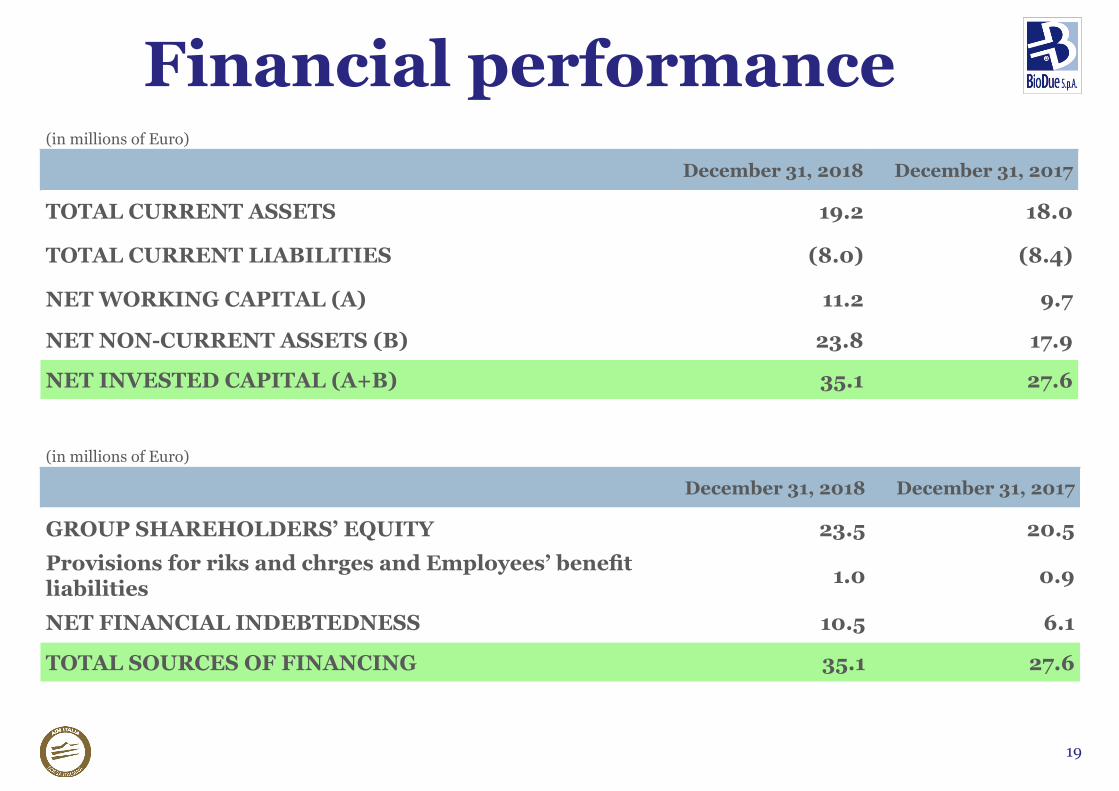
Financial performance(in millions of Euro)
December 31, 2018 December 31, 2017
TOTAL CURRENT ASSETS 19.2 18.0
TOTAL CURRENT LIABILITIES (8.0) (8.4)
NET WORKING CAPITAL (A) 11.2 9.7
NET NON-CURRENT ASSETS (B) 23.8 17.9
NET INVESTED CAPITAL (A+B) 35.1 27.6
(in millions of Euro)
December 31, 2018 December 31, 2017
GROUP SHAREHOLDERS’ EQUITY 23.5 20.5Provisions for riks and chrges and Employees’ benefit liabilities 1.0 0.9
NET FINANCIAL INDEBTEDNESS 10.5 6.1
TOTAL SOURCES OF FINANCING 35.1 27.6
20
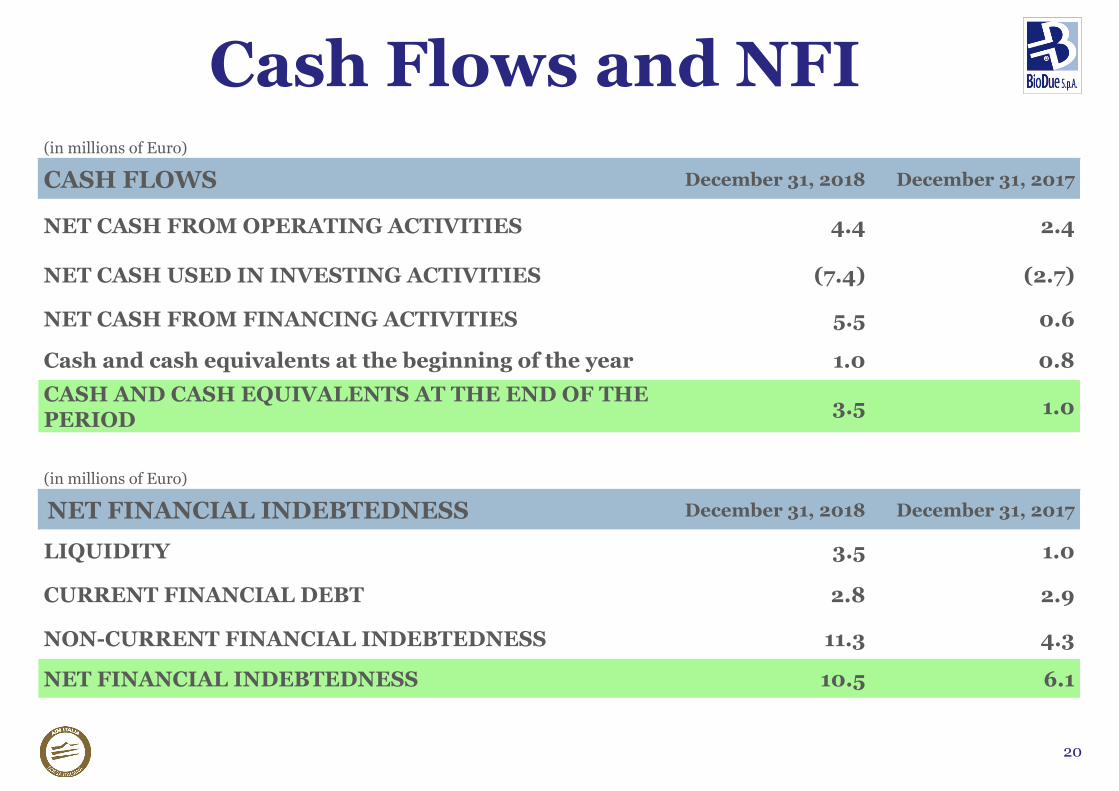
Cash Flows and NFI(in millions of Euro)
CASH FLOWS December 31, 2018 December 31, 2017
NET CASH FROM OPERATING ACTIVITIES 4.4 2.4
NET CASH USED IN INVESTING ACTIVITIES (7.4) (2.7)
NET CASH FROM FINANCING ACTIVITIES 5.5 0.6
Cash and cash equivalents at the beginning of the year 1.0 0.8CASH AND CASH EQUIVALENTS AT THE END OF THE PERIOD 3.5 1.0
(in millions of Euro)
NET FINANCIAL INDEBTEDNESS December 31, 2018 December 31, 2017
LIQUIDITY 3.5 1.0
CURRENT FINANCIAL DEBT 2.8 2.9
NON-CURRENT FINANCIAL INDEBTEDNESS 11.3 4.3
NET FINANCIAL INDEBTEDNESS 10.5 6.1
21
Strategic plan and goalsPlacement on Own Brands 42.0% of non consolidated revenues 3M19, +2.6 pp vs 3M1846.7% of non consolidated revenues 2018, +1.3 pp vs 2017
Development of foreign markets through agreements with local distributors or JV
Industrial focus on innovative pharmaceutical forms (RewcapTM)
Thank you !