agricultural trade liberalization and poverty in china
TRANSCRIPT

China Economic Review 18 (2007) 244–265
Agricultural trade liberalization and poverty in China
Jikun HUANG a,⁎, Yang JUN a, Zhigang XU a,Scott ROZELLE b, Ninghui LI c
a Center for Chinese Agricultural Policy, Institute of Geographical Sciences and Natural Resource Research,Chinese Academy of Sciences, China
b Department of Agricultural and Resource Economics, University of California, Davis, United Statesc Agricultural Economics Institute, Chinese Academy of Agricultural Sciences, China
Abstract
The overall goal of this paper is to examine the impacts of trade liberalization on China's agriculture, ingeneral, and poverty, in particular. The impacts on agriculture are analyzed by commodity and by region.Because different farmers (especially those in different income brackets) produce diverse sets of commodities,themain part of our paper analyzes the effects on households and their implications for the poverty through thesimulation of household production and consumption changes in response to the trade-induced market priceschanges on a disaggregated (by province), household-level basis. The results of our analysis lead to theconclusion that, unlike fears expressed in the popular press and by some scholars, the positive impacts of tradeliberalization are actually greater than the negative ones. Although other effects on the rural economy fromtrade liberalization of other subsectors (such as textiles) may be equally large or even larger, this study's focuson the agricultural sector shows that there will be an impact from agricultural trade liberalization and that thenet impact is positive for the average farm household in China. However, policymakers still need to beconcerned. Not all households and not all commodities will be treated equally. Our findings show that poorerhouseholds, especially those in the provinces in the western parts of China, will be hurt. The main reason isthat the farmers in Western China are currently producing commodities that are receiving positive rates ofprotection, rates of protection that will fall with additional trade liberalization. Hence, if policymakers want tominimize the impacts, there needs to be an effort to minimize the effect on these households either by directassistance or by eliminating constraints that are keeping households from becoming more efficient by shiftingtheir production more towards those commodities that will benefit from trade liberalization.© 2007 Elsevier Inc. All rights reserved.
JEL classification: F1; Q17; 053Keywords: Agriculture; Trade; Liberalization; Poverty; China
⁎ Corresponding author.E-mail address: [email protected] (J. Huang).
1043-951X/$ - see front matter © 2007 Elsevier Inc. All rights reserved.doi:10.1016/j.chieco.2007.02.003

245J. Huang et al. / China Economic Review 18 (2007) 244–265
1. Introduction
China's economy has experienced remarkable growth since the economic reforms wereinitiated in the late 1970s, a shift in policy that has led to a sharp decline in the nation's poverty.The annual growth rate of gross domestic product (GDP) was nearly 9% in 1979–2003(NSBC, 2003a). In the past two and half decades, based on China's official poverty line, morethan 230 million rural residents have escaped poverty; the absolute level of poverty fell from260 million in 1978 to less than 30 million in 2002 (NSBC, 2003b). The incidence of ruralpoverty has fallen equally fast, plunging from 32.9% in 1978 to less than 3% in 2002.
While China's past record of economic growth and poverty reduction is impressive, there arestill great challenges ahead. The agricultural growth rate has declined since the late 1980s. Risinginput levels in many areas of China and diminishing marginal returns mean that increasing inputswill not provide large increases in output. Water shortages and increasing competition fromindustry and domestic use for the remaining scarce supplies do not provide much hope for largegains in area or yields from new irrigation expansion. In the future, many have predicted thatalmost all gains will be productivity driven and these will have to come from second- and third-generation Green Revolution technologies (Huang, Rozelle, Pray, & Wang, 2002).
Despite the fall in poverty rates, the growth of the economy during the past 25 years also wasaccompanied by the large income disparities. The income gaps among regions, between urbanand rural and among households within the same location have increased steadily since themiddle 1980s (Riskin and Khan, 2001). By 2002 the ratio of urban to rural incomes exceeded 3.4(NSBC, 2003a). Income disparities have risen within rural areas. The rising income disparitywithin rural areas is seen by rising Gini coefficients, which increased from 0.24 in 1980 to 0.35 in2000 (NSBC, 2003b).
Trade liberalization, perhaps more than any other dimension of China's policy environment,presents some of the greatest challenges to the future of China's agriculture and rural economy.Agriculture was at (will be at) the center of discussion of China's entry into the WTO (future tradeliberalization talks) for two reasons. First, there is a general perception that the actors in the ruraleconomy are particularly vulnerable to opening competition with the agricultural economieselsewhere in the world. Second, despite the low and falling share that agriculture contributes toGDP in China and other nations, the importance of the agricultural sector are disproportionatelygreat in political economy terms (in both China and other nations).
Because of the magnitude and sensitivity of the challenge, debates on the future of China'sagriculture continue. Some argue that the impact of WTO accession on China's agriculture will besubstantial, adversely affecting hundreds of millions of farmers (Carter & Estrin, 2001; Li, Zhai,Wang, & Development Research Center, 1999). Others believe that, although some impacts willbe negative, and even severe in specific areas, the overall effect of accession on agriculture will bemodest (Anderson, Huang, & Ianchovichina, 2004; Martin, 2002). Although the general absenceof empirically-based research on these issues is ultimately underlying the reason why those ondifferent sides of the debate see things so differently, Huang, Rozelle, and Chang (2004) arguethat the confusion about the ultimate impact of WTO accession, specifically, and tradeliberalization, in general, on agriculture can be traced to a general lack of understanding of thepolicy changes that accession will engender (Huang et al., 2004). Moreover, the misunderstand-ing of the policy effects themselves can be traced to a lack of understanding of the fundamentalfacts about the nature of the distortions to China's economy on the eve of its WTO entry.
Although China's joining the World Trade Organization (WTO) may have significantimplications to world trade and China's economy, trade economists have produce little empirical

246 J. Huang et al. / China Economic Review 18 (2007) 244–265
research that are able to answer even the most basic questions about the expected effects ofChina's entry in the WTO on the poor. In our previous work (Huang, Li, & Rozelle, 2003), weshowed that, on balance, the nation's accession to WTO helps rural residents and improvesincomes. However, these studies themselves have shortcomings that limit the analytical power tocoarse, aggregate conclusions.
The overall goal of this paper is to have a better understanding of China's agriculture andexamine the impacts of trade liberalization on China's agriculture, in general, and poverty, inparticular. The impacts on agriculture are analyzed by commodity and by region of the country.Because different farmers (especially those in different income brackets) produce diverse sets ofcommodities, the main part of our paper analyzes the impacts on households and their implicationsfor the poverty through the simulation of household production and consumption changes inresponse to the market prices changes on a disaggregated (by province), household-level basis.
The paper is organized as follows. In Section 2, we briefly describe an overview of China's pasttrade liberalization efforts as a way to describe the environment within which the WTO accessionwas taking place. Section 3 presents a new set of nominal protection rates (NPRs) that we estimatefor late 2001, a time right before China's accession to the WTO. We use these NPR estimates as abaseline against which we can measure the effect of trade liberalization between 2001 and 2004. Adescription of China's WTO accession is presented in Section 4 and Section 5 describes themethodologies and data used in this study. The results showing our findings on the impact ofWTO on China's agriculture and poverty are presented in Sections 6 and 7. Section 8 concludes.
2. International trade liberalization prior to China's WTO accession
Although analysts that have examined China's accession to the WTO often write as if the tariffreductions and WTO-specific policies are a watershed event in China, in fact, China's leadershave been pushing trade liberalization for many years prior to China's entry into the WTO andhave used different policy instruments in their efforts to integrate China's domestic economy withthe rest of the world (although it should be realized that part of the impetus for the earlier changeswere precisely because China was interested in joining the WTO). In this section we look at anumber of these policies: exchange rate policy; the liberalization of the right to import without alicense; the reduction in export subsidies; and the reduction of tariff rates.
2.1. Foreign exchange policy
Historically, the overvaluation of domestic currency for trade protection purposes wasresponsible for reducing agricultural incentives (Huang & Chen, 1999). Real exchange ratesremained constant and even appreciated during the 30 years prior to reforms (during the 1950s,1960s and 1970s). Hence, on the eve the reforms, given the tradable status of agriculturalcommodities, China's exchange rate policy was working against the agricultural sector.
After reform, however, the exchange rate depreciated rapidly. With the exception of severalyears of domestic price inflation during the mid-1980s, from 1978 to 1992 the real exchange ratedepreciated on almost a yearly basis, falling by more than 400%. Falling exchange rates increasedthe export agriculture's competitiveness, contributing to China's record of rapid export growth(especially in non-grain commodities) and the robust economic performance of the 1980s.
The situation, however, has shifted since the early 1990s. Between 1992 and 1997 the realexchange rate actually appreciated by about 30%. Moreover, the pressure to appreciate the RMB(or Chinese yuan) from its major trade partners is growing. So far, except for a minor adjustment

247J. Huang et al. / China Economic Review 18 (2007) 244–265
in 2004, China's government has elected to maintain its current exchange rate policies; nationalleaders at the current time believe that a stabilized foreign exchange rate is one of the keys tomaintaining a stable national economy. Hence, in the past (and certainly in the future) China'sexchange rate policy has affected the agricultural sector and its trade.
There also have been other exchange rate-associated policies beyond managing the rate itself.For example, China has accelerated the reform of foreign exchange management. The nation'suse of export subsidies also fell prior to WTO accession. Moreover, China is considering togradually eliminate export tax rebates in order to avoid the sharp increases in its holding offoreign exchange reserves.
2.2. Liberalizing international trade
Foreign trade liberalization has gone far beyond the relaxation of China's foreign currencycontrols. During the same period, China was in the process of implementing a series of measuresto liberalize its international trading system. In the initial years most of the fall in protection camefrom a reduction in the number of commodities that were controlled by single desk state traders(Huang & Chen, 1999). In the case of many products, competition among non-state foreign tradecorporations began to stimulate imports and exports (Martin, 2002). Although several majoragricultural commodities were not included in the move to decentralize trade, the new tradeliberalization efforts spurred the export on many agricultural goods. Policy shifts in the 1980s and1990s also changed the trading behavior of state traders. Finally, in the 1980s and 1990s, leadersallowed the state traders to increase imports.
The implementation of the subsidy reform policy, however, was not implemented evenlyacross crops (Huang et al., 2004). For example, by the mid- to late-1980s, payment of exportsubsidies to traders were reduced for crops such as rice (during most years). However, on the eveof China's accession to the WTO, field surveys found that budgetary authorities were stillproviding exporters of cotton and maize between 10 and 30% or more of the value of the cropafter each export transaction. Clearly, then, to the extent that China's WTO agreement is expectedto have an impact due to its commitment to reduce export subsidies, the impact will affect cottonand maize farmers more, not because rice exports were never subsidized, but mainly because thesubsidies had already been reduced by the time the accession agreement took effect.
Moves to relax rights of access to import markets and to reduce distorting export subsidieswere matched by actions to reduce the taxes on imports that were being assessed at the border. Infact, China's leaders began to systematically reduce tariff rates in the early 1990s. From 1992 to1998 the simple average agricultural import tariff fell from 42 to 24%. Between 1998 and 2001the average rate further fell to 21% (MOFTEC, 2002).
It should be noted, however, that like the reduction in the payment of the export subsidies, thetariff rate reductions differed by crop. Some, such as soybeans, had fallen to 3% by 2001. Others,such as those on sugar and dairy products, were still well above 30%. Also, as is the case for thepayment of exports, the differences across products in tariff rate protection mean that the effect ofWTO tariff cuts will differ by crop and the accession's liberalization should affect farmers indifferent areas differently.
2.3. Impacts on trade
In the same way that trade liberalization has affected growth in the domestic economy (Lardy,2001), changes in the external economy have affected the nature of China's trade patterns (Huang

Fig. 1. Agricultural trade balance by factor intensity (mil US$), 1985–2003. Source: data are from various publications ofChina's National Statistical Bureau and China's Custom Authority. Land intensity products include grain, oils, sugar andcotton and wool; labor intensity products include livestock, fish, horticulture and beverages.
248 J. Huang et al. / China Economic Review 18 (2007) 244–265
& Chen, 1999). Whereas the share of primary (mainly agricultural) products in total exports wasover 50% in 1980, it fell to only 10% after 2001 (NSBC, 2003a). Over the same period, the shareof food exports in total exports fell from 17 to 5%. The share of food imports fell from 15 to 2%.
Disaggregated, crop-specific trade trends show equally sharp shifts and suggest that exportsand imports increasingly are moving in a direction toward products in which China has acomparative advantage and therefore have also facilitated the structural changes in the nation'sagriculture (Anderson et al., 2004). The net exports of land-intensive bulk commodities (that is,those commodities in which the labor share of total production cost is low when based on factorintensity), such as grains, oilseeds and sugar crops, have fallen; exports of higher-valued, morelabor-intensive products, such as horticultural and animal (including aquaculture) products, haverisen (Fig. 1). This also can be seen in other ways. For example, the proportion of grain exports,which was only around 20% of total agricultural exports in the 1990s, was less than half of what itwas in the early 1980s. By the late 1990s horticultural products and animal and aquatic productsaccounted for about 80% of agricultural exports (Huang & Chen, 1999).
3. Nominal protection rates
Estimating nominal protection rates (NPRs—or the difference between the domestic price ofcommodity in a port city of China and the price of the imported commodity, CIF, also in the portcity) in the period of time immediately before China acceded to the WTO is a key part ofestablishing a baseline against which to compare the effect of China's recent trade liberalizationefforts. Hence, the first step of our analysis is to estimate a set of NPRs for each commodity for2001, prior to the time that China joined the WTO. For those commodities that either Chinasimultaneously imports and exports (e.g., rice and maize) or for those commodities in which thedifference of imports and exports over the past decades has not been large (e.g., certain types ofcash crops and meat products—e.g., cotton and beef), we estimated NPRs based on both CIF and

Table 1Nominal protection rates (NPRs) and sources of policy distortions (tariff rates, the value added tax—VAT – and non-tariffbarriers—NTBs) in China, 2001
Import tariff equivalents Export subsidy equivalents
Tariff rate VAT NTB China NPR Tax rebate Subsidy NTB abroad NPR
Rice 1 13 3 17 1 0 −9 −8Wheat 1 13 1 15Maize 1 13 8 22 32 0 32Other grains 1 13 1 15Soybean 3 13 1 17Cotton 3 13 2 18 5 10 0 20Oilseed 13 13 21 47Sugar crops 25 15 10 50Vegetable 1 0 −11 −10Fruits 1 0 −11 −10Pork (meat) 5 0 −25 −20Beef 45 15 0 60 5 0 −13 −8Mutton 5 0 −10 −5Poultry (meat) 20 15 0 35 13 0 −30 −17Egg 1 0 −5 −4Milk 50 17 0 67Fish 5 0 −20 −15
249J. Huang et al. / China Economic Review 18 (2007) 244–265
FOB prices. Because there are differences among major varieties of individual agriculturalcommodities (e.g., the NPR of a high quality hard white wheat is more than 20%; while the NPRof soft red wheat is less than 10%), we weigh the NPRs of the different varieties of each majorcommodity to get an average NPR. Crop commodities are weighted by estimates of each variety'ssown area; meat products are weighted by production share.1 The results for all of China's majorcommodities are summarized in Table 1.2
The findings of the NPR analysis are, in fact, of interest in themselves. Our findings show notonly that significantly positive rates of protection exist for a number of China's major field crops,but also that they vary according to the position in which China finds itself (as a net importer or asa net exporter). For example, China's domestic maize prices, according to exporters (and otherinformants), were more than 30%, on average, above world prices. In other words, traders wouldhave lost more than 30% of the value of their shipment, if the government did not subsidize maizeexport transactions. It is interesting to note that the level of protection of maize almost exactlycorresponds to total export subsidies and tax rebates that were being paid to exporters of maizeduring the fall of 2001 (Table 1). Protection rates when considering maize as an import differedamong regions, however. For example, traders in the northeast told our survey team that if they
1 After this procedure is carried out, each product that has what appears to be a traditional NPR. For example, the NPRfor wheat–as a whole–is 15%, but this is really only an average of the NPRs of seven different varieties of wheat thatwere weighted by their area shares. The actual interpretation is that on average, the price of all varieties of domesticallyproduced wheat that are sold in the domestic markets of China's major port cities are 15% above the average CIF price ofall types of imported wheat varieties.2 In this paper our NPRs are calculated from prices–domestic and international–in China's port cities. Because in other
work we have found that China's domestic commodity markets are remarkably integrated (Huang et al., 2004), weassume in the rest of the analysis that shifts in prices that are experienced at the border are largely transmitted to farmersnationwide, including into China's poor areas. If this were not the case, the NPRs would have to be created for each andevery location in China. For a discussion of these issues, see Corden (1997).

250 J. Huang et al. / China Economic Review 18 (2007) 244–265
were not exporting and foreign maize was to come into China, the importer could make, onaverage, 22%.
Table 1 also shows that despite the large volume of increase of soybean imports in recent years,there is still a difference between the CIF and domestic price in the port. The average differencebetween the domestic price and the international price was 17%. In one sense, the fact that there isa remaining price gap is remarkable given that China imported 20MMTs of soybeans in 2003, theofficial tariff is only 3% and the commodity can be traded by any foreign trade company (that is,trading firms do not need to secure a license or quota allocation). On the other hand, the remainingprice gap reminds us that there may be other reasons for distortions beyond tariffs and statetrading. In fact, the gap between the domestic and international price fully demonstratesthe effect of China's policy of assessing a value-added tax on imported soybeans at the border(13% of CIF).
Beside maize, other commodities, such as cotton, edible oil seeds and sugar, were also fairlyhighly protected in 2001 (Table 1). The distortions for these commodities in the fall of 2001 camefrom several sources. In some cases, for example, sugar, the official tariff rate remained high. Thevalue added tax (VAT)–which was being assessed on imports, but not necessarily domesticpurchases–accounted for a large share of the cotton NPR. There were still significantly high non-tariff barriers for edible oil seeds, such as canola and palm oil in 2001.
Our results also find that there are a number of commodities, besides rice, that had negativeNPRs in 2001. When a commodity has a negative NPR, one interpretation is that a country ishaving its commodities implicitly taxed or that something is keeping exports volume from risingand keeping the domestic price from moving up to the international price. Specifically, ourdata show that vegetables, fruit, pork and poultry are facing significant NTBs from the rest ofthe world.
4. China's WTO accession
In its most basic terms, the WTO commitments in the agricultural sector can be classified into3 major categories: market access, domestic support and export subsidies. The commitments onmarket accession will lower tariffs of all agricultural products, increase access to China's marketsby foreign producers of some commodities through tariff rate quotas (TRQs) and removequantitative restrictions on others. In return, China is supposed to gain better access to foreignmarkets for its agricultural products, as well as a number of other indirect benefits. Domesticsupport and export subsidies are the other two critical issues that arose during the course ofnegotiations. Together with a number of other market-access commitments make China's WTOaccession unique among all other developing countries that have been admitted to the WTO'snew environment.
Because of the nation's earlier efforts to liberalize trade (discussed above), some of the directimport market-access commitments that China has made to WTOmembers actually do not appearto be substantial. After acceding to WTO, overall agricultural import tariffs (in terms of its simpleaverage) declined from about 21% in 2001 to 17% by 2004. As seen in the previous discussion, infact, this was really just a continuance of earlier trends. Although important, when taken in thecontext of the discussion in the previous section about China's external economy reforms of thelast two decades, in simplest terms, WTO is not really imposing radical changes on China. Inother words, one would really have to conclude that the WTO accession commitments are merelyextensions of China's past changes; WTO accession can be thought of as another step on China'seconomic opening.

Table 2Import tariff rates on major agricultural products which are subject to tariff-only protection in China
Actual tariff rates in 2001 Effective as of 1 January
2002 2004
Barley 114 (3) a 3 3Soybean 3 b 3 3Citrus 40 20 12Other fruits 30–40 13–20 10–13Vegetables 30–50 13–29 10–15Beef 45 23.2 12Pork 20 18.4 12Poultry meat 20 18.4 10Dairy products 50 20–37 10–12Wine 65 45 14Tobacco 34 28 10
Source: China's WTO Protocol of Accession, November 2001.a Barley imports originally were limited by strict licensing and import quotas; the tariff rate was 3% for imports within
the quota; those beyond the quota were subject to a 114% tariff.b The tariff rate was as high as 114% before 2000, but was lowered to 3% in early 2000.
251J. Huang et al. / China Economic Review 18 (2007) 244–265
Except for national strategic products (grain, cotton, edible oil and sugar), other agriculturalproducts (horticulture, livestock, fishery, wine, tobacco, soybean and barley) have become part ofa tariff-only regime (Table 2). For most commodities in this group, effective protection fell byvarying amounts after the signing of the agreement in late 2001. After an initial fall that tookplace, most of the tariff lines were scheduled to fall even further by 2004 (which—by the way,have indeed fallen, showing that China has been keeping at least most of its WTO promises). Tothe extent that tariffs are binding for some of these commodities, the reductions in tariff ratesshould have stimulated new imports—however, as discussed above, the expected impact shoulddiffer by commodity.
It also is important to note that although published tariff rates fell on all of these commodities,imports should not have been expected to grow summarily. Indeed, as we have seen the NPR ofmany commodities are currently under the single tariff regime are negative (perhaps implying thatChina has a comparative advantage in producing such commodities). For example, lower tariffson horticultural and meats might be expected to affect only a small segment of China's domesticmarket (e.g., those parts of the market that buy and sell only very high quality products—meatsfor five-star hotels that cater to foreigners). Although tariffs fall for all products, since Chinaproduces and exports many commodities at below world market prices, the reductions for thesecommodities should not have been expected to affect the individuals in China's economy thatproduce and trade these commodities.
The situation also is different for a class of commodities called “national strategic products,”which includes commodities such as rice, wheat, maize, edible oils, sugar, cotton and wool. In thecase of national strategic commodities, the trade flows can be legally limited no matter what thedifference between China's domestic price and the world market price. These commodities arecovered under a special set of institutions. Specifically, WTO rules allow officials to manage tradeoff with tariff rate quotas (TRQs). As shown in Table 3, except for sugar (20%) and edible oils(9%), the in-quota tariff is only 1% for other national strategic commodities (rice, wheat, maizeand wool). However, the amount brought in at these tariff levels can be restricted legally. Whilethe levels of the TRQs begin fairly low in 2002, it should be noted that between 2002 and 2004

Table 3Tariff rate quotas (TRQs) of agricultural commodities in China after 2001
TRQ (million tons) Tariff (%) Quota for non-stateown enterprises (%)2000–2005
2002 2005 In-quota Above-quota
Wheat 7.3 9.6 1 65 10Maize 4.5 7.2 1 65 25–40Rice 2.6 5.3 1 65 50Cotton 0.743 0.894 – – 67Soybean oil 1.7 3.2 9 121 50–90
252 J. Huang et al. / China Economic Review 18 (2007) 244–265
TRQ volumes grew at annual rates ranging from 4% to 19%. However, it should also be noted thatChina does not have to bring in this quantity if the prices are not right. However, provisions are inplace in China's WTO commitments regarding the administration of TRQs to allow forcompetition in the import market so if there is demand inside China for the national strategicproducts at international prices, traders will be able to bring in the commodity up to the TRQlevel.
Although TRQs are restrictive, at least theoretically, the WTO accession agreement doescontain mechanisms which allow for imports of these commodities after the TRQ is filled. Mostpoignantly, tariffs on out-of-quota sales (or for volumes in excess of the level of the TRQ) willdrop substantially in the first year of accession and fall further between 2002 and 2005. But,during the transition period most people believe such rates are so high (e.g., 65% for grains andsugar in 2004 and edible oils in 2005) that in the coming years they will not bind (Table 3).3
After the first five years of accession, a number of other changes will take place. For example,after 2006 China agreed to phase out its TRQ for edible oils. In contrast, there is no suchagreement for maize and most observers believe that China is likely to maintain the TRQ formaize after 2005 although the amount of TRQ will be certainly subject to intense negotiations infuture trade talks (as is so in the current Doha round talks). State trading monopolies also werephased out for wool products after 2004; it is expected that they also will gradually disappear formost of other agricultural products (Table 3). Although China National Cereals Oil andFoodstuffs Import & Export Co. (or COFCO, as it is commonly referred to) will continue to playan important role in rice, wheat and maize, there will be an increasing degree of competition fromprivate firms in grain imports and exports in the future.
In its commitments made as part of its WTO accession, China also agreed to a number of otheritems, some of which are special to the case of China. First, China must phase out all exportsubsidies (as seen, most subsidies were used in maize export in 2001) and not to introduce any ofthese subsidies on agricultural products in the future. Moreover, despite clearly being adeveloping country, China's de minimis exemption for product-specific support is equivalent toonly 8.5% of the total value of production of a basic agricultural product (compared with 10% forother developing countries). Some measures, such as investment subsidies for all farmers andinput subsidies for the poor and other resource-scarce farmers, that are generally available forpolicy makers to use in developing countries, are not allowed in China (i.e., China must include
3 Although 65% above tariff rates seem high, it is important to note that in fact when compared to other countries, thisis low. In most Asian countries (i.e., the ones that are part of WTO) that have a TRQ system, high tariff bindings are 2 ormore times higher than this.

253J. Huang et al. / China Economic Review 18 (2007) 244–265
any such support as part of its aggregate measurement of support which should be less than 8.5%of agricultural output values).
Because of its Socialist background and the difficulty that the world has had in assessing thescope of the government's intervention into business dealings of all types, China was forced toaccept a series of measure governing the way that they will deal with the rest of the world in casesof anti-dumping and countervailing duties. Most simply, special anti-dumping provisions willremain for 15 years. According to these provisions, in cases of anti-dumping China will be subjectto a different set of rules than other countries use to prove their dumping allegations againstChina. In addition, the methods that countries can use against China to enforce anti-dumpingclaims, when they have won, will differ from most of the world. In essence, this set of measuresmakes it easier for countries to bring, prove and enforce dumping cases against China. It shouldbe noted, however, that although the rules differ from those governing trade among othercountries, China will get the same rights in their dealings with other countries, an element thatcould help them in some cases with their dealings with dumping matters when they concern theirpartners' exporting behavior.
5. Methodology and data
In order to evaluate the impact of China's WTO accession between 2001 and 2005 and furthertrade liberalization until 2010 on China's agriculture, poverty and environment (limited toexamining the use of chemical inputs), an analytical framework has been developed using theCenter for Chinese Agricultural Policy's Agricultural Policy Simulation and Projection Model(CAPSiM). CAPSiM was developed out of need to have a framework for analyzing policiesaffecting agricultural production, consumption, price and trade at the national level. CAPSiM is apartial equilibrium model. Most of the elasticities used in the CAPSiM are estimatedeconometrically by ourselves using state-of-the-art econometrics and with assumptions thatmake our estimated parameters consistent with theory. Both demand and supply elasticitieschange over time as income elasticities depend on the income level and cross-price elasticities ofdemand (or supply) depend on the food budget shares (or crop area shares). Details of the modeldescription can be found in Huang and Li (2003) and key assumptions on GPD growth,population rises and productivity increases are summarized in Appendix A.
Because the analysis based on the original CAPSiM framework can only be done at nationallevel, we have to modify the original model in order to allow us to disaggregate the nationalimpacts into household production, consumption and poverty effects at the provincial level and toassess the impact that trade liberalization will have on households in different income groups inthe same provinces.
Two scenarios are formulated. The baseline scenario assumes that China's economy continuesto operate during the 10 year period, 2001 to 2010, as if there were no trade reform. In otherwords, we assume that the NPRs that we estimated and discuss above remain fixed at that leveland that there is no change to other trade policies. This means two things. First, we are assumingunder the baseline that there is no increased access by foreign exports to China's domestic marketor to international markets for China's exports. Second, there is no reduction (or change) in NTBsthat will affect prices. The alternative scenario assumes that China's NPRs move over the next10 years to levels that are consistent with the nation's WTO accession agreement.
China's regional production patterns and trends over time differ largely due to the vastvariations of climate and natural and human resources across China. Rice is the most importantcrop in the southern part of China, accounting for far more than half of sown area in provinces

Table 4Analysis from CapSIM modeling showing impacts of WTO and trade liberalization on agricultural output prices( percentage difference between WTO accession/trade liberalization and the baseline), 2005 and 2010
Commodity 2005 2010
Rice 1.5 2.3– Japonica 6.8 10.2– Indica −0.4 −0.6
Wheat −1.7 −1.7Maize −6.6 −6.6Sweet potato −0.9 −0.9Potato −0.9 −0.9Other cereals −0.9 −0.9Soybean −0.9 −2.6Cotton −3.4 −3.4Oil crops −16.7 −20.2Sugar crops −9.3 −16.7Vegetable 3.7 6.2Fruits 3.7 6.2Pork 8.3 13.9Beef 2.9 4.8Mutton 1.8 2.9Poultry 6.8 11.4Egg 1.4 2.3Milk −9.9 −13.7Fish 5.9 9.8
254 J. Huang et al. / China Economic Review 18 (2007) 244–265
such as Jiangxi and Hunan. In contrast, wheat is the most important crop in the provincesthat make up the North China Plain (e.g., Henan, Shangdong and Hebei) and northwest China(e.g., Qinhai, Gangsu and Ningxia). Soybeans dominate the cropping patterns of Heilongjiang. Toan extent much more than other parts of China, provinces on the east coast produce morevegetables and fruit.
In order to make the analysis manageable, we classify all commodities into 12 crop or crop-groups and 7 livestock product and fish groups. Even with these groupings, however, there arestill too many to discuss in a concise fashion. As a result the presentation of our commodityanalyses, we show only those results for commodity groups that we label as: exportable orimportable. Exportable commodities are those that have negative NPRs; importable commoditiesare those that have positive NPRs (see Table 1). For certain commodities, such as beef and poultrywhich are both exported and imported, since their production weighted NPR is negative, they areincluded in the exportable category.
6. Impacts of WTO on China's agriculture
According to our analysis, WTO will affect the prices of nearly all crop and livestockcommodities (although some of the effects will be small—Table 4). Compared with the baselinescenario (without WTO accession), WTO accession means that the prices of many cropcommodities will have declined due to trade liberalization between 2001 and 2010 (Table 4). Forvegetable, fruits, meats and aquaculture commodities, however, prices increase.
While the prices of most cropping commodities (except fruits, vegetables and japonica rice)decline, the extent of the price decline due to trade liberalization varies significantly amongcommodities (Table 4). For example, for the commodities with low NPRs in 2001, such as indica
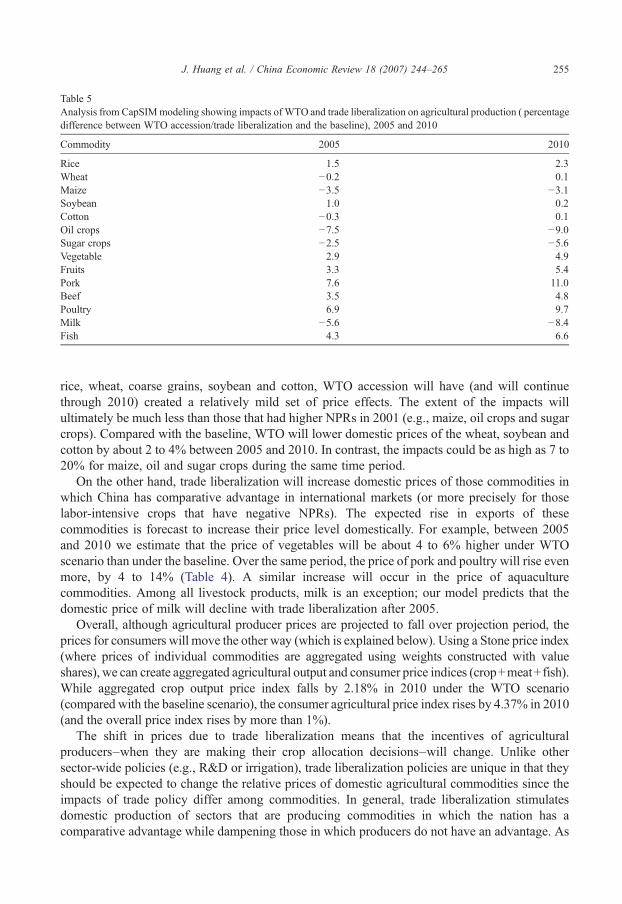
Table 5Analysis from CapSIMmodeling showing impacts of WTO and trade liberalization on agricultural production ( percentagedifference between WTO accession/trade liberalization and the baseline), 2005 and 2010
Commodity 2005 2010
Rice 1.5 2.3Wheat −0.2 0.1Maize −3.5 −3.1Soybean 1.0 0.2Cotton −0.3 0.1Oil crops −7.5 −9.0Sugar crops −2.5 −5.6Vegetable 2.9 4.9Fruits 3.3 5.4Pork 7.6 11.0Beef 3.5 4.8Poultry 6.9 9.7Milk −5.6 −8.4Fish 4.3 6.6
255J. Huang et al. / China Economic Review 18 (2007) 244–265
rice, wheat, coarse grains, soybean and cotton, WTO accession will have (and will continuethrough 2010) created a relatively mild set of price effects. The extent of the impacts willultimately be much less than those that had higher NPRs in 2001 (e.g., maize, oil crops and sugarcrops). Compared with the baseline, WTO will lower domestic prices of the wheat, soybean andcotton by about 2 to 4% between 2005 and 2010. In contrast, the impacts could be as high as 7 to20% for maize, oil and sugar crops during the same time period.
On the other hand, trade liberalization will increase domestic prices of those commodities inwhich China has comparative advantage in international markets (or more precisely for thoselabor-intensive crops that have negative NPRs). The expected rise in exports of thesecommodities is forecast to increase their price level domestically. For example, between 2005and 2010 we estimate that the price of vegetables will be about 4 to 6% higher under WTOscenario than under the baseline. Over the same period, the price of pork and poultry will rise evenmore, by 4 to 14% (Table 4). A similar increase will occur in the price of aquaculturecommodities. Among all livestock products, milk is an exception; our model predicts that thedomestic price of milk will decline with trade liberalization after 2005.
Overall, although agricultural producer prices are projected to fall over projection period, theprices for consumers will move the other way (which is explained below). Using a Stone price index(where prices of individual commodities are aggregated using weights constructed with valueshares), we can create aggregated agricultural output and consumer price indices (crop+meat+fish).While aggregated crop output price index falls by 2.18% in 2010 under the WTO scenario(compared with the baseline scenario), the consumer agricultural price index rises by 4.37% in 2010(and the overall price index rises by more than 1%).
The shift in prices due to trade liberalization means that the incentives of agriculturalproducers–when they are making their crop allocation decisions–will change. Unlike othersector-wide policies (e.g., R&D or irrigation), trade liberalization policies are unique in that theyshould be expected to change the relative prices of domestic agricultural commodities since theimpacts of trade policy differ among commodities. In general, trade liberalization stimulatesdomestic production of sectors that are producing commodities in which the nation has acomparative advantage while dampening those in which producers do not have an advantage. As

256 J. Huang et al. / China Economic Review 18 (2007) 244–265
a result, trade policies should lead to different impacts depending on the crop—sometimesnegative and sometimes positive.
Table 5 presents the results of our simulations on the impacts of China's WTO accession andfurther trade liberalization on agricultural production (measured in output terms) in 2005 and2010. The analyses show that trade liberalization will affect domestic production moderately.Moreover, as in the case of price effects, the signs of the impacts due to trade liberalization are asmostly as expected. Overall, the impact on production is negative for wheat, maize, cotton, oilcrops and sugar crops. In contrast, the impact is positive for rice, vegetable, fruits, meat and fish,those commodities in which China has comparative advantage (Table 5).
It is worth to note that not all commodities that experience higher trade policy-induced priceswill end up with higher domestic production. This can happen because of the indirect productioneffects that are associated with both own-price and cross-price substitution impacts. Soybean, aless competitive crop that was liberalized before China's WTO accession in 2001, is a goodexample of such a crop. The liberalization of soybean trade led to large increases in the level ofimports and sharp falls in both the domestic price and production level prior to China's WTOaccession (due to pre-WTO accession trade liberalization). Imports in 2001 reached more than15 million tons, which just about equaled the level of domestic production in that year. Whilefurther trade liberalization after China's WTO accession will end up leading to a small fall in theprice of soybeans (Table 5), the decline in soybean price is so small that the production impact ofthe own-price effect is predicted to be less than the negative production impact that arises due toshift of resources (labor, fertilizer, land) toward substitute commodities, such as vegetable, fruitand rice, which experience a sharp price rise in the post WTO era.
As there are both positive and negative impacts of WTO on China's agriculture, we alsoestimate the impact for the overall agricultural sector for the typical (or average) farmer (Table 6).In contrast to some of the commodity-specific effects that were presented above, the overalleffects of China's WTO accession and further trade liberalization are positive. According to ouranalysis, agricultural output value for average farm will rise by 191 yuan (or by about 26 yuan orUS$ 5.6 per person). This accounts for 2.8% of total agricultural output in 2005 (Table 6). The netbenefits in terms of output values will increase to 460 yuan in 2010, which is about 5.6% of the
Table 6Analysis from CapSIM modeling showing impacts of WTO and trade liberalization on agricultural ( production) outputand food Consumption ( percentage difference between WTO accession/trade liberalization and the baseline) for allcommodities (rows 1 and 4) and for importable and exportable commodities, 2005 and 2010
2005 2010
Changes in value(yuan/hh)
Percentagechange (%)
Changes in value(yuan/hh)
Percentagechange (%)
Agricultural output 191 2.8 460 5.8Importable sector −198 −7.2 −264 −8.5Exportable sector 389 9.3 723 15.1
Food consumption 44 1.1 102 2.3Importable sector −16 −2.0 −17 −1.9Exportable sector 61 1.9 119 3.3
Note: Importable sector includes wheat, maize, all coarse grains, soybean, edible oil, cotton, sugar and milk (allcommodities with positive nominal protection rates—NPRs). Exportable sector includes rice, vegetables, fruit, all meatand fish commodities (commodities with negative NPRs).

257J. Huang et al. / China Economic Review 18 (2007) 244–265
average household's agricultural output value. Of the positive effects, about 20–30% is due to therise in prices; the other 70–80% is due to the growth in the real output as China's productionpatterns change, moving from less competitive to more competitive crops and livestock activities.
The importance of accounting for production responses to changing prices can be seen bynoting that the rise in overall production occurs when imports rise and exports expand. Facing theprice shifts, producers in China, according to our modeling exercises, respond by moving into theproduction of commodities which experience price rises and out of commodities that experienceprice falls. At the end of the period we forecast that enough structural change has occurred so thatoverall agricultural output ends up rising. By 2005, while the output value of importable productswill decline by 7.2% under the WTO scenario (compared with the baseline scenario), exportableproducts will rise by 9.3% (Table 6).
Interestingly, between 2005 and 2010 the fifth and tenth year after the implementation ofWTO, the rate of rise of the average household's agricultural output accelerates (Table 6, columns3 and 4). Because liberalization continues for both those products that are protected (especially formaize, sugar and edible crops) and those that are exportable (e.g., livestock, fish, vegetables andrice), agricultural output will continue to increase under a more liberalized trade environment in2005–2010. However, because we have not accounted for the increased production output valuethat occurs due to the higher input use (which is stimulated by higher prices), the increase in thevalue of agricultural output should not be considered as the equivalent of increases in agriculturalincome. When comparing our results to those of other trade models that have simulated the impactof the accession to WTO on China's agriculture (Martin, 2001; Anderson et al., 2004), our results(which are couched in terms of output rather than income) are fairly consistent (around 2–3%agricultural income changes in 2005–2010; if one takes a fraction of output–say 50%–increasedprofits).
At the same time, the overall effects of China's WTO accession on food consumption are moremodest (Table 6, rows 4 to 6). By 2005, total household food expenditures will be 1.1% higherunder the WTO scenario than under the baseline; expenditures rise to 2.3% by 2010. However,because overall food prices change with trade liberalization, to examine the impacts of WTO onfood consumption, we need to compare the food expenditure share changes with the overall foodprice changes in the projection period. Because the aggregate food prices will rise by 2.36% in2005 and 4.37% in 2010 under WTO scenario (compared with the baseline scenario), these implythat increases in food expenditure due to trade liberalization are all from the rise in food prices.Indeed, real food consumption, at constant prices will decline minimally (by about 1% in 2005and by about 2% in 2010).
7. Impacts of WTO on China's rural households and poverty
Because all rural households in China have access to land, a consequence of the nature of thenation's economic reform policy and land rights system, the size of farm in China is small byinternational standards. For the nation as a whole, the average size of farm is less than 8 mu, orabout 0.5 ha. With such small size of farms, households in China have to intensively use their landresources. They use their land both to produce their own staple food and for cash crops for saleinto the market.
Sustainable rises in rural labor productivity and household income, however, will require morethan income from the average farm in China. As a result, farm households need to find off-farmemployments in the off-farm sector. In fact, this is what has been happening in rural China sincethe early 1980s (deBrauw, Huang, Rozelle, Zhang, & Zhang, 2002). By 2003, the average

Fig. 2. a. Agricultural production structure by income group in 2003: importable output %. b. Agricultural productionstructure by income group in 2003: exportable %–importable %.
258 J. Huang et al. / China Economic Review 18 (2007) 244–265
member of the off-farm rural labor force allocated 36% of his/her time on off-farm activities andearned 56% of the family's income from their work in the non-agricultural sector. Most of the off-farm earnings were in the form of wage earnings; a significant share also was in the form ofearnings from family-run microenterprises.
Perhaps not surprisingly the incidence of off-farm employment varies significantly acrossregions and this is correlated with the wealth/poverty of an area. According to our data, farmers inthe east coast earn a larger share of their incomes from off the farm. In contrast, the average farmerin most parts of the western China earned more from agriculture. Because of the largecontribution that off-farm employment contributes to total income, income levels in the easternregion are twice as high as those in the west. Income variation among regions also means that thefarmer's spending patterns also differ. Hence, the rate of poverty–measured in consumptionterms–is higher in the western and central parts of China than in the east.
Our analysis also indicates that agricultural incomes of the poor, prior to China's accession tothe WTO, depended more on the production of less competitive advantage commodities thanthose of the richer households. To show this, we divide the household agricultural production into

Table 7Analysis from CapSIM modeling showing impacts of WTO and trade liberalization on agricultural production and foodconsumption ( percentage difference between WTO accession/trade liberalization and the baseline), by income categories,2005 and 2010
2005 2010
Changes invalue (yuan)
Percentagechange (%)
Changes invalue (yuan)
Percentagechange (%)
Agricultural output valueUnder int'l poverty line 77 1.7 221 4.4Importable sector −138 −6.3 −177 −7.2Exportable sector 215 9.6 399 15.5
Average farmers 191 2.8 460 5.8Importable sector −198 −7.2 −264 −8.5Exportable sector 389 9.3 723 15.1
Top 10% richest farmers 583 5.3 1205 9.3Importable sector −212 −7.5 −304 −9.3Exportable sector 795 9.7 1509 15.6
Food expendituresUnder int’l poverty line 25 0.9 76 2.4Importable sector −20 −2.3 −21 −2.2Exportable sector 45 2.4 97 4.4
Average farmers 44 1.1 102 2.3Importable sector −16 −2.0 −17 −1.9Exportable sector 61 1.9 119 3.3
Top 10% richest farmers 62 1.0 134 2.0Importable sector −13 −1.5 −12 −1.3Exportable sector 75 1.4 146 2.6
Notes: The households that are under the international poverty line are all households that have total expenditures less than$1/day measured in purchasing power parity terms.
259J. Huang et al. / China Economic Review 18 (2007) 244–265
2 groups: importable and exportable commodities. Importable commodities are thosecommodities for which the prices are expected to decline with trade liberalization (or thosewith NPRs that were positive in 2001); exportable commodities are those for which the prices areexpected to rise (or those with NPRs that were negative). Clearly, the results of this analysisshows that as farmers move from higher income categories to lower ones, the share of their outputthat is from importable commodities (or ones in which the prices will fall after WTO accession)rises. A larger share of agricultural output in richer households, in contrast, comes fromexportable commodities (Fig. 2).
It is important to note that the production patterns that we have observed by income categoryfor the nation (that is those that appear in Fig. 2 for the entire nation) do not appear in each region.An analysis of production of different farmers by province reveals some key differences (notshown here for reasons of space considerations). For example, in Shanxi and Jilin, two non-coastal provinces, nearly all farmers (with the exception of the farmers in the richest group)produce more importable commodities. In contrast, farmers in all income categories–both thepoorer and richer income groups–in the coastal province of Zhejiang allocate most of their landand production effort to producing exportable commodities. These observations suggest that tradeliberalization will have relatively adverse effects on poorer farmers in general since the price ofthe crops in which they are producing will fall relatively to farmers in richer income categories.However, perhaps even more important is the regional effect. Both non-poor and poor farmers

260 J. Huang et al. / China Economic Review 18 (2007) 244–265
may gain in many coastal provinces; those in the inland provinces, unfortunately–even those thatare not so poor–may be hurt.
7.1. Impacts on rural households by income group and by region
According to the analysis, as we saw in the previous section, if China implements its promisesfor the WTO agreement, the changes in domestic prices will affect both production andconsumption of the average rural household; when looking that our simulation analysis byincome grouping this finding can be replicated by examining the effect (for all commodities) forthe households in the average income category (Table 7, rows 4 and 13). For example, oursimulation analysis over the first 5 years of the analysis predicts that agricultural output value ofthe average household will rise by 2.8% (row 4). During the same period, food expenditures willrise by 1.1% (row 13), albeit at a rate less than the value of production output will increase.Although aggregate food expenditures rise, they do so as a result of increasing food prices;because of this total food consumption falls (not shown). For importable commodities, fallingprices increase their consumption. Reductions of expenditure on importable foods mean that theconsumers gain from both increases in consumption and declines in prices. For exportablecommodities, the consumers lose from the rising prices and decrease their consumption.
Not all farm households, however, benefit equally from China's accession to the WTO. Ourresults show that in 2005 and 2010, the poor gain much less than the average and richer farmers(Table 7). The agricultural output for the poor increases by 77 yuan per household in 2005 (row 1).At the same time output will be 191 yuan greater for the average farmer and 583 yuan greater forthe richest farmers (rows 4 and 7). Even in terms of percentage changes, the rise in agriculturaloutput values for the poor is less than those for the richer. On the other hand, food expendituresincrease for all farmers, but in percentage terms the rates of rise are nearly identical in 2005 and fallfrom rich to poor in 2010 (albeit the differences are small—Table 7, rows 10 to 18).
Although we show that at the national level households in all income groupings gain fromtrade liberalization, this result does not hold for every province (Table 8). At the national(aggregated) level, the overall impact on production and consumption is small. The main reason isthat there are offsetting effects among provinces. But from Table 8, it can be seen that the impactsdiffer significantly across provinces even for the farmers in the same income categories.
Because trade impacts are more commodity-specific, and because farmers in different incomegroups in different provinces grow different sets of commodities, we can see that there actuallyare much sharper regional and income class-specific impacts (Table 8). It also means that suchimpacts may have implications for equity. In the case of China, while nearly all farmers in manyprovinces in east and south can be seen to benefit from trade policy, liberalization generally hurtsproducers in China's western and northern provinces. The reason, of course, is clear when weconsider that farmers in western and northern provinces are primarily producing importablecommodities, such as maize, wheat, cotton, edible oil, sugar and soybeans. These are precisely thesets of commodities that are most hurt by liberalization.
Interestingly, not all the poor will gain or lose in terms of production with trade liberalization.Our analyses show that the poor in the richer provinces (again in the eastern and southernprovinces) gain from trade liberalization, while the poor (and many of the richer farmers) in thewestern and northern provinces are hurt (Table 8). Therefore, trade liberalization may contributeto poverty alleviation in some parts of China; at the same time it may lead to worse poverty andincome distribution problems in other parts of the nation. The other important finding is that thepoor will gain less (or lose absolutely more) than the rich in each sector because, despite having

Table 8CapSIM projections of the impacts of WTO and trade liberalization on per household agricultural output by incomecategory in selected provinces (WTO accession/trade liberalization scenario compared with the baseline), in China, 2005and 2010
2005 2010
Changes invalue (yuan)
Percentagechange (%)
Changes invalue (yuan)
Percentagechange (%)
ZhejiangUnder int'l poverty 157 6.8 309 11.4Average farmers 397 7.6 752 12.5Top 10% richest farmers 951 8.2 1786 13.5
GuangdongUnder int'l poverty 163 4.4 323 7.7Average farmers 684 7.6 1348 12.8Top 10% richest farmers 2936 11.0 5799 17.9
JilinUnder int'l poverty −77 −1.3 61 0.9Average farmers −128 −1.2 105 0.9Top 10% richest farmers 370 1.8 1165 5.0
JiangxiUnder int'l poverty 187 4.7 368 8.3Average farmers 278 4.5 549 8.0Top 10% richest farmers 476 4.9 913 8.2
HenanUnder int'l poverty −7 −0.2 77 1.7Average farmers 80 1.2 296 3.8Top 10% richest farmers 818 5.8 1685 10.5
SichuanUnder int'l poverty 164 3.8 355 7.2Average farmers 389 5.9 789 10.6Top 10% richest farmers 683 7.5 1339 12.7
NingxiaUnder int'l poverty 42 1.0 166 3.4Average farmers −3 0.0 88 0.9Top 10% richest farmers −119 −0.7 −238 −1.1
ShaanxiUnder int'l poverty 27 0.7 123 2.9Average farmers 101 2.0 280 4.8Top 10% richest farmers 297 3.5 664 6.7
GuizhouUnder int'l poverty 138 3.4 317 6.9Average farmers 270 5.0 565 9.2Top 10% richest farmers 471 6.8 941 12.0
261J. Huang et al. / China Economic Review 18 (2007) 244–265
farms that are of a similar size, their land produces less (or is less productive) than that of farmersin the richer categories. While, in fact, it is unclear if the lower productivity is due to lower qualityof land or inability to apply sufficient inputs (or both), it is clear that there is a role of thegovernment in improving the ability of the poor to increase productivity (through more R&D,extension, investment and credit).
The impacts of WTO on food consumption by income group in the selected provinces areshown in Table 9. From the table it can be seen that the effects on rural residents as producerstypically are larger than the effects on them as consumers. Moreover, the differences of

Table 9CapSIMprojections of the impacts ofWTO and trade liberalization on per household food expenditures by income categoryin selected provinces (WTO accession/trade liberalization scenario compared with the baseline), in China, 2005 and 2010
2005 2010
Changes invalue (yuan)
Percentagechange (%)
Changes invalue (yuan)
Percentagechange (%)
ZhejiangUnder int'l poverty 65 1.4 133 2.5Average farmers 88 1.4 170 2.3Top 10% richest farmers 105 1.1 200 1.8
GuangdongUnder int'l poverty 67 1.2 141 2.3Average farmers 123 1.5 243 2.7Top 10% richest farmers 151 1.4 283 2.4
JilinUnder int'l poverty 46 1.5 97 2.8Average farmers 41 1.3 88 2.6Top 10% richest farmers 34 0.9 79 2.2
JiangxiUnder int'l poverty 32 1.0 70 1.9Average farmers 47 0.9 98 1.9Top 10% richest farmers 50 1.0 99 1.8
HenanUnder int'l poverty −1 0.0 18 0.7Average farmers 13 0.4 43 1.3Top 10% richest farmers 70 1.3 149 2.6
SichuanUnder int'l poverty 50 1.4 106 2.7Average farmers 65 1.6 129 2.9Top 10% richest farmers 68 1.4 130 2.6
NingxiaUnder int'l poverty 7 0.2 49 1.4Average farmers 24 0.7 91 2.4Top 10% richest farmers 38 1.0 149 3.7
ShaanxiUnder int'l poverty −5 −0.3 11 0.4Average farmers −1 −0.1 17 0.6Top 10% richest farmers 2 0.1 22 0.7
GuizhouUnder int'l poverty 42 1.3 95 2.7Average farmers 56 1.6 115 3.1Top 10% richest farmers 64 1.6 126 2.9
262 J. Huang et al. / China Economic Review 18 (2007) 244–265
consumption impacts among income groups within the same province (Table 9) are much less thanthose of production impacts (Table 8). Finally, our analysis also shows that the trade effects oncommodity types are more important than the region of the country in terms of expenditureimpacts.
8. Concluding remarks and policy implications
Despite the high level of attention given to China's accession to the WTO, one of our firstfindings is that, in fact, trade liberalization in China began many years before 2001. In fact, since

263J. Huang et al. / China Economic Review 18 (2007) 244–265
the 1980s China made great strides in liberalizing trade. Through nearly 20 years externalreform, China's foreign trade regime gradually changed from a highly centralized, planned andimport substitution regime to a more decentralized, market-oriented and export promotionregime.
Be that as it may, there was still protection in a number of areas on the eve of China's accessionto the WTO. In analyzing the impacts of WTO and future trade liberalization on China'sagriculture, we conclude that the positive impacts are more than negative. Although other effectson the rural economy from trade liberalization of other subsectors (such as textiles) may beequally large or even larger, this study's focus on the agricultural sector shows that there will bean impact from agricultural trade liberalization and that the net impact is positive for the averagefarm household in China.
However, not all households and not all commodities will be treated equally. Our findings onNPRs show that indeed for some agricultural commodities WTO will lead to a fall in prices and arise in imports. Edible oils, sugar, maize and cotton may be most affected. There are alsocommodities in which China has considerable comparative advantage—for example, rice, meatand aquaculture commodities and horticulture products. Because of this, WTO and more generaltrade liberalization could provide benefits to those engaged in the production of exportablecommodities. In fact, the ultimate impacts are even more complicated. For example, the prospectof increased imports of feed grains (e.g., maize and soybeans) at lower prices means that livestockproducers could become even more competitive.
Our study also shows that as some prices rise and others fall, WTO is encouraging farmers toadjust their agricultural production structure toward more comparative advantage products. In thisrespect, trade liberalization is pushing the economy to be more efficient. Although in response tothe overall rise in food prices, consumers decrease their consumption, with the increased incomesthat accompany the shift of farmers to more profitable agricultural products, most of the farmingsector likely will be better off (although we do not measure the indirect rise in consumption due tothe income effects of higher agricultural profits).
We also demonstrate that although the absolute effects of trade liberalization will not be verylarge (and, indeed, will be positive), policy makers should be concerned about the poverty andequity effects. We show this through several of our findings. First, according to the analysis,although, on average, farmers at national level will benefit from WTO, it does not hold for allprovinces. Average farmers in many less developed provinces in western and northern parts ofChina will not gain from trade liberalization. The main reason is that the farmers in eastern andsouthern provinces produce more exportable products, unlike their counterparts in the rest ofChina. The net impacts on agricultural production of average farmers in several western andnorthern provinces indeed are negative. Instead of halting all liberalization, we believe the mainpolicy implication is that policy makers need to target those that are being hurt the most withassistance programs and by eliminating the constraints that are keeping them from shifting intomore competitive crops.
Second, it also is important to target regionally when thinking about the effects on the poor.While in the nation as a whole, the average poor person will benefit, not all of the poor in eachregion will gain from trade liberalization. We find that the poor in many provinces in western andnorthern provinces lose in both agricultural production and consumption.
In the final analysis, of course, it has to be remembered that the impact on agriculture, is onlypart of the story. Although we do not analyze the non-farm impacts, trade liberalization isexpected to also affect the access of households to non-farm employment and the wages they earnfor being in the off-farm market. In general, China will gain a lot from trade liberalization. Rising

264 J. Huang et al. / China Economic Review 18 (2007) 244–265
exports of manufacturing goods will lead to the hiring of a lot of rural labor. In countries, such asChina, raising the demand for off-farm labor is probably the most important thing that can happenin the economy. The nation needs to keep promoting policies that facilitate investment and allowsrural households to move to these jobs without constraint. Targeting education and healthprograms to poor areas to allow them to have better access to those jobs is of the utmostimportance.
Appendix A. Key assumptions for CAPSIM model baseline scenario
The baseline scenario assumes that the average annual GDP growth rates in 2001–2005 willreach 8.9% in 2001–2005 and then slightly fall over the entire projection period. The highergrowth of GDP in 2001–2005 than that in 1996–2000 is because average annual growth ratealready reached 8.7% in 2001–2004 and China's economy is likely to grow at more than 9% in2005. After 2005, annual growth rate is assumed to decline from 8.9% in 2001–2005 to 8% in the2006–2010 (Table A1). By 2010, China's economy will be more nearly twice as large as that in2000, which also implies that China will meet its development goal of doubling its economy inthe ten year period between 2001 and 2010.
In this study, we adopt a recent population projection conducted by IIASA (Toth et al. 2003).Toth et. al. forecast several population growth scenarios for China in 2001–2030. One of theirscenarios, Central Line Scenario, has been adopted in our study. For per capita GDP growth,which is derived by deducting population growth from total GDP growth, the likely growthscenario presents an annual growth rate of 8.2% in 2001–2005. Average annual per capita GDPgrowth rates will remain at about 7–8% until 2010 (Table A1).
The growth of total GDP and population assumed under this scenario imply that China'sper capita GDP in 2000 price will rise from 7 084 yuan in 2000 to 14 974 yuan in 2010(Table 8). If we apply the official exchange rates in 2000 for base year and current rate for2010, the per capita GDP will increase from US$ 856 in 2000 to US$ 1 849 in 2010. If wefurther consider the purchasing power parity, the above projection would mean that China'sper capita income will be in between almost at the level of a middle-income country in 2020(World Bank 2003).
On the production side our key assumption is that China will maintain the current rate ofincrease in supply productivity that it has over the past 25+ years. We assume that productivitywill increase by 2% annually during the projections period. This rate of supply increase is similarto the rates used in other models (Martin, 2001; Anderson et al., 2004).
Table A1Key baseline assumptions for projection of China's economy in 2001–2010
Annual growth rates 1985–95 1996–2000 2001–2005 2006–2010
GDP 9.7 8.2 8.9 8.0Per capita GDP 8.3 7.2 8.2 7.4
Population 1.37 0.91 0.72 0.61
Per capita GDP 2000 2005 2010Yuan (RMB) 7086 10528 14974USD 856 1300 1849
Population (billion) 1.267 1.308 1.348
Note: Values are in 2000 constant prices.

265J. Huang et al. / China Economic Review 18 (2007) 244–265
References
Anderson, K., Huang, J., & Ianchovichina, E. (2004). Will China's WTO accession worsen farm household income?China Economic Review, 15, 443−456.
Carter, C. A., & Estrin A. (2001). China's Trade Integration and Impacts on Factor Markets, Mimeo, University ofCalifornia, Davis, January.
Corden, W. M. (1997). Trade policy and economic welfare. New York, NY: Oxford University Press.deBrauw, A., Huang, J., Rozelle, S., Zhang, L., & Zhang, Y. (2002, March–April). China's rural labor markets. The China
Business Review, 2−8.Huang, J., & Chen, C. (1999). Effects of trade liberalization on agriculture in China: Commodity and local agricultural
studies. Bogor, Indonesia: United Nations ESCAP CGPRT Centre.Huang, J., & Li, N. (2003). China's agricultural policy analysis and simulation model — CAPSiM. Journal of Najing
Agricultural University, 3(2), 30−41.Huang, J., Li, N., & Rozelle, S. (2003). Trade reform, household effects and poverty in rural China. American Journal of
Agricultural Economics, 85(5), 1292−1298.Huang, J., Rozelle, S., & Chang, M. (2004). Tracking distortions in agriculture: China and its accession to the World Trade
Organization. The World Bank Economic Review, 18(1), 59−84.Huang, J., Rozelle, S., Pray, C., & Wang, Q. (2002, 25 January). Plant biotechnology in China. Science, 295, 674−677.Lardy, N. (2001). Integrating China in the global economy. Washington, D.C. (USA): Brookings Institution.Li, S., Zhai, F., Wang, Z., & Development Research Center (1999). The global and domestic impact of China joining the
World Trade Organization. A project report China: Development Research Center, the State Council.Martin, W. (2001). Implications of reform and WTO accession for China's agricultural policies. Economics of Transition,
9(3), 717−742.Martin, W. (2002). Implication of reform and WTO accession for China's agricultural policies. Economies in Transition, 9
(3), 717−742.MOFTEC [Ministry of Foreign Trade and Economic Cooperation] (2002). Foreign trade and economic yearbook of
China. China Statistical Press.NSBC (National Statistical Bureau of China) (2003). Statistical yearbook of China. Beijing (China): China Statistical
Press.NSBC (National Statistical Bureau of China) (2003). China rural household survey yearbook. Beijing (China): State
Statistical Press.Riskin, C., & Khan, A. (2001). Inequality and poverty in China in the age of globalization. New York, NY: Oxford
University Press.