agilent u1610/20a handheld digital oscilloscope
TRANSCRIPT
Agilent U1610/20A Handheld Digital Oscilloscope
User’s Guide
Agilent Technologies
II U1610/20A User’s Guide
Notices© Agilent Technologies, Inc., 2011–2013
No part of this manual may be reproduced in any form or by any means (including elec-tronic storage and retrieval or translation into a foreign language) without prior agree-ment and written consent from Agilent Technologies, Inc., as governed by United States and international copyright laws.
Manual Part NumberU1610-90040
EditionSecond Edition, February 5, 2013
Agilent Technologies, Inc., 5301 Stevens Creek Blvd. Santa Clara, CA 95051 USA
Available in electronic format only
WarrantyThe material contained in this document is provided “as is,” and is subject to change, without notice, in future editions. Further, to the maximum extent permitted by the applicable law, Agilent disclaims all war-ranties, either express or implied, with regard to this manual and any information contained herein, including but not limited to the implied warranties of merchantabil-ity and fitness for a particular purpose. Agilent shall not be liable for errors or for incidental or consequential damages in connection with the furnishing, use, or performance of this document or of any information contained herein. Should Agi-lent and the user have a separate written agreement with warranty terms covering the material in this document that conflict with these terms, the warranty terms in the separate agreement shall control.
Technology Licenses The hardware and or software described in this document are furnished under a license and may be used or copied only in accor-dance with the terms of such license.
Restricted Rights LegendU.S. Government Restricted Rights. Soft-ware and technical data rights granted to the federal government include only those rights customarily provided to end user cus-tomers. Agilent provides this customary commercial license in Software and techni-cal data pursuant to FAR 12.211 (Technical Data) and 12.212 (Computer Software) and, for the Department of Defense, DFARS 252.227-7015 (Technical Data - Commercial Items) and DFARS 227.7202-3 (Rights in Commercial Computer Software or Com-puter Software Documentation).
Safety Notices
CAUTION
A CAUTION notice denotes a haz-ard. It calls attention to an operat-ing procedure, practice, or the likes of that, if not correctly performed or adhered to, could result in dam-age to the product or loss of impor-tant data. Do not proceed beyond a CAUTION notice until the indicated conditions are fully understood and met.
WARNING
A WARNING notice denotes a hazard. It calls attention to an operating procedure, practice, or the likes of that, if not correctly performed or adhered to, could result in personal injury or death. Do not proceed beyond a WARN-ING notice until the indicated conditions are fully understood and met.

Safety Symbols
The following symbols on the instrument and in the documentation indicate precautions which must be taken to maintain safe operation of the instrument.
Direct current (DC)
Equipment protected throughout by double insulation or reinforcedinsulation
Alternating current (AC) Earth (ground) terminal
Both direct and alternating current
Category II overvoltage protection
Caution, risk of danger (refer to this manual for specific Warning or Caution information)
Category III overvoltage protection
Caution, risk of electric shock
CAT II
CAT III
U1610/20A User’s Guide III
General Safety Information
The following general safety precautions must be observed during all phases of operation of this instrument. Failure to comply with these precautions or with specific warnings elsewhere in this manual violates safety standards of design, manufacture, and intended use of the instrument. Agilent Technologies, Inc., assumes no liability for the customer’s failure to comply with these requirements.
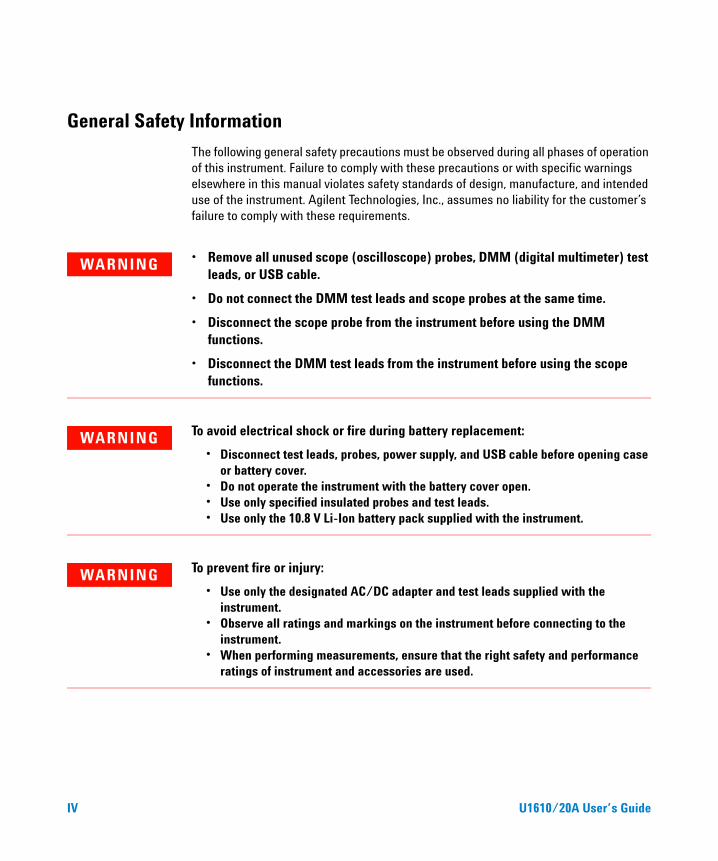
WARNING • Remove all unused scope (oscilloscope) probes, DMM (digital multimeter) test leads, or USB cable.
• Do not connect the DMM test leads and scope probes at the same time.
• Disconnect the scope probe from the instrument before using the DMM functions.
• Disconnect the DMM test leads from the instrument before using the scope functions.
WARNING To avoid electrical shock or fire during battery replacement:
• Disconnect test leads, probes, power supply, and USB cable before opening case or battery cover.
• Do not operate the instrument with the battery cover open.• Use only specified insulated probes and test leads.• Use only the 10.8 V Li-Ion battery pack supplied with the instrument.
WARNING To prevent fire or injury:
• Use only the designated AC/DC adapter and test leads supplied with the instrument.
• Observe all ratings and markings on the instrument before connecting to the instrument.
• When performing measurements, ensure that the right safety and performance ratings of instrument and accessories are used.
IV U1610/20A User’s Guide
WARNING • Plug the probe or test leads to the instrument before connecting to any active circuit for testing. Before disconnecting from the instrument, remove the probe or test leads from the active circuit.
• Do not connect the USB cable when not in use. Keep the USB cable away from any probe, test lead, or exposed circuitry.
• Do not expose the circuit or operate the instrument without its cover or while power is being supplied.
• Do not use exposed metal BNC or banana plug connectors. Use only the insulated voltage probes, test leads, and adapters supplied with the instrument.
• Do not supply any voltage when measuring resistance or capacitance in multimeter mode.
• Do not operate the instrument if it does not operate properly. Have the instrument inspected by qualified service personnel.
• Do not operate the instrument in wet or damp environments.
• Do not operate the instrument in any environment at risk of explosion. Do not operate the instrument in the presence of flammable gases or flames.
• Keep the instrument surface clean and dry. Keep the BNC connectors dry especially during high-voltage testing.
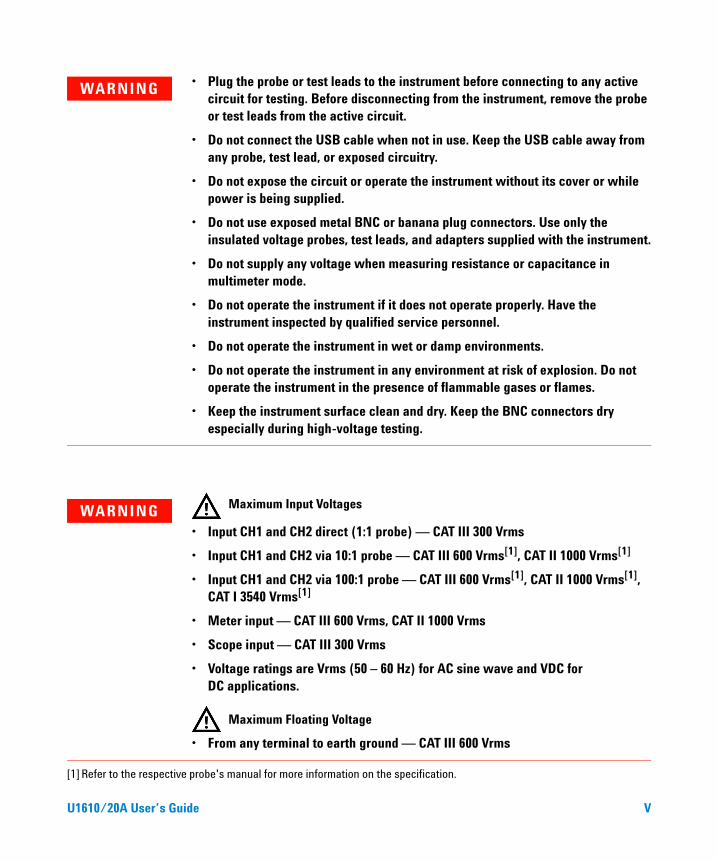
WARNING Maximum Input Voltages
• Input CH1 and CH2 direct (1:1 probe) — CAT III 300 Vrms
• Input CH1 and CH2 via 10:1 probe — CAT III 600 Vrms[1], CAT II 1000 Vrms[1]
• Input CH1 and CH2 via 100:1 probe — CAT III 600 Vrms[1], CAT II 1000 Vrms[1], CAT I 3540 Vrms[1]
• Meter input — CAT III 600 Vrms, CAT II 1000 Vrms
• Scope input — CAT III 300 Vrms
• Voltage ratings are Vrms (50 – 60 Hz) for AC sine wave and VDC for DC applications.
Maximum Floating Voltage
• From any terminal to earth ground — CAT III 600 Vrms
[1] Refer to the respective probe's manual for more information on the specification.
U1610/20A User’s Guide V
CAUTION • If the instrument is used in a manner not specified by the manufacturer, the instrument protection may be impaired.
• Always use dry cloth to clean the instrument. Do not use ethyl alcohol or any other volatile liquid.
• It is recommended to use the instrument under ventilated condition and in the upright position to ensure adequate airflow at the rear.
• Always cover the DC power inlet and the USB port by closing the lid when not in used.
CAUTION To prevent electrostatic discharge (ESD):
Electrostatic discharge (ESD) can result in damage to the components in the instrument and accessories.
• Select a static-free work location when installing and removing sensitive equipment.
• Handle sensitive components to the minimum extent possible. Do not allow contacts between components and exposed connector pins.
• Transport and store in ESD preventive bags or containers that protect sensitive components from static electricity.
• The battery (optional) must be properly recycled or disposed.
VI U1610/20A User’s Guide
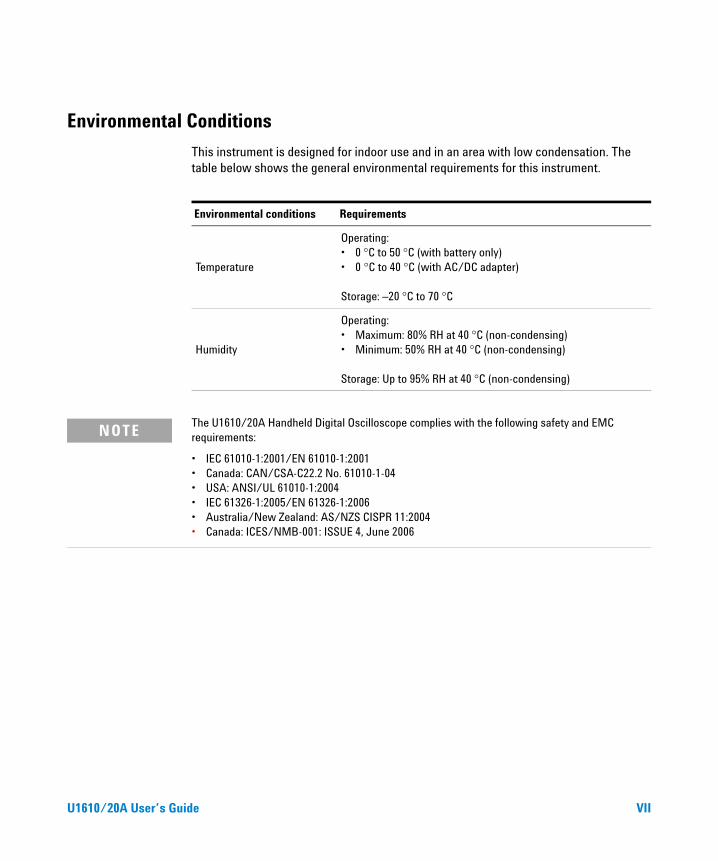
Environmental Conditions
This instrument is designed for indoor use and in an area with low condensation. The table below shows the general environmental requirements for this instrument.
Environmental conditions Requirements
Temperature
Operating:• 0 °C to 50 °C (with battery only)• 0 °C to 40 °C (with AC/DC adapter)
Storage: –20 °C to 70 °C
Humidity
Operating:• Maximum: 80% RH at 40 °C (non-condensing)• Minimum: 50% RH at 40 °C (non-condensing)
Storage: Up to 95% RH at 40 °C (non-condensing)
NOTEThe U1610/20A Handheld Digital Oscilloscope complies with the following safety and EMC requirements:
• IEC 61010-1:2001/EN 61010-1:2001• Canada: CAN/CSA-C22.2 No. 61010-1-04• USA: ANSI/UL 61010-1:2004• IEC 61326-1:2005/EN 61326-1:2006• Australia/New Zealand: AS/NZS CISPR 11:2004• Canada: ICES/NMB-001: ISSUE 4, June 2006
U1610/20A User’s Guide VII
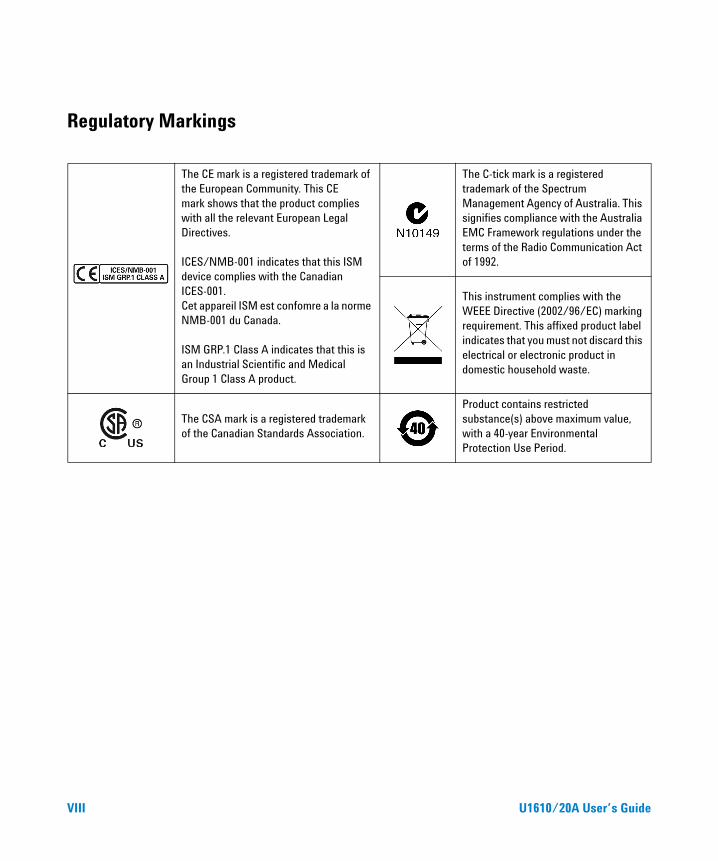
Regulatory Markings
The CE mark is a registered trademark of the European Community. This CEmark shows that the product complies with all the relevant European Legal Directives.
ICES/NMB-001 indicates that this ISM device complies with the Canadian ICES-001.Cet appareil ISM est confomre a la norme NMB-001 du Canada.
ISM GRP.1 Class A indicates that this is an Industrial Scientific and Medical Group 1 Class A product.
The C-tick mark is a registered trademark of the Spectrum Management Agency of Australia. This signifies compliance with the Australia EMC Framework regulations under the terms of the Radio Communication Act of 1992.
This instrument complies with the WEEE Directive (2002/96/EC) marking requirement. This affixed product label indicates that you must not discard this electrical or electronic product in domestic household waste.
The CSA mark is a registered trademark of the Canadian Standards Association.
Product contains restricted substance(s) above maximum value, with a 40-year Environmental Protection Use Period.
VIII U1610/20A User’s Guide
Waste Electrical and Electronic Equipment (WEEE) Directive 2002/96/EC
This instrument complies with the WEEE Directive (2002/96/EC) marking requirement. This affixed product label indicates that you must not discard this electrical or electronic product in domestic household waste.
Product Category:
With reference to the equipment types in the WEEE directive Annex 1, this instrument is classified as a “Monitoring and Control Instrument” product.
The affixed product label is as shown below.
Do not dispose in domestic household waste.
To return this unwanted instrument, contact your nearest Agilent Service Center, or visit:
www.agilent.com/environment/product
for more information.
U1610/20A User’s Guide IX
Declaration of Conformity
The Declaration of Conformity (DoC) for this instrument is available on our Web site. You can search for the DoC by the instrument model number or description.
http://regulations.corporate.agilent.com/DoC/search.htm
NOTE If you are unable to search for the respective DoC, contact your local Agilent representative.
X U1610/20A User’s Guide
In This Guide…
1 Getting Started
This chapter provides you the information to start using your handheld scope.
2 Product Outlook
This chapter provides an overview of the handheld scope keys, panels, and display.
3 Using the Oscilloscope
This chapter explains how to set up the oscilloscope functions.
4 Using the Digital Multimeter
This chapter explains how to configure and perform multimeter measurements.
5 Using the Data Logger
This chapter describes how to perform scope and meter data logging.
6 Using the System-Related Functions
This chapter explains how to set up system-related settings and perform service functions.
7 Specifications and Characteristics
This chapter lists the specifications, characteristics, pollution degree, and measurement category of the handheld scope.
U1610/20A User’s Guide XI

THIS PAGE HAS BEEN INTENTIONALLY LEFT BLANK.
XII U1610/20A User’s Guide
Table of Contents
Table of Contents
1 Getting Started
Introduction 2
Package Contents 3
Optional Accessories 4
Adjust the Hand Strap 4
Install the Neck Strap 4
Charge the Battery 5
Tilt the Handheld Scope 5
Power On/Off the Handheld Scope 6
Use the Function Softkeys 6
Access the Quick Help 6
Reset the Handheld Scope 7
Perform Self-Calibration 8
Set the Date and Time and Language 9
Connect Probes to Oscilloscope Terminals 10
Compensate the Scope Probe 11
Independently Isolated Scope Input Channels 13
Floating measurement with isolated probes at CAT III 600 V 17Derating curve 18
Connect Test Leads to Meter Terminals 19
2 Product Outlook
Product at a Glance 22
Front Panel Key Overview 23
U1610/20A User’s Guide XIII
Table of Contents
Oscilloscope Display Overview 25
Multimeter and Data Logger Display Overview 26
3 Using the Oscilloscope
Vertical Controls 28
Channel selection for waveform display 28Vertical system setup 29Channel coupling 30Probe setting 30AC current measurement 31Invert control 31Bandwidth limit control 32Return to zero 32
Horizontal Controls 33
Horizontal system setup 33Horizontal modes 35Recording length 36
Trigger Controls 38
Trigger types 38Edge trigger 39Glitch trigger 40TV trigger 41Nth Edge trigger 42CAN trigger 43LIN trigger 45Trigger modes 46Trigger holdoff 47Noise rejection 47
Waveform Acquisition Controls 48
Display Controls 50
Vectors display 50
XIV U1610/20A User’s Guide
Table of Contents
Sin x/x interpolation 50Infinite persistence 51
Automatic Measurements 52
Time measurements 53Voltage measurements 55Power measurements 58
Cursor Measurement Controls 60
Analyzer Controls 62
Math functions 63FFT function 64
Autoscale and Run/Stop Controls 66
Autoscale 66Run/Stop 67
Save and Recall Controls 69
Save control 70Recall control 71Print screen control 72
4 Using the Digital Multimeter
Introduction 76
Voltage Measurements 77
Resistance Measurement 78
Capacitance Measurement 79
Diode Test 80
Continuity Test 81
Temperature Measurement 82
Frequency Measurement 83
Relative Measurement 84
U1610/20A User’s Guide XV
Table of Contents
Range 84
Restart Measurements 84
5 Using the Data Logger
Introduction 86
Scope Logger 87
Measurement statistics 87Graphing mode 88Saving the recorded data 89Erasing the saved recorded data 89Transferring the saved recorded data 89
Meter Logger 90
Measurement selection 90Graphing mode 90Saving the recorded data 90Erasing the saved recorded data 91Transferring the saved recorded data 91
6 Using the System-Related Functions
Introduction 94
General System Settings 94
USB connectivity 95Set the language 95Set the date and time 95Set auto-shutdown 95
Display Settings 96
Backlight intensity 96View mode 96
Sound Settings 97
Service Functions 98
XVI U1610/20A User’s Guide
Table of Contents
Firmware update 98Self-calibration 99Antialiasing 99
System Information 99
7 Specifications and Characteristics
Oscilloscope Specifications and Characteristics 102
Maximum Input Voltages and Channel Isolation 106
Digital Multimeter Specifications 108
Data Logger Specifications 111
General Specifications 112
Pollution Degree 114
Measurement Category 115
U1610/20A User’s Guide XVII

Table of Contents
THIS PAGE HAS BEEN INTENTIONALLY LEFT BLANK.
XVIII U1610/20A User’s Guide
List of Figures
List of Figures
Figure 1-1 Default Settings function 7Figure 1-2 Self-Cal notification 9Figure 1-3 Trimmer capacitor 12Figure 1-4 Pulse shape reference 12Figure 1-5 Floating ground reference signal and earth ground reference
signal 13Figure 1-6 Ground loop 14Figure 1-7 Channel isolation block diagram 15Figure 1-8 Insulation cover 16Figure 1-9 Probing the VFD IGBT control signal and IGBT output 16Figure 1-10 Channel-to-channel isolation at CAT III 600 V 17Figure 1-11 U1560A scope probe 1:1 18Figure 1-12 U1561A scope probe 10:1 18Figure 1-13 U1562A scope probe 100:1 18Figure 3-1 Channel 1 submenu 28Figure 3-2 Waveform before and after inversion 32Figure 3-3 Time reference position setting 33Figure 3-4 Zoom mode 35Figure 3-5 Trigger type and settings submenu 38Figure 3-6 Auto trigger mode 46Figure 3-7 Acquire menu 48Figure 3-8 Display control menu 50Figure 3-9 Measurement function menu 52Figure 3-10 Cursor function menu 60Figure 3-11 Autoscale function menu 66Figure 3-12 Save/Recall menu 69Figure 3-13 Save submenu 70Figure 3-14 Recall submenu 71Figure 3-15 Print screen submenu 73Figure 4-1 Multimeter display 76Figure 4-2 Relative measurement display 84Figure 5-1 Data logger menu 86Figure 5-2 Scope logger display 87Figure 5-3 Statistics display 88Figure 5-4 Meter logger display 90
U1610/20A User’s Guide XIX
List of Figures
Figure 6-1 User function menu 94Figure 6-2 General system settings submenu 94Figure 6-3 Display settings submenu 96Figure 6-4 Sound settings submenu 97Figure 6-5 Service function submenu 98Figure 7-1 Maximum safety voltage for scope reference to earth 106Figure 7-2 Maximum input voltage 107
XX U1610/20A User’s Guide
Agilent U1610/20A Handheld Digital OscilloscopeUser’s Guide
1Getting Started
Introduction 2
Package Contents 3
Optional Accessories 4
Adjust the Hand Strap 4
Install the Neck Strap 4
Charge the Battery 5
Tilt the Handheld Scope 5
Power On/Off the Handheld Scope 6
Use the Function Softkeys 6
Access the Quick Help 6
Reset the Handheld Scope 7
Perform Self-Calibration 8
Set the Date and Time and Language 9
Connect Probes to Oscilloscope Terminals 10
Compensate the Scope Probe 11
Independently Isolated Scope Input Channels 13
Connect Test Leads to Meter Terminals 19
This chapter provides you the information to start using your handheld scope.
1Agilent Technologies
1 Getting Started
Introduction
The U1610/20A Handheld Digital Oscilloscope is a mobile high- performance troubleshooting tool for multi- industrial automation, process control, facility maintenance, and automotive- service industries.
The U1610A and U1620A models have 100 MHz and 200 MHz bandwidths with maximum real- time sample rates of 1 GSa/s and 2 GSa/s respectively.
With its 5.7- inch LCD color display, the U1610/20A oscilloscope is capable of clearly distinguishing waveforms from two channels. The U1610/20A allows you to perform up to 30 types of automatic measurements. Waveform math and Fast Fourier Transform (FFT) functions are available for performing quick waveform analyses in both time and frequency domains.
The U1610/20A can also function as a digital multimeter (DMM) and a data logger. The autorange function provided allows you to perform quick and accurate DMM measurements. Using the data logger function, you can perform automatic data logging for DMM and scope measurements.
2 U1610/20A User’s Guide
Getting Started 1
Package ContentsWhen you receive your shipping container, unpack and inspect the container for damage.
If the shipping container is damaged, or the cushioning materials show signs of stress, notify the carrier and your nearest Agilent Sales Office. Keep the damaged shipping container or cushioning material until you have inspected the contents of the shipment for completeness and have checked the handheld scope mechanically and electrically.
Verify that you have received the following items in the handheld scope packaging:
✔ 1 × Handheld scope
✔ 1 × Power cable
✔ 1 × Li- Ion battery pack, 10.8 V (included in the handheld scope)
✔ 1 × AC/DC adapter
✔ 2 × 10:1 CAT III 600 V scope probe
✔ 1 × BNC- to- probe adapter
✔ 1 × DMM test lead kit
✔ 1 × USB cable
✔ 1 × Hand strap (attached on the handheld scope)
✔ 1 × Neck strap
✔ 1 × Printed Quick Start Guide
✔ 1 × Certificate of Calibration
If anything is missing, contact your nearest Agilent Sales Office.
Inspect the handheld scope
If there is mechanical damage or a defect, or if the handheld scope does not operate properly or does not pass performance tests, notify your nearest Agilent Sales Office.
NOTE The above items are available for purchase separately if you require more quantities.
U1610/20A User’s Guide 3
1 Getting Started
Optional Accessories
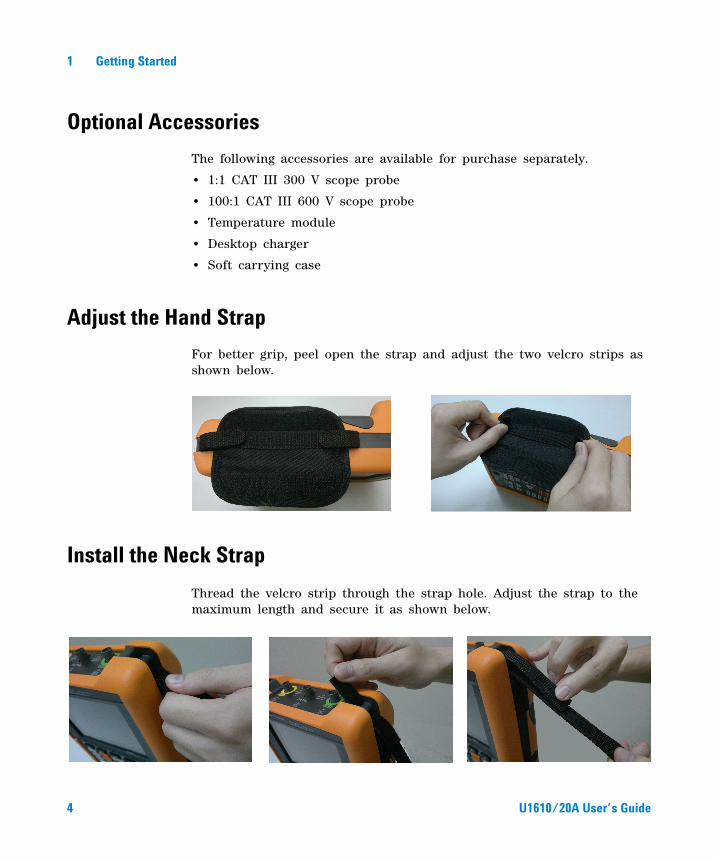
The following accessories are available for purchase separately.
• 1:1 CAT III 300 V scope probe
• 100:1 CAT III 600 V scope probe
• Temperature module
• Desktop charger
• Soft carrying case
Adjust the Hand Strap
For better grip, peel open the strap and adjust the two velcro strips as shown below.
Install the Neck Strap
Thread the velcro strip through the strap hole. Adjust the strap to the maximum length and secure it as shown below.
4 U1610/20A User’s Guide
Getting Started 1
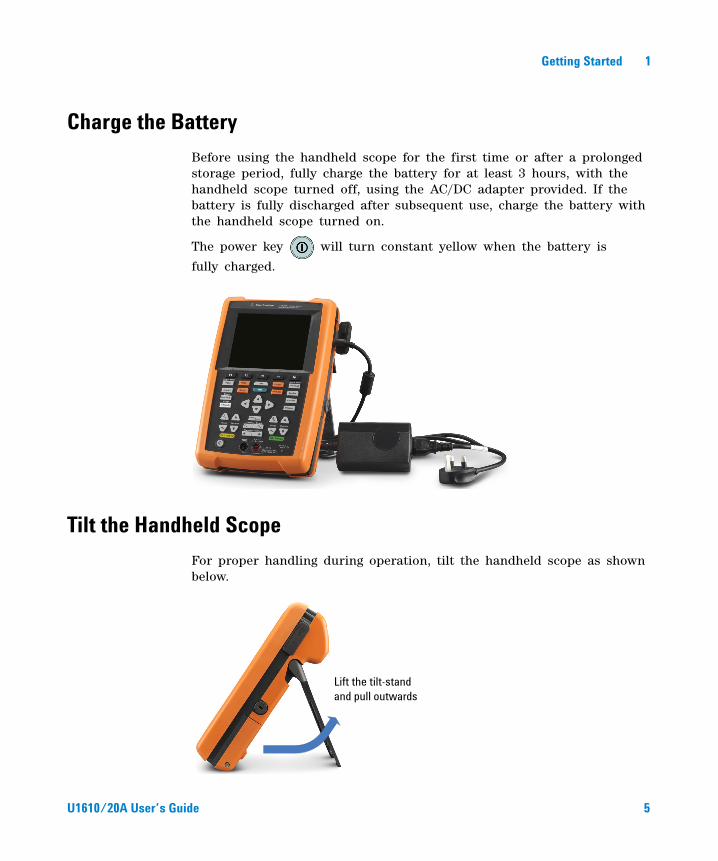
Charge the Battery
Before using the handheld scope for the first time or after a prolonged storage period, fully charge the battery for at least 3 hours, with the handheld scope turned off, using the AC/DC adapter provided. If the battery is fully discharged after subsequent use, charge the battery with the handheld scope turned on.
The power key will turn constant yellow when the battery is fully charged.
Tilt the Handheld Scope
For proper handling during operation, tilt the handheld scope as shown below.
Lift the tilt-stand and pull outwards
U1610/20A User’s Guide 5
1 Getting Started
Power On/Off the Handheld Scope
Press and hold for approximately 3 seconds to power on the
handheld scope. When the handheld scope display appears, the scope is
ready for use.
Press and hold for approximately 3 seconds to power off the
handheld scope. The display will take some time to turn off.
Press and hold for approximately 10 seconds to power cycle the handheld scope.
Use the Function Softkeys
Press the softkey ( to ) that corresponds to the label shown above it on the display.
Access the Quick Help
Press any function key/softkey followed by to display its respective Help information. Use the or key to navigate within Help.
To view Help in another language, press > >
and use the keys to select the language. Press
again to exit the selection menu.
To access information on using Help, press and hold for approximately 3 seconds.
NOTE Hook up all cables and accessories before applying power. You can connect/disconnect probes while the handheld scope is turned on.
NOTE If the handheld scope is not able to power cycle after pressing and holding for approximately 10 seconds, remove and reinsert the battery.
6 U1610/20A User’s Guide
Getting Started 1
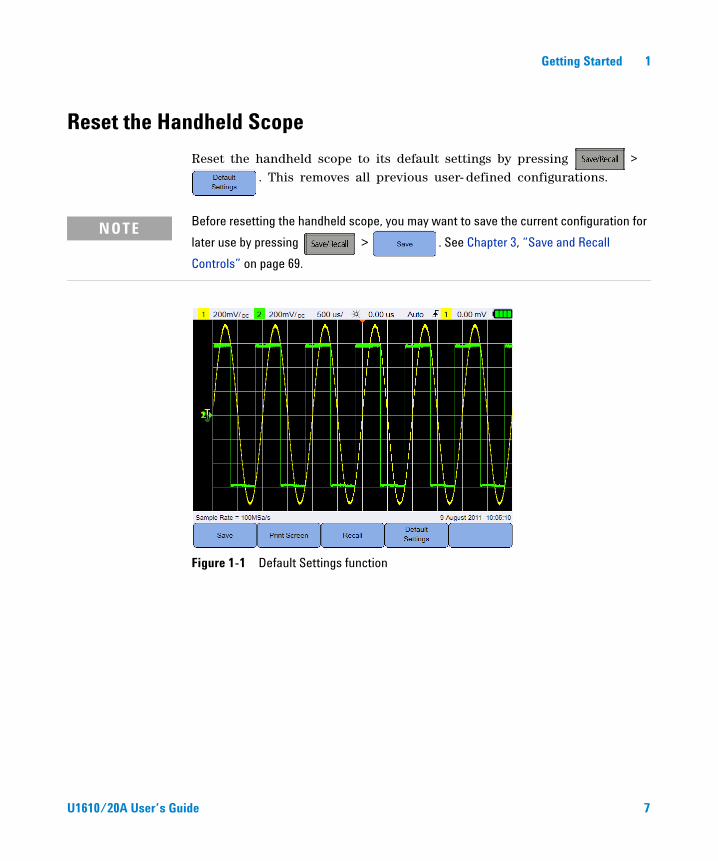
Reset the Handheld Scope
Reset the handheld scope to its default settings by pressing > . This removes all previous user- defined configurations.
Figure 1-1 Default Settings function
NOTE Before resetting the handheld scope, you may want to save the current configuration for
later use by pressing > . See Chapter 3, “Save and Recall
Controls” on page 69.
U1610/20A User’s Guide 7
1 Getting Started
Perform Self-CalibrationWhen performing self- calibration, no signal is injected into the handheld scope. During the self- calibration process, the firmware will perform zero, offset, and TDC calibration.
• For zero calibration, the firmware will acquire samples for a fixed period of time corresponding to the zero input condition. The acquired data contains channel noise and DC offset. The firmware determines this channel DC offset and upon completion of self- calibration, uses the determined DC offset to subtract from ADC samples, producing offset- compensated samples. This feature is useful for removing channel DC offset due to temperature changes and component aging, thus providing better accuracy.
• Offset calibration (performed after completion of the zero calibration) calibrates the system offset DAC for gain accuracy. During calibration, the firmware determines the offset DAC code settings required to offset the zero input signal trace to +4 divisions and –4 divisions (vertical). The codeword range for the offset DAC to move the zero input trace across ±4 division range will represent the offset DAC gain. This gain changes due to temperature variation and component aging. Offset calibration corrects for this drift in the offset DAC gain.
• TDC calibration calibrates and corrects for errors (due to temperature variation) in the time interval measurement performed by the TDC circuit.
Allow the handheld scope to warm up for at least 30 minutes before performing self- calibration. It is recommended that you perform self- calibration in the following situations:
• Every 12 months or after 2000 hours of operation.
• If the ambient temperature is >10 °C from the calibration temperature.
• To maximize the measurement accuracy.
• After experiencing abnormal operation.
• To verify proper operation after repairing.
WARNING Disconnect all probe and meter connections to the input terminals of the handheld scope before performing self-calibration.
8 U1610/20A User’s Guide
Getting Started 1
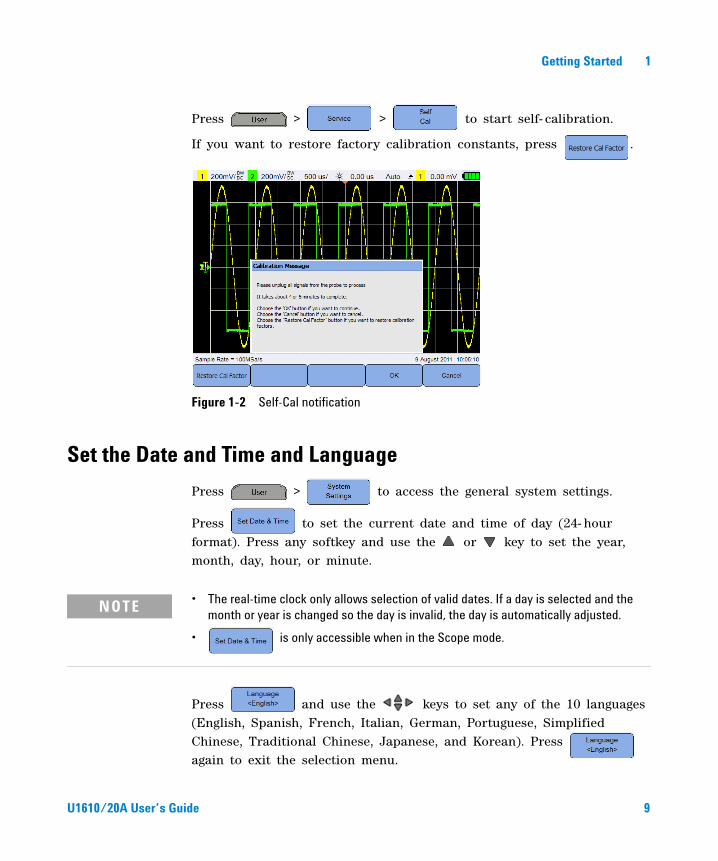
Press > > to start self- calibration.
If you want to restore factory calibration constants, press .
Figure 1-2 Self-Cal notification
Set the Date and Time and Language
Press > to access the general system settings.
Press to set the current date and time of day (24- hour format). Press any softkey and use the or key to set the year, month, day, hour, or minute.
Press and use the keys to set any of the 10 languages (English, Spanish, French, Italian, German, Portuguese, Simplified Chinese, Traditional Chinese, Japanese, and Korean). Press again to exit the selection menu.
NOTE • The real-time clock only allows selection of valid dates. If a day is selected and the month or year is changed so the day is invalid, the day is automatically adjusted.
• is only accessible when in the Scope mode.
U1610/20A User’s Guide 9
1 Getting Started
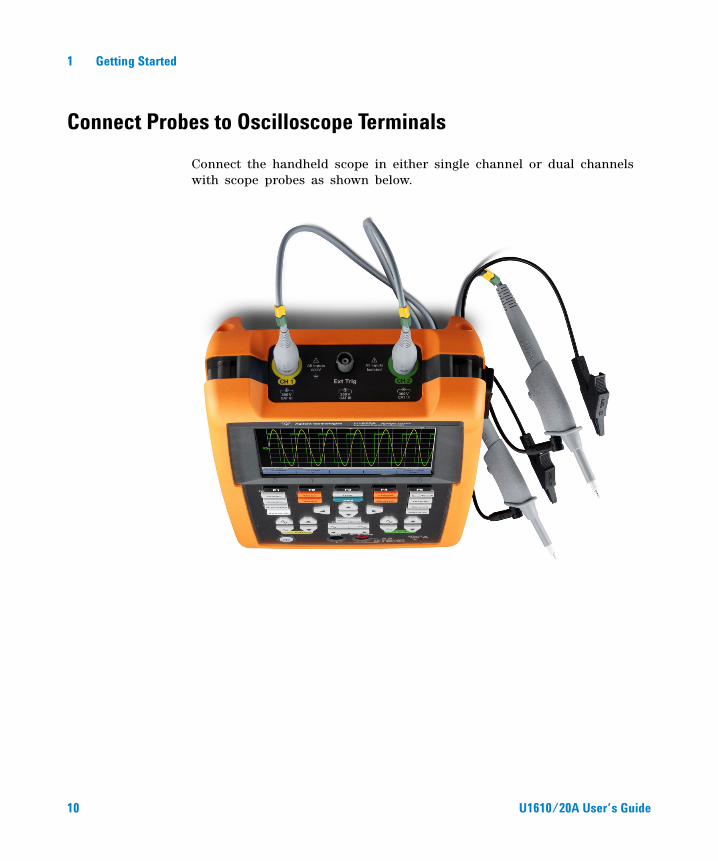
Connect Probes to Oscilloscope Terminals
Connect the handheld scope in either single channel or dual channels with scope probes as shown below.
10 U1610/20A User’s Guide
Getting Started 1
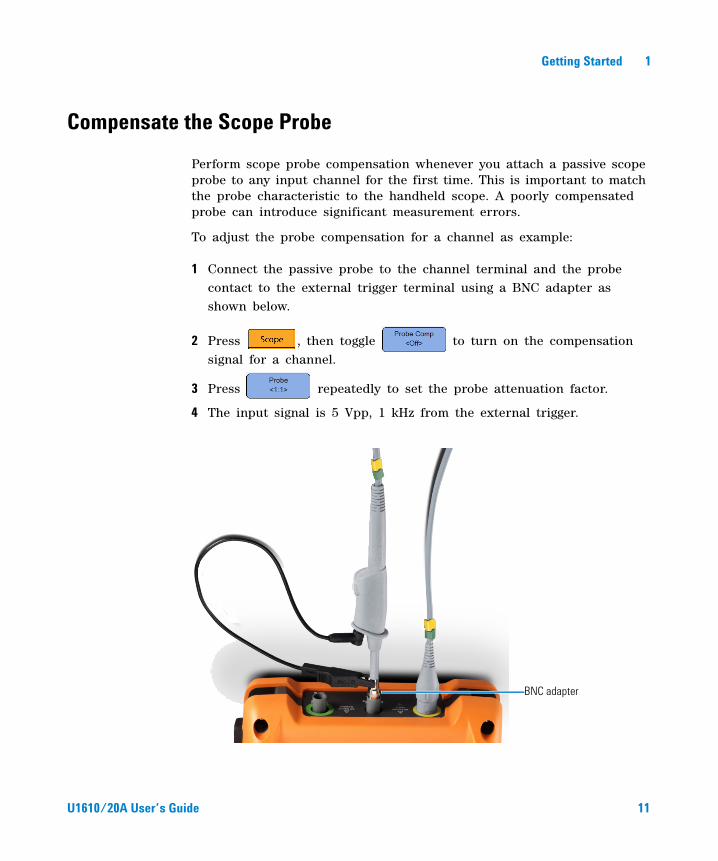
Compensate the Scope Probe
Perform scope probe compensation whenever you attach a passive scope probe to any input channel for the first time. This is important to match the probe characteristic to the handheld scope. A poorly compensated probe can introduce significant measurement errors.
To adjust the probe compensation for a channel as example:
1 Connect the passive probe to the channel terminal and the probe contact to the external trigger terminal using a BNC adapter as shown below.
2 Press , then toggle to turn on the compensation signal for a channel.
3 Press repeatedly to set the probe attenuation factor.
4 The input signal is 5 Vpp, 1 kHz from the external trigger.
BNC adapter
U1610/20A User’s Guide 11

1 Getting Started
Use a nonmetallic tool to adjust the trimmer capacitor on the probe for the flattest pulse possible.
Figure 1-3 Trimmer capacitor
Figure 1-4 Pulse shape reference
trimmer capaciitor
Properly compensated
Over compensated
Under compensated
12 U1610/20A User’s Guide

Getting Started 1
Independently Isolated Scope Input Channels
There are two main categories of signal sources:
• Earth ground referenced signal—the voltage signals are referenced to a system ground, such as earth ground.
• Floating ground referenced signal—a floating signal in which the voltage signal is not referenced to earth ground.
Figure 1-5 Floating ground reference signal and earth ground reference signal
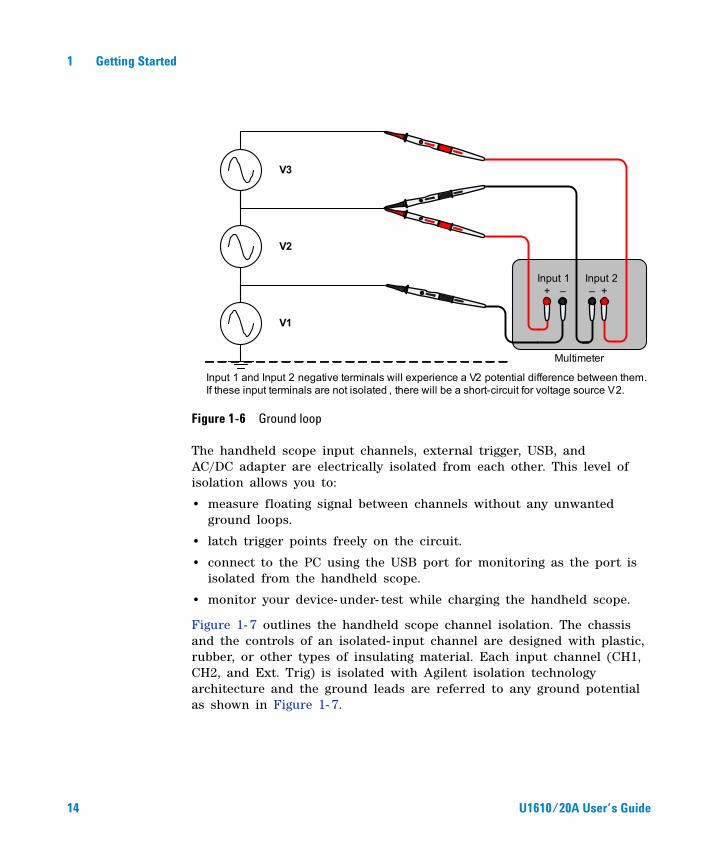
When measuring floating signals with instruments that have multiple inputs, unwanted ground loops may occur. These ground loops can induce measurement errors and cause electrical shock or power surges. Ground loop occurs between the negative terminals of two inputs as shown in Figure 1- 6.
Instruments with channel- to- channel isolation can be used to eliminate the ground loops. Isolated channels separate the two signal path effectively from each other by eliminating any potential common circuit path between the two inputs.
Floating ground referenced signal
Floating ground referenced signal
Floating ground referenced signal
Earth ground referenced signal
Earth ground referenced signal
Earth ground referenced signal
U1610/20A User’s Guide 13
1 Getting Started
Figure 1-6 Ground loop
The handheld scope input channels, external trigger, USB, and AC/DC adapter are electrically isolated from each other. This level of isolation allows you to:
• measure floating signal between channels without any unwanted ground loops.
• latch trigger points freely on the circuit.
• connect to the PC using the USB port for monitoring as the port is isolated from the handheld scope.
• monitor your device- under- test while charging the handheld scope.
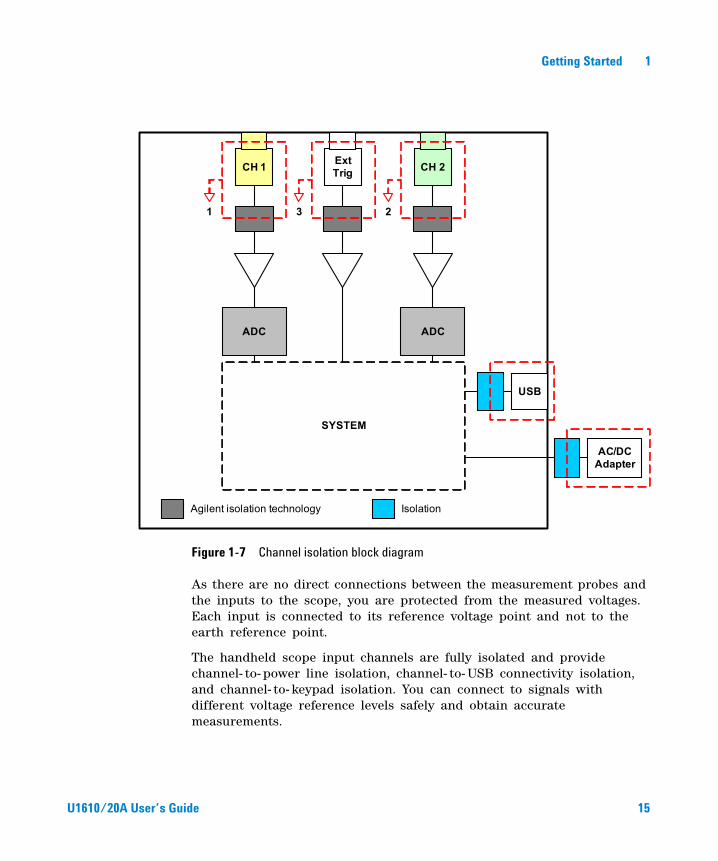
Figure 1- 7 outlines the handheld scope channel isolation. The chassis and the controls of an isolated- input channel are designed with plastic, rubber, or other types of insulating material. Each input channel (CH1, CH2, and Ext. Trig) is isolated with Agilent isolation technology architecture and the ground leads are referred to any ground potential as shown in Figure 1- 7.
V3
V2
V1
Input 1 Input 2+ – – +
Input 1 and Input 2 negative terminals will experience a V2 potential difference between them. If these input terminals are not isolated , there will be a short-circuit for voltage source V2.
Multimeter
14 U1610/20A User’s Guide
Getting Started 1
Figure 1-7 Channel isolation block diagram
As there are no direct connections between the measurement probes and the inputs to the scope, you are protected from the measured voltages. Each input is connected to its reference voltage point and not to the earth reference point.
The handheld scope input channels are fully isolated and provide channel- to- power line isolation, channel- to- USB connectivity isolation, and channel- to- keypad isolation. You can connect to signals with different voltage reference levels safely and obtain accurate measurements.
Agilent isolation technology
ADC ADC
Ext TrigCH 1
`
CH 2
1 3 2
USB
AC/DC Adapter
SYSTEM
Isolation
U1610/20A User’s Guide 15
1 Getting Started
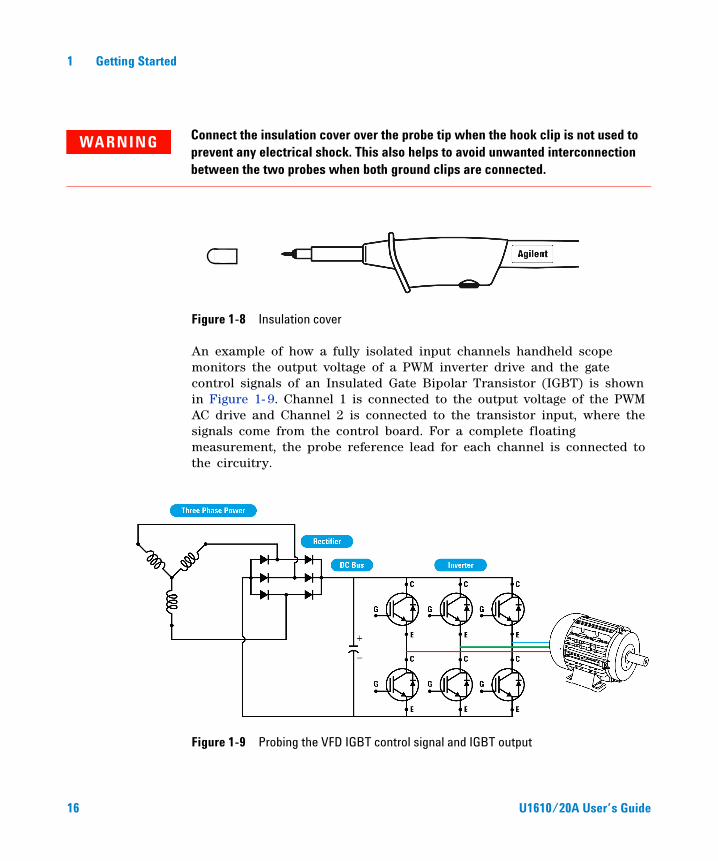
Figure 1-8 Insulation cover
An example of how a fully isolated input channels handheld scope monitors the output voltage of a PWM inverter drive and the gate control signals of an Insulated Gate Bipolar Transistor (IGBT) is shown in Figure 1- 9. Channel 1 is connected to the output voltage of the PWM AC drive and Channel 2 is connected to the transistor input, where the signals come from the control board. For a complete floating measurement, the probe reference lead for each channel is connected to the circuitry.
Figure 1-9 Probing the VFD IGBT control signal and IGBT output
WARNING Connect the insulation cover over the probe tip when the hook clip is not used to prevent any electrical shock. This also helps to avoid unwanted interconnection between the two probes when both ground clips are connected.
16 U1610/20A User’s Guide
Getting Started 1
Floating measurement with isolated probes at CAT III 600 V
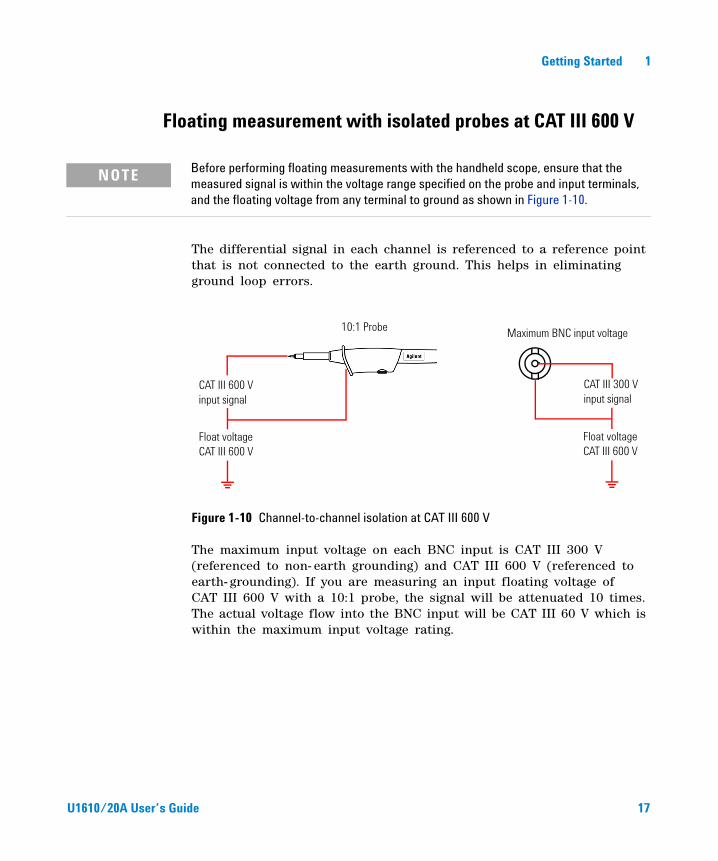
The differential signal in each channel is referenced to a reference point that is not connected to the earth ground. This helps in eliminating ground loop errors.
Figure 1-10 Channel-to-channel isolation at CAT III 600 V
The maximum input voltage on each BNC input is CAT III 300 V (referenced to non- earth grounding) and CAT III 600 V (referenced to earth- grounding). If you are measuring an input floating voltage of CAT III 600 V with a 10:1 probe, the signal will be attenuated 10 times. The actual voltage flow into the BNC input will be CAT III 60 V which is within the maximum input voltage rating.
NOTE Before performing floating measurements with the handheld scope, ensure that the measured signal is within the voltage range specified on the probe and input terminals, and the floating voltage from any terminal to ground as shown in Figure 1-10.
CAT III 600 V input signal
Float voltage CAT III 600 V
10:1 Probe
CAT III 300 V input signal
Maximum BNC input voltage
Float voltage CAT III 600 V
U1610/20A User’s Guide 17
1 Getting Started
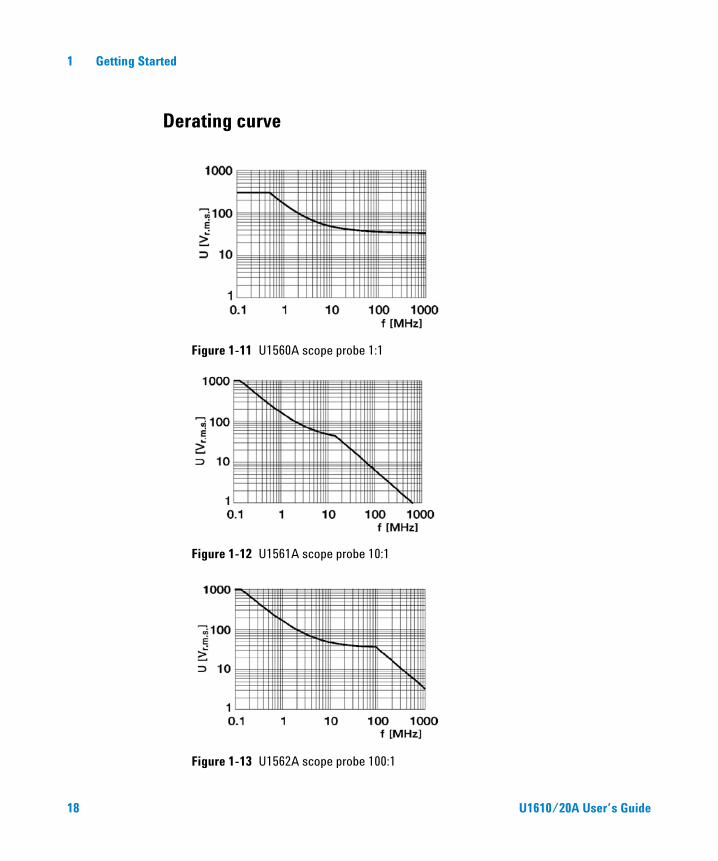
Derating curve
Figure 1-11 U1560A scope probe 1:1
Figure 1-12 U1561A scope probe 10:1
Figure 1-13 U1562A scope probe 100:1
18 U1610/20A User’s Guide
Getting Started 1
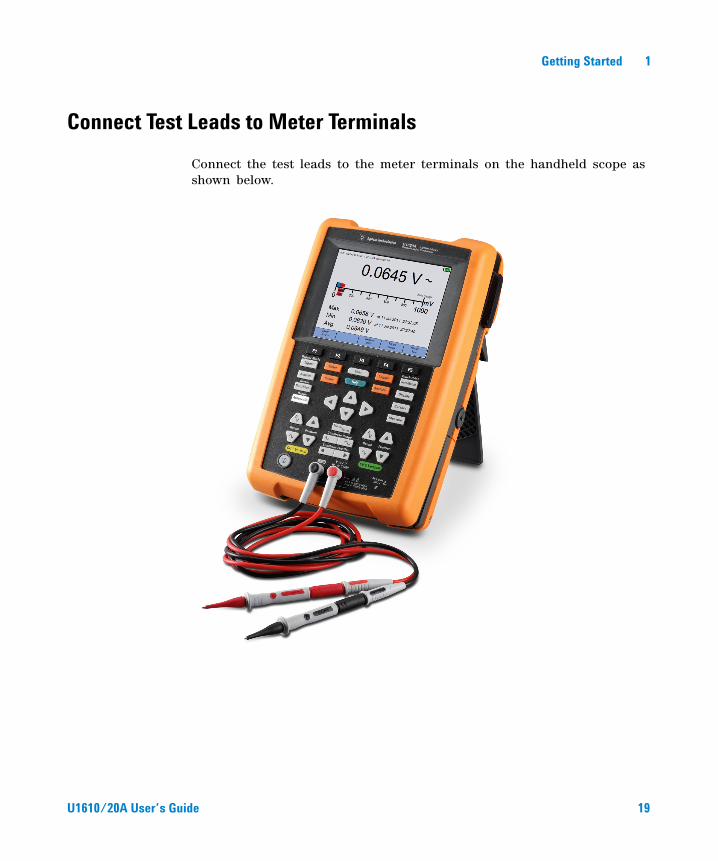
Connect Test Leads to Meter Terminals
Connect the test leads to the meter terminals on the handheld scope as shown below.
U1610/20A User’s Guide 19

1 Getting Started
THIS PAGE HAS BEEN INTENTIONALLY LEFT BLANK.
20 U1610/20A User’s Guide
Agilent U1610/20A Handheld Digital OscilloscopeUser’s Guide
2Product Outlook
Product at a Glance 22
Front Panel Key Overview 23
Oscilloscope Display Overview 25
Multimeter and Data Logger Display Overview 26
This chapter provides an overview of the handheld scope keys, panels, and display.
21Agilent Technologies
2 Product Outlook
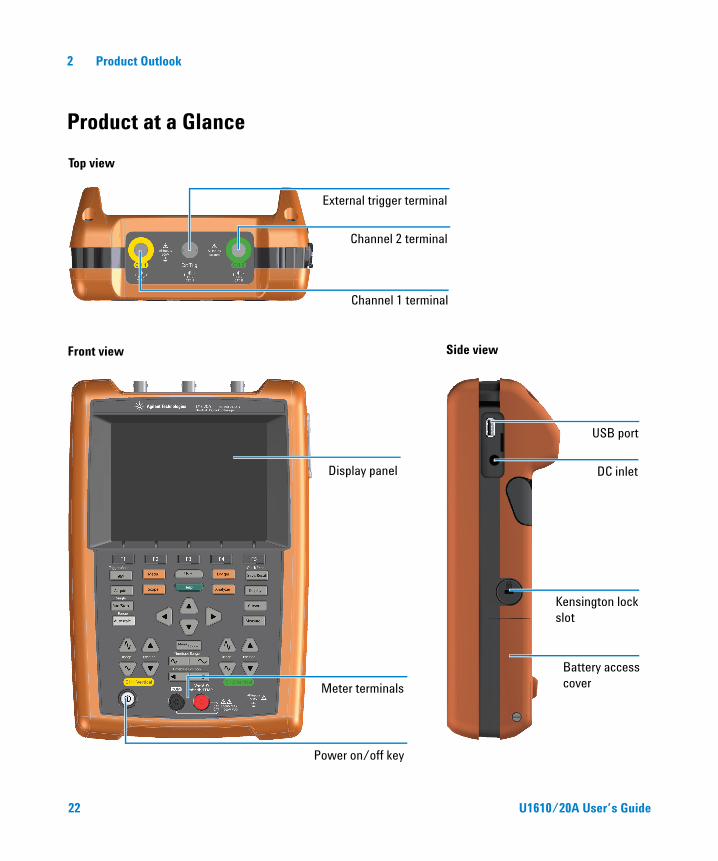
Product at a Glance
Channel 2 terminal
External trigger terminal
Channel 1 terminal
Display panel
Power on/off key
Meter terminals
USB port
DC inlet
Kensington lock slot
Battery access cover
Top view
Front view Side view
22 U1610/20A User’s Guide
Product Outlook 2
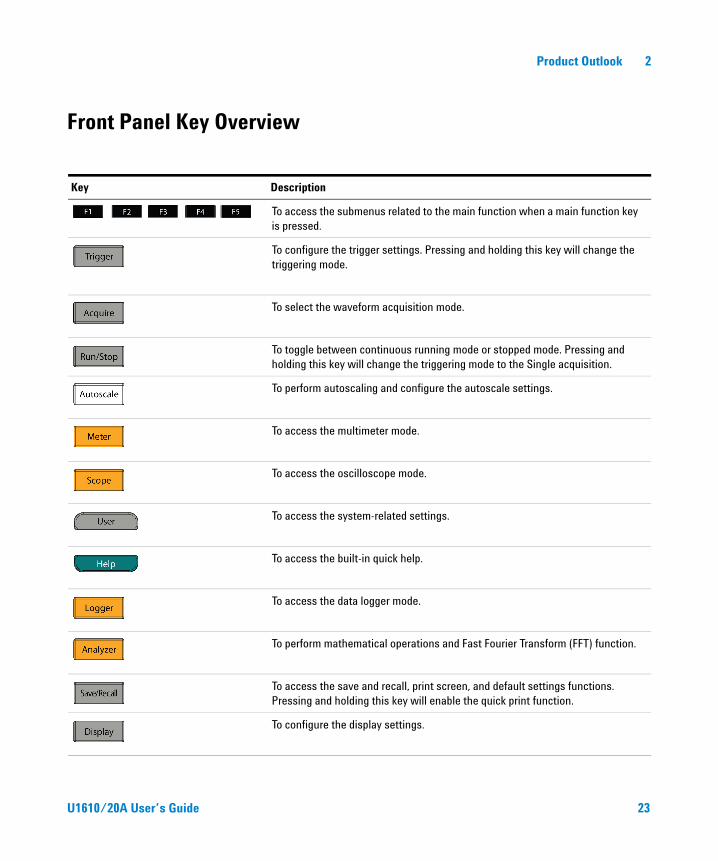
Front Panel Key Overview
Key Description
To access the submenus related to the main function when a main function key is pressed.
To configure the trigger settings. Pressing and holding this key will change the triggering mode.
To select the waveform acquisition mode.
To toggle between continuous running mode or stopped mode. Pressing and holding this key will change the triggering mode to the Single acquisition.
To perform autoscaling and configure the autoscale settings.
To access the multimeter mode.
To access the oscilloscope mode.
To access the system-related settings.
To access the built-in quick help.
To access the data logger mode.
To perform mathematical operations and Fast Fourier Transform (FFT) function.
To access the save and recall, print screen, and default settings functions. Pressing and holding this key will enable the quick print function.
To configure the display settings.
U1610/20A User’s Guide 23
2 Product Outlook
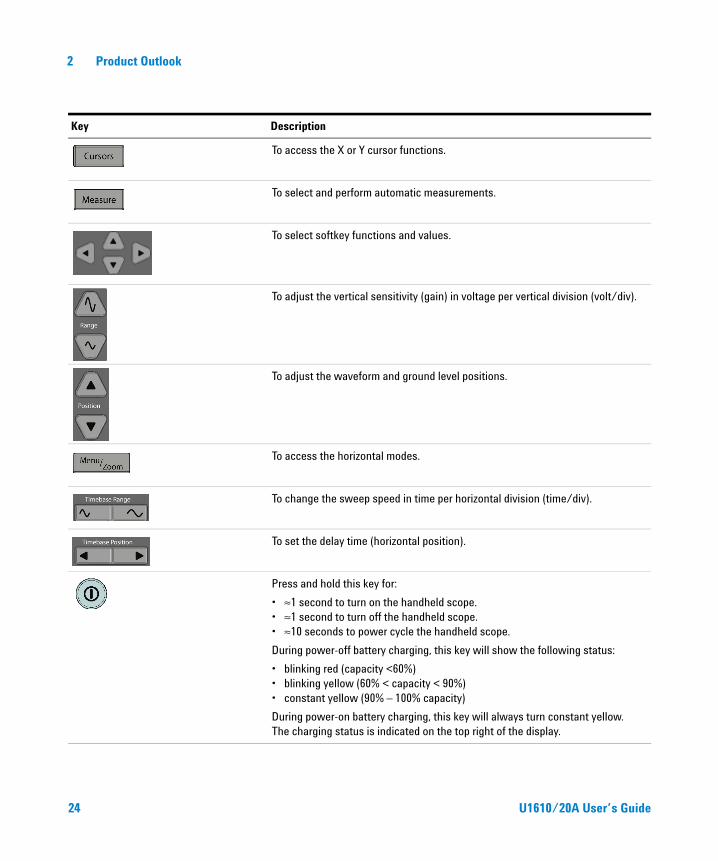
To access the X or Y cursor functions.
To select and perform automatic measurements.
To select softkey functions and values.
To adjust the vertical sensitivity (gain) in voltage per vertical division (volt/div).
To adjust the waveform and ground level positions.
To access the horizontal modes.
To change the sweep speed in time per horizontal division (time/div).
To set the delay time (horizontal position).
Press and hold this key for:
• ≈1 second to turn on the handheld scope. • ≈1 second to turn off the handheld scope. • ≈10 seconds to power cycle the handheld scope.
During power-off battery charging, this key will show the following status:
• blinking red (capacity <60%)• blinking yellow (60% < capacity < 90%)• constant yellow (90% – 100% capacity)
During power-on battery charging, this key will always turn constant yellow. The charging status is indicated on the top right of the display.
Key Description
24 U1610/20A User’s Guide
Product Outlook 2
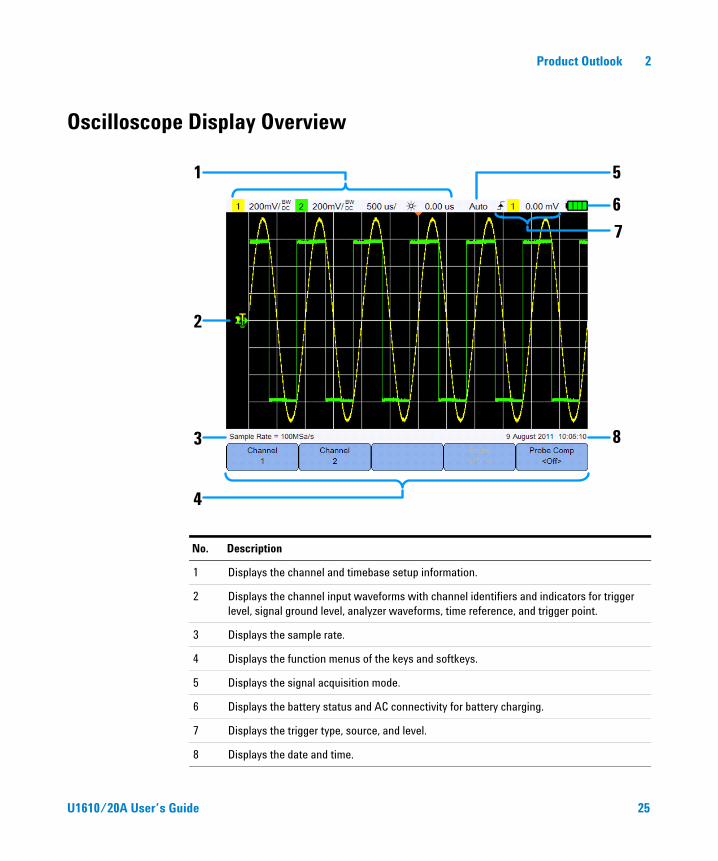
Oscilloscope Display Overview
No. Description
1 Displays the channel and timebase setup information.
2 Displays the channel input waveforms with channel identifiers and indicators for trigger level, signal ground level, analyzer waveforms, time reference, and trigger point.
3 Displays the sample rate.
4 Displays the function menus of the keys and softkeys.
5 Displays the signal acquisition mode.
6 Displays the battery status and AC connectivity for battery charging.
7 Displays the trigger type, source, and level.
8 Displays the date and time.
6
4
1 5
7
83
2
U1610/20A User’s Guide 25
2 Product Outlook
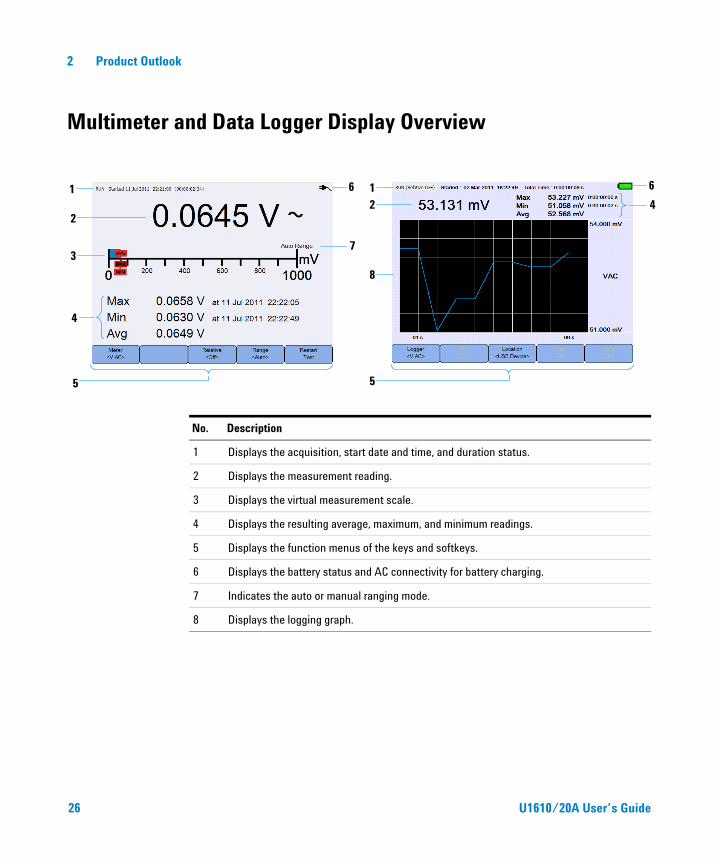
Multimeter and Data Logger Display Overview
6
5
7
2
1
3
4
612
8
5
4
No. Description
1 Displays the acquisition, start date and time, and duration status.
2 Displays the measurement reading.
3 Displays the virtual measurement scale.
4 Displays the resulting average, maximum, and minimum readings.
5 Displays the function menus of the keys and softkeys.
6 Displays the battery status and AC connectivity for battery charging.
7 Indicates the auto or manual ranging mode.
8 Displays the logging graph.
26 U1610/20A User’s Guide
Agilent U1610/20A Handheld Digital OscilloscopeUser’s Guide
3Using the Oscilloscope
Vertical Controls 28
Horizontal Controls 33
Trigger Controls 38
Waveform Acquisition Controls 48
Display Controls 50
Automatic Measurements 52
Cursor Measurement Controls 60
Analyzer Controls 62
Autoscale and Run/Stop Controls 66
Save and Recall Controls 69
This chapter explains how to set up the oscilloscope functions.
27Agilent Technologies
3 Using the Oscilloscope
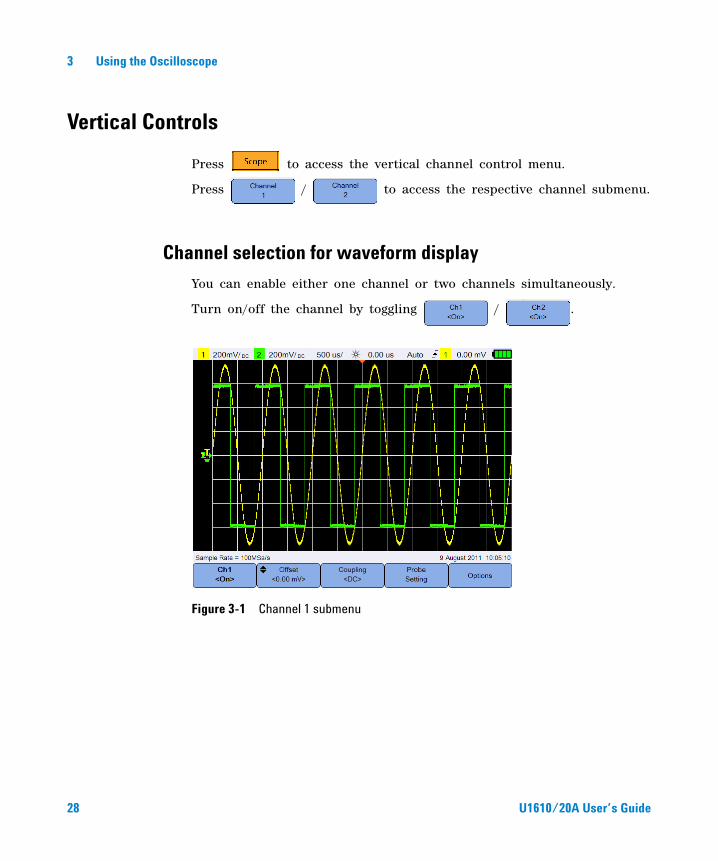
Vertical Controls
Press to access the vertical channel control menu.
Press / to access the respective channel submenu.
Channel selection for waveform display
You can enable either one channel or two channels simultaneously.
Turn on/off the channel by toggling / .
Figure 3-1 Channel 1 submenu
28 U1610/20A User’s Guide
Using the Oscilloscope 3
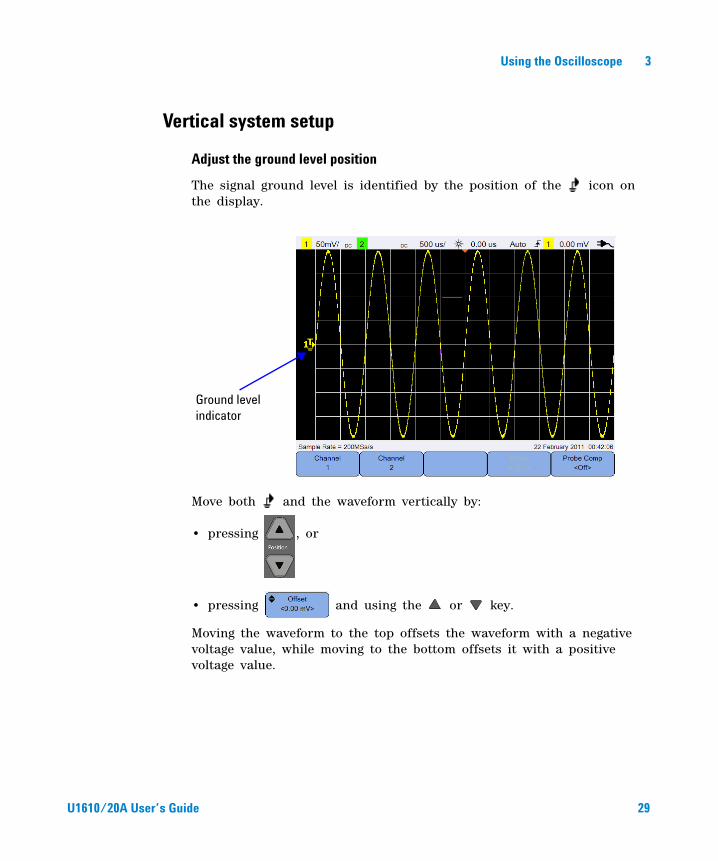
Vertical system setup
Adjust the ground level position
The signal ground level is identified by the position of the icon on the display.
Move both and the waveform vertically by:
• pressing , or
• pressing and using the or key.
Moving the waveform to the top offsets the waveform with a negative voltage value, while moving to the bottom offsets it with a positive voltage value.
Ground level indicator
U1610/20A User’s Guide 29
3 Using the Oscilloscope
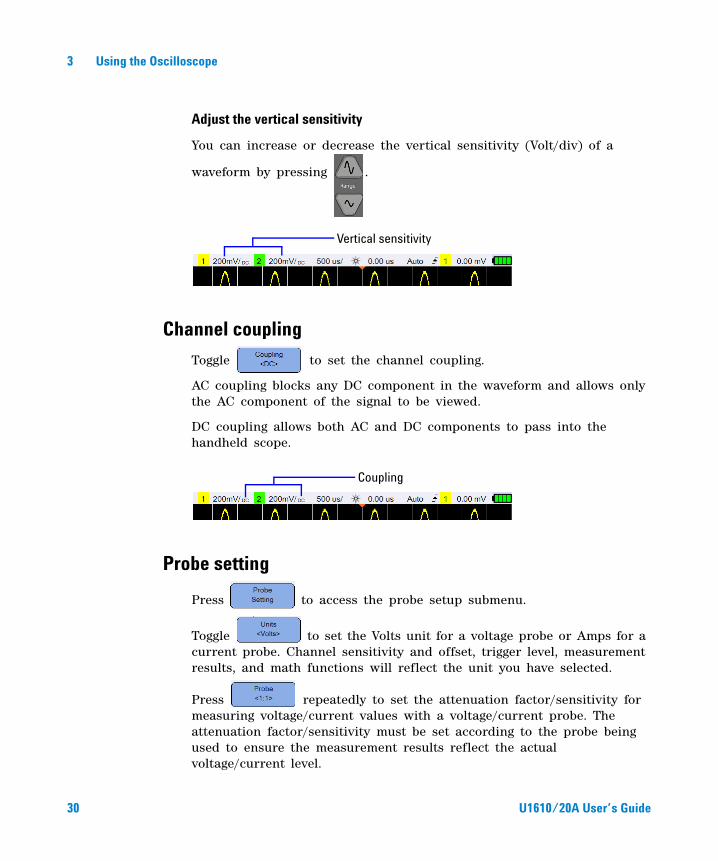
Adjust the vertical sensitivity
You can increase or decrease the vertical sensitivity (Volt/div) of a
waveform by pressing .
Channel coupling
Toggle to set the channel coupling.
AC coupling blocks any DC component in the waveform and allows only the AC component of the signal to be viewed.
DC coupling allows both AC and DC components to pass into the handheld scope.
Probe setting
Press to access the probe setup submenu.
Toggle to set the Volts unit for a voltage probe or Amps for a current probe. Channel sensitivity and offset, trigger level, measurement results, and math functions will reflect the unit you have selected.
Press repeatedly to set the attenuation factor/sensitivity for measuring voltage/current values with a voltage/current probe. The attenuation factor/sensitivity must be set according to the probe being used to ensure the measurement results reflect the actual voltage/current level.
Vertical sensitivity
Coupling
30 U1610/20A User’s Guide

Using the Oscilloscope 3
AC current measurement
AC current measurement can be performed by using an AC current clamp. Agilent recommends the U1583B AC current clamp.
To measure AC current:
1 Connect the AC current clamp to channel 1 or channel 2.
2 Press / to access the connected channel submenu.
3 Press to access the probe setup submenu.
4 Toggle to set the unit to Amps.
5 Press repeatedly to select the required V/A range for the AC current clamp.
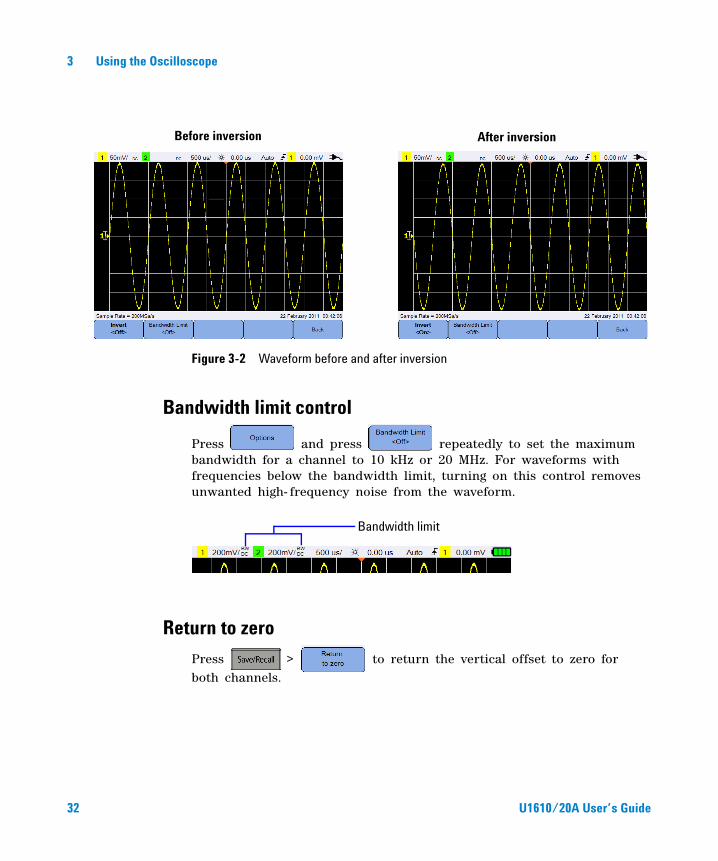
Invert controlThis control inverts the displayed waveform with respect to the ground level. Invert affects how a channel is displayed, but does not affect triggering. Inverting a channel also changes the result of any function selected in the Analyzer Controls menu.
To invert a channel waveform:
1 Press to access the invert and bandwidth limit control submenu.
2 Toggle .
U1610/20A User’s Guide 31
3 Using the Oscilloscope
Figure 3-2 Waveform before and after inversion
Bandwidth limit control
Press and press repeatedly to set the maximum bandwidth for a channel to 10 kHz or 20 MHz. For waveforms with frequencies below the bandwidth limit, turning on this control removes unwanted high- frequency noise from the waveform.
Return to zero
Press > to return the vertical offset to zero for both channels.
Before inversion After inversion
Bandwidth limit
32 U1610/20A User’s Guide
Using the Oscilloscope 3
Horizontal Controls
The horizontal controls adjust the horizontal scale and position of the waveforms.
Horizontal system setup
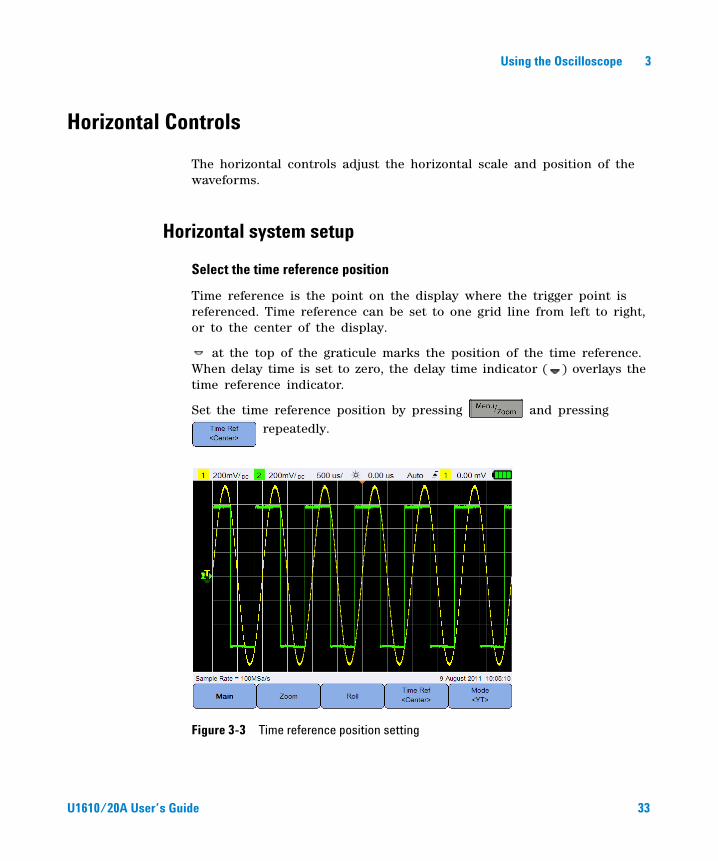
Select the time reference position
Time reference is the point on the display where the trigger point is referenced. Time reference can be set to one grid line from left to right, or to the center of the display.
at the top of the graticule marks the position of the time reference. When delay time is set to zero, the delay time indicator ( ) overlays the time reference indicator.
Set the time reference position by pressing and pressing repeatedly.
Figure 3-3 Time reference position setting
U1610/20A User’s Guide 33
3 Using the Oscilloscope
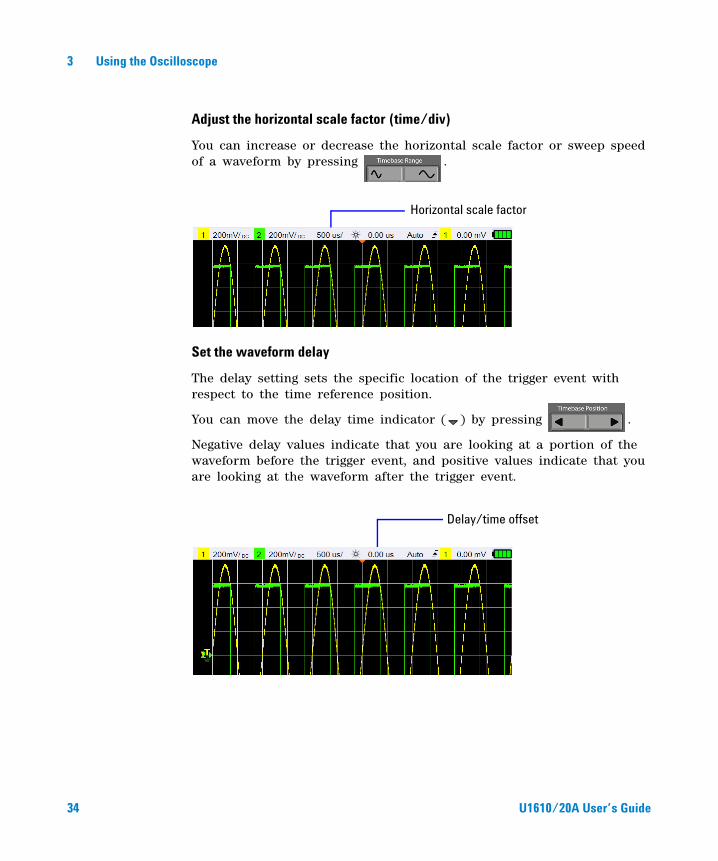
Adjust the horizontal scale factor (time/div)
You can increase or decrease the horizontal scale factor or sweep speed of a waveform by pressing .
Set the waveform delay
The delay setting sets the specific location of the trigger event with respect to the time reference position.
You can move the delay time indicator ( ) by pressing .
Negative delay values indicate that you are looking at a portion of the waveform before the trigger event, and positive values indicate that you are looking at the waveform after the trigger event.
Horizontal scale factor
Delay/time offset
34 U1610/20A User’s Guide
Using the Oscilloscope 3
Horizontal modes
Press to access the horizontal mode menu.
Main mode
Press to access the Main mode, which is the normal viewing mode for the oscilloscope.
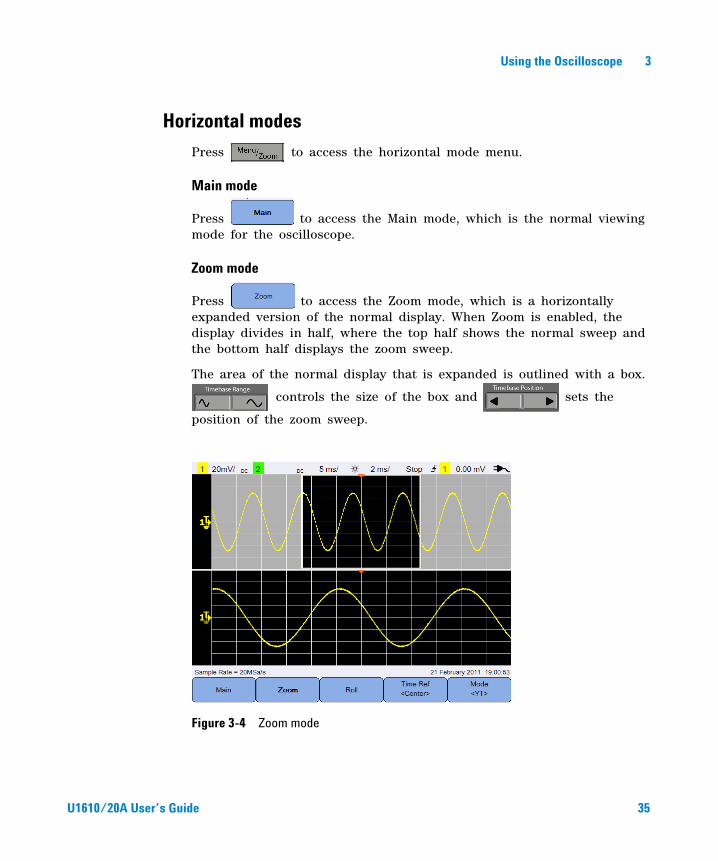
Zoom mode
Press to access the Zoom mode, which is a horizontally expanded version of the normal display. When Zoom is enabled, the display divides in half, where the top half shows the normal sweep and the bottom half displays the zoom sweep.
The area of the normal display that is expanded is outlined with a box.
controls the size of the box and sets the
position of the zoom sweep.
Figure 3-4 Zoom mode
U1610/20A User’s Guide 35
3 Using the Oscilloscope
Roll mode
Press to access the Roll mode, which causes the waveform to roll across the display from right to left. To pause the display, press
. To clear the display and restart an acquisition, press again.
XY mode
Press to access the XY mode, which changes the display from a volts- versus- time display to a volts- versus- volts display. The timebase is turned off and Channel 1 amplitude is plotted on the X- axis and Channel 2 amplitude is plotted on the Y- axis. The Z- axis input (Ext Trigger) turns the trace on and off. When Z is low (<1.4 V), Y versus X is displayed; when Z is high (>1.4 V), the trace is turned off.
You can use XY mode to compare frequency and phase relationships between two signals.
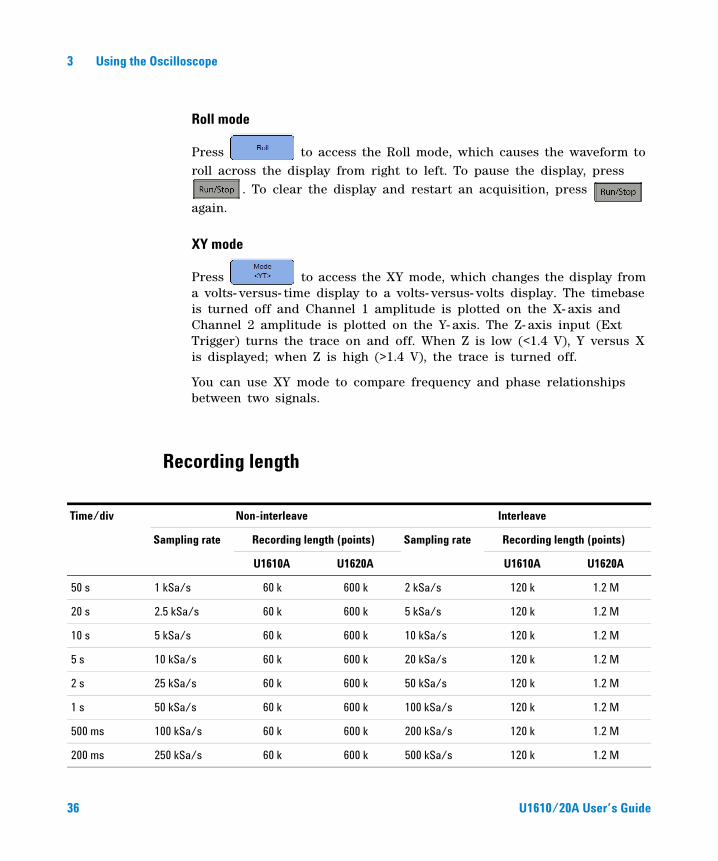
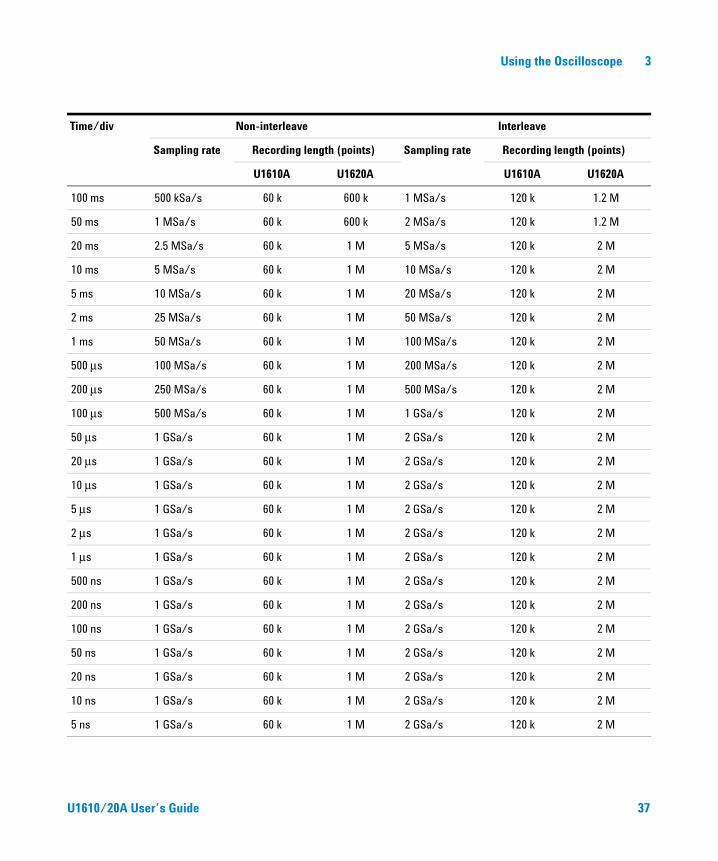
Recording length
Time/div Non-interleave Interleave
Sampling rate Recording length (points) Sampling rate Recording length (points)
U1610A U1620A U1610A U1620A
50 s 1 kSa/s 60 k 600 k 2 kSa/s 120 k 1.2 M
20 s 2.5 kSa/s 60 k 600 k 5 kSa/s 120 k 1.2 M
10 s 5 kSa/s 60 k 600 k 10 kSa/s 120 k 1.2 M
5 s 10 kSa/s 60 k 600 k 20 kSa/s 120 k 1.2 M
2 s 25 kSa/s 60 k 600 k 50 kSa/s 120 k 1.2 M
1 s 50 kSa/s 60 k 600 k 100 kSa/s 120 k 1.2 M
500 ms 100 kSa/s 60 k 600 k 200 kSa/s 120 k 1.2 M
200 ms 250 kSa/s 60 k 600 k 500 kSa/s 120 k 1.2 M
36 U1610/20A User’s Guide
Using the Oscilloscope 3
100 ms 500 kSa/s 60 k 600 k 1 MSa/s 120 k 1.2 M
50 ms 1 MSa/s 60 k 600 k 2 MSa/s 120 k 1.2 M
20 ms 2.5 MSa/s 60 k 1 M 5 MSa/s 120 k 2 M
10 ms 5 MSa/s 60 k 1 M 10 MSa/s 120 k 2 M
5 ms 10 MSa/s 60 k 1 M 20 MSa/s 120 k 2 M
2 ms 25 MSa/s 60 k 1 M 50 MSa/s 120 k 2 M
1 ms 50 MSa/s 60 k 1 M 100 MSa/s 120 k 2 M
500 μs 100 MSa/s 60 k 1 M 200 MSa/s 120 k 2 M
200 μs 250 MSa/s 60 k 1 M 500 MSa/s 120 k 2 M
100 μs 500 MSa/s 60 k 1 M 1 GSa/s 120 k 2 M
50 μs 1 GSa/s 60 k 1 M 2 GSa/s 120 k 2 M
20 μs 1 GSa/s 60 k 1 M 2 GSa/s 120 k 2 M
10 μs 1 GSa/s 60 k 1 M 2 GSa/s 120 k 2 M
5 μs 1 GSa/s 60 k 1 M 2 GSa/s 120 k 2 M
2 μs 1 GSa/s 60 k 1 M 2 GSa/s 120 k 2 M
1 μs 1 GSa/s 60 k 1 M 2 GSa/s 120 k 2 M
500 ns 1 GSa/s 60 k 1 M 2 GSa/s 120 k 2 M
200 ns 1 GSa/s 60 k 1 M 2 GSa/s 120 k 2 M
100 ns 1 GSa/s 60 k 1 M 2 GSa/s 120 k 2 M
50 ns 1 GSa/s 60 k 1 M 2 GSa/s 120 k 2 M
20 ns 1 GSa/s 60 k 1 M 2 GSa/s 120 k 2 M
10 ns 1 GSa/s 60 k 1 M 2 GSa/s 120 k 2 M
5 ns 1 GSa/s 60 k 1 M 2 GSa/s 120 k 2 M
Time/div Non-interleave Interleave
Sampling rate Recording length (points) Sampling rate Recording length (points)
U1610A U1620A U1610A U1620A
U1610/20A User’s Guide 37
3 Using the Oscilloscope
Trigger Controls
Press to access the trigger function which determines when the oscilloscope starts to acquire data and display a waveform. A triggered waveform is one in which the oscilloscope begins tracing the waveform, from the left side of the display to the right, each time a particular trigger condition is met.
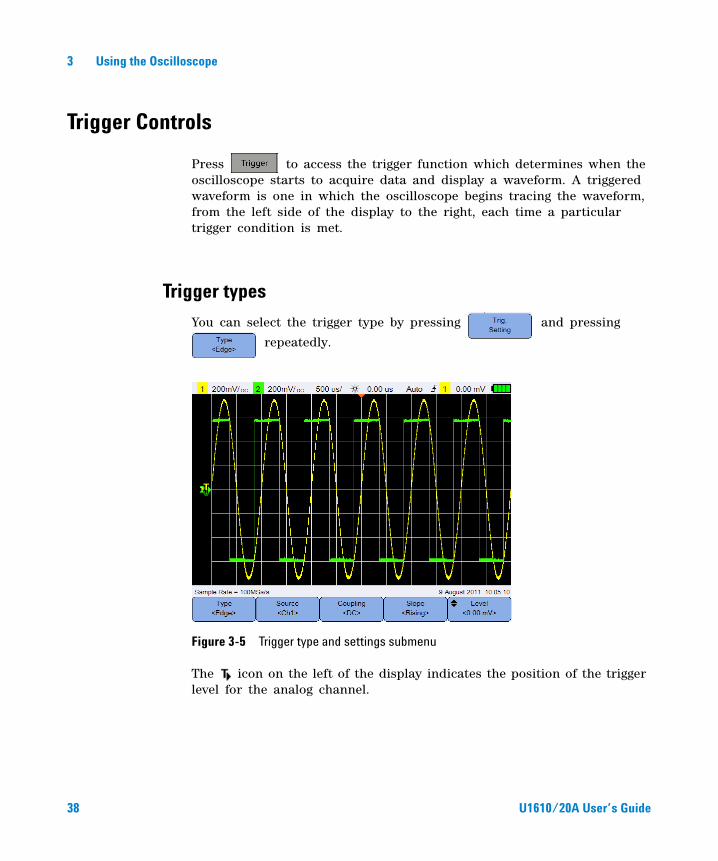
Trigger types
You can select the trigger type by pressing and pressing
repeatedly.
Figure 3-5 Trigger type and settings submenu
The icon on the left of the display indicates the position of the trigger level for the analog channel.
38 U1610/20A User’s Guide
Using the Oscilloscope 3
Edge trigger
The Edge trigger identifies a trigger by looking for a specified edge (slope) and voltage level on a waveform.
Source
Press repeatedly to select the trigger source.
Coupling
Press repeatedly to select either:
• DC coupling – allows DC and AC signals into the trigger path.
• AC coupling – removes any DC offset voltage from the trigger waveform.
• LF (low frequency) reject coupling – removes any unwanted low- frequency components from the trigger waveform.
• HF (high frequency) reject coupling – removes high- frequency components from the trigger waveform.
Slope
Press repeatedly to select the Rising ( ) edge, Falling ( ) edge, Alternate ( ) edges, or Either ( ) edge.
All modes operate up to the oscilloscope bandwidth except the Either edge mode, which has a limitation. The Either edge mode will trigger on constant wave signals up to 100 MHz, but can trigger on isolated pulses down to 1/(2 × oscilloscope bandwidth).
Level
Press and use the or key to set the trigger level.
U1610/20A User’s Guide 39
3 Using the Oscilloscope
Glitch trigger
A glitch is a rapid change in the waveform that is usually narrow as compared to the waveform. The Peak Detect mode can be used to more easily view glitches or narrow pulses.
Source
See “Source” on page 39.
Polarity
Toggle to select the positive ( ) polarity or negative ( ) polarity for the glitch you want to capture.
Level
See “Level” on page 39.
Qualifier
The time qualifier sets the oscilloscope to trigger on a channel pattern whose time duration is:
• less than a time value (<)
• greater than a time value (>)
• within a range of time values (><)
• outside a range of time values (<>)
To select the qualifier:
1 Press to access more trigger parameters.
2 Press repeatedly.
Minimum and Maximum values
Press > / and use the or key to set the minimum or maximum time value respectively for the selected qualifier.
40 U1610/20A User’s Guide
Using the Oscilloscope 3
Coupling
See “Coupling” on page 39.
TV trigger
TV triggering can be used to capture the complicated waveforms of most standard and high- definition analog video signals.
Source
See “Source” on page 39.
Standard
Press repeatedly to select the NTSC, SECAM, PAL, PAL- M, HDTV 720p, HDTV 1080p, or HDTV 1080i standard.
NTSC, SECAM, PAL, and PAL- M are broadcast standards used throughout the world. HDTV is a high- definition TV standard.
Mode
Press repeatedly to select the portion of the video signal to trigger on:
• All Field – triggers on the rising edge of the first pulse in the vertical sync interval.
• All Line – triggers on all horizontal sync pulses.
• Line – triggers on the selected line # (HDTV standard only).
• Odd – triggers on the rising edge of the first serration pulse of the odd field.
• Even – triggers on the rising edge of the first serration pulse of the even field.
• Line:Odd – triggers on the selected line # in the odd field.
• Line:Even – triggers on the selected line # in the even field.
Not all of the above modes are available for all standards. The mode selection changes according to the standard you select.
U1610/20A User’s Guide 41
3 Using the Oscilloscope
Custom Line
Press and use the or key to select the line number on which you want to trigger. This is only applicable for the Line trigger mode.
Nth Edge trigger
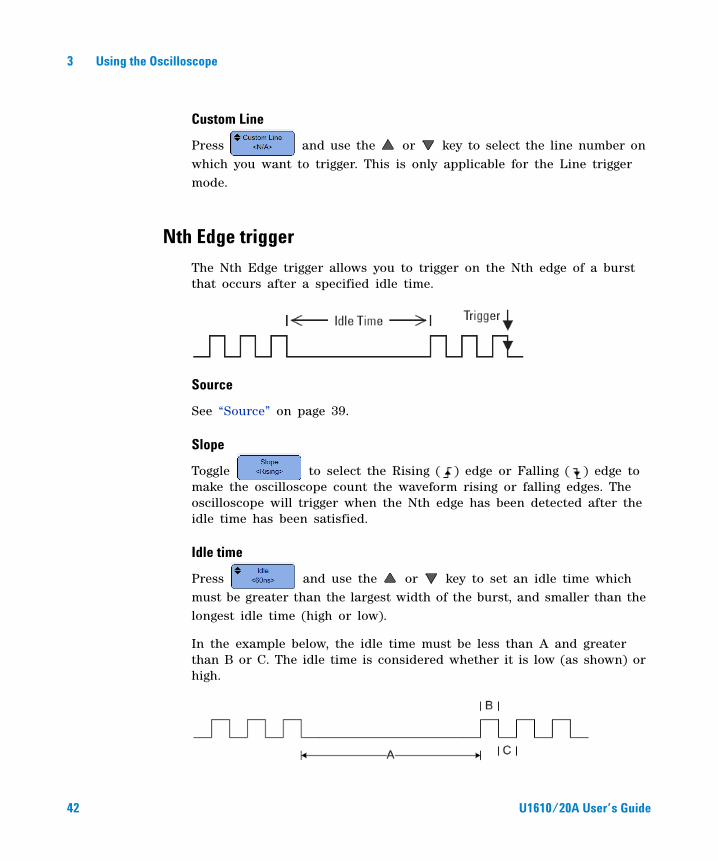
The Nth Edge trigger allows you to trigger on the Nth edge of a burst that occurs after a specified idle time.
Source
See “Source” on page 39.
Slope
Toggle to select the Rising ( ) edge or Falling ( ) edge to make the oscilloscope count the waveform rising or falling edges. The oscilloscope will trigger when the Nth edge has been detected after the idle time has been satisfied.
Idle time
Press and use the or key to set an idle time which must be greater than the largest width of the burst, and smaller than the longest idle time (high or low).
In the example below, the idle time must be less than A and greater than B or C. The idle time is considered whether it is low (as shown) or high.
42 U1610/20A User’s Guide
Using the Oscilloscope 3
Edge
Press > and use the or key to set the edge count from 1 to 65535.
Level
See “Level” on page 39.
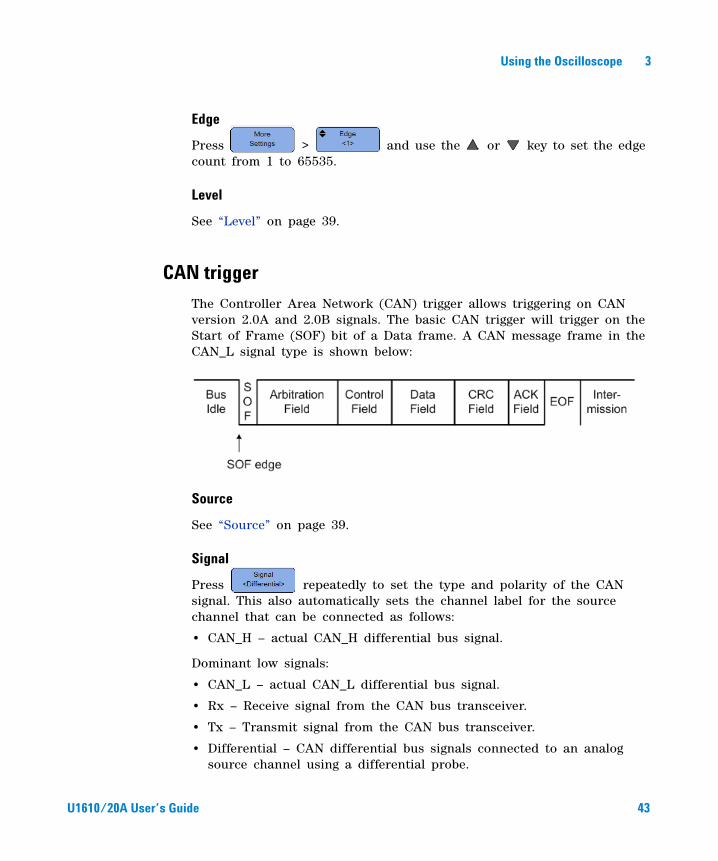
CAN trigger
The Controller Area Network (CAN) trigger allows triggering on CAN version 2.0A and 2.0B signals. The basic CAN trigger will trigger on the Start of Frame (SOF) bit of a Data frame. A CAN message frame in the CAN_L signal type is shown below:
Source
See “Source” on page 39.
Signal
Press repeatedly to set the type and polarity of the CAN signal. This also automatically sets the channel label for the source channel that can be connected as follows:
• CAN_H – actual CAN_H differential bus signal.
Dominant low signals:
• CAN_L – actual CAN_L differential bus signal.
• Rx – Receive signal from the CAN bus transceiver.
• Tx – Transmit signal from the CAN bus transceiver.
• Differential – CAN differential bus signals connected to an analog source channel using a differential probe.
U1610/20A User’s Guide 43
3 Using the Oscilloscope
Level
See “Level” on page 39.
Baud rate
Press and press repeatedly to set the baud rate to match the bus signal.
If the selected baud rate does not match the system baud rate, false triggers may occur.
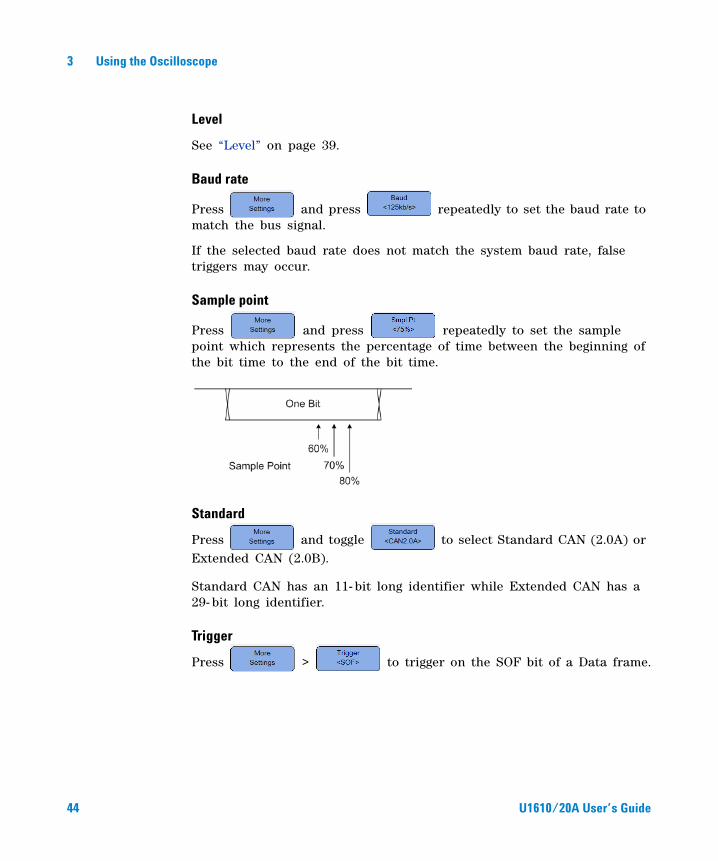
Sample point
Press and press repeatedly to set the sample point which represents the percentage of time between the beginning of the bit time to the end of the bit time.
Standard
Press and toggle to select Standard CAN (2.0A) or Extended CAN (2.0B).
Standard CAN has an 11- bit long identifier while Extended CAN has a 29- bit long identifier.
Trigger
Press > to trigger on the SOF bit of a Data frame.
44 U1610/20A User’s Guide
Using the Oscilloscope 3
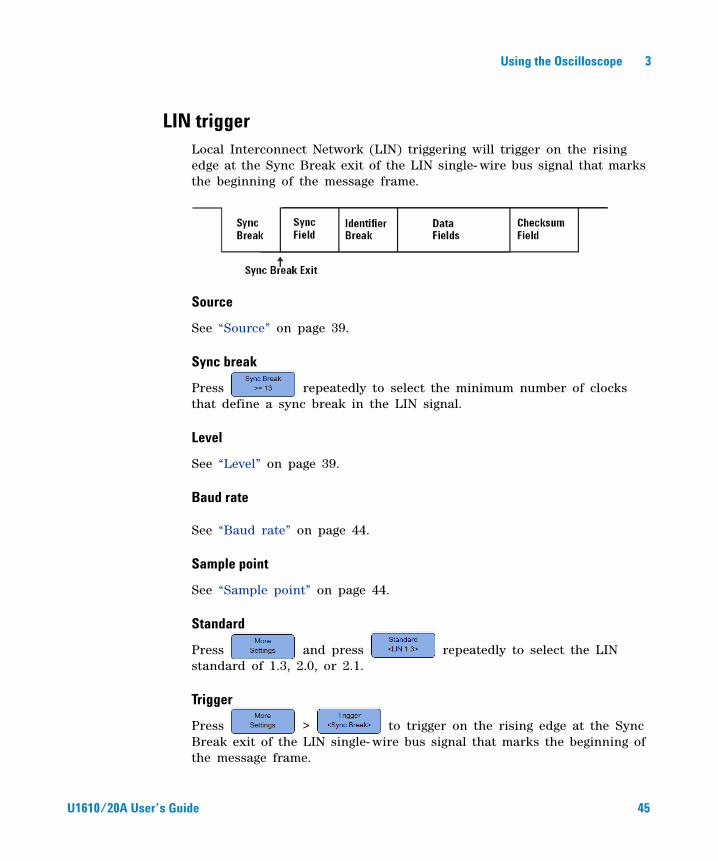
LIN triggerLocal Interconnect Network (LIN) triggering will trigger on the rising edge at the Sync Break exit of the LIN single- wire bus signal that marks the beginning of the message frame.
Source
See “Source” on page 39.
Sync break
Press repeatedly to select the minimum number of clocks that define a sync break in the LIN signal.
Level
See “Level” on page 39.
Baud rate
See “Baud rate” on page 44.
Sample point
See “Sample point” on page 44.
Standard
Press and press repeatedly to select the LIN standard of 1.3, 2.0, or 2.1.
Trigger
Press > to trigger on the rising edge at the Sync Break exit of the LIN single- wire bus signal that marks the beginning of the message frame.
U1610/20A User’s Guide 45
3 Using the Oscilloscope
Trigger modes
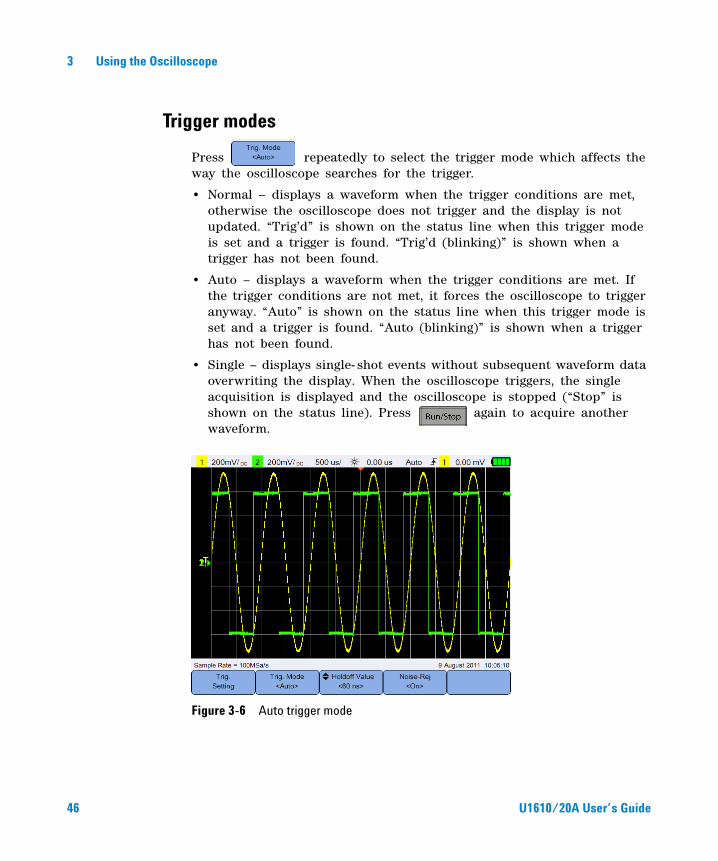
Press repeatedly to select the trigger mode which affects the way the oscilloscope searches for the trigger.
• Normal – displays a waveform when the trigger conditions are met, otherwise the oscilloscope does not trigger and the display is not updated. “Trig’d” is shown on the status line when this trigger mode is set and a trigger is found. “Trig’d (blinking)” is shown when a trigger has not been found.
• Auto – displays a waveform when the trigger conditions are met. If the trigger conditions are not met, it forces the oscilloscope to trigger anyway. “Auto” is shown on the status line when this trigger mode is set and a trigger is found. “Auto (blinking)” is shown when a trigger has not been found.
• Single – displays single- shot events without subsequent waveform data overwriting the display. When the oscilloscope triggers, the single acquisition is displayed and the oscilloscope is stopped (“Stop” is shown on the status line). Press again to acquire another waveform.
Figure 3-6 Auto trigger mode
46 U1610/20A User’s Guide
Using the Oscilloscope 3
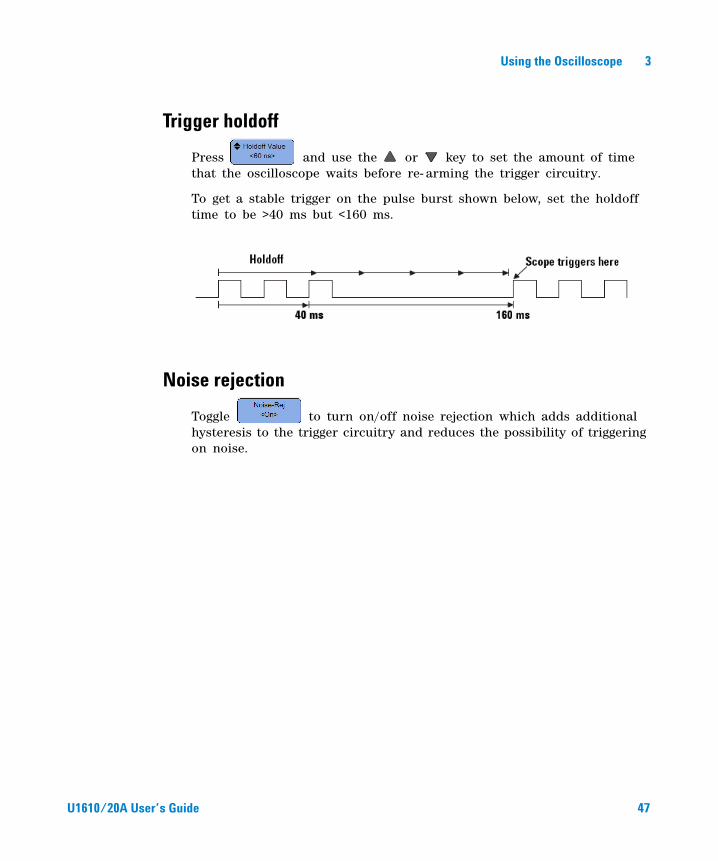
Trigger holdoff
Press and use the or key to set the amount of time that the oscilloscope waits before re- arming the trigger circuitry.
To get a stable trigger on the pulse burst shown below, set the holdoff time to be >40 ms but <160 ms.
Noise rejection
Toggle to turn on/off noise rejection which adds additional hysteresis to the trigger circuitry and reduces the possibility of triggering on noise.
U1610/20A User’s Guide 47
3 Using the Oscilloscope
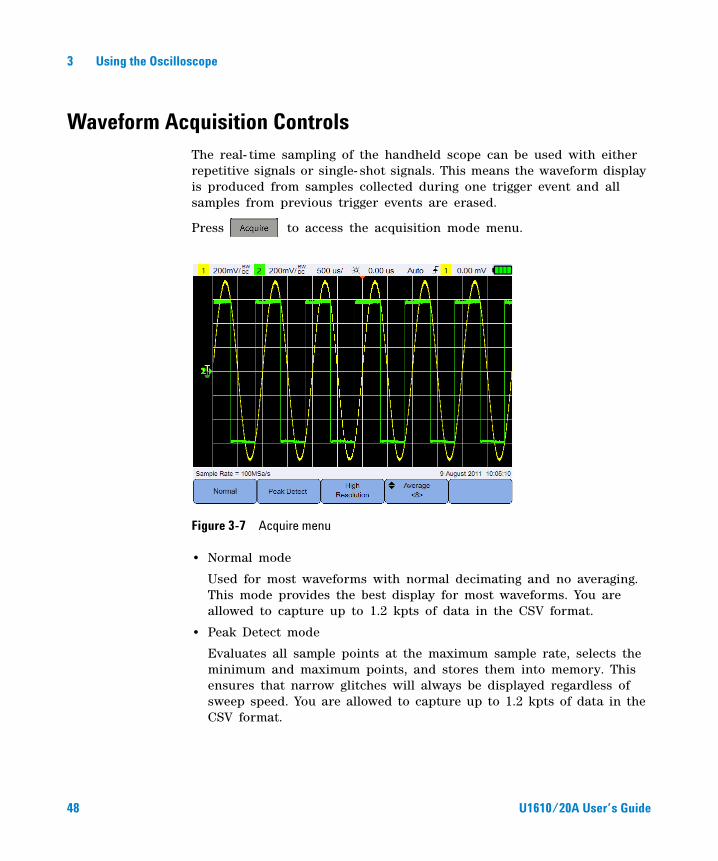
Waveform Acquisition ControlsThe real- time sampling of the handheld scope can be used with either repetitive signals or single- shot signals. This means the waveform display is produced from samples collected during one trigger event and all samples from previous trigger events are erased.
Press to access the acquisition mode menu.
Figure 3-7 Acquire menu
• Normal mode
Used for most waveforms with normal decimating and no averaging. This mode provides the best display for most waveforms. You are allowed to capture up to 1.2 kpts of data in the CSV format.
• Peak Detect mode
Evaluates all sample points at the maximum sample rate, selects the minimum and maximum points, and stores them into memory. This ensures that narrow glitches will always be displayed regardless of sweep speed. You are allowed to capture up to 1.2 kpts of data in the CSV format.
48 U1610/20A User’s Guide

Using the Oscilloscope 3
• High Resolution mode
Averages extra samples at slower sweep speeds to reduce random noise, produce a smoother trace, and effectively increase vertical resolution. You are allowed to capture up to 12 kpts of data in the CSV format.
• Average mode
Averages multiple acquisitions to reduce random noise and increase vertical resolution. The average numbers can be set from 2 to 8192 in powers- of- 2 increments using the or key. You are allowed to capture up to 1.2 kpts of data in the CSV format.
U1610/20A User’s Guide 49

3 Using the Oscilloscope
Display Controls
Press to access the display control menu.
Figure 3-8 Display control menu
Vectors display
Toggle to enable the vectors mode which draws a line between consecutive waveform data points. This mode produces the most insightful waveforms for most situations.
Sin x/x interpolation
Toggle to enable sin x/x interpolation which reproduces the exact waveform as displayed on the oscilloscope. You can use this process to reaffirm the behavior of a signal between samples.
50 U1610/20A User’s Guide
Using the Oscilloscope 3
Infinite persistence
Toggle to enable infinite persistence which updates the display with new acquisitions, but does not erase the results of previous acquisitions. This can be used to measure noise and jitter, observe the worst case of a varying waveform, look for timing violations, and capture events that occur irregularly.
To erase previous acquisitions, press . The display will start to
accumulate acquisitions again if the oscilloscope is running. Turn off
, then press to return to the normal display mode.
U1610/20A User’s Guide 51
3 Using the Oscilloscope
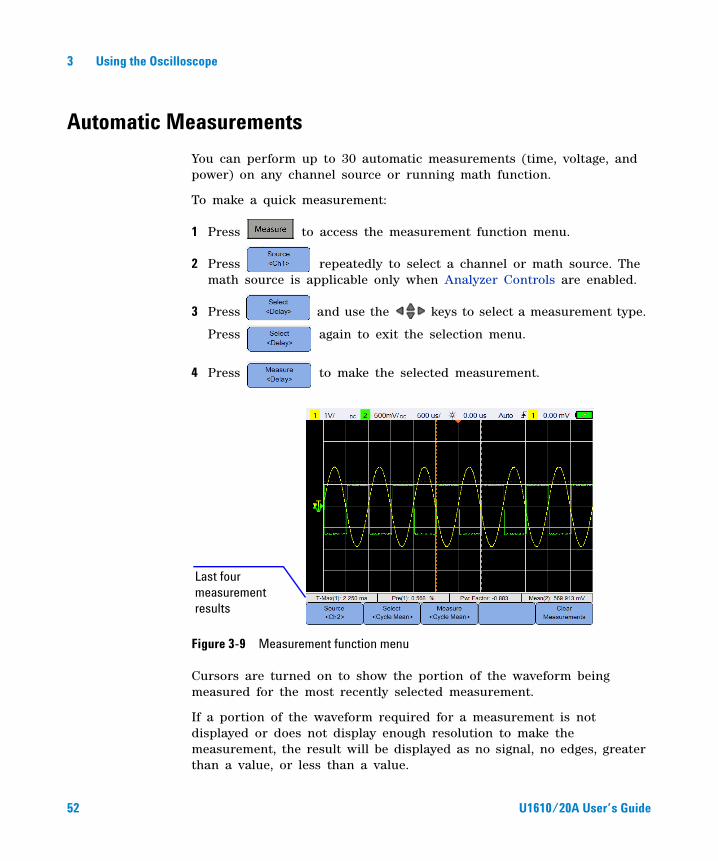
Automatic Measurements
You can perform up to 30 automatic measurements (time, voltage, and power) on any channel source or running math function.
To make a quick measurement:
1 Press to access the measurement function menu.
2 Press repeatedly to select a channel or math source. The math source is applicable only when Analyzer Controls are enabled.
3 Press and use the keys to select a measurement type.
Press again to exit the selection menu.
4 Press to make the selected measurement.
Figure 3-9 Measurement function menu
Cursors are turned on to show the portion of the waveform being measured for the most recently selected measurement.
If a portion of the waveform required for a measurement is not displayed or does not display enough resolution to make the measurement, the result will be displayed as no signal, no edges, greater than a value, or less than a value.
Last four measurement results
52 U1610/20A User’s Guide
Using the Oscilloscope 3
If you select the delay or phase shift measurement, press to
select the source channels or running math functions. Press
and repeatedly to select the first and second sources
respectively.
If you select any power measurement, press to set the
channel input and probe attenuation factor or sensitivity. Toggle
to assign channel 1 or 2 as the voltage input or current
input. Press or repeatedly to set the attenuation
factor or sensitivity for the connected voltage or current probe
respectively. Changing the attenuation or sensitivity will also change the
vertical scale of the assigned channel.
To clear all measurements, press .
Time measurements
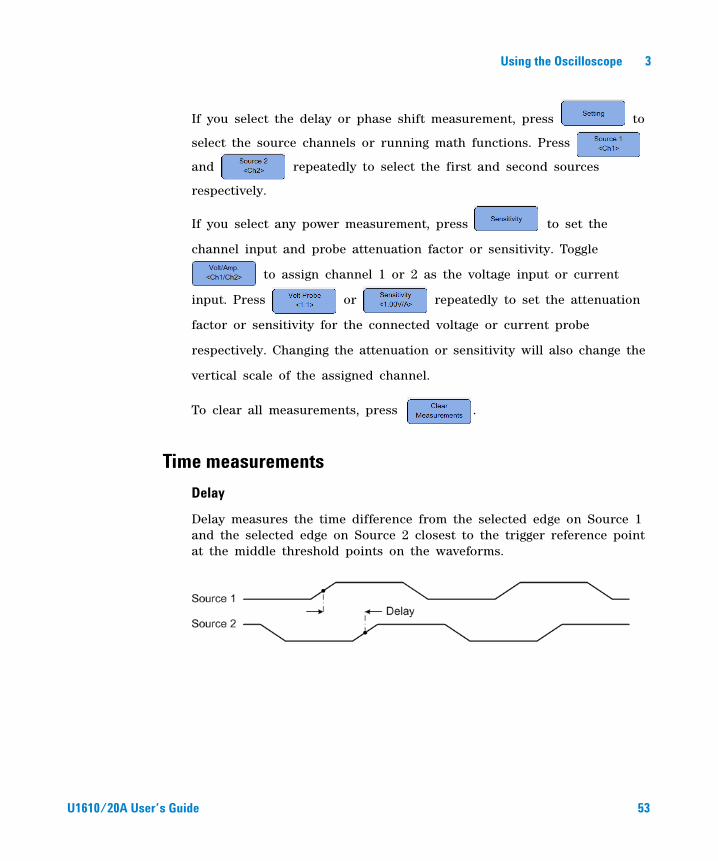
Delay
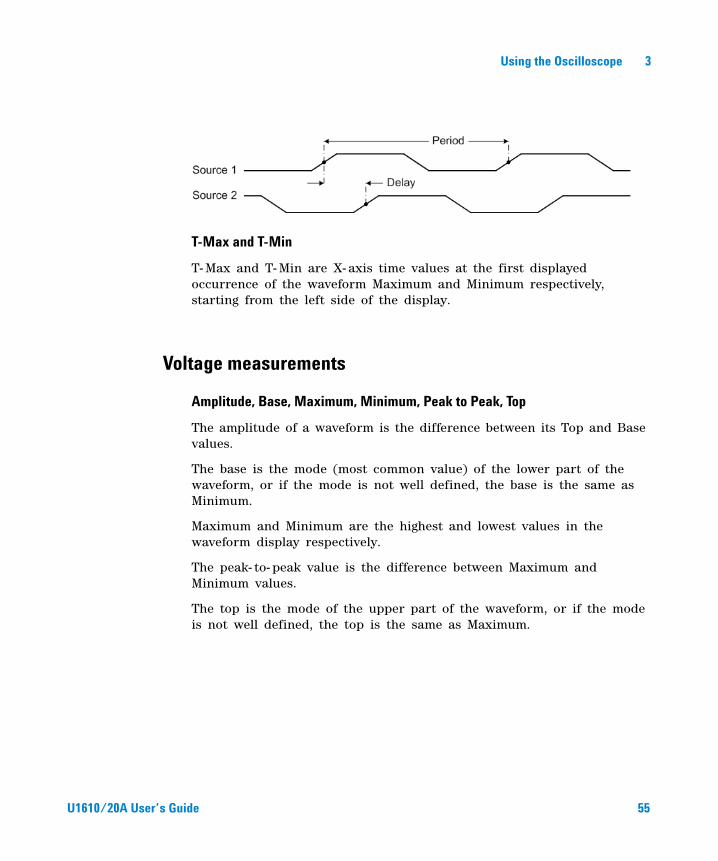
Delay measures the time difference from the selected edge on Source 1 and the selected edge on Source 2 closest to the trigger reference point at the middle threshold points on the waveforms.
U1610/20A User’s Guide 53

3 Using the Oscilloscope
Duty Cycle (–), Duty Cycle (+), Fall Time, Rise Time, Frequency, Period, Width (–), Width (+)
The duty cycle (–) and (+) of a repetitive pulse train are expressed as follows:
The fall time is the time difference between the crossing of the upper threshold and the crossing of the lower threshold for a negative- going edge.
The rise time is the time difference between the crossing of the lower threshold and the crossing of the upper threshold for a positive- going edge.
Frequency is defined as 1/Period.
Period is the time period of the complete waveform cycle.
Width (–) is the time from the middle threshold of the falling edge to the middle threshold of the next rising edge.
Width (+) is the time from the middle threshold of the rising edge to the middle threshold of the next falling edge.
Phase Shift
Phase shift is expressed as follows:
54 U1610/20A User’s Guide
Using the Oscilloscope 3
T-Max and T-Min
T- Max and T- Min are X- axis time values at the first displayed occurrence of the waveform Maximum and Minimum respectively, starting from the left side of the display.
Voltage measurements
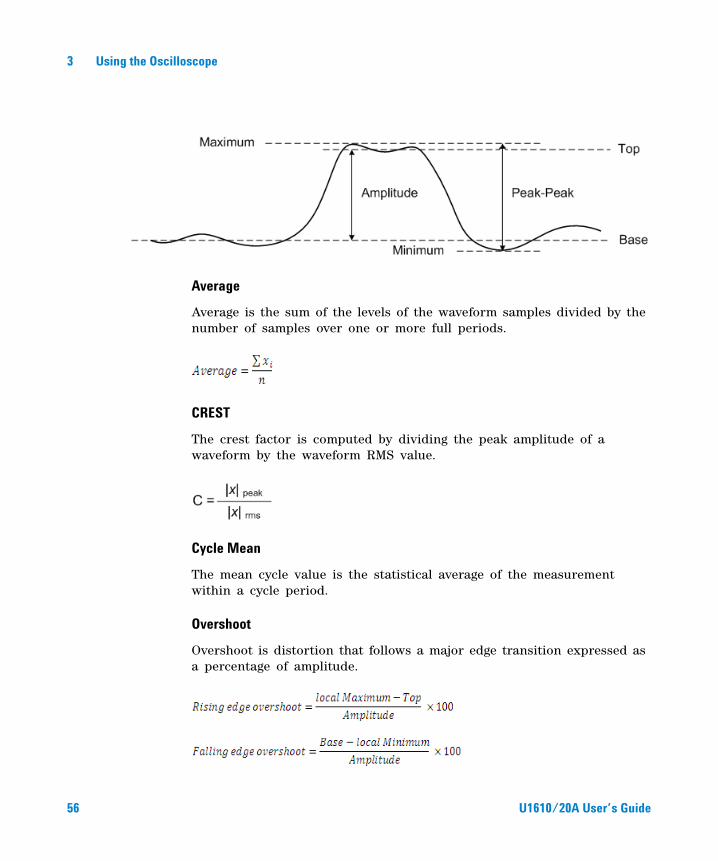
Amplitude, Base, Maximum, Minimum, Peak to Peak, Top
The amplitude of a waveform is the difference between its Top and Base values.
The base is the mode (most common value) of the lower part of the waveform, or if the mode is not well defined, the base is the same as Minimum.
Maximum and Minimum are the highest and lowest values in the waveform display respectively.
The peak- to- peak value is the difference between Maximum and Minimum values.
The top is the mode of the upper part of the waveform, or if the mode is not well defined, the top is the same as Maximum.
U1610/20A User’s Guide 55
3 Using the Oscilloscope
Average
Average is the sum of the levels of the waveform samples divided by the number of samples over one or more full periods.
CREST
The crest factor is computed by dividing the peak amplitude of a waveform by the waveform RMS value.
Cycle Mean
The mean cycle value is the statistical average of the measurement within a cycle period.
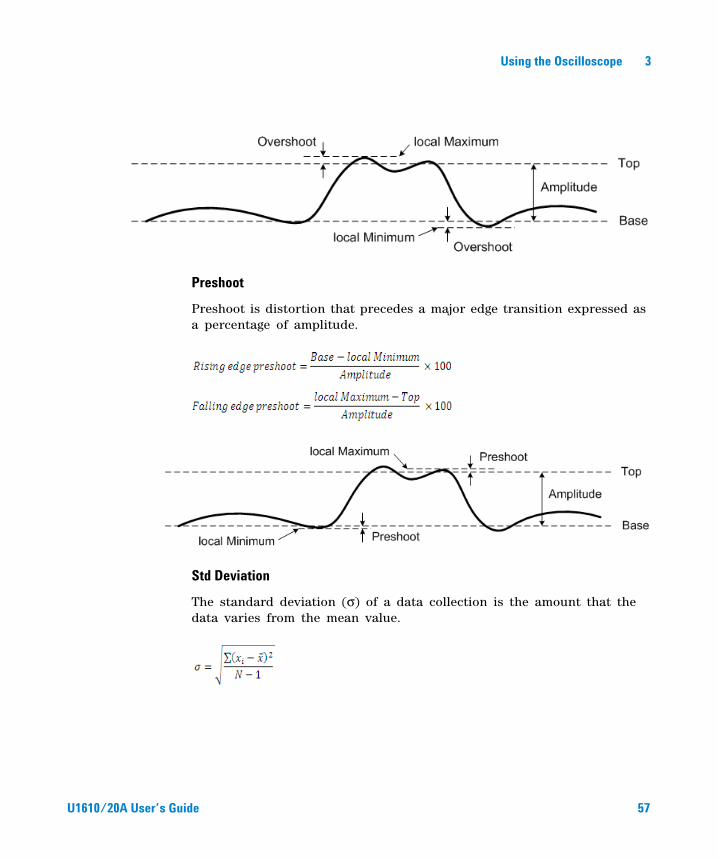
Overshoot
Overshoot is distortion that follows a major edge transition expressed as a percentage of amplitude.
56 U1610/20A User’s Guide
Using the Oscilloscope 3
Preshoot
Preshoot is distortion that precedes a major edge transition expressed as a percentage of amplitude.
Std Deviation
The standard deviation (σ) of a data collection is the amount that the data varies from the mean value.
U1610/20A User’s Guide 57
3 Using the Oscilloscope
RMS (AC)
AC voltage is normally expressed as a root- mean- square (RMS) value, represented as Vrms. For a sinusoidal voltage, Vrms is equivalent to Vpeak/√2.
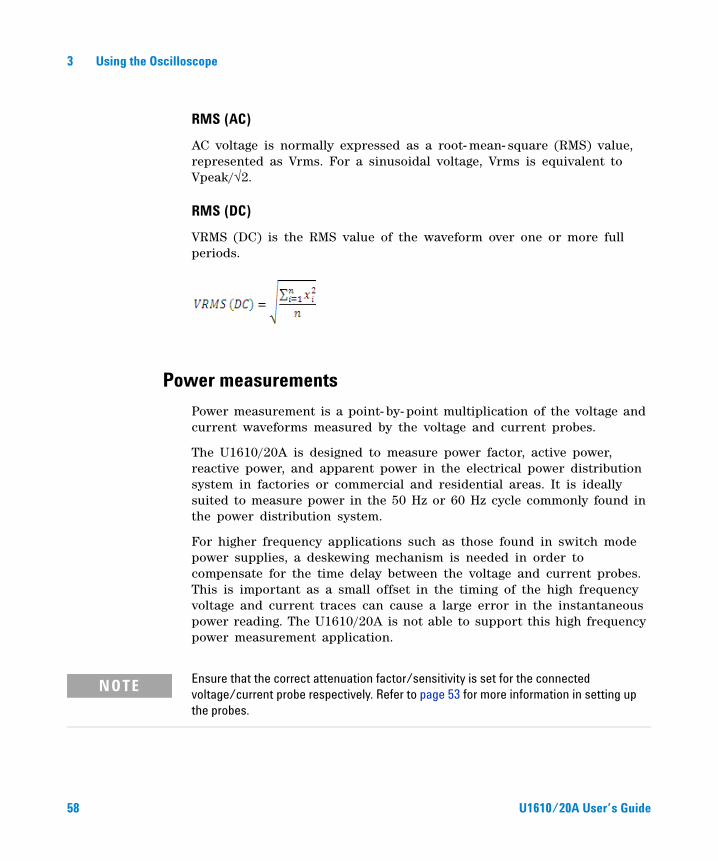
RMS (DC)
VRMS (DC) is the RMS value of the waveform over one or more full periods.
Power measurements
Power measurement is a point- by- point multiplication of the voltage and current waveforms measured by the voltage and current probes.
The U1610/20A is designed to measure power factor, active power, reactive power, and apparent power in the electrical power distribution system in factories or commercial and residential areas. It is ideally suited to measure power in the 50 Hz or 60 Hz cycle commonly found in the power distribution system.
For higher frequency applications such as those found in switch mode power supplies, a deskewing mechanism is needed in order to compensate for the time delay between the voltage and current probes. This is important as a small offset in the timing of the high frequency voltage and current traces can cause a large error in the instantaneous power reading. The U1610/20A is not able to support this high frequency power measurement application.
NOTE Ensure that the correct attenuation factor/sensitivity is set for the connected voltage/current probe respectively. Refer to page 53 for more information in setting up the probes.
58 U1610/20A User’s Guide
Using the Oscilloscope 3
Active Pwr
Active power (real or true power) is measured in watts (W) by averaging a portion of power over a complete cycle of the AC waveform which produces a nett transfer of energy in one direction. It is the power drawn by the electrical resistance of a system.
Apparent Pwr
Apparent power is measured in volt- amperes (VA) and by the vector sum of the active and reactive power. It is the voltage on an AC system multiplied by all the current that flows in it.
Reactive Pwr
Reactive power is measured in volt- amperes reactive (VAR) and is the portion of power stored and discharged by inductive motors, transformers, and solenoids.
Pwr Factor
Power factor is a measurement of how effectively the electrical power is being used. A high power factor (near 1.0), indicates the efficient utilization of the electrical power, while a low power factor indicates the poor utilization of the electrical power. If the power factor falls below 0.90, some utility companies charge a power factor penalty. Power factor is the ratio of real power (watts) and the apparent power (volt- amperes). It is calculated by dividing the real power with the apparent power.
NOTE Agilent recommends the U1583B AC current clamp for the power measurement.
U1610/20A User’s Guide 59
3 Using the Oscilloscope
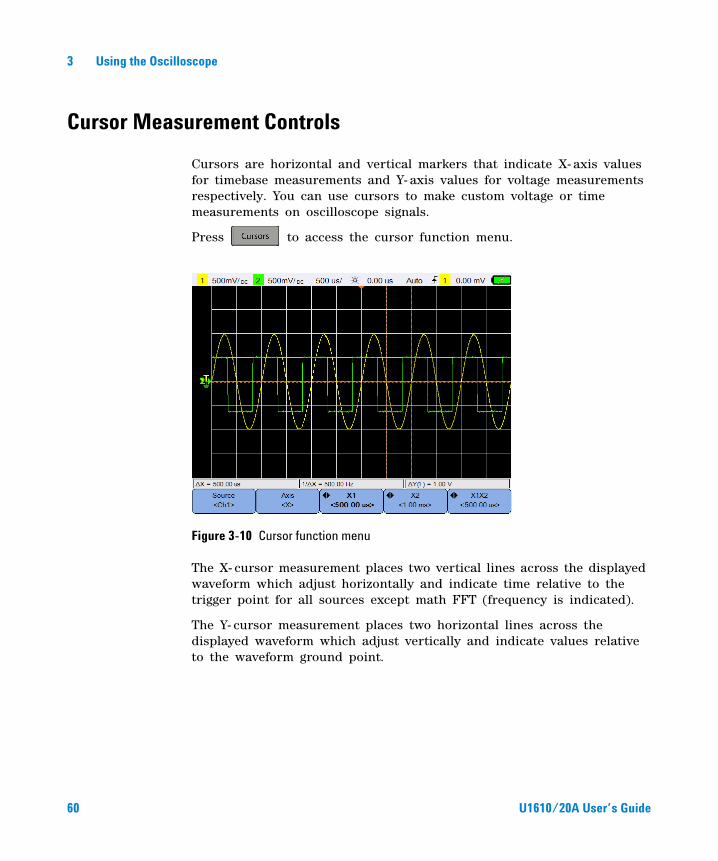
Cursor Measurement Controls
Cursors are horizontal and vertical markers that indicate X- axis values for timebase measurements and Y- axis values for voltage measurements respectively. You can use cursors to make custom voltage or time measurements on oscilloscope signals.
Press to access the cursor function menu.
Figure 3-10 Cursor function menu
The X- cursor measurement places two vertical lines across the displayed waveform which adjust horizontally and indicate time relative to the trigger point for all sources except math FFT (frequency is indicated).
The Y- cursor measurement places two horizontal lines across the displayed waveform which adjust vertically and indicate values relative to the waveform ground point.
60 U1610/20A User’s Guide
Using the Oscilloscope 3
To set up the cursor measurement:
1 Press repeatedly to select a channel or analyzer source, or
to turn off the cursors. The analyzer source is applicable only when
Analyzer Controls are enabled.
2 Toggle to select the X or Y cursor.
3 Press or and use the or key to adjust the
X1 or X2 cursor respectively. The X1 cursor is displayed as a
short- dashed vertical line while the X2 cursor is displayed as a
long- dashed vertical line.
Press or and use the or key to adjust the
Y1 or Y2 cursor respectively. The Y1 cursor is displayed as a
short- dashed horizontal line while the Y2 cursor is displayed as a
long- dashed horizontal line.
4 Press and use the or key to adjust the X1 and X2
cursors together.
Press and use the or keys to adjust the Y1 and Y2
cursors together.
U1610/20A User’s Guide 61
3 Using the Oscilloscope
Analyzer Controls
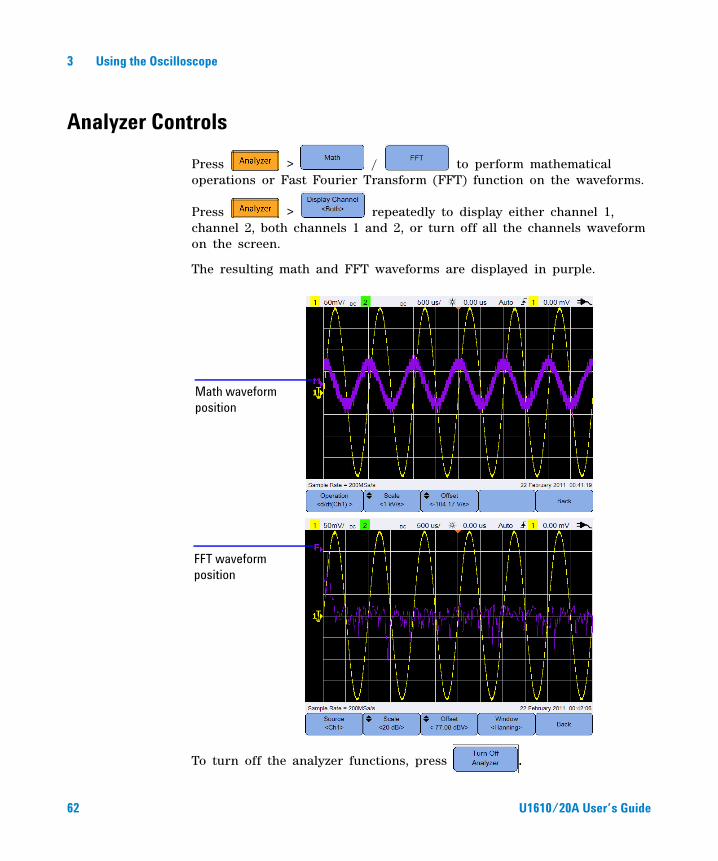
Press > / to perform mathematical operations or Fast Fourier Transform (FFT) function on the waveforms.
Press > repeatedly to display either channel 1, channel 2, both channels 1 and 2, or turn off all the channels waveform on the screen.
The resulting math and FFT waveforms are displayed in purple.
To turn off the analyzer functions, press .
Math waveform position
FFT waveform position
62 U1610/20A User’s Guide
Using the Oscilloscope 3
Math functions
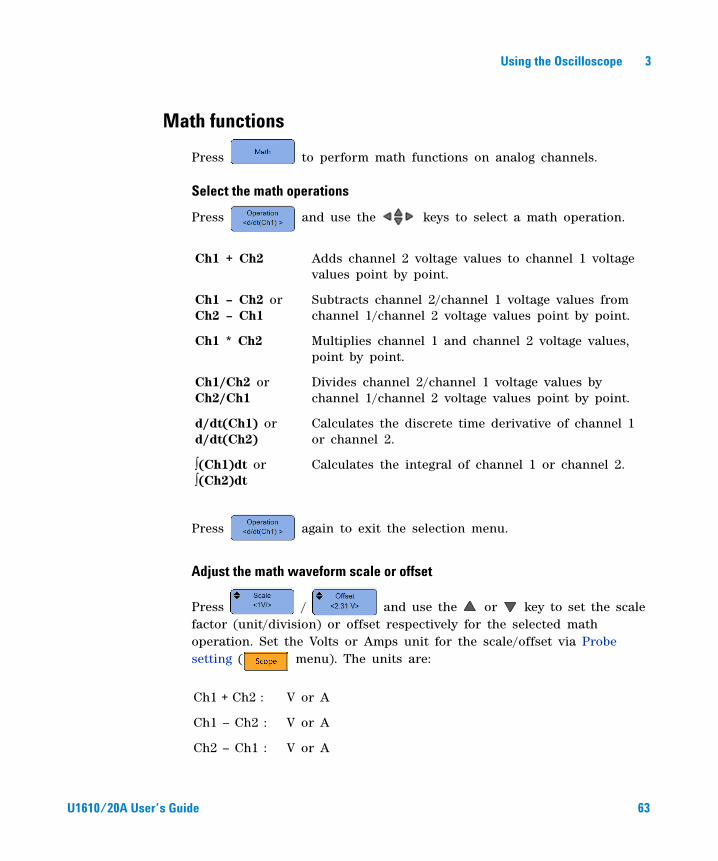
Press to perform math functions on analog channels.
Select the math operations
Press and use the keys to select a math operation.
Press again to exit the selection menu.
Adjust the math waveform scale or offset
Press / and use the or key to set the scale factor (unit/division) or offset respectively for the selected math operation. Set the Volts or Amps unit for the scale/offset via Probe setting ( menu). The units are:
Ch1 + Ch2 Adds channel 2 voltage values to channel 1 voltage values point by point.
Ch1 – Ch2 or Ch2 – Ch1
Subtracts channel 2/channel 1 voltage values from channel 1/channel 2 voltage values point by point.
Ch1 * Ch2 Multiplies channel 1 and channel 2 voltage values, point by point.
Ch1/Ch2 or Ch2/Ch1
Divides channel 2/channel 1 voltage values by channel 1/channel 2 voltage values point by point.
d/dt(Ch1) or d/dt(Ch2)
Calculates the discrete time derivative of channel 1 or channel 2.
∫(Ch1)dt or ∫(Ch2)dt
Calculates the integral of channel 1 or channel 2.
Ch1 + Ch2 : V or A
Ch1 – Ch2 : V or A
Ch2 – Ch1 : V or A
U1610/20A User’s Guide 63
3 Using the Oscilloscope
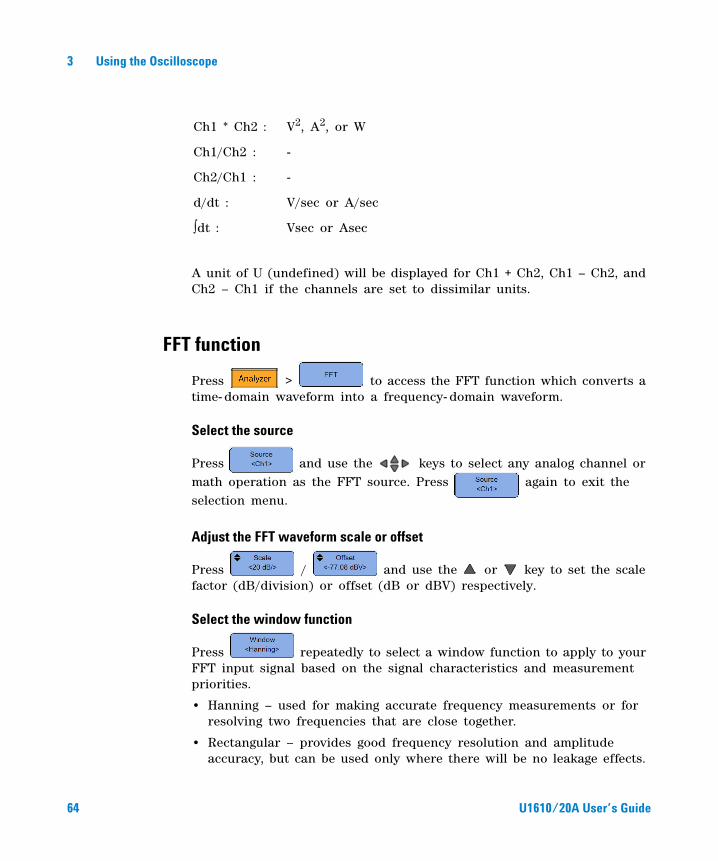
A unit of U (undefined) will be displayed for Ch1 + Ch2, Ch1 – Ch2, and Ch2 – Ch1 if the channels are set to dissimilar units.
FFT function
Press > to access the FFT function which converts a time- domain waveform into a frequency- domain waveform.
Select the source
Press and use the keys to select any analog channel or math operation as the FFT source. Press again to exit the selection menu.
Adjust the FFT waveform scale or offset
Press / and use the or key to set the scale factor (dB/division) or offset (dB or dBV) respectively.
Select the window function
Press repeatedly to select a window function to apply to your FFT input signal based on the signal characteristics and measurement priorities.
• Hanning – used for making accurate frequency measurements or for resolving two frequencies that are close together.
• Rectangular – provides good frequency resolution and amplitude accuracy, but can be used only where there will be no leakage effects.
Ch1 * Ch2 : V2, A2, or W
Ch1/Ch2 : -
Ch2/Ch1 : -
d/dt : V/sec or A/sec
∫dt : Vsec or Asec
64 U1610/20A User’s Guide
Using the Oscilloscope 3
• Hamming – provides better frequency resolution but less amplitude accuracy compared to the Rectangular window. The Hamming window has a slightly better frequency resolution than the Hanning window.
• B. Harris – reduces time resolution compared to the Rectangular window, but improves the capacity to detect smaller impulses due to lower secondary lobes.
• Flattop – used for making accurate amplitude measurements of frequency peaks.
U1610/20A User’s Guide 65
3 Using the Oscilloscope
Autoscale and Run/Stop Controls
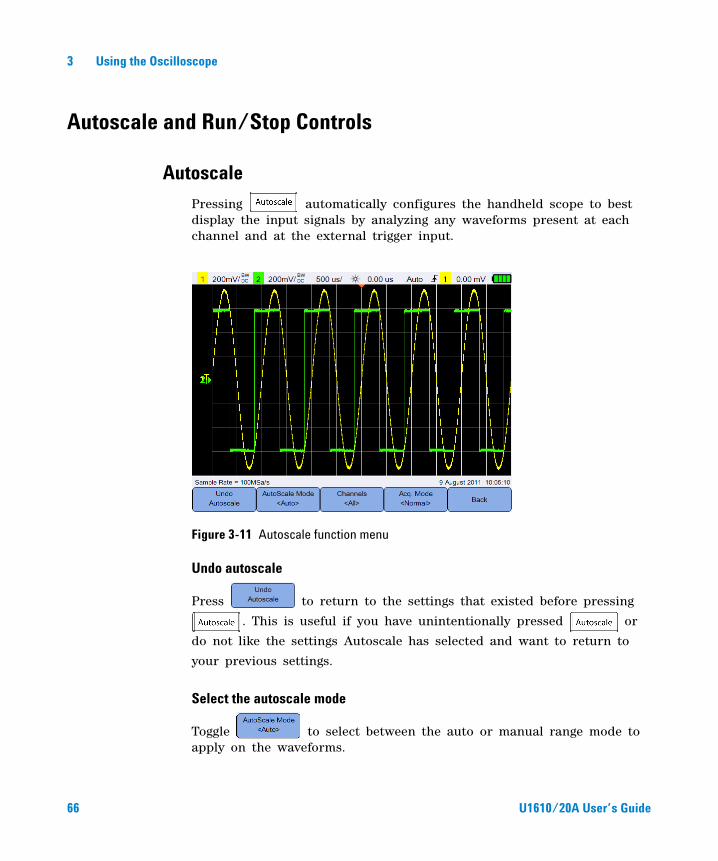
Autoscale
Pressing automatically configures the handheld scope to best display the input signals by analyzing any waveforms present at each channel and at the external trigger input.
Figure 3-11 Autoscale function menu
Undo autoscale
Press to return to the settings that existed before pressing
. This is useful if you have unintentionally pressed or
do not like the settings Autoscale has selected and want to return to
your previous settings.
Select the autoscale mode
Toggle to select between the auto or manual range mode to apply on the waveforms.
66 U1610/20A User’s Guide
Using the Oscilloscope 3
Specify the channels displayed after autoscale
Toggle to set which channels will be displayed on subsequent autoscales.
• All
The next time you press , all channels that meet the autoscale requirements will be displayed.
• Displayed Ch.
The next time you press , only the channels that are turned on will be examined for signal activity.
Preserve the acquisition mode during autoscale
Toggle to choose whether to allow the acquisition mode to be switched to Normal or left unchanged when autoscale is performed.
• Normal
The handheld scope will switch to the Normal acquisition mode whenever is pressed.
• Preserve
The handheld scope will remain in the acquisition mode you have chosen when is pressed.
Return to the previous menu
Press to return to the previous menu.
Run/Stop
Press to toggle between continuous running mode or stopped mode.
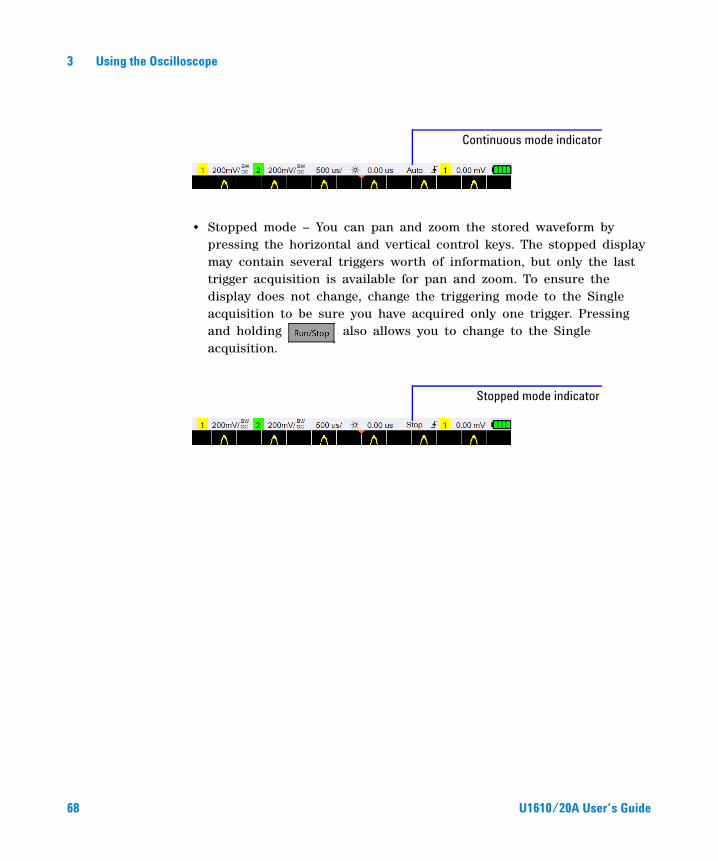
• Continuous mode – You are viewing multiple acquisitions of the same signal similar to the way an analog oscilloscope displays waveforms. “Trig'd” is indicated on the status line if the triggering mode is set to the Normal or Single acquisition.
U1610/20A User’s Guide 67
3 Using the Oscilloscope
• Stopped mode – You can pan and zoom the stored waveform by pressing the horizontal and vertical control keys. The stopped display may contain several triggers worth of information, but only the last trigger acquisition is available for pan and zoom. To ensure the display does not change, change the triggering mode to the Single acquisition to be sure you have acquired only one trigger. Pressing and holding also allows you to change to the Single acquisition.
Continuous mode indicator
Stopped mode indicator
68 U1610/20A User’s Guide
Using the Oscilloscope 3
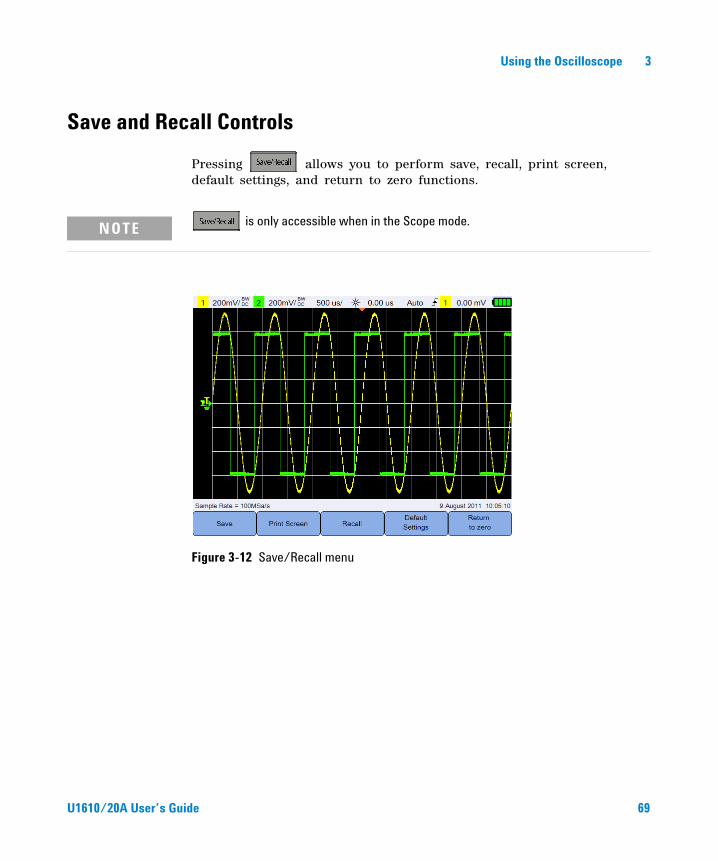
Save and Recall Controls
Pressing allows you to perform save, recall, print screen, default settings, and return to zero functions.
Figure 3-12 Save/Recall menu
NOTE is only accessible when in the Scope mode.
U1610/20A User’s Guide 69

3 Using the Oscilloscope
Save control
Press to access the save functions.
Figure 3-13 Save submenu
Select the save file format
Press repeatedly to select the file format to save. The waveform trace and setup is saved to the handheld scope internal memory, while the rest of the formats are saved to a connected USB storage device.
• Trace & Setup – save the waveform image and setup file.
• csv data – save the data points in the CSV format.
• bmp (8- bit) – save the waveform image in the BMP (8- bit) format.
• bmp (24- bit) – save the waveform image in the BMP (24- bit) format.
• png (24- bit) – save the waveform image in the PNG (24- bit) format.
• RAW – save the waveform image in the raw format.
Select the save location
Press and use the keys to select any of the internal memory slots (for the trace and setup format) or any location in your connected USB storage device (for other file formats) to save to.
70 U1610/20A User’s Guide
Using the Oscilloscope 3
Press again to exit the selection menu.
For USB, you need to first ensure that your USB storage device is
connected to the handheld scope. Then, press > .
Press repeatedly to select <Host> for the handheld scope to
detect the USB device.
Invert image colors
Toggle to invert all colors on the screen image you want to save. This is only applicable for image formats.
Save the file
Press to save the selected file format into the selected memory location.
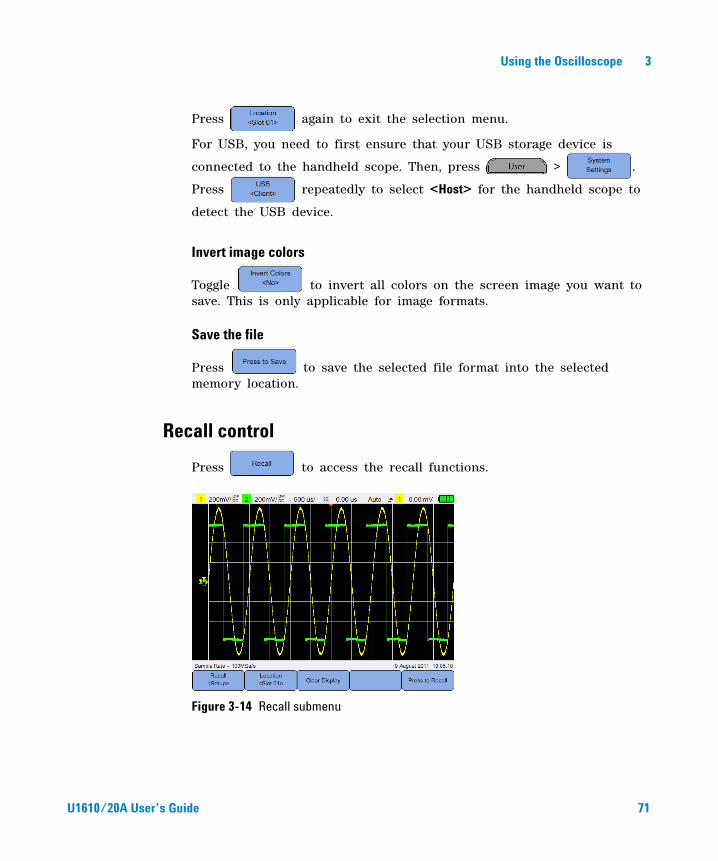
Recall control
Press to access the recall functions.
Figure 3-14 Recall submenu
U1610/20A User’s Guide 71
3 Using the Oscilloscope
Select the recall file format
Press repeatedly to select the waveform trace, setup, or both to recall from the internal memory.
Select the recall location
Press and use the keys to select an internal memory
location to recall a saved file. Press again to exit the
selection menu.
Clear the display
Press to clear the current displayed waveform from the screen. If the handheld scope is running, the display will begin to accumulate waveform data again.
Recall the file
Press to recall the saved file from the selected memory location.
Print screen control
Press to print a hardcopy of the current screen image via a supported USB printer connected to the handheld scope. You can also perform a quick print by pressing and holding .
72 U1610/20A User’s Guide
Using the Oscilloscope 3
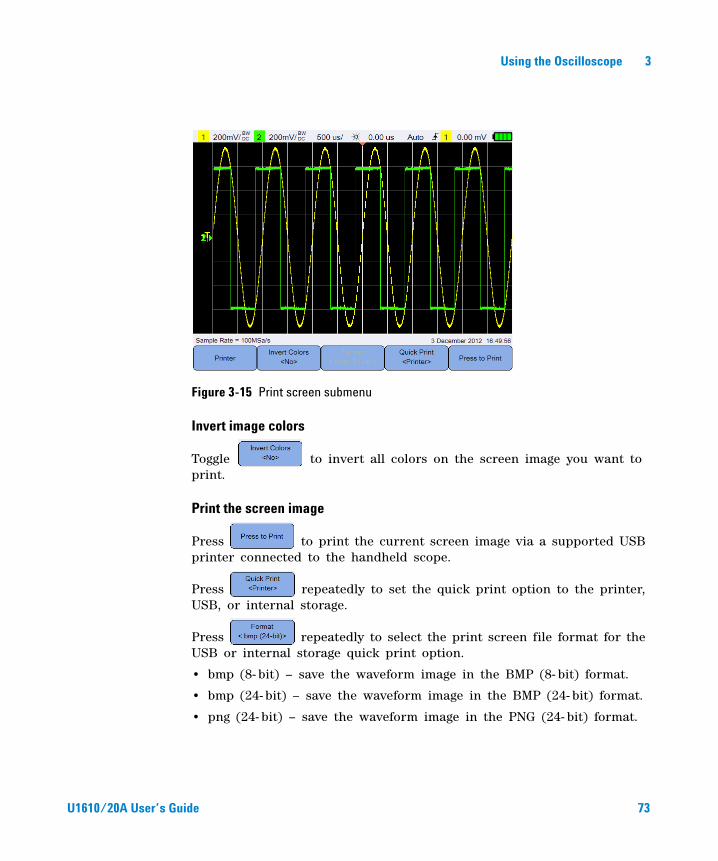
Figure 3-15 Print screen submenu
Invert image colors
Toggle to invert all colors on the screen image you want to print.
Print the screen image
Press to print the current screen image via a supported USB printer connected to the handheld scope.
Press repeatedly to set the quick print option to the printer, USB, or internal storage.
Press repeatedly to select the print screen file format for the USB or internal storage quick print option.
• bmp (8- bit) – save the waveform image in the BMP (8- bit) format.
• bmp (24- bit) – save the waveform image in the BMP (24- bit) format.
• png (24- bit) – save the waveform image in the PNG (24- bit) format.
U1610/20A User’s Guide 73

3 Using the Oscilloscope
THIS PAGE HAS BEEN INTENTIONALLY LEFT BLANK.
74 U1610/20A User’s Guide
Agilent U1610/20A Handheld Digital OscilloscopeUser’s Guide
4Using the Digital Multimeter
Introduction 76
Voltage Measurements 77
Resistance Measurement 78
Capacitance Measurement 79
Diode Test 80
Continuity Test 81
Temperature Measurement 82
Frequency Measurement 83
Relative Measurement 84
Range 84
Restart Measurements 84
This chapter explains how to configure and perform multimeter measurements.
75Agilent Technologies
4 Using the Digital Multimeter
Introduction
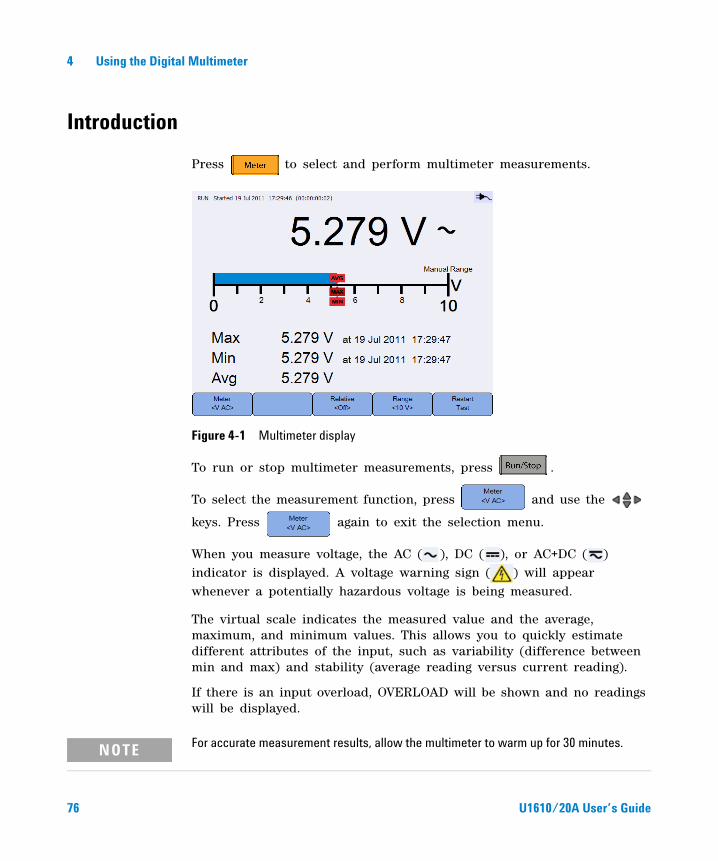
Press to select and perform multimeter measurements.
Figure 4-1 Multimeter display
To run or stop multimeter measurements, press .
To select the measurement function, press and use the
keys. Press again to exit the selection menu.
When you measure voltage, the AC ( ), DC ( ), or AC+DC ( ) indicator is displayed. A voltage warning sign ( ) will appear whenever a potentially hazardous voltage is being measured.
The virtual scale indicates the measured value and the average, maximum, and minimum values. This allows you to quickly estimate different attributes of the input, such as variability (difference between min and max) and stability (average reading versus current reading).
If there is an input overload, OVERLOAD will be shown and no readings will be displayed.
NOTE For accurate measurement results, allow the multimeter to warm up for 30 minutes.
76 U1610/20A User’s Guide
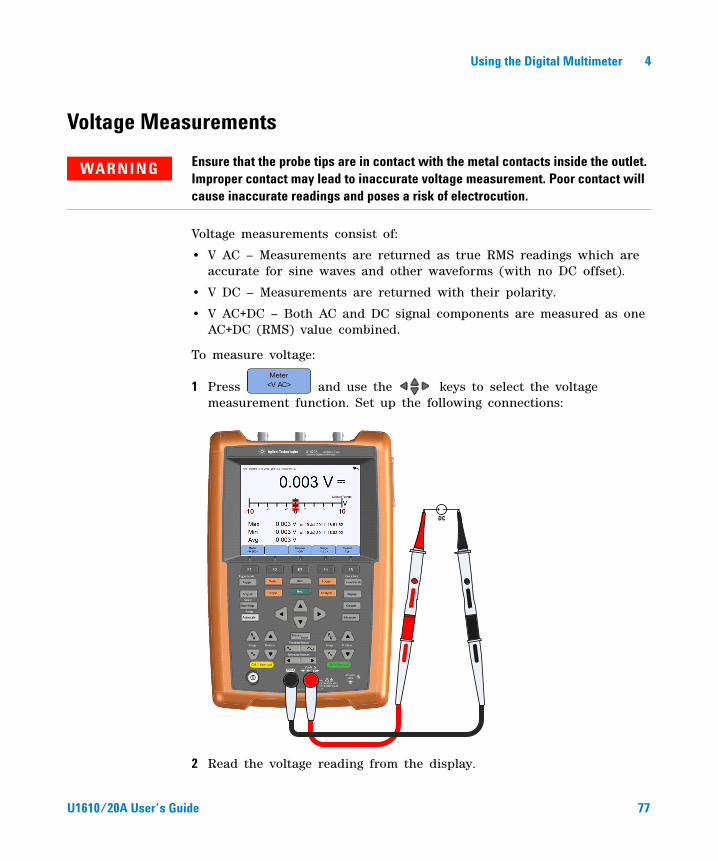
Using the Digital Multimeter 4
Voltage Measurements
Voltage measurements consist of:
• V AC – Measurements are returned as true RMS readings which are accurate for sine waves and other waveforms (with no DC offset).
• V DC – Measurements are returned with their polarity.
• V AC+DC – Both AC and DC signal components are measured as one AC+DC (RMS) value combined.
To measure voltage:
1 Press and use the keys to select the voltage measurement function. Set up the following connections:
2 Read the voltage reading from the display.
WARNING Ensure that the probe tips are in contact with the metal contacts inside the outlet. Improper contact may lead to inaccurate voltage measurement. Poor contact will cause inaccurate readings and poses a risk of electrocution.
DC
U1610/20A User’s Guide 77
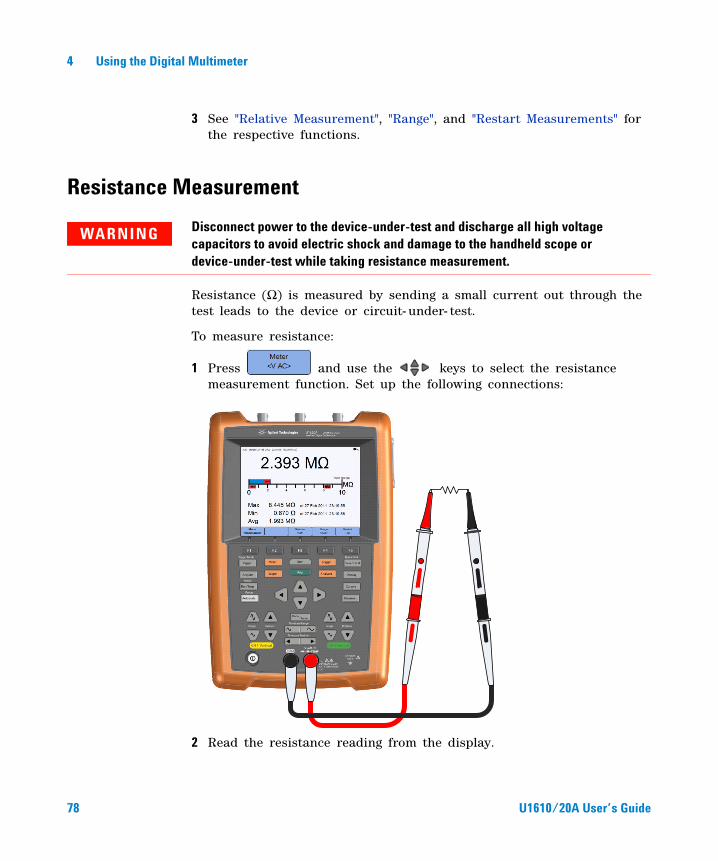
4 Using the Digital Multimeter
3 See "Relative Measurement", "Range", and "Restart Measurements" for the respective functions.
Resistance Measurement
Resistance (Ω) is measured by sending a small current out through the test leads to the device or circuit- under- test.
To measure resistance:
1 Press and use the keys to select the resistance measurement function. Set up the following connections:
2 Read the resistance reading from the display.
WARNING Disconnect power to the device-under-test and discharge all high voltage capacitors to avoid electric shock and damage to the handheld scope or device-under-test while taking resistance measurement.
78 U1610/20A User’s Guide
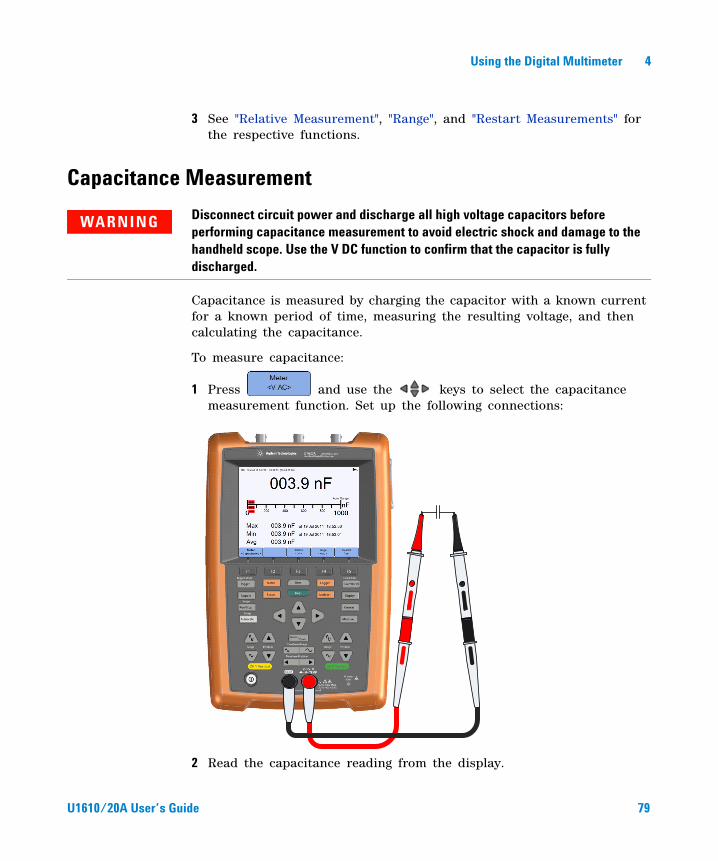
Using the Digital Multimeter 4
3 See "Relative Measurement", "Range", and "Restart Measurements" for the respective functions.
Capacitance Measurement
Capacitance is measured by charging the capacitor with a known current for a known period of time, measuring the resulting voltage, and then calculating the capacitance.
To measure capacitance:
1 Press and use the keys to select the capacitance measurement function. Set up the following connections:
2 Read the capacitance reading from the display.
WARNING Disconnect circuit power and discharge all high voltage capacitors before performing capacitance measurement to avoid electric shock and damage to the handheld scope. Use the V DC function to confirm that the capacitor is fully discharged.
U1610/20A User’s Guide 79
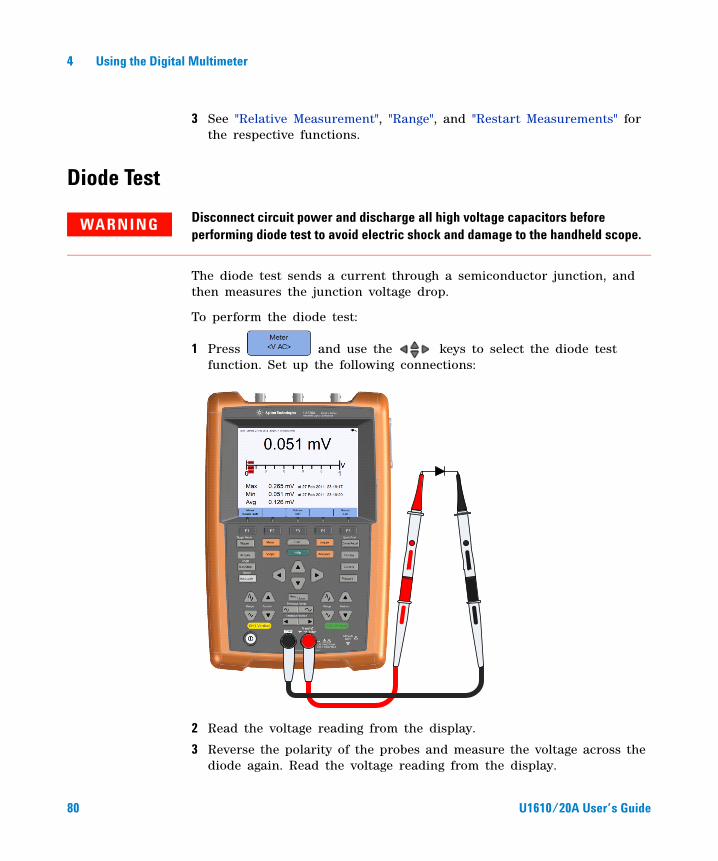
4 Using the Digital Multimeter
3 See "Relative Measurement", "Range", and "Restart Measurements" for the respective functions.
Diode Test
The diode test sends a current through a semiconductor junction, and then measures the junction voltage drop.
To perform the diode test:
1 Press and use the keys to select the diode test function. Set up the following connections:
2 Read the voltage reading from the display.
3 Reverse the polarity of the probes and measure the voltage across the diode again. Read the voltage reading from the display.
WARNING Disconnect circuit power and discharge all high voltage capacitors before performing diode test to avoid electric shock and damage to the handheld scope.
80 U1610/20A User’s Guide

Using the Digital Multimeter 4
4 See "Relative Measurement" and "Restart Measurements" for the respective functions.
Continuity Test
The continuity test emits a continuous beep (press >
> to enable the beeper) when a circuit is
complete; otherwise the circuit is broken.
To perform the continuity test:
1 Press and use the keys to select the continuity test function. Set up the following connections:
2 Read the resistance reading from the display.
WARNING Disconnect circuit power and discharge all high voltage capacitors before measuring continuity on circuits or wires to avoid electric shock and damage to the handheld scope.
ON (closed)
OFF (open)
U1610/20A User’s Guide 81
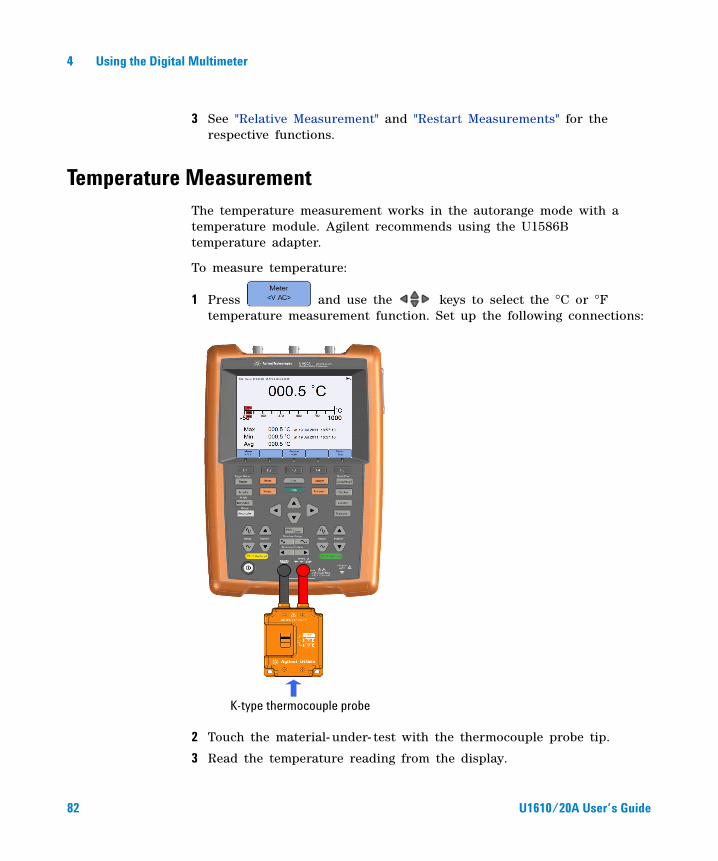
4 Using the Digital Multimeter
3 See "Relative Measurement" and "Restart Measurements" for the respective functions.
Temperature MeasurementThe temperature measurement works in the autorange mode with a temperature module. Agilent recommends using the U1586B temperature adapter.
To measure temperature:
1 Press and use the keys to select the °C or °F temperature measurement function. Set up the following connections:
2 Touch the material- under- test with the thermocouple probe tip.
3 Read the temperature reading from the display.
K-type thermocouple probe
82 U1610/20A User’s Guide
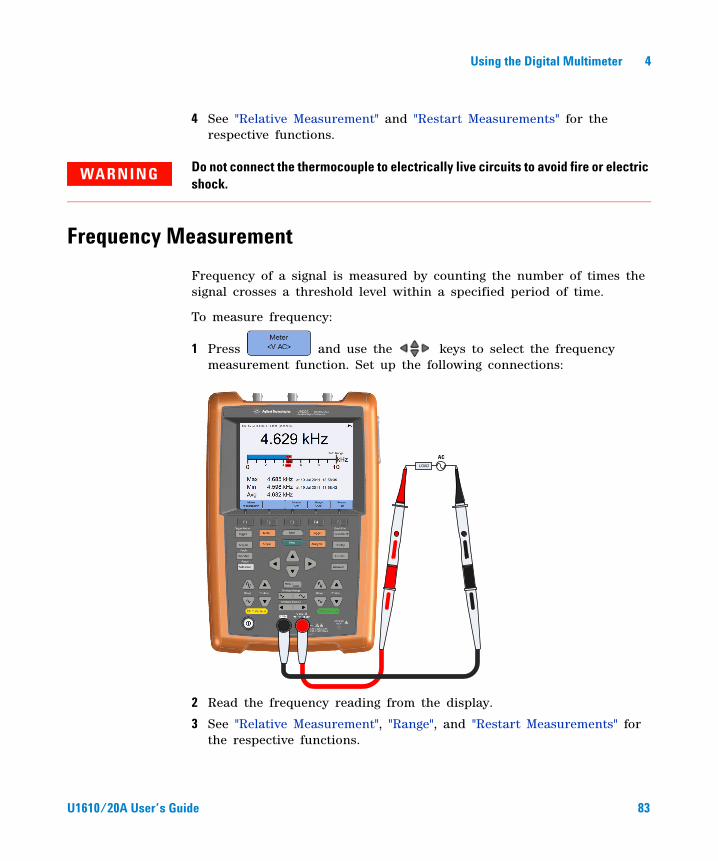
Using the Digital Multimeter 4
4 See "Relative Measurement" and "Restart Measurements" for the respective functions.
Frequency Measurement
Frequency of a signal is measured by counting the number of times the signal crosses a threshold level within a specified period of time.
To measure frequency:
1 Press and use the keys to select the frequency measurement function. Set up the following connections:
2 Read the frequency reading from the display.
3 See "Relative Measurement", "Range", and "Restart Measurements" for the respective functions.
WARNING Do not connect the thermocouple to electrically live circuits to avoid fire or electric shock.
ACLOAD
U1610/20A User’s Guide 83
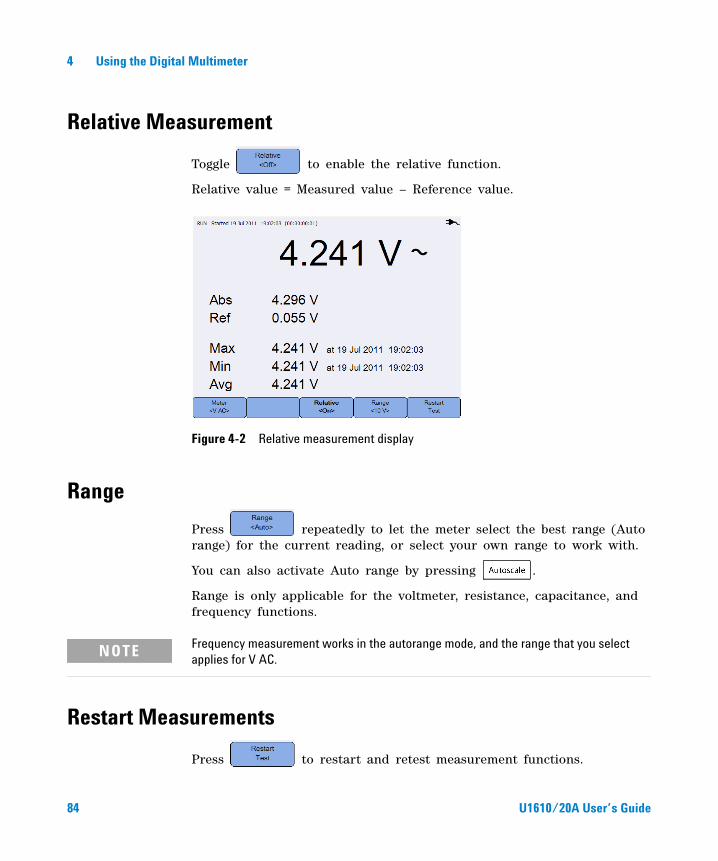
4 Using the Digital Multimeter
Relative Measurement
Toggle to enable the relative function.
Relative value = Measured value – Reference value.
Figure 4-2 Relative measurement display
Range
Press repeatedly to let the meter select the best range (Auto range) for the current reading, or select your own range to work with.
You can also activate Auto range by pressing .
Range is only applicable for the voltmeter, resistance, capacitance, and frequency functions.
Restart Measurements
Press to restart and retest measurement functions.
NOTE Frequency measurement works in the autorange mode, and the range that you select applies for V AC.
84 U1610/20A User’s Guide
Agilent U1610/20A Handheld Digital OscilloscopeUser’s Guide
5Using the Data Logger
Introduction 86
Scope Logger 87Measurement statistics 87Graphing mode 88Saving the recorded data 89Erasing the saved recorded data 89Transferring the saved recorded data 89
Meter Logger 90Measurement selection 90Graphing mode 90Saving the recorded data 90Erasing the saved recorded data 91Transferring the saved recorded data 91
This chapter describes how to perform scope and meter data logging.
85Agilent Technologies
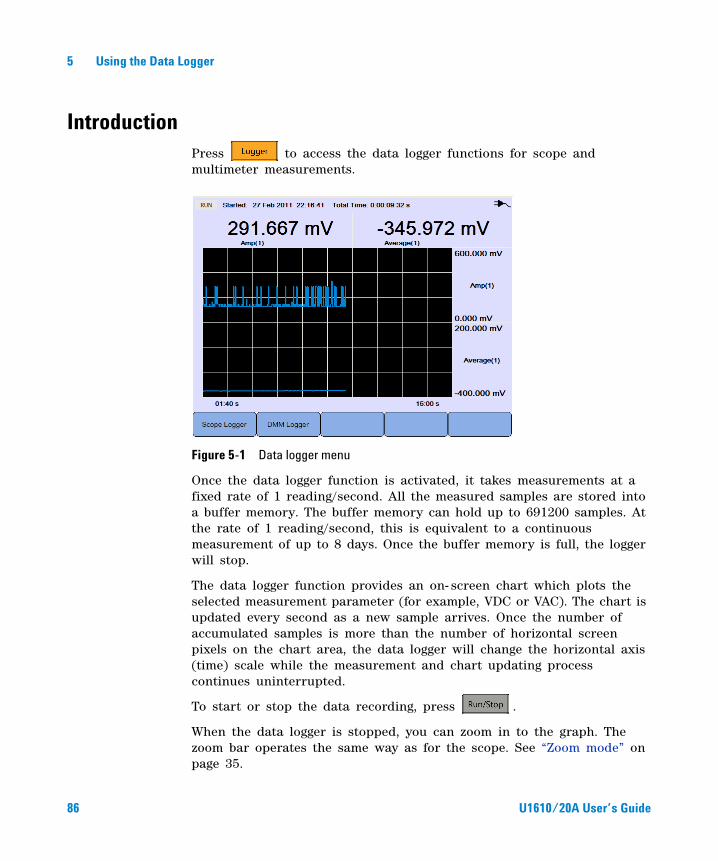
5 Using the Data Logger
IntroductionPress to access the data logger functions for scope and multimeter measurements.
Figure 5-1 Data logger menu
Once the data logger function is activated, it takes measurements at a fixed rate of 1 reading/second. All the measured samples are stored into a buffer memory. The buffer memory can hold up to 691200 samples. At the rate of 1 reading/second, this is equivalent to a continuous measurement of up to 8 days. Once the buffer memory is full, the logger will stop.
The data logger function provides an on- screen chart which plots the selected measurement parameter (for example, VDC or VAC). The chart is updated every second as a new sample arrives. Once the number of accumulated samples is more than the number of horizontal screen pixels on the chart area, the data logger will change the horizontal axis (time) scale while the measurement and chart updating process continues uninterrupted.
To start or stop the data recording, press .
When the data logger is stopped, you can zoom in to the graph. The zoom bar operates the same way as for the scope. See “Zoom mode” on page 35.
86 U1610/20A User’s Guide
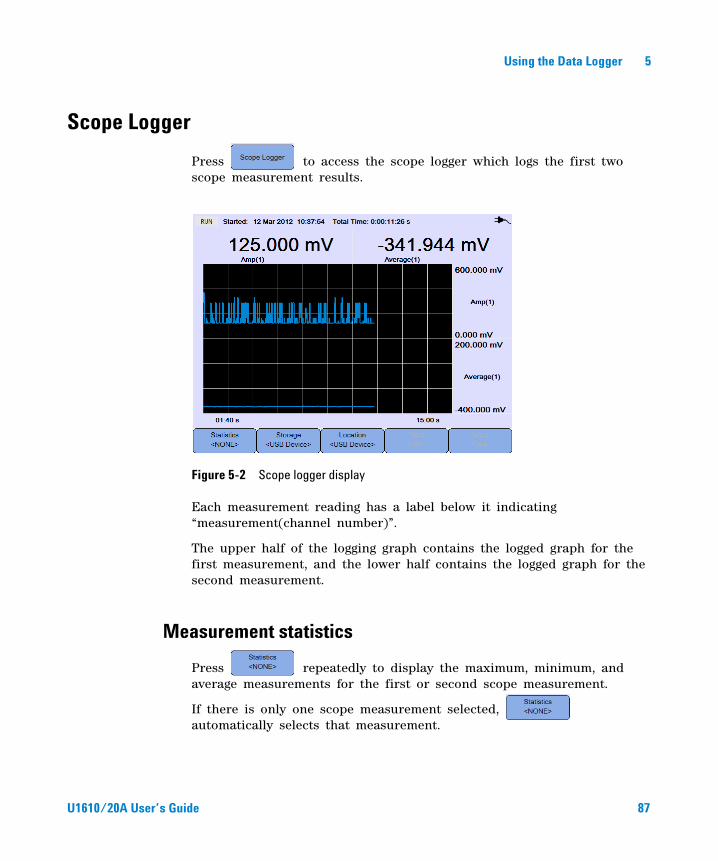
Using the Data Logger 5
Scope Logger
Press to access the scope logger which logs the first two scope measurement results.
Figure 5-2 Scope logger display
Each measurement reading has a label below it indicating “measurement(channel number)”.
The upper half of the logging graph contains the logged graph for the first measurement, and the lower half contains the logged graph for the second measurement.
Measurement statistics
Press repeatedly to display the maximum, minimum, and average measurements for the first or second scope measurement.
If there is only one scope measurement selected, automatically selects that measurement.
U1610/20A User’s Guide 87
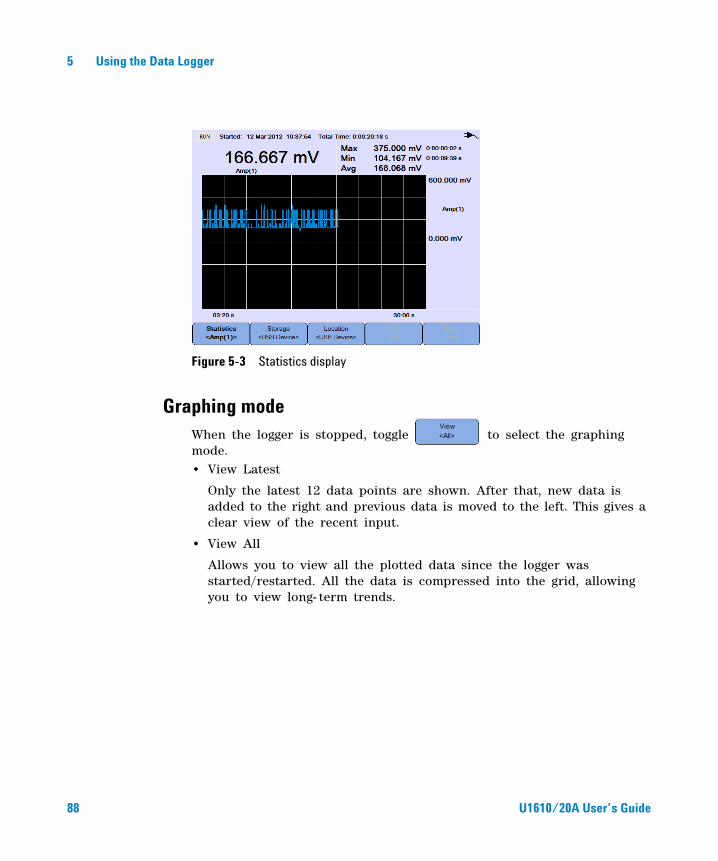
5 Using the Data Logger
Figure 5-3 Statistics display
Graphing modeWhen the logger is stopped, toggle to select the graphing mode. • View Latest
Only the latest 12 data points are shown. After that, new data is added to the right and previous data is moved to the left. This gives a clear view of the recent input.
• View All
Allows you to view all the plotted data since the logger was started/restarted. All the data is compressed into the grid, allowing you to view long- term trends.
88 U1610/20A User’s Guide
Using the Data Logger 5
Saving the recorded dataWhen the logger is stopped, press to select either the USB
storage device or internal memory as the storage location. Press
and use the keys to select the USB location or the
internal memory slot to save the recorded data to. Ensure that your USB
storage device is connected and ready for use (see “Select the save
location” on page 70).
Press to save the recorded data.
Erasing the saved recorded data
When the logger is stopped, press repeatedly to select the
erase function. Press and use the keys to select the
internal memory slot to be erased.
Press to erase the recorded data in the selected memory slot.
Transferring the saved recorded data
When the logger is stopped, press repeatedly to select the
transfer function. Press and use the keys to select the
internal memory slot to be transferred to the USB storage device. The
USB location will be the previous location selected.
Press to transfer the selected recorded data to the USB
storage device.
U1610/20A User’s Guide 89
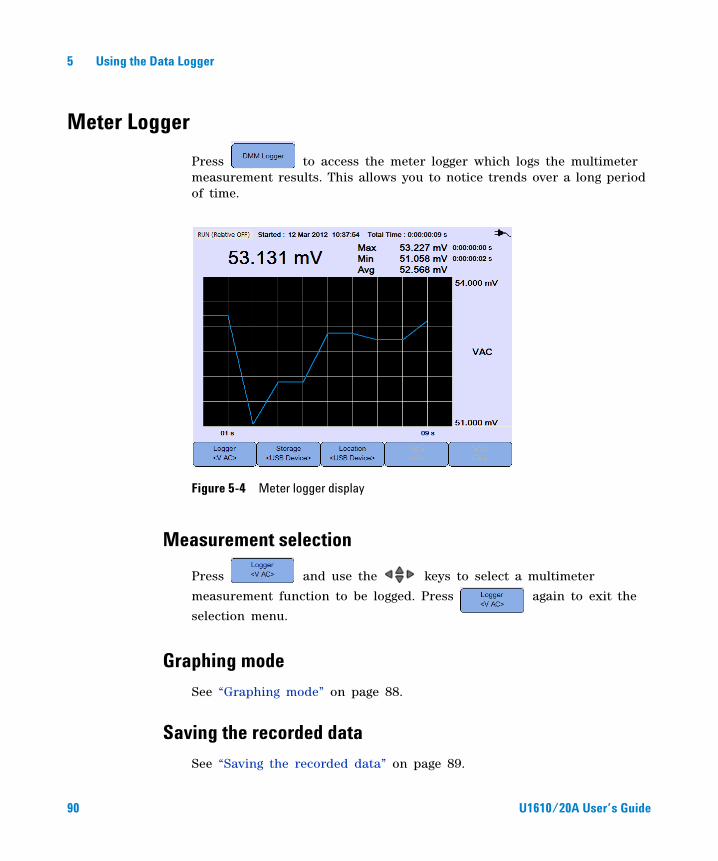
5 Using the Data Logger
Meter Logger
Press to access the meter logger which logs the multimeter measurement results. This allows you to notice trends over a long period of time.
Figure 5-4 Meter logger display
Measurement selection
Press and use the keys to select a multimeter
measurement function to be logged. Press again to exit the
selection menu.
Graphing mode
See “Graphing mode” on page 88.
Saving the recorded data
See “Saving the recorded data” on page 89.
90 U1610/20A User’s Guide
Using the Data Logger 5
Erasing the saved recorded data
See “Erasing the saved recorded data” on page 89.
Transferring the saved recorded data
See “Transferring the saved recorded data” on page 89.
U1610/20A User’s Guide 91

5 Using the Data Logger
THIS PAGE HAS BEEN INTENTIONALLY LEFT BLANK.
92 U1610/20A User’s Guide
Agilent U1610/20A Handheld Digital OscilloscopeUser’s Guide
6Using the System-Related Functions
Introduction 94
General System Settings 94USB connectivity 95Set the language 95Set the date and time 95Set auto-shutdown 95
Display Settings 96Backlight intensity 96View mode 96
Sound Settings 97
Service Functions 98Firmware update 98Self-calibration 99Antialiasing 99
System Information 99
This chapter explains how to set up system- related settings and perform service functions.
93Agilent Technologies
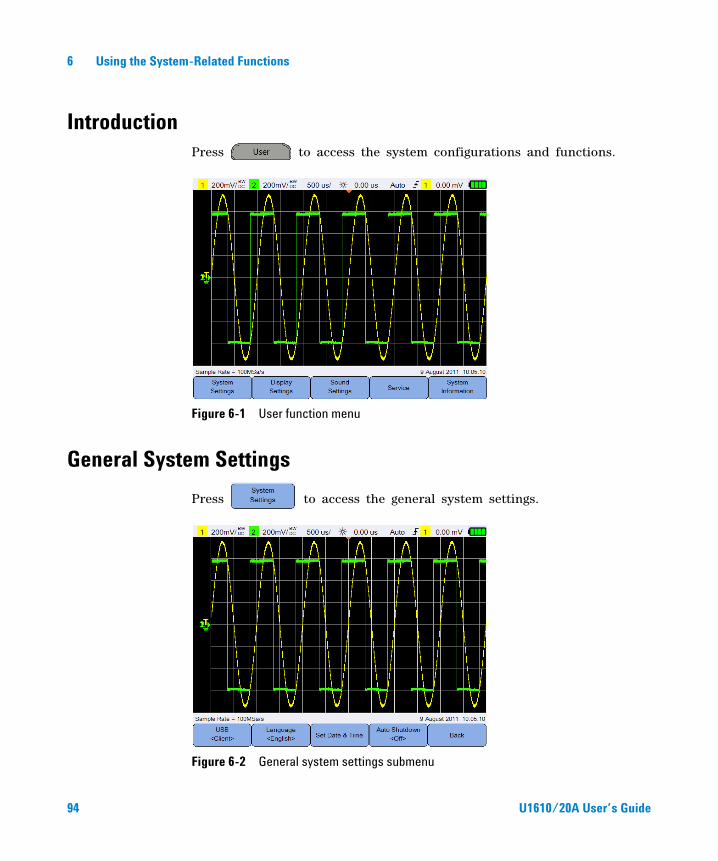
6 Using the System-Related Functions
IntroductionPress to access the system configurations and functions.
Figure 6-1 User function menu
General System Settings
Press to access the general system settings.
Figure 6-2 General system settings submenu
94 U1610/20A User’s Guide
Using the System-Related Functions 6
USB connectivity
Press repeatedly to select the USB connectivity type when you connect a USB device to the handheld scope. Select <Host> when a USB storage device is connected to the handheld scope, or <Client> when the handheld scope is connected to the PC.
Set the language
See “Set the Date and Time and Language” on page 9.
Set the date and time
See “Set the Date and Time and Language” on page 9.
Set auto-shutdown
Press repeatedly to adjust the length of time the display can be left idle before the handheld scope is powered down automatically. Enabling this option helps you save the battery life of your handheld scope.
U1610/20A User’s Guide 95
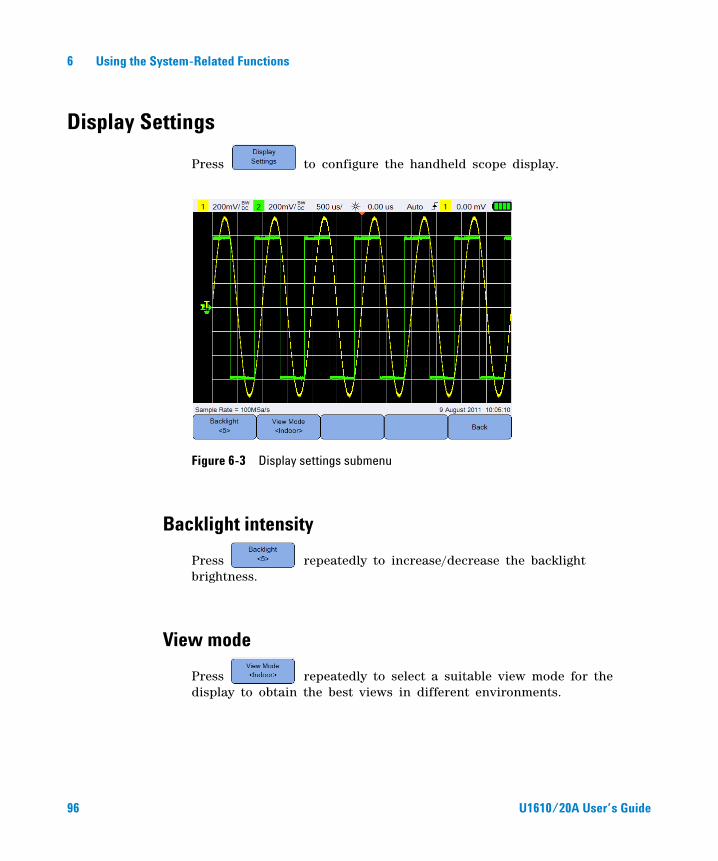
6 Using the System-Related Functions
Display Settings
Press to configure the handheld scope display.
Figure 6-3 Display settings submenu
Backlight intensity
Press repeatedly to increase/decrease the backlight brightness.
View mode
Press repeatedly to select a suitable view mode for the display to obtain the best views in different environments.
96 U1610/20A User’s Guide
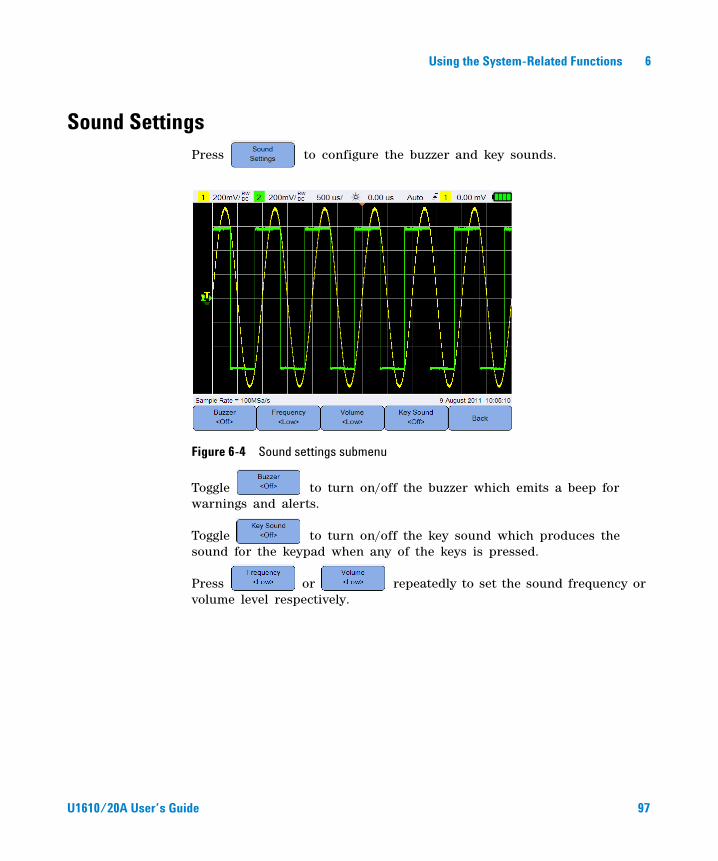
Using the System-Related Functions 6
Sound SettingsPress to configure the buzzer and key sounds.
Figure 6-4 Sound settings submenu
Toggle to turn on/off the buzzer which emits a beep for warnings and alerts.
Toggle to turn on/off the key sound which produces the sound for the keypad when any of the keys is pressed.
Press or repeatedly to set the sound frequency or volume level respectively.
U1610/20A User’s Guide 97
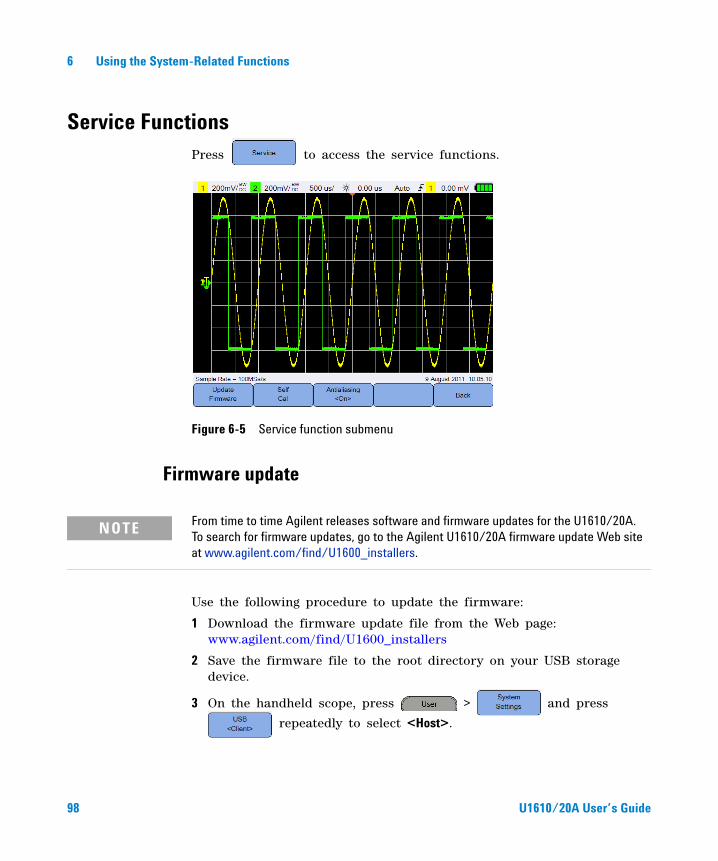
6 Using the System-Related Functions
Service FunctionsPress to access the service functions.
Figure 6-5 Service function submenu
Firmware update
Use the following procedure to update the firmware:
1 Download the firmware update file from the Web page: www.agilent.com/find/U1600_installers
2 Save the firmware file to the root directory on your USB storage device.
3 On the handheld scope, press > and press
repeatedly to select <Host>.
NOTE From time to time Agilent releases software and firmware updates for the U1610/20A. To search for firmware updates, go to the Agilent U1610/20A firmware update Web site at www.agilent.com/find/U1600_installers.
98 U1610/20A User’s Guide
Using the System-Related Functions 6
4 Connect your USB storage device to the handheld scope.
5 Press > > > to start
updating the firmware.
6 Once completed, the handheld scope will automatically restart for the firmware updating to take effect.
Self-calibration
Press to perform self- calibration. (See “Perform
Self- Calibration” on page 8).
Antialiasing
Aliasing can occur when the oscilloscope sampling rate is not at least twice as fast as the highest frequency component in the sampled waveform. When the antialiasing function is turned on, the handheld scope randomizes the time between the samples at a low sweep rate. This prevents the high frequency aliased signals to be misinterpreted as low frequency signals when displayed on the screen.
Toggle to turn on/off antialiasing.
System Information
Press to view the current system information of the handheld scope.
U1610/20A User’s Guide 99

6 Using the System-Related Functions
THIS PAGE HAS BEEN INTENTIONALLY LEFT BLANK.
100 U1610/20A User’s Guide
Agilent U1610/20A Handheld Digital OscilloscopeUser’s Guide
7Specifications and Characteristics
Oscilloscope Specifications and Characteristics 102
Maximum Input Voltages and Channel Isolation 106
Digital Multimeter Specifications 108
Data Logger Specifications 111
General Specifications 112
Pollution Degree 114
Measurement Category 115
This chapter lists the specifications, characteristics, pollution degree, and measurement category of the handheld scope.
101Agilent Technologies
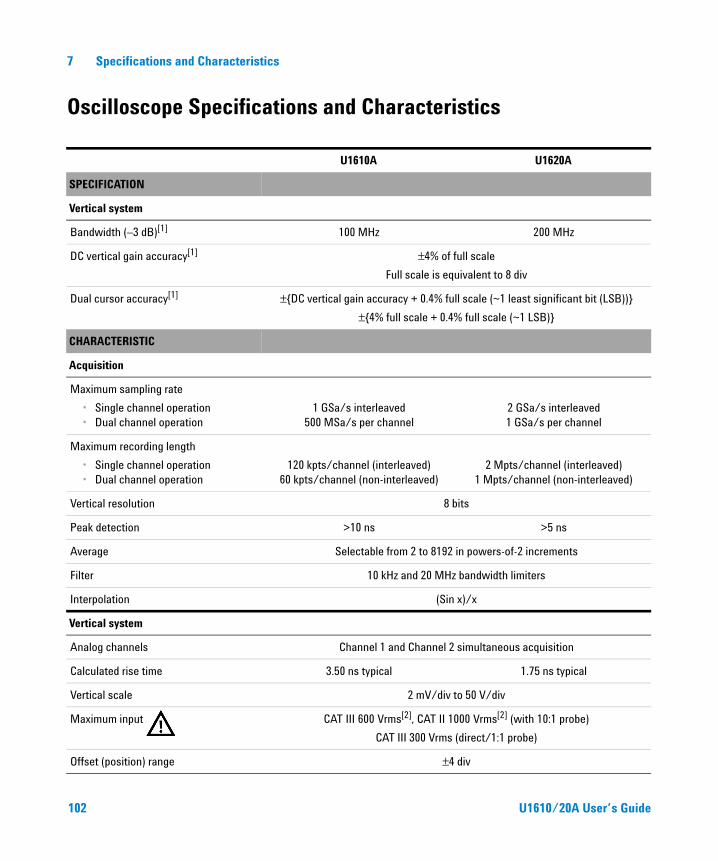
7 Specifications and Characteristics
Oscilloscope Specifications and Characteristics
U1610A U1620A
SPECIFICATION
Vertical system
Bandwidth (–3 dB)[1] 100 MHz 200 MHz
DC vertical gain accuracy[1] ±4% of full scale
Full scale is equivalent to 8 div
Dual cursor accuracy[1] ±{DC vertical gain accuracy + 0.4% full scale (~1 least significant bit (LSB))}
±{4% full scale + 0.4% full scale (~1 LSB)}
CHARACTERISTIC
Acquisition
Maximum sampling rate
• Single channel operation• Dual channel operation
1 GSa/s interleaved500 MSa/s per channel
2 GSa/s interleaved1 GSa/s per channel
Maximum recording length
• Single channel operation• Dual channel operation
120 kpts/channel (interleaved)60 kpts/channel (non-interleaved)
2 Mpts/channel (interleaved)1 Mpts/channel (non-interleaved)
Vertical resolution 8 bits
Peak detection >10 ns >5 ns
Average Selectable from 2 to 8192 in powers-of-2 increments
Filter 10 kHz and 20 MHz bandwidth limiters
Interpolation (Sin x)/x
Vertical system
Analog channels Channel 1 and Channel 2 simultaneous acquisition
Calculated rise time 3.50 ns typical 1.75 ns typical
Vertical scale 2 mV/div to 50 V/div
Maximum input CAT III 600 Vrms[2], CAT II 1000 Vrms[2] (with 10:1 probe)
CAT III 300 Vrms (direct/1:1 probe)
Offset (position) range ±4 div
102 U1610/20A User’s Guide
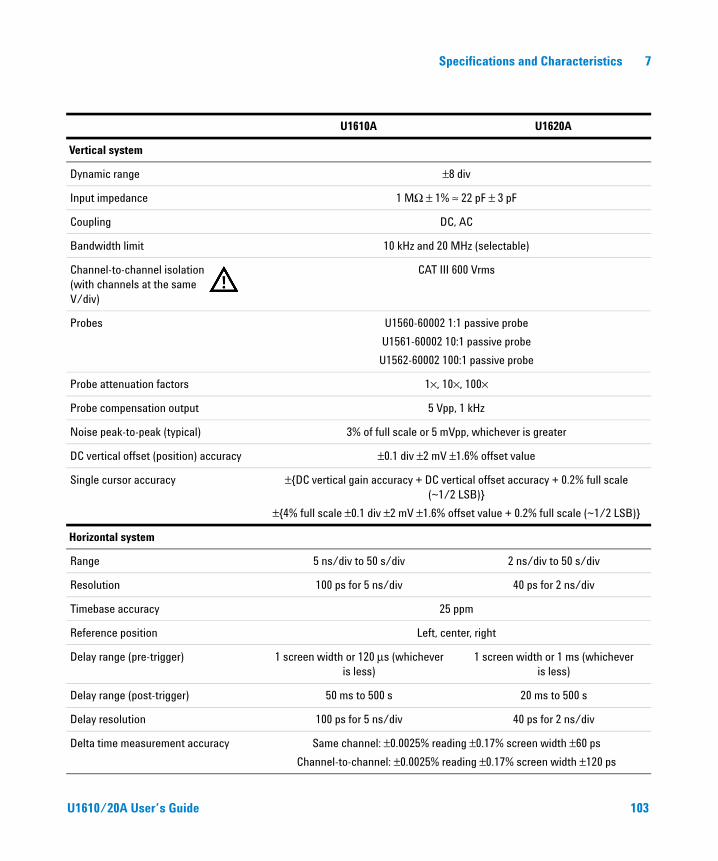
Specifications and Characteristics 7
U1610A U1620A
Vertical system
Dynamic range ±8 div
Input impedance 1 MΩ ± 1% ≈ 22 pF ± 3 pF
Coupling DC, AC
Bandwidth limit 10 kHz and 20 MHz (selectable)
Channel-to-channel isolation (with channels at the same V/div)
CAT III 600 Vrms
Probes U1560-60002 1:1 passive probe
U1561-60002 10:1 passive probe
U1562-60002 100:1 passive probe
Probe attenuation factors 1×, 10×, 100×
Probe compensation output 5 Vpp, 1 kHz
Noise peak-to-peak (typical) 3% of full scale or 5 mVpp, whichever is greater
DC vertical offset (position) accuracy ±0.1 div ±2 mV ±1.6% offset value
Single cursor accuracy ±{DC vertical gain accuracy + DC vertical offset accuracy + 0.2% full scale (~1/2 LSB)}
±{4% full scale ±0.1 div ±2 mV ±1.6% offset value + 0.2% full scale (~1/2 LSB)}
Horizontal system
Range 5 ns/div to 50 s/div 2 ns/div to 50 s/div
Resolution 100 ps for 5 ns/div 40 ps for 2 ns/div
Timebase accuracy 25 ppm
Reference position Left, center, right
Delay range (pre-trigger) 1 screen width or 120 μs (whichever is less)
1 screen width or 1 ms (whichever is less)
Delay range (post-trigger) 50 ms to 500 s 20 ms to 500 s
Delay resolution 100 ps for 5 ns/div 40 ps for 2 ns/div
Delta time measurement accuracy Same channel: ±0.0025% reading ±0.17% screen width ±60 ps
Channel-to-channel: ±0.0025% reading ±0.17% screen width ±120 ps
U1610/20A User’s Guide 103
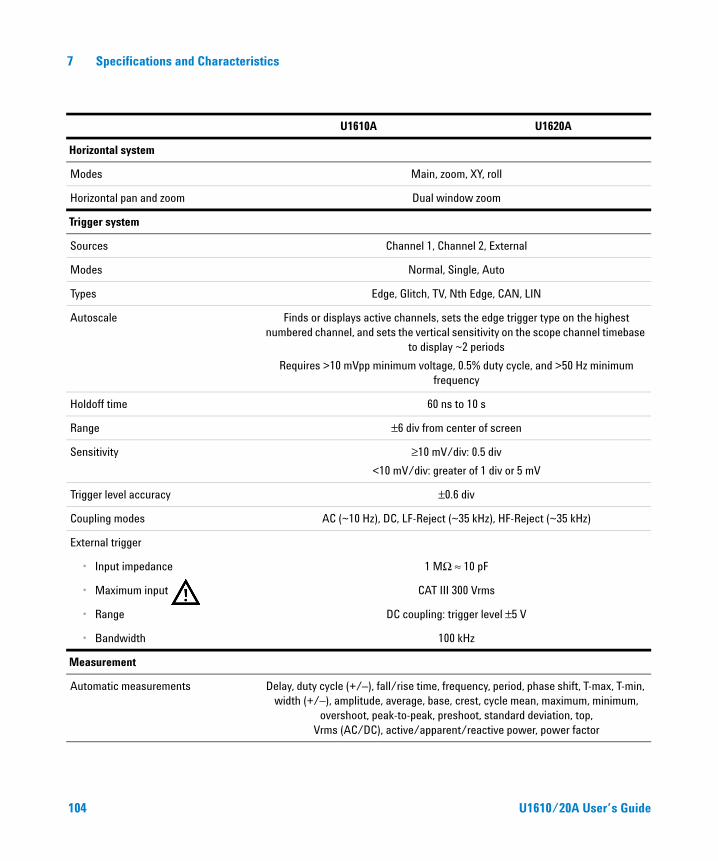
7 Specifications and Characteristics
U1610A U1620A
Horizontal system
Modes Main, zoom, XY, roll
Horizontal pan and zoom Dual window zoom
Trigger system
Sources Channel 1, Channel 2, External
Modes Normal, Single, Auto
Types Edge, Glitch, TV, Nth Edge, CAN, LIN
Autoscale Finds or displays active channels, sets the edge trigger type on the highest numbered channel, and sets the vertical sensitivity on the scope channel timebase
to display ~2 periods
Requires >10 mVpp minimum voltage, 0.5% duty cycle, and >50 Hz minimum frequency
Holdoff time 60 ns to 10 s
Range ±6 div from center of screen
Sensitivity ≥10 mV/div: 0.5 div
<10 mV/div: greater of 1 div or 5 mV
Trigger level accuracy ±0.6 div
Coupling modes AC (~10 Hz), DC, LF-Reject (~35 kHz), HF-Reject (~35 kHz)
External trigger
• Input impedance 1 MΩ ≈ 10 pF
• Maximum input CAT III 300 Vrms
• Range DC coupling: trigger level ±5 V
• Bandwidth 100 kHz
Measurement
Automatic measurements Delay, duty cycle (+/–), fall/rise time, frequency, period, phase shift, T-max, T-min, width (+/–), amplitude, average, base, crest, cycle mean, maximum, minimum,
overshoot, peak-to-peak, preshoot, standard deviation, top, Vrms (AC/DC), active/apparent/reactive power, power factor
104 U1610/20A User’s Guide
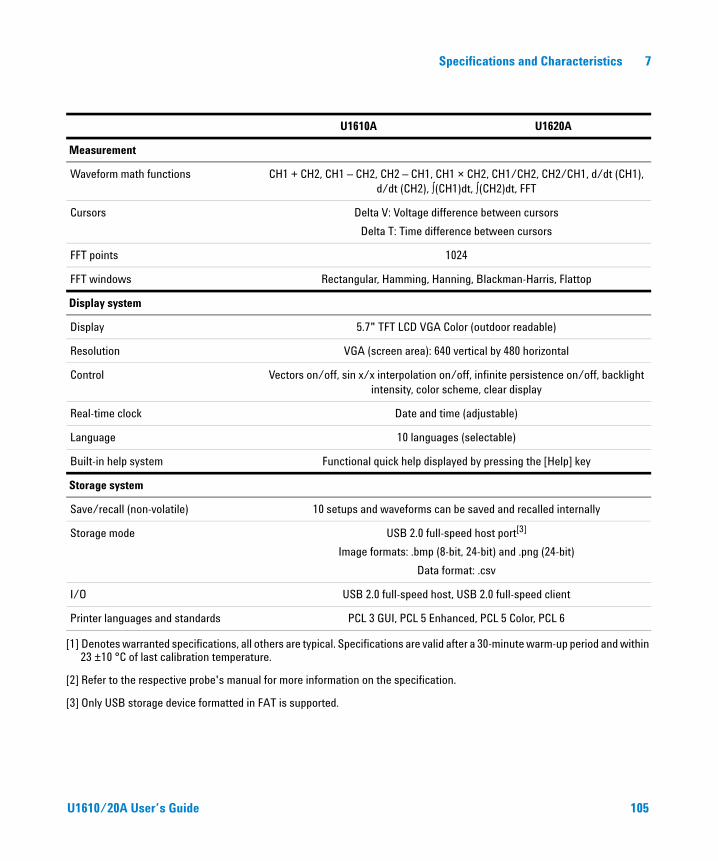
Specifications and Characteristics 7
U1610A U1620A
Measurement
Waveform math functions CH1 + CH2, CH1 – CH2, CH2 – CH1, CH1 × CH2, CH1/CH2, CH2/CH1, d/dt (CH1), d/dt (CH2), ∫(CH1)dt, ∫(CH2)dt, FFT
Cursors Delta V: Voltage difference between cursors
Delta T: Time difference between cursors
FFT points 1024
FFT windows Rectangular, Hamming, Hanning, Blackman-Harris, Flattop
Display system
Display 5.7" TFT LCD VGA Color (outdoor readable)
Resolution VGA (screen area): 640 vertical by 480 horizontal
Control Vectors on/off, sin x/x interpolation on/off, infinite persistence on/off, backlight intensity, color scheme, clear display
Real-time clock Date and time (adjustable)
Language 10 languages (selectable)
Built-in help system Functional quick help displayed by pressing the [Help] key
Storage system
Save/recall (non-volatile) 10 setups and waveforms can be saved and recalled internally
Storage mode USB 2.0 full-speed host port[3]
Image formats: .bmp (8-bit, 24-bit) and .png (24-bit)
Data format: .csv
I/O USB 2.0 full-speed host, USB 2.0 full-speed client
Printer languages and standards PCL 3 GUI, PCL 5 Enhanced, PCL 5 Color, PCL 6
[1] Denotes warranted specifications, all others are typical. Specifications are valid after a 30-minute warm-up period and within 23 ±10 °C of last calibration temperature.
[2] Refer to the respective probe's manual for more information on the specification.
[3] Only USB storage device formatted in FAT is supported.
U1610/20A User’s Guide 105
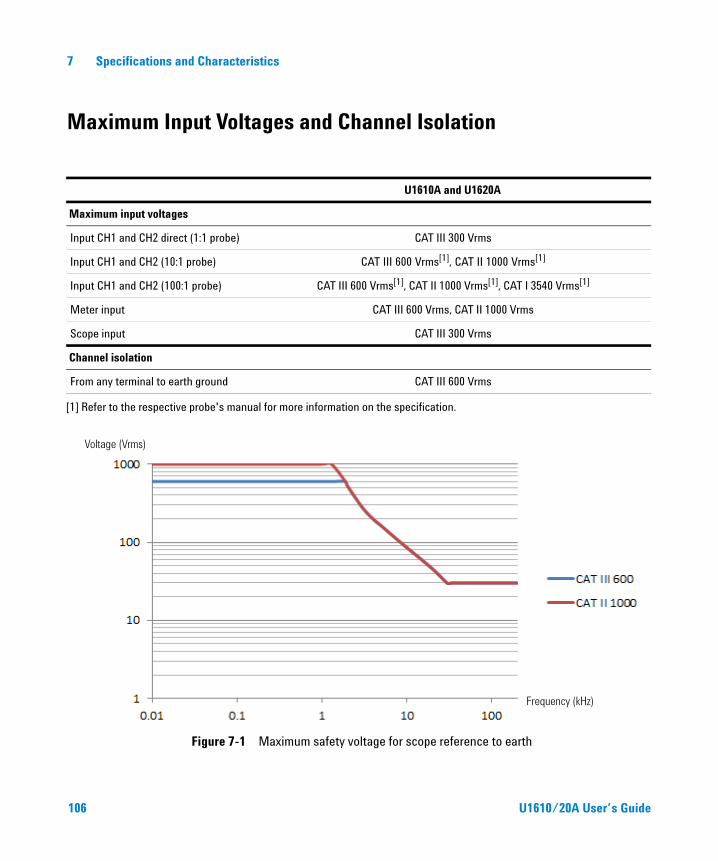
7 Specifications and Characteristics
Maximum Input Voltages and Channel Isolation
Figure 7-1 Maximum safety voltage for scope reference to earth
U1610A and U1620A
Maximum input voltages
Input CH1 and CH2 direct (1:1 probe) CAT III 300 Vrms
Input CH1 and CH2 (10:1 probe) CAT III 600 Vrms[1], CAT II 1000 Vrms[1]
Input CH1 and CH2 (100:1 probe) CAT III 600 Vrms[1], CAT II 1000 Vrms[1], CAT I 3540 Vrms[1]
Meter input CAT III 600 Vrms, CAT II 1000 Vrms
Scope input CAT III 300 Vrms
Channel isolation
From any terminal to earth ground CAT III 600 Vrms
[1] Refer to the respective probe's manual for more information on the specification.
Voltage (Vrms)
Frequency (kHz)
106 U1610/20A User’s Guide
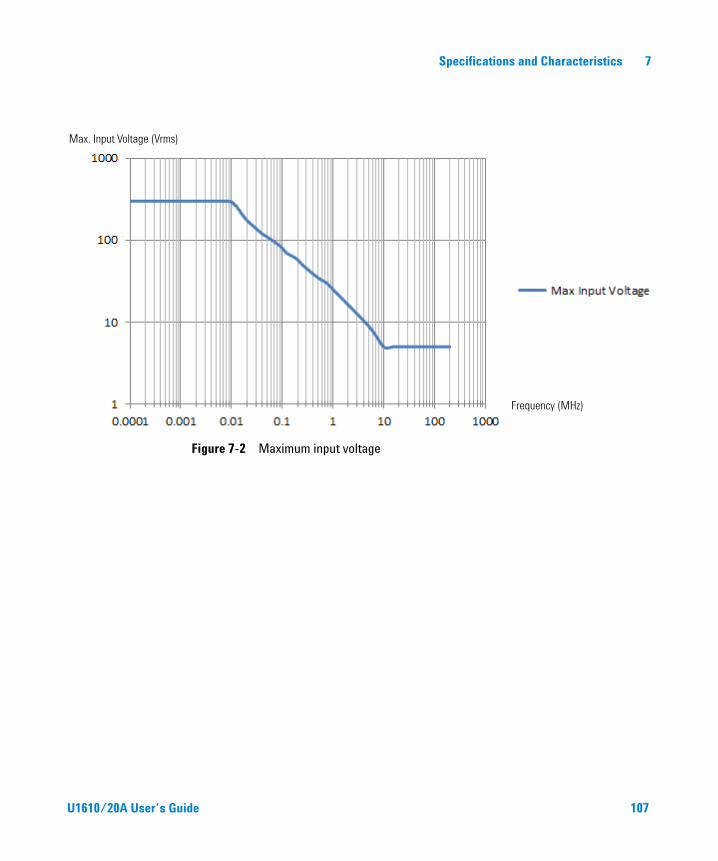
Specifications and Characteristics 7
Figure 7-2 Maximum input voltage
Max. Input Voltage (Vrms)
Frequency (MHz)
U1610/20A User’s Guide 107
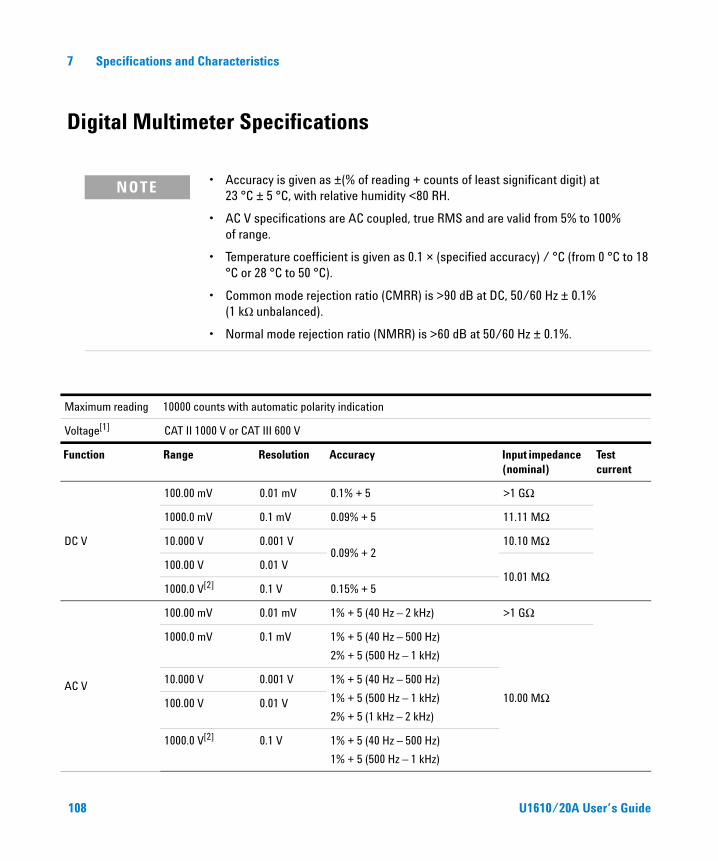
7 Specifications and Characteristics
Digital Multimeter Specifications
NOTE • Accuracy is given as ±(% of reading + counts of least significant digit) at 23 °C ± 5 °C, with relative humidity <80 RH.
• AC V specifications are AC coupled, true RMS and are valid from 5% to 100% of range.
• Temperature coefficient is given as 0.1 × (specified accuracy) / °C (from 0 °C to 18 °C or 28 °C to 50 °C).
• Common mode rejection ratio (CMRR) is >90 dB at DC, 50/60 Hz ± 0.1% (1 kΩ unbalanced).
• Normal mode rejection ratio (NMRR) is >60 dB at 50/60 Hz ± 0.1%.
Maximum reading 10000 counts with automatic polarity indication
Voltage[1] CAT II 1000 V or CAT III 600 V
Function Range Resolution Accuracy Input impedance (nominal)
Test current
DC V
100.00 mV 0.01 mV 0.1% + 5 >1 GΩ
1000.0 mV 0.1 mV 0.09% + 5 11.11 MΩ
10.000 V 0.001 V0.09% + 2
10.10 MΩ
100.00 V 0.01 V10.01 MΩ
1000.0 V[2] 0.1 V 0.15% + 5
AC V
100.00 mV 0.01 mV 1% + 5 (40 Hz – 2 kHz) >1 GΩ
1000.0 mV 0.1 mV 1% + 5 (40 Hz – 500 Hz)
2% + 5 (500 Hz – 1 kHz)
10.00 MΩ10.000 V 0.001 V 1% + 5 (40 Hz – 500 Hz)
1% + 5 (500 Hz – 1 kHz)
2% + 5 (1 kHz – 2 kHz)100.00 V 0.01 V
1000.0 V[2] 0.1 V 1% + 5 (40 Hz – 500 Hz)
1% + 5 (500 Hz – 1 kHz)
108 U1610/20A User’s Guide
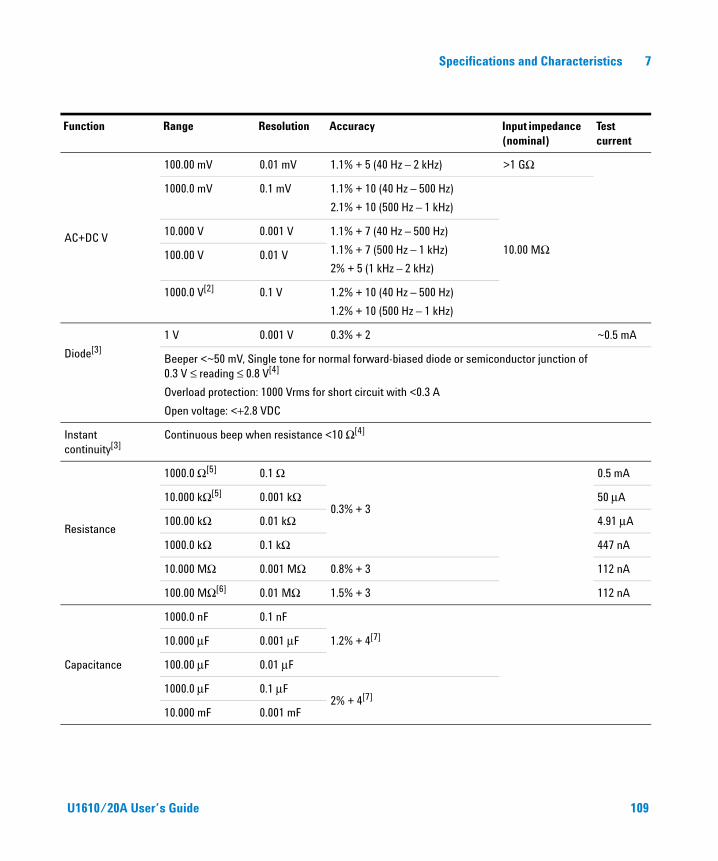
Specifications and Characteristics 7
Function Range Resolution Accuracy Input impedance (nominal)
Test current
AC+DC V
100.00 mV 0.01 mV 1.1% + 5 (40 Hz – 2 kHz) >1 GΩ
1000.0 mV 0.1 mV 1.1% + 10 (40 Hz – 500 Hz)
2.1% + 10 (500 Hz – 1 kHz)
10.00 MΩ10.000 V 0.001 V 1.1% + 7 (40 Hz – 500 Hz)
1.1% + 7 (500 Hz – 1 kHz)
2% + 5 (1 kHz – 2 kHz)100.00 V 0.01 V
1000.0 V[2] 0.1 V 1.2% + 10 (40 Hz – 500 Hz)
1.2% + 10 (500 Hz – 1 kHz)
Diode[3]
1 V 0.001 V 0.3% + 2 ~0.5 mA
Beeper <~50 mV, Single tone for normal forward-biased diode or semiconductor junction of 0.3 V ≤ reading ≤ 0.8 V[4]
Overload protection: 1000 Vrms for short circuit with <0.3 A
Open voltage: <+2.8 VDC
Instant continuity[3]
Continuous beep when resistance <10 Ω[4]
Resistance
1000.0 Ω[5] 0.1 Ω
0.3% + 3
0.5 mA
10.000 kΩ[5] 0.001 kΩ 50 μA
100.00 kΩ 0.01 kΩ 4.91 μA
1000.0 kΩ 0.1 kΩ 447 nA
10.000 MΩ 0.001 MΩ 0.8% + 3 112 nA
100.00 MΩ[6] 0.01 MΩ 1.5% + 3 112 nA
Capacitance
1000.0 nF 0.1 nF
1.2% + 4[7]10.000 μF 0.001 μF
100.00 μF 0.01 μF
1000.0 μF 0.1 μF2% + 4[7]
10.000 mF 0.001 mF
U1610/20A User’s Guide 109
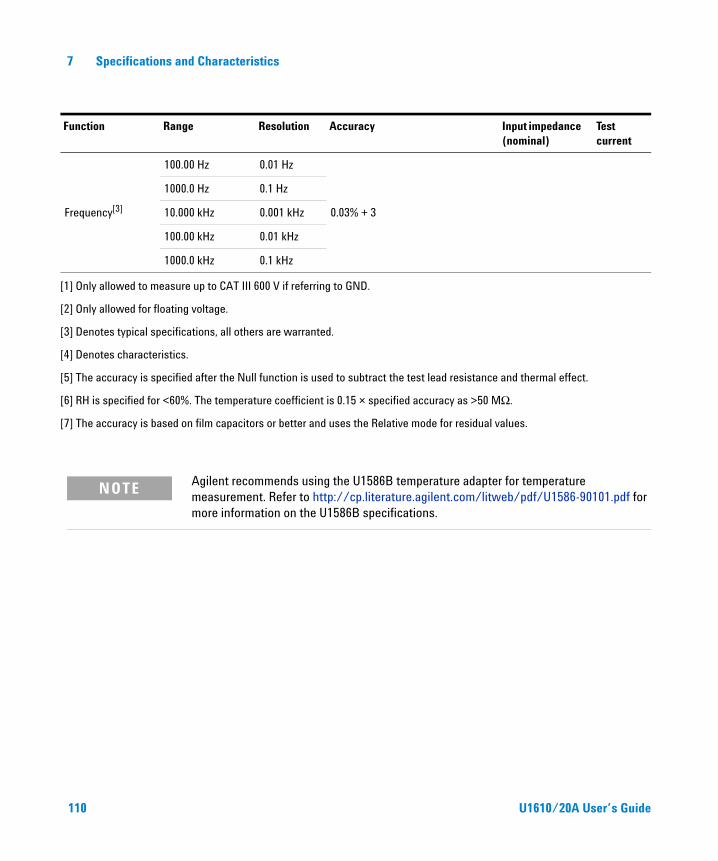
7 Specifications and Characteristics
Function Range Resolution Accuracy Input impedance (nominal)
Test current
Frequency[3]
100.00 Hz 0.01 Hz
0.03% + 3
1000.0 Hz 0.1 Hz
10.000 kHz 0.001 kHz
100.00 kHz 0.01 kHz
1000.0 kHz 0.1 kHz
[1] Only allowed to measure up to CAT III 600 V if referring to GND.
[2] Only allowed for floating voltage.
[3] Denotes typical specifications, all others are warranted.
[4] Denotes characteristics.
[5] The accuracy is specified after the Null function is used to subtract the test lead resistance and thermal effect.
[6] RH is specified for <60%. The temperature coefficient is 0.15 × specified accuracy as >50 MΩ.
[7] The accuracy is based on film capacitors or better and uses the Relative mode for residual values.
NOTE Agilent recommends using the U1586B temperature adapter for temperature measurement. Refer to http://cp.literature.agilent.com/litweb/pdf/U1586-90101.pdf for more information on the U1586B specifications.
110 U1610/20A User’s Guide
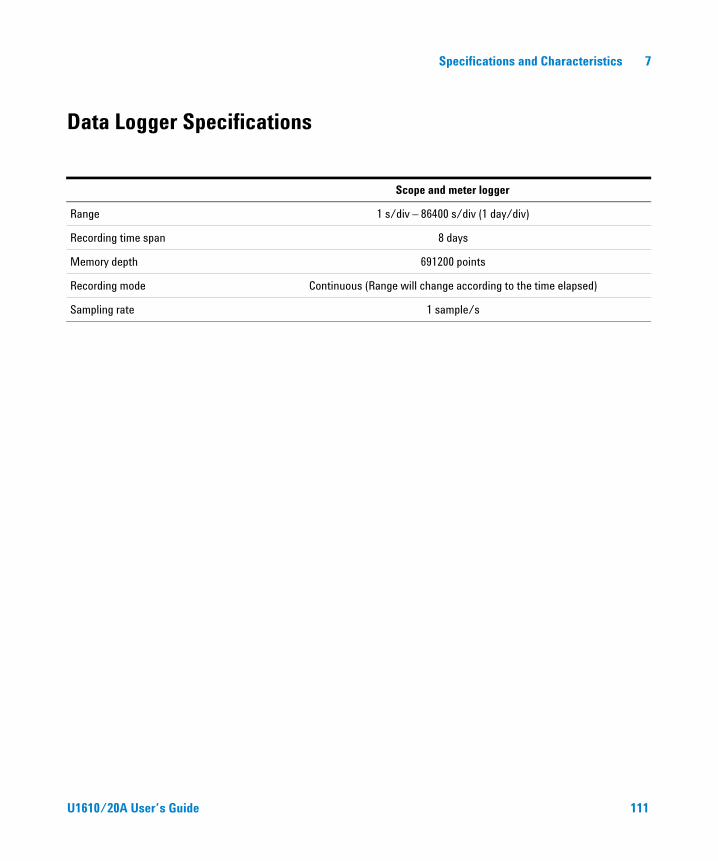
Specifications and Characteristics 7
Data Logger Specifications
Scope and meter logger
Range 1 s/div – 86400 s/div (1 day/div)
Recording time span 8 days
Memory depth 691200 points
Recording mode Continuous (Range will change according to the time elapsed)
Sampling rate 1 sample/s
U1610/20A User’s Guide 111
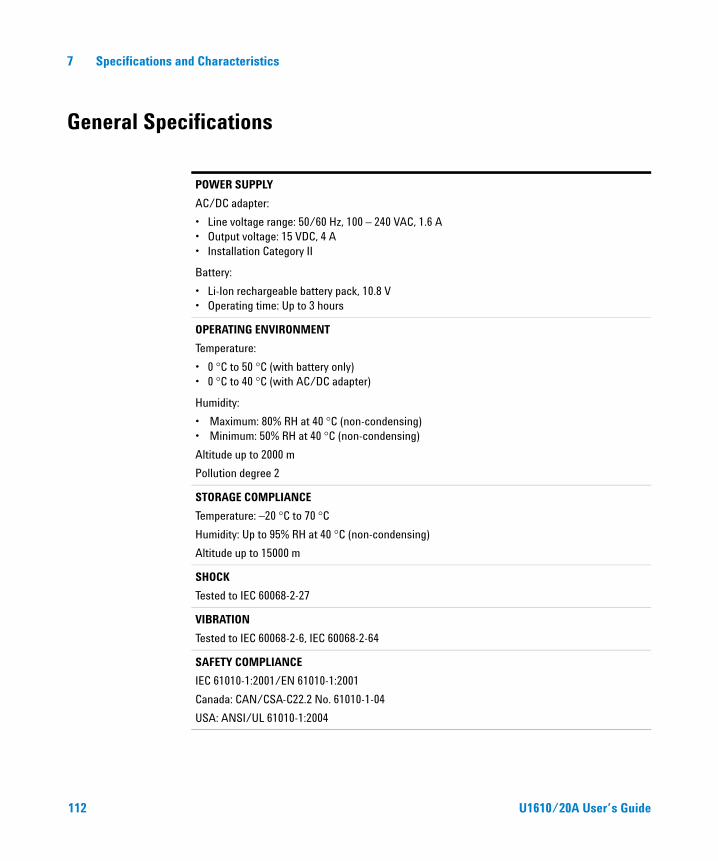
7 Specifications and Characteristics
General Specifications
POWER SUPPLY
AC/DC adapter:
• Line voltage range: 50/60 Hz, 100 – 240 VAC, 1.6 A• Output voltage: 15 VDC, 4 A• Installation Category II
Battery:
• Li-Ion rechargeable battery pack, 10.8 V• Operating time: Up to 3 hours
OPERATING ENVIRONMENT
Temperature:
• 0 °C to 50 °C (with battery only)• 0 °C to 40 °C (with AC/DC adapter)
Humidity:
• Maximum: 80% RH at 40 °C (non-condensing)• Minimum: 50% RH at 40 °C (non-condensing)
Altitude up to 2000 m
Pollution degree 2
STORAGE COMPLIANCE
Temperature: –20 °C to 70 °C
Humidity: Up to 95% RH at 40 °C (non-condensing)
Altitude up to 15000 m
SHOCK
Tested to IEC 60068-2-27
VIBRATION
Tested to IEC 60068-2-6, IEC 60068-2-64
SAFETY COMPLIANCE
IEC 61010-1:2001/EN 61010-1:2001
Canada: CAN/CSA-C22.2 No. 61010-1-04
USA: ANSI/UL 61010-1:2004
112 U1610/20A User’s Guide
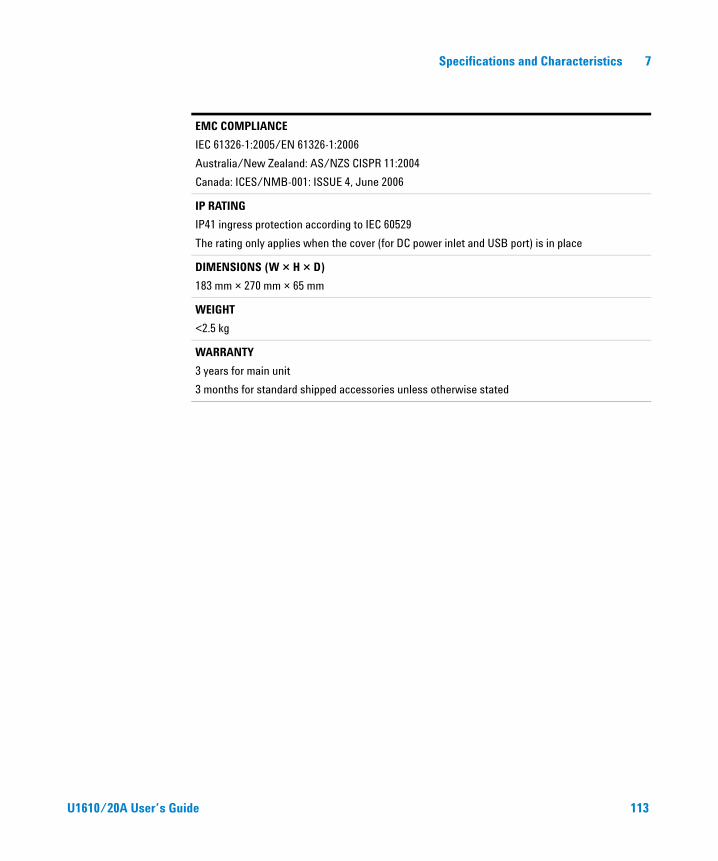
Specifications and Characteristics 7
EMC COMPLIANCE
IEC 61326-1:2005/EN 61326-1:2006
Australia/New Zealand: AS/NZS CISPR 11:2004
Canada: ICES/NMB-001: ISSUE 4, June 2006
IP RATING
IP41 ingress protection according to IEC 60529
The rating only applies when the cover (for DC power inlet and USB port) is in place
DIMENSIONS (W × H × D)
183 mm × 270 mm × 65 mm
WEIGHT
<2.5 kg
WARRANTY
3 years for main unit
3 months for standard shipped accessories unless otherwise stated
U1610/20A User’s Guide 113

7 Specifications and Characteristics
Pollution Degree
This instrument may be operated in a pollution degree 2 environment.
Pollution degree 1
No pollution or only dry, non- conductive pollution occurs. The pollution has no influence. Example is a clean room or climate- controlled office environment.
Pollution degree 2
Normally only dry, non- conductive pollution occurs. Occasionally a temporary conductivity caused by condensation may occur. Example is a general indoor environment.
Pollution degree 3
Conductive pollution occurs, or dry, non- conductive pollution occurs which becomes conductive due to condensation which is expected. Example is a sheltered outdoor environment.
114 U1610/20A User’s Guide
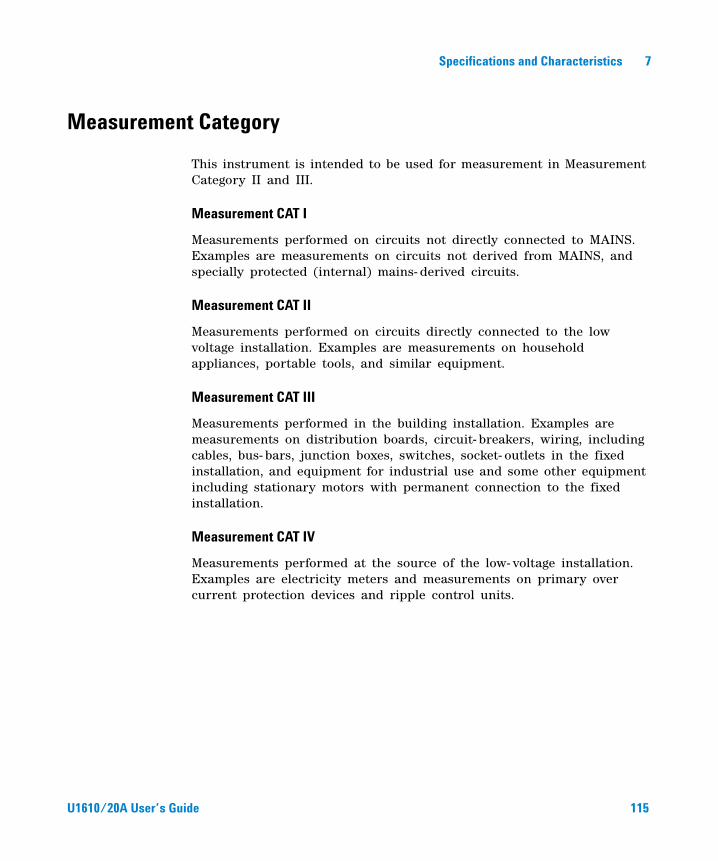
Specifications and Characteristics 7
Measurement Category
This instrument is intended to be used for measurement in Measurement Category II and III.
Measurement CAT I
Measurements performed on circuits not directly connected to MAINS. Examples are measurements on circuits not derived from MAINS, and specially protected (internal) mains- derived circuits.
Measurement CAT II
Measurements performed on circuits directly connected to the low voltage installation. Examples are measurements on household appliances, portable tools, and similar equipment.
Measurement CAT III
Measurements performed in the building installation. Examples are measurements on distribution boards, circuit- breakers, wiring, including cables, bus- bars, junction boxes, switches, socket- outlets in the fixed installation, and equipment for industrial use and some other equipment including stationary motors with permanent connection to the fixed installation.
Measurement CAT IV
Measurements performed at the source of the low- voltage installation. Examples are electricity meters and measurements on primary over current protection devices and ripple control units.
U1610/20A User’s Guide 115

7 Specifications and Characteristics
THIS PAGE HAS BEEN INTENTIONALLY LEFT BLANK.
116 U1610/20A User’s Guide
© Agilent Technologies, Inc., 2011–2013
Second Edition, February 5, 2013U1610-90040
www.agilent.com
Agilent Technologies
Contact usTo obtain service, warranty, or technical assistance, contact us at the following phone or fax numbers:
United States:
(tel) 800 829 4444 (fax) 800 829 4433
Canada:
(tel) 877 894 4414 (fax) 800 746 4866
China:
(tel) 800 810 0189 (fax) 800 820 2816
Europe:
(tel) 31 20 547 2111
Japan:
(tel) (81) 426 56 7832 (fax) (81) 426 56 7840
Korea:
(tel) (080) 769 0800 (fax) (080) 769 0900
Latin America:
(tel) (305) 269 7500
Taiwan:
(tel) 0800 047 866 (fax) 0800 286 331
Other Asia Pacific Countries:
(tel) (65) 6375 8100 (fax) (65) 6755 0042
Or visit Agilent World Wide Web at:www.agilent.com/find/assist
Product specifications and descriptions in this document are subject to change without notice. Always refer to the Agilent Web site for the latest revision.