agf management limited - management’s discussion and ...funds,” said blake c. goldring, chairman...
TRANSCRIPT

AGF Management Limited MANAGEMENT’S DISCUSSION AND ANALYSIS OF FINANCIAL CONDITION AND RESULTS OF OPERATIONS For the three and nine months ended August 31, 2015 and 2014

AGF Management Limited – 2 – Third Quarter Report 2015
AGF MANAGEMENT LIMITED Third Quarter Report to Shareholders for the three and nine months ended August 31, 2015
AGF MANAGEMENT LIMITED REPORTS THIRD QUARTER FINANCIAL RESULTS • Gross retail fund sales up 12.0% compared to the third quarter of 2014
Toronto | September 30, 2015
AGF Management Limited (AGF or the Company) today announced financial and operating results for the third quarter ended August 31, 2015, noting improvements in gross retail fund sales of 12.0%, compared to the same period in 2014.
During the third quarter of 2015, revenue from continuing operations was $115.8 million, compared to $116.9 million for the three months ended August 31, 2014. Earnings before interest, taxes, depreciation and amortization (EBITDA) from continuing operations were $31.8 million, compared to $38.5 million in the third quarter of 2014. For the three months ended August 31, 2015, net income from continuing operations was $11.9 million compared to $14.8 million for the three months ended August 31, 2014. Diluted earnings per share (EPS) from continuing operations were $0.14, compared to $0.17 for the three months ended August 31, 2014.
“Despite the dramatic market volatility, we executed on our core priorities throughout the third quarter and saw consistent performance across key asset classes with our managers adding value in Canadian equity, global and emerging markets funds,” said Blake C. Goldring, Chairman and Chief Executive Officer, AGF. “Our capital position remains strong and we are committed to investing in the growth of our business.”
For the one-year period ended August 31, 2015, 45% of our AUM performed above median, compared to 47% for the one-year period May 31, 2015 and 46% for the one-year period at August 31, 2014. For the three-year period ended August 31, 2015, 48% of AUM performed above median, compared to 45% for the three-year period May 31, 2015 and a significant improvement from 25% for the three-year period ended August 31, 2014.
“We remain focused on building our core competencies in investment management,” said Kevin McCreadie, President and Chief Investment Officer. ”We are committed to delivering long-term capital growth and downside risk protection to create a more consistent, repeatable outcome for our clients.”
Total assets under management (AUM) were $33.3 billion as at August 31, 2015, compared to $37.0 billion as at August 31, 2014. Total retail fund AUM was $18.2 billion as at August 31, 2015, compared to $19.9 billion in the third quarter of 2014. Institutional and sub-advisory AUM were $10.5 billion as at August 31, 2015, compared to $12.4 billion as at August 31, 2014. High-net-worth AUM remained stable at $4.4 billion, compared to $4.4 billion for the corresponding period in 2014. Alternative asset management platform AUM was $0.3 billion as at August 31, 2015.
Dividends paid, including dividends reinvested, on Class A Voting common shares and Class B Non-Voting shares were $6.5 million in the third quarter of 2015. Under the normal course issuer bid, 2,120,924 Class B Non-Voting shares were repurchased during the quarter for a total consideration of $13.4 million at an average price of $6.32 per share. For the three months ended August 31, 2015, AGF declared an eight cent per share dividend on Class A Voting common shares and Class B Non-Voting shares, payable October 19, 2015 to shareholders on record as at October 9, 2015.

AGF Management Limited – 3 – Third Quarter Report 2015
CAUTION REGARDING FORWARD-LOOKING STATEMENTS This Management’s Discussion and Analysis (MD&A) includes forward-looking statements about the Company, including its business operations, strategy and expected financial performance and condition. Forward-looking statements include statements that are predictive in nature, depend upon or refer to future events or conditions, or include words such as ‘expects,’ ‘anticipates,’ ‘intends,’ ‘plans,’ ‘believes’ or negative versions thereof and similar expressions, or future or conditional verbs such as ‘may,’ ‘will,’ ‘should,’ ‘would’ and ‘could.’ In addition, any statement that may be made concerning future financial performance (including revenues, earnings or growth rates), ongoing business strategies or prospects, and possible future action on our part, is also a forward-looking statement. Forward-looking statements are based on certain factors and assumptions, including expected growth, results of operations, business prospects, business performance and opportunities. While we consider these factors and assumptions to be reasonable based on information currently available, they may prove to be incorrect. Forward-looking statements are based on current expectations and projections about future events and are inherently subject to, among other things, risks, uncertainties and assumptions about our operations, economic factors and the financial services industry generally. They are not guarantees of future performance, and actual events and results could differ materially from those expressed or implied by forward-looking statements made by us due to, but not limited to, important risk factors such as level of assets under our management, volume of sales and redemptions of our investment products, performance of our investment funds and of our investment managers and advisors, pipeline, competitive fee levels for investment management products and administration, and competitive dealer compensation levels and cost efficiency in our investment management operations, as well as interest and foreign-exchange rates, taxation, changes in government regulations, unexpected judicial or regulatory proceedings, and our ability to complete strategic transactions and integrate acquisitions. We caution that the foregoing list is not exhaustive. The reader is cautioned to consider these and other factors carefully and not place undue reliance on forward-looking statements. Other than specifically required by applicable laws, we are under no obligation (and expressly disclaim any such obligation) to update or alter the forward-looking statements, whether as a result of new information, future events or otherwise. For a more complete discussion of the risk factors that may impact actual results, please refer to the ‘Risk Factors and Management of Risk’ section of the 2014 Annual MD&A.

AGF Management Limited – 4 – Third Quarter Report 2015
Dear fellow shareholders,
The summer months were anything but quiet for global equity markets. Volatility was extremely high, driven by weak investor sentiment, limited equity market liquidity, concerns over China’s economic growth and anticipation of a U.S. Federal Reserve Board interest rate hike which did not materialize. In fact, markets in China, Japan and the U.S. saw some of the highest intra-day and intra-week swings in recent history. Emerging markets led the equity market declines, falling almost 13.0% in the quarter in Canadian dollar terms. Here in Canada, the S&P/TSX index was not immune to this volatility and declined 7.0% this quarter. World markets fared slightly better, but still suffered declines in Canadian dollar terms, as the MSCI ACWI was down 3.1% and the S&P 500 was down 0.6%.
This quarter we continued to focus on our long-term strategy in the following three areas: • Growing the AUM of our institutional business through an aggressive build out of our distribution capability relying on
our global mandates as our lead product. • Investing in our alternatives platform to further diversify our business and revenue streams. • Improving the fundamentals of the retail business by enhancing investment management performance, expanding
new and existing distribution relationships through our strategic partner platforms and developing new and innovative product solutions.
Product development was a focus for the quarter. We partnered with State Street Global Advisors to bring their cutting-edge expertise to Canadian retail investors for the first time with the launch of AGF Flex Asset Allocation Fund. We know that in today’s market environment, many investors are seeking to manage volatility. As a ‘go anywhere’ global solution, the Fund balances an investor’s need for long-term capital growth, while also managing downside risk.
We also announced an exciting new partnership with FFCM, LLC (FFCM), a Boston-based advisor who currently manage a family of market and sector neutral ETFs and a number of ETF managed strategies. FFCM and Highstreet Asset Management Inc. (Highstreet) took over portfolio advisor duties of AGF U.S. Sector Class. The renamed Fund employs a combination of FFCM’s sector model with Highstreet’s market risk model to provide U.S. equity market exposure in a dynamic, risk aware manner that focuses on limiting downside volatility for investors.
Going forward, we will continue to look for ways to leverage Highstreet’s quantitative investing capabilities. We believe Highstreet can enhance our investment management processes as we develop new and innovative product solutions designed with a view to manage downside volatility and create a more consistent outcome for clients.
We are also committed to meeting the needs of our advisors and their clients by continuing to share our Rethink Risk messaging, delivering “value of advice” tools ahead of CRM2 and leveraging the results of our 2015 Investor Survey.
As always, I would like to express my sincere thanks to all of our stakeholders for their continued support and confidence. AGF remains well-positioned as an independent and global firm, thriving in a competitive market. We are focused on our strategic priorities and the growth of our business today and going forward.
Sincerely,
Blake C. Goldring, M.S.M., CFA Chairman and Chief Executive Officer September 30, 2015

AGF Management Limited – 5 – Third Quarter Report 2015
Management’s Discussion and Analysis of Financial Condition and Results of Operations This Management’s Discussion and Analysis (MD&A) is as of September 29, 2015, and presents an analysis of the financial condition of AGF and its subsidiaries for the three- and nine-month periods ended August 31, 2015, compared to the three- and nine-month periods ended August 31, 2014. The MD&A should be read in conjunction with our unaudited Condensed Consolidated Interim Financial Statements for the three and nine months ended August 31, 2015 and our 2014 Annual Report. The financial statements for the three and nine months ended August 31, 2015, including required comparative information, have been prepared in accordance with International Financial Reporting Standards (IFRS) as issued by the International Accounting Standards Board (IASB) applicable to the preparation of interim financial statements, including International Accounting Standard 34 (IAS 34), Interim Financial Reporting, unless otherwise noted.
We also utilize non-IFRS financial measures to assess our overall performance. Details of non-IFRS measures used are outlined in the ‘Key Performance Indicators, Additional IFRS and Non-IFRS Measures’ section, which provides calculations of the non-IFRS measures.
All dollar amounts are in Canadian dollars unless otherwise indicated. Throughout this discussion, percentage changes are calculated based on numbers rounded to the decimals that appear in this MD&A. Results, except per share information, and are presented in millions of dollars. Certain totals, subtotals and percentages may not reconcile due to rounding.
There have been no material changes to the information discussed in the following sections of the 2014 Annual MD&A: ‘Intercompany and Related Party Transactions’ and ‘Government Regulations.’ Refer to page 20 of this MD&A for changes related to risk factors and management of risk and contractual obligations.
Our Business AGF Management Limited (AGF or the Company), with $33.3 billion in assets under management (AUM) as at August 31, 2015, is one of the largest independent Canadian-based investment management firms, with operations and investments in Canada, the United States, the United Kingdom, Ireland and Asia.
The origin of our Company dates back to 1957 with the introduction of the American Growth Fund, the first mutual fund available to Canadians seeking to invest in the United States. As of August 31, 2015, our products and services include a diverse lineup of investment solutions for retail, institutional and high-net-worth clients. Our multi-disciplined investment management teams have expertise across the balanced, fixed income, equity and specialty asset categories and are located in Toronto, London (Ontario), Dublin and Singapore.
Our retail business delivers a wide range of products across a number of investment strategies, including AGF mutual funds, the AGF Elements portfolios and the Harmony Private Investment Program. Our products are delivered through multiple channels, including advisors, financial planners, banks, life insurance companies and brokers. We have sales organizations located across Canada serving regional advisors and their clients, while our strategic accounts team serves our corporate distribution partners.
Our institutional business offers a variety of investment mandates through pooled funds and segregated accounts. Our global institutional business provides investment management services for a variety of clients including institutions, pension funds, foundations, sovereign wealth funds and endowments. We offer a diverse range of investment strategies and have sales and client service offices in Toronto, London (Ontario), Boston, Dublin, London (England), Hong Kong and Beijing.
Our high-net-worth business delivers investment management and counselling services in local markets. It includes the operations of Cypress Capital Management Limited in Vancouver; Highstreet Asset Management (Highstreet) in London, Ontario; and Doherty & Associates in Ottawa and Montreal.
We hold a 50.0% interest in InstarAGF Inc. (InstarAGF), a joint venture with Instar Group Inc. (Instar), to develop an alternative asset management platform offering new alternative investment products to support our retail, institutional and high-net-worth channels. InstarAGF holds a 37.0% interest in Stream Asset Financial Management LP (SAFMLP), manager of a midstream oil and gas infrastructure fund. All income earned through the interest in SAFMLP is allocated to AGF. In addition, InstarAGF expects to achieve first close of its essential infrastructure fund with external investors in the fourth quarter of 2015. AGF is a cornerstone investor in this fund, with $104.0 million of capital invested as at August 31, 2015. Upon close of the fund, the Company will receive a return of its capital in excess of its proportionate participation. The fund will invest in utilities, civil, social and power infrastructure assets, including renewable energy.

Management’s Discussion and Analysis of Financial Condition and Results of Operations
AGF Management Limited – 6 – Third Quarter Report 2015
We hold a 31.9% interest in Smith & Williamson Holdings Limited (S&WHL), a leading independent private client investment management, financial advisory and accounting group based in the UK. S&WHL is one of the top 10 largest firms of accountants in the UK and its investment management business has over £15.6 billion of funds under management and advice as at August 31, 2015.
For the purposes of this discussion, the operations of AGF and our subsidiary companies are referred to as ‘we,’ ‘us,’ ‘our,’ ‘the firm,’ or ‘the Company.’
Our Strategy AGF is a global firm focused exclusively on investment management, with investment research capabilities and institutional sales offices in Canada and abroad. The Company believes that superior investment performance and product innovation are key to its success. It also believes strongly in diversification, both in terms of investment styles and product solutions offered to clients, and in the client segments in which it operates.
Measuring long-term shareholder growth, we look to the following KPIs:
• AUM growth • Revenue growth driven by new sales, investment performance and client retention • Earnings before interest, taxes, depreciation and amortization (EBITDA) growth • Pre-tax margins
Improvement in these measures is expected to result in improved cash flows as well as improved return on equity. We believe in creating value to our shareholders through share buybacks, dividend payments and reinvesting in our business.
Our strategy also recognizes that our business will experience cycles related to the global stock markets, credit availability, employment levels and other economic factors. We believe that a successful strategy is founded on the ability of our operations to effectively operate through economic downturns and upturns by controlling cost and maintaining an effective operating infrastructure.
Our Priorities and Progress AGF is committed to our mission of ‘Helping Investors Succeed.’ Our three key priorities are:
• Deliver consistent investment performance, • Offering our advisors and clients innovative product solutions, • Driving growth through the development of an alternative asset platform.
Improving Investment Performance We are focused on improving our investment performance. We are supporting our investment platforms and ensuring we have the requisite investment management talent to achieve our stated goal. During the past 12 months, as part of an overall review of our investment management function, we have identified and acted upon a number of initiatives with the goal to improve investment performance. This included a review of our investment management teams to identify areas where additional talent and support were required and we are adding resources to enhance those teams. In addition, we have made significant enhancements in our back office processes, including the implementation of a new risk analytic system and the conversion to a new trade order management system. For the one-year period ended August 31, 2015, 45% of ranked AUM performed above median, compared to 46% for the one-year period ended August 31, 2014, while for the three-year period ended August 31, 2015, 48% of ranked AUM performed above median, compared to 25% for the three-year period ended August 31, 2014.
Offering Our Advisors and Clients Innovative Product Solutions Our strategy is to provide our advisors and clients a product platform that offers innovative solutions around specific needs, resulting in organic AUM growth.
• During the quarter we announced a new partnership with FFCM LLC (FFCM), a U.S.-based advisor that manages market- and sector-neutral ETFs and a number of ETF managed strategies. FFCM, along with Highstreet, have taken over advisor duties relating to AGF U.S. AlphaSector Class, which was renamed to AGF U.S. Sector Class.
• On September 15, 2015, we announced the launch of the AGF Flex Asset Allocation Fund, a global multi-asset class solution with dynamic asset allocation. The fund will be advised by State Street Global Advisors.
• During the past three years, we have addressed investor needs related to rising rates and market volatility with the launch of several funds, including AGF U.S. Sector Class, AGF Floating Rate Income Fund and AGF Focus Funds.

Management’s Discussion and Analysis of Financial Condition and Results of Operations
AGF Management Limited – 7 – Third Quarter Report 2015
• During 2015, in response to the continuing demand for fee-based products, AGF announced the reduction of management fees on select funds offering a fee-based series (Series F) to help advisors that wish to transition to a fee-based business model. In addition, we announced an expansion of the number of funds offered under AGF’s Gold Label offering. AGF Gold Label provides affluent investors with access to reduced pricing based on the amount they invest as well as the opportunity to reduce pricing further through household and account aggregation.
• We intend to develop products that leverage our capability in the alternative asset categories. • We are actively promoting the AGF brand, ensuring brand recognition throughout the market. During the past two
years, we have made a significant investment in our brand. Based on the results of a recent Credo brand perception survey completed by over 1,000 advisors, AGF’s brand recognition and perception showed the greatest improvement amongst all the firms over the past year.
Developing an Alternative Asset Platform and Driving Organic Growth Our strategy is to leverage our world-class global equity capabilities and distribute our products through structures and platforms that work within their local markets. To date, we have made the following advancements:
• Through InstarAGF we have launched an alternative asset management platform that has $268.0 million of fee-bearing AUM as at August 31, 2015 (2014 – $210.0 million). AGF has committed a total of $150.0 million to funds and investments associated with the alternative asset management platform. This includes a $50.0 million commitment to Stream Asset Financial LP (Stream), a midstream oil and gas infrastructure fund with equity commitments of approximately $210.0 million. As at August 31, 2015, AGF had invested a total of $33.4 million in Stream, with $16.6 million remaining committed capital to be invested in the Stream fund. During the three months ended August 31, 2015, Stream monetized one of its seed assets, which resulted in the Company receiving $15.9 million in the form of a special distribution, of which $10.1 million represented a return of capital and $5.7 million represented a special distribution that was recognized as income.
• On January 27, 2015, InstarAGF announced the acquisition of the Billy Bishop Toronto City Airport passenger terminal by Nieuport Aviation Infrastructure Partners GP, a consortium of Canadian and international investors led by InstarAGF. AGF has committed and invested $103.4 million related to this investment, which will be a cornerstone asset for the essential infrastructure fund. The fund is expected to achieve its first closing with external investors in the fourth quarter of 2015, at which point the Company will receive a return of its capital in excess of its proportionate participation.
Summary of Key Financial and Operational Results for the Third Quarter of 2015: • Total AUM was 7.5%, or $2.7 billion, lower than May 31, 2015. Market volatility during the quarter represented $1.9
billion of this decline. • Retail AUM was $18.2 billion, as compared to $19.9 billion at August 31, 2014. • Retail fund gross sales increased 11.9% for the three months ended August 31, 2015, compared to the three months
ended August 31, 2014. • Retail fund net redemptions improved 5.9% to $415.0 million for the three months ended August 31, 2015, compared
to net redemptions of $441.0 million for the three months ended August 31, 2014. • Institutional AUM was $10.5 billion, compared to $12.4 billion at August 31, 2014, reflecting the impact of market
volatility as well as the redemption of a large mandate that was sub-advised on behalf of a strategic partner. • For the one-year period ended August 31, 2015, 45% of ranked AUM performed above median, compared to 46% at
August 31, 2014. For the three-year period ended August 31, 2015, 48% of ranked AUM performed above median, compared to 25% at August 31, 2014.
• We delivered value directly to our shareholders through dividend payments and share repurchases. During the third quarter of 2015, we paid dividends of $0.08 per share (2014 – $0.27 per share). Dividends paid, including dividends reinvested, on Class A Voting common shares and Class B Non-Voting shares were $6.5 million in the third quarter of 2015, compared to $23.2 million in the third quarter of 2014. Under the normal course issuer bid, 2,120,924 Class B Non-Voting shares were repurchased for a total consideration of $13.4 million at an average price of $6.32 per share.
• Revenue from continuing operations was $115.8 million, compared to $116.9 million in the same period of 2014, reflecting lower average AUM levels and overall reduction in the fee revenue rate.

Management’s Discussion and Analysis of Financial Condition and Results of Operations
AGF Management Limited – 8 – Third Quarter Report 2015
• During the three months ended August 31, 2015, Stream monetized one of its seed assets, which resulted in the Company receiving $15.9 million in the form of a special distribution, of which $10.1 million represented a return of capital and $5.7 million represented a special distribution that was recognized as income.
• EBITDA from continuing operations was $31.8 million in the third quarter of 2015, compared to $38.5 million in the same period of 2014. EBITDA margin was 27.5%, compared to 32.9% in the third quarter of 2014.
• Diluted earnings per share (EPS) from continuing operations for the three months ended August 31, 2015 was $0.14, compared to $0.17 in 2014.
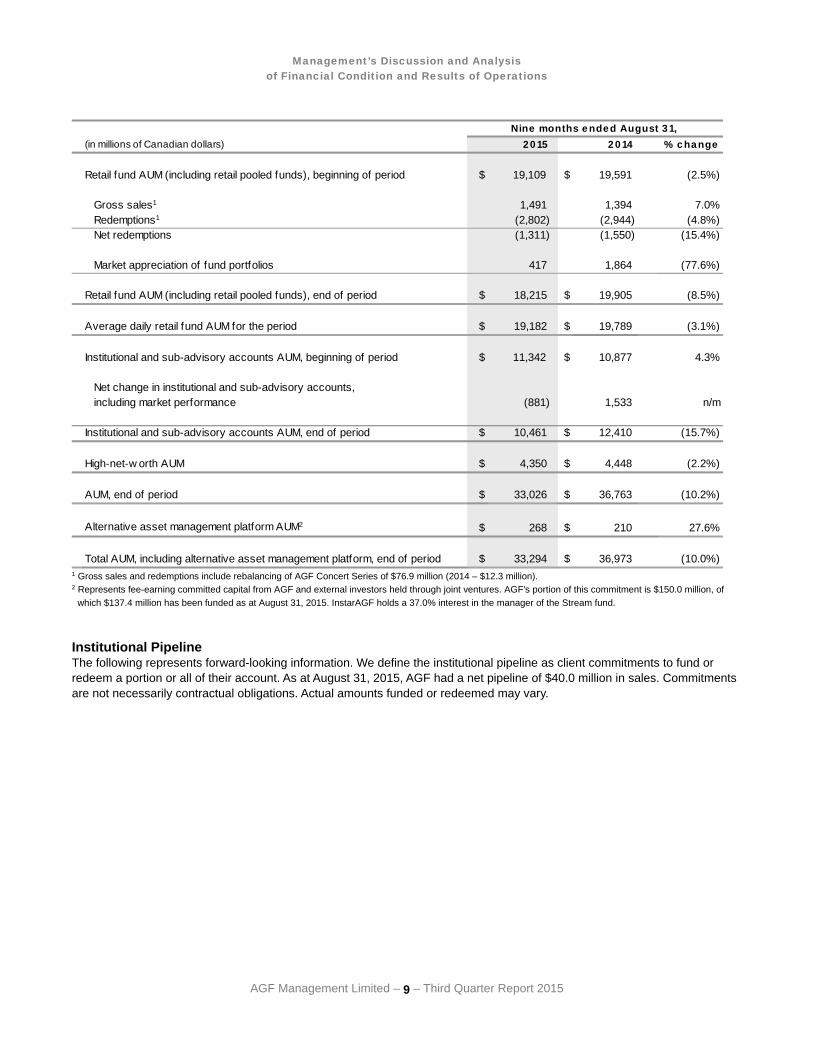
Assets Under Management The following table illustrates the composition of the changes in total AUM during the three and nine months ended August 31, 2015 and 2014:
(in millions of Canadian dollars) % c hange
Retail fund AUM (including retail pooled funds), beginning of period $ 19,355 $ 19,723 (1.9%)
Gross sales 413 369 11.9%Redemptions (828) (810) 2.2%Net redemptions (415) (441) (5.9%)
Market appreciation (depreciation) of fund portfolios (725) 623 n/m
Retail fund AUM (including retail pooled funds), end of period $ 18,215 $ 19,905 (8.5%)
Average daily retail fund AUM for the period $ 18,967 $ 19,842 (4.4%)
Institutional and sub-advisory accounts AUM, beginning of period $ 11,749 $ 11,950 (1.7%)
Net change in institutional and sub-advisory accounts, including market performance (1,288) 460 n/m
Institutional and sub-advisory accounts AUM, end of period $ 10,461 $ 12,410 (15.7%)
High-net-w orth AUM $ 4,350 $ 4,448 (2.2%)
AUM, end of period $ 33,026 $ 36,763 (10.2%)
Alternative asset management platform AUM1 $ 268 $ 210 27.6%
Total AUM, including alternative asset management platform, end of period $ 33,294 $ 36,973 (10.0%)
20 15 2 0 14Thre e months e nded August 3 1,
1 Represents fee-earning committed capital from AGF and external investors held through joint ventures. AGF's portion of this commitment is $150.0 million, of
which $137.4 million has been funded as at August 31, 2015. InstarAGF holds a 37.0% interest in the manager of the Stream fund.
Management’s Discussion and Analysis of Financial Condition and Results of Operations
AGF Management Limited – 9 – Third Quarter Report 2015
(in millions of Canadian dollars) 20 15 2 0 14 % c hange
Retail fund AUM (including retail pooled funds), beginning of period $ 19,109 $ 19,591 (2.5%)
Gross sales1 1,491 1,394 7.0%Redemptions1 (2,802) (2,944) (4.8%)Net redemptions (1,311) (1,550) (15.4%)
Market appreciation of fund portfolios 417 1,864 (77.6%)
Retail fund AUM (including retail pooled funds), end of period $ 18,215 $ 19,905 (8.5%)
Average daily retail fund AUM for the period $ 19,182 $ 19,789 (3.1%)
Institutional and sub-advisory accounts AUM, beginning of period $ 11,342 $ 10,877 4.3%
Net change in institutional and sub-advisory accounts, including market performance (881) 1,533 n/m
Institutional and sub-advisory accounts AUM, end of period $ 10,461 $ 12,410 (15.7%)
High-net-w orth AUM $ 4,350 $ 4,448 (2.2%)
AUM, end of period $ 33,026 $ 36,763 (10.2%)
Alternative asset management platform AUM2 $ 268 $ 210 27.6%
Total AUM, including alternative asset management platform, end of period $ 33,294 $ 36,973 (10.0%)
Nine months e nded August 3 1,
1 Gross sales and redemptions include rebalancing of AGF Concert Series of $76.9 million (2014 – $12.3 million). 2 Represents fee-earning committed capital from AGF and external investors held through joint ventures. AGF's portion of this commitment is $150.0 million, of
which $137.4 million has been funded as at August 31, 2015. InstarAGF holds a 37.0% interest in the manager of the Stream fund.
Institutional Pipeline The following represents forward-looking information. We define the institutional pipeline as client commitments to fund or redeem a portion or all of their account. As at August 31, 2015, AGF had a net pipeline of $40.0 million in sales. Commitments are not necessarily contractual obligations. Actual amounts funded or redeemed may vary.

Management’s Discussion and Analysis of Financial Condition and Results of Operations
AGF Management Limited – 10 – Third Quarter Report 2015
Consolidated Operating Results The table below summarizes our consolidated operating results for the three and nine months ended August 31, 2015 and 2014:
(in millions, except per share data) 2 015 20 14 % c ha nge 2 0 15 2 014 % cha nge
IncomeManagement and advisory fees $ 105.3 $ 109.6 (3.9%) $ 315.5 $ 328.0 (3.8%) Deferred sales charges 2.2 2.7 (18.5%) 7.2 10.0 (28.0%) Share of profit of associate and joint ventures 2.0 2.6 (23.1%) 10.2 8.9 14.6% Fair value adjustments and other income1 6.3 2.0 215.0% 11.7 5.9 98.3%
115.8 116.9 (0.9%) 344.6 352.8 (2.3%)
ExpensesSelling, general and administrative2 50.1 43.8 14.4% 141.4 130.9 8.0% Trailing commissions 32.7 33.0 (0.9%) 97.5 96.9 0.6% Investment advisory fees 1.2 1.6 (25.0%) 4.0 4.5 (11.1%)
84.0 78.4 7.1% 242.9 232.3 4.6%
EBITDA from continuing operations3 31.8 38.5 (17.4%) 101.7 120.5 (15.6%) Amortization, derecognition and depreciation 13.5 16.1 (16.1%) 40.1 49.3 (18.7%) Interest expense 2.4 2.8 (14.3%) 8.1 8.8 (8.0%)
Income before taxes 15.9 19.6 (18.9%) 53.5 62.4 (14.3%)
Income taxes 4.0 4.8 (16.7%) 13.4 15.9 (15.7%) Net income from continuing operations, net of tax 11.9 14.8 (19.6%) 40.1 46.5 (13.8%)
Net income from discontinued operations, net of tax – – n/m – 2.8 n/m
Net income for the period $ 11.9 $ 14.8 (19.6%) $ 40.1 $ 49.3 (18.7%)
Diluted earnings per shareFrom continuing operations $ 0.14 $ 0.17 (17.6%) $ 0.48 $ 0.54 (11.1%) From discontinued operations – – n/m – 0.03 n/m
Diluted earnings per share $ 0.14 $ 0.17 (17.6%) $ 0.48 $ 0.57 (15.8%)
T hree mo nths ended A ugust 31, N ine mo nths ended A ugust 31,
1 Fair value adjustments and other income include a $5.7 million special distribution from a long-term investment for the three and nine months ended August 31, 2015. 2 Selling, general and administrative expenses include restructuring costs of $4.4 million for the three and nine months ended August 31, 2015. 3 For the definition of EBITDA, see the ‘Key Performance Indicators, Additional IFRS and Non-IFRS Measures’ section. The items required to reconcile EBITDA to net income from continuing operations, a defined term under IFRS, are detailed above.

Management’s Discussion and Analysis of Financial Condition and Results of Operations
AGF Management Limited – 11 – Third Quarter Report 2015
One-time Adjustments The table below summarizes one-time adjustments for the three and nine months ended August 31, 2015:
($ millions, except per share data) 20 15 2 014 % cha nge 20 15 2 014 % cha nge
EBITDA from continuing operations $ 31.8 $ 38.5 (17.4%) $ 101.7 $ 120.5 (15.6%)
Add (deduct):Special distribution from a long-term investment (5.7) – n/m (5.7) – n/mRestructuring costs 4.4 – n/m 4.4 – n/m
Adjusted EBITDA from continuing operations $ 30.5 $ 38.5 (20.9%) $ 100.4 $ 120.5 (16.7%)
Net income from continuing operations $ 11.9 $ 14.8 (19.6%) $ 40.1 $ 46.5 (13.8%)
Add (deduct):Adjustments to EBITDA from above (1.3) – n/m (1.3) – n/mTax impact on the adjustments to EBITDA above (0.4) – n/m (0.4) – n/m
Adjusted net income from continuing operations $ 10.2 $ 14.8 (31.4%) $ 38.4 $ 46.5 (17.5%)
Adjusted diluted EPS from continuing operations $ 0.12 $ 0.17 (29.4%) $ 0.46 $ 0.54 (14.8%)
T hree mo nths ended A ugust 31, N ine mo nths ended A ugust 31,
Revenue For the three and nine months ended August 31, 2015, revenue decreased by 0.9% and 2.3% over the previous year, with changes in the categories as follows:
Management and Advisory Fees Management and advisory fees are directly related to our AUM levels. Lower average daily retail fund AUM and a decline in institutional and sub-advisory accounts AUM, combined with a reduction in higher fee-earning investment assets offset by an increase in lower fee-earning assets, contributed to a decrease of 3.9% and 3.8% in management and advisory fees revenue compared to the three and nine months ended August 31, 2014. Deferred Sales Charges (DSC) We receive deferred sales charges upon redemption of securities sold on the contingent DSC or low-load commission basis for which we finance the selling commissions paid to the dealer. The DSC ranges from 1.5% to 5.5%, depending on the commission option of the original subscription price of the funds purchased if the funds are redeemed within the first two years, and declines to zero after three or seven years. DSC revenue fluctuates based on the level of redemptions, the age of the assets being redeemed and the proportion of redemptions composed of back-end assets. DSC revenues decreased by 18.5% and 28.0% for the three and nine months ended August 31, 2015 as compared to 2014, reflecting redemptions of a larger proportion of older, lower-yielding DSC assets.
Share of Profit of Associate and Joint Ventures Share of profit of associate and joint ventures decreased to $2.0 million and increased to $10.2 million for the three and nine months ended August 31, 2015, respectively, compared to $2.6 million and $8.9 million during the same period in 2014. Earnings in S&WHL’s business declined during the third quarter due to the impact of global markets. Earnings in SAFMLP declined during the third quarter, reflecting the monetization of a seed asset. For additional information see Note 5 of the condensed consolidated interim financial statements. A breakdown is as follows:
($ millions) 2 014
Share of profit of S&WHL $ 1.8 $ 2.2 Share of profit of joint ventures (SAFMLP) 0.2 0.4
$ 2.0 $ 2.6
T hree mo nths ended A ugust 31,
2 0 15

Management’s Discussion and Analysis of Financial Condition and Results of Operations
AGF Management Limited – 12 – Third Quarter Report 2015
($ millions) 2 014
Share of profit of S&WHL $ 9.7 $ 8.6 Share of profit of joint ventures (SAFMLP) 0.5 0.3
$ 10.2 $ 8.9
2 0 15N ine mo nths ended A ugust 31,
Fair Value Adjustments and Other Income The following table illustrates the fair value adjustments and other income for the three and nine months ended August 31, 2015 and 2014:
($ millions) 2 0 15 2 0 14
Fair value adjustment related to investment in AGF mutual funds $ (1.7) $ 0.5 Fair value adjustment and distributions from alternative asset management platform 2.3 0.1 Special distribution from long-term investment 5.7 – Interest income 0.1 1.3 Other (0.1) 0.1
$ 6.3 $ 2.0
T hree mo nths ended A ugust 31,
($ millions) 2 0 15 2 0 14
Fair value adjustment related to investment in AGF mutual funds $ (0.8) $ 0.8 Fair value adjustment related to acquisition consideration payable – 0.4 Fair value adjustment and distributions from alternative asset management platform 5.9 0.6 Special distribution from long-term investment 5.7 – Interest income 0.9 3.6 Other – 0.5
$ 11.7 $ 5.9
N ine mo nths ended A ugust 31,
During the three and nine months ended August 31, 2015, we recorded income of $2.3 million and $5.9 million (2014 –
$0.6 million and $0.6 million) as fair value adjustment and income distributions related to the investments in our alternative asset management platform. This consisted of distributions of $0.7 million and $2.4 million (2014 – $0.3 million and $0.7 million) related to our participation in Stream, net of return of capital, and $1.6 million and $3.4 million (2014 – $0.2 million and $0.1 million in charges) related to the mark to market adjustment related to our participation in Stream and the essential infrastructure fund for the three and nine months ended August 31, 2015. During the three and nine months ended August 31, 2015, Stream monetized one of its seed assets, which resulted in the Company receiving a special distribution of $15.9 million, of which $10.1 million represented a return of capital and $5.7 million was recognized as distribution income.
Expenses For the three and nine months ended August 31, 2015, expenses increased 7.1% and 4.6% as compared to 2014. Changes in specific categories are described in the discussion that follows: Selling, General and Administrative Expenses Selling, general and administrative (SG&A) expenses increased by $6.3 million and $10.5 million for the three and nine months ended August 31, 2015, compared to the same period in 2014. Excluding one-time restructuring costs, SG&A increased $1.9 million and $6.1 million for the three and nine months ended August 31, 2015, compared to the same period in 2014.

Management’s Discussion and Analysis of Financial Condition and Results of Operations
AGF Management Limited – 13 – Third Quarter Report 2015
A breakdown of the movement in SG&A is as follows:
(in millions of Canadian dollars)
Increase (decrease) in salaries and benefits expenses $ 0.2 $ (0.6)Increase (decrease) in stock-based compensation expenses (0.1) 3.1 Increase in restructuring expenses 4.4 4.4 Decrease in fund absorption expenses and other fund costs (0.4) (1.0)Increase in information technology and facilities costs 0.6 1.1 Increase in professional fees 0.5 0.2 Increase in harmonized sales tax provision 0.4 1.8 Increase in other expenses 0.7 1.5
$ 6.3 $ 10.5
Thre e months e nde d August 3 1, 2 015
Nine months e nde d August 3 1, 2 015
The following explains expense changes in the three and nine months ended August 31, 2015, compared to the same
period in the prior year: • Salaries and benefits expenses increased $0.2 million for the three months ended August 31, 2015 and decreased
$0.6 million for the nine months ended August 31, 2015, compared to the prior year. The decrease in expenses reflects lower salaries and performance-based compensation.
• Stock-based compensation decreased $0.1 million for the three months ended August 31, 2015 and increased $3.1 million for the nine months ended August 31, 2015, compared to the same period in 2014. During the first quarter of 2014, AGF amended its plan agreements to effectively hedge the expense related to Restricted Share Units. The related liability up to that date was marked to market, resulting in an expense recovery in the first quarter of 2014. For additional information, refer to Note 3.14 of AGF’s 2014 Annual Consolidated Financial Statements.
• During the three and nine months ended August 31, 2015, we recognized $4.4 million in restructuring costs related to a reduction in staff levels.
• Absorption and other fund costs expenses decreased $0.4 million and $1.0 million for the three and nine months ended August 31, 2015, as a result of lower absorption and lower fund reorganization costs.
• Information technology and facilities costs increased $0.6 million and $1.1 million for the three and nine months ended August 31, 2015, reflecting investments in our back office process, including the implementation of a new risk analytic system and the conversion to a new trade order management system.
• Professional fees increased $0.5 million and $0.2 million for the three and nine months ended August 31, 2015, due to an increase in legal fees related to ongoing tax matters.
• Harmonized sales tax provision increased $0.4 million and $1.8 million for the three and nine months ended August 31, 2015, compared to the same periods in 2014. During the nine months ended August 31, 2014, the provision included one-time tax recoveries of $1.2 million.
• Other expenses increased $0.7 million and $1.5 million for the three and nine months ended August 31, 2015, due to higher sales and marketing expenses.
Trailing Commissions Trailing commissions paid to distributors depend on total AUM, the proportion of mutual fund AUM sold on a front-end versus back-end commission basis and the proportion of equity fund AUM versus fixed-income fund AUM. Annualized trailing commissions as a percentage of average daily retail fund AUM increased to 0.69% and 0.68% for the three and nine months ended August 31, 2015, compared to 0.67% and 0.65% in the same period of 2014, reflecting an increase in rates associated with mature assets and a change in the mix of AUM.
Investment Advisory Fees External investment advisory fees decreased $0.4 million and $0.5 million for the three and nine months ended August 31, 2015, as compared to the same periods in 2014, reflecting lower AUM levels.
EBITDA, EBITDA Margin and EBITDA per Share As a result of the factors explained above, EBITDA from continuing operations was $31.8 million and $101.7 million for the three and nine months ended August 31, 2015, a decrease from $38.5 million and $120.5 million for the same period of 2014.

Management’s Discussion and Analysis of Financial Condition and Results of Operations
AGF Management Limited – 14 – Third Quarter Report 2015
EBITDA margin was 27.5% and 29.5% for the three and nine months ended August 31, 2015, compared to 32.9% and 34.2% in the corresponding periods in 2014. Diluted EBITDA per share from continuing operations for the three and nine months ended August 31, 2015 was $0.38 and $1.21, compared to $0.45 and $1.39 for the three and nine months ended August 31, 2014.
Amortization and Interest Expense The category represents amortization of deferred selling commissions, customer contracts, other intangible assets, property, equipment, and computer software and interest expense. Deferred selling commissions amortization represents the most significant category of amortization. We internally finance all selling commissions paid. These selling commissions are capitalized and amortized on a straight-line basis over a period that corresponds with their applicable DSC schedule. Unamortized deferred selling commissions related to units redeemed prior to the end of the schedule are immediately expensed. Amortization and derecognition expense related to deferred selling commissions was $11.1 million and $31.7 million for the three and nine months ended August 31, 2015, compared to $12.7 million and $37.5 million for the same periods of 2014. During the three months ended August 31, 2015, we paid $8.3 million in selling commissions, compared to $7.8 million in the same period of 2014, reflecting higher DSC sales. During the nine months ended August 31, 2015, we paid $28.7 million in selling commissions, compared to $29.8 million in the same period of 2014, reflecting lower DSC sales. As at August 31, 2015, the unamortized balance of deferred selling commissions financed was $101.7 million (November 30, 2014 – $104.8 million).
Customer contracts amortization and derecognition decreased $0.4 million and $0.4 million for the three and nine months ended August 31, 2015, as a result of a lower carrying value. Customer contracts are immediately expensed upon redemption of the AUM.
Other intangibles amortization and derecognition decreased $0.6 million and $2.4 million for the three and nine months ended August 31, 2015, as a result of a lower carrying value.
Interest expense decreased as a result of lower average debt levels.
Income Tax Expense Income tax expense related to continuing operations for the three and nine months ended August 31, 2015 was $4.0 million and $13.4 million, compared to $4.8 million and $15.9 million in the corresponding periods in 2014. The estimated effective tax rate for the nine months ended August 31, 2015 was 25.0% (2014 – 25.5%).
The Company believes that it has adequately provided for income taxes based on all of the information that is currently available. The calculation of income taxes in many cases, however, requires significant judgement in interpreting tax rules and regulations. The Company’s tax filings are subject to audits, which could materially change the amount of the current and deferred income tax assets and liabilities, and could, in certain circumstances, result in the assessment of interest and penalties.
In November 2013, the Company received a notice of reassessment (NOR) from the CRA relating to the transfer pricing and allocation of income between one of the Company’s Canadian legal entities and a foreign subsidiary, which would increase the Company’s taxes payable from its original tax filings by $10.0 million, $10.5 million and $15.4 million (before the application of interest and penalties of $21.6 million) for its 2005, 2006 and 2007 fiscal years, respectively. In November 2014, the Company also received a NOR from the CRA relating to the same matter, which would increase the Company’s taxes payable from its original tax filings by $13.6 million (before the application of any interest and penalties of $6.3 million) for its 2008 fiscal year.
The Company strongly disagrees with the CRA’s position and filed an objection to the NOR for 2005, 2006 and 2007 in February 2014 and also objected to the NOR for 2008 in February 2015. In connection with the filing of an objection to the NOR for the 2008 fiscal year, the Company was required to pay, and has paid, approximately $14.5 million (including interest and penalties) during the nine months ended August 31, 2015, even though the ultimate outcome may differ from this amount. The Company is not expected to make any further significant payments with respect to the 2005 to 2008 NOR until the resolution of this matter. Including the payments made during the nine months ended August 31, 2015, the Company has paid approximately $54.0 million with respect to the 2005 to 2008 NOR. In June 2015, the Company has received a $2.0 million refund from taxation authorities for interest relief granted with respect to the 2005-2007 NOR.
In consultation with its external advisors, the Company believes that its tax filing positions continue to be reasonable based on its transfer pricing methodology and the Company is contesting the CRA’s position and any related transfer pricing penalty. The Company believes it is likely that the CRA will reassess its taxes for subsequent years on a similar basis and that these may result in future cash payments on receipt of the reassessments. During the nine months ended August 31, 2015, the Company has recorded a tax provision of $1.1 million (2014 – $1.4 million) in relation to this transfer pricing audit. The amount of tax provision recorded on the consolidated interim statement of financial position reflects management’s best estimate of the final payment to be made on the ultimate resolution of this matter and includes any related estimated interest and penalties for the 2005 to 2015 fiscal years.

Management’s Discussion and Analysis of Financial Condition and Results of Operations
AGF Management Limited – 15 – Third Quarter Report 2015
Further to the Company’s objection to the NOR, the Company is also seeking Competent Authority relief from double taxation under the applicable tax treaty. The Company’s provision, which reflects its best estimate of the final payment to be made on the ultimate resolution of this matter, includes an expected recovery of approximately $14.8 million for the tax years 2005 through 2010. Any relief from double taxation should be granted at the completion of the mutual agreement procedures (“MAP”) under the applicable tax treaty.
In 2013, the Company was accepted by the CRA into a Bilateral Advance Pricing Arrangement (BAPA) between Canada and the relevant tax authorities to establish the appropriate transfer pricing methodologies for the tax years 2009 through 2016. However, due to time limitation on the applicable tax treaty, the Company was subsequently informed by the CRA during the third quarter of 2015 that tax years 2009 and 2010 are no longer covered under the BAPA. The Company is therefore subject to transfer pricing reassessments from the CRA for 2009 and 2010, and any relief from double taxation shall be granted at the completion of the MAP as described above. Under a BAPA, the taxpayer can avoid potential double taxation on transactions covered by the BAPA according to the provisions of the income tax treaty between Canada and the foreign country.
The final result of the audit and appeals process may vary and may be materially different compared to the estimates and assumptions used by management in determining the Company’s consolidated income tax provision and in valuing its income tax assets and liabilities.
In May 2015, the Company received a proposal letter from the CRA relating to foreign accrual property income (FAPI) earned by its foreign subsidiaries for the 2007 to 2012 fiscal years. The 2007 fiscal year has since been statute-barred. The Company strongly disagrees with the CRA’s position on technical merits and responded to the proposal letter accordingly. In September 2015, as a result of further review, the CRA has withdrawn its proposal on this issue for the 2008 to 2012 fiscal years. The amount of taxes payable reflected in the proposal letter from the CRA in respect of the FAPI issue was estimated at $20.3 million for the 2008 to 2012 fiscal years (excluding any interest and penalties of $7.8 million accrued up to August 31, 2015). Despite the withdrawal of the proposal letter, the audit for the 2008 to 2012 fiscal years continues. Management continues to believe that its tax position is correct and has not recorded a provision for this issue.
In July 2015, the Company received a NOR from the CRA denying $30.5 million of tax-related benefits acquired and utilized by the Company in the 2005 fiscal year. The NOR would increase the Company’s taxes payable from its original tax filings by $10.9 million (before the application of interest and penalties of $9.7 million). The Company strongly disagrees with the CRA’s position and will object to the NOR.
As a result of receiving the NOR, the Company has paid $5.9 million (including interest and penalties) during the nine months ended August 31, 2015. Such payment was recorded as a receivable in the income tax liability on the consolidated interim statement of financial position. The ultimate outcome of this matter is not yet determinable.
In consultation with its external advisors, the Company believes that its tax position is probable of being sustained and, as a result, has not recorded a provision in relation to this matter. The outcome of the NOR and anticipated objection is highly uncertain and the final result may vary compared to the estimates and assumptions used by management in determining the Company’s consolidated income tax provision and in valuing its tax assets and liabilities. Depending on the ultimate outcome of this matter, there may be a material impact on the Company’s financial position, results of operations and cash flows.
Net Income The impact of the above revenue and expense items resulted in a net income from continuing operations of $11.9 million and $40.1 million for the three and nine months ended August 31, 2015, as compared to net income from continuing operations of $14.8 million and $46.5 million in the corresponding periods in 2014.
Earnings per Share Diluted earnings per share from continuing operations were $0.14 and $0.48 for the three and nine months ended August 31, 2015, as compared to earnings of $0.17 and $0.54 in the corresponding periods of 2014.
Discontinued Operations On August 1, 2012, the Company completed its sale of 100% of the shares of AGF Trust for cash consideration corresponding to the net book value of AGF Trust at closing of $246.3 million. The agreement included a contingent consideration to a maximum of $20.0 million over five years if the credit performance of AGF Trust’s loan portfolio met certain thresholds. In May 2014, the Company finalized an early settlement of the contingent consideration receivable for $10.0 million. The amount receivable was settled on June 4, 2014. During the nine months ended August 31, 2014, the Company realized a gain on discontinued operations related to this settlement of $3.9 million, or $2.8 million after tax. In addition, the Company indemnified the purchaser of AGF Trust against unenforceable loans outstanding or committed as at the date of closing, which may be put back to the Company on a quarterly basis, subject to certain conditions. The put option will expire on October 31, 2017 and

Management’s Discussion and Analysis of Financial Condition and Results of Operations
AGF Management Limited – 16 – Third Quarter Report 2015
indemnifies only against errors in underwriting and not credit deterioration. The carrying value of the loans subject to indemnification was $3.1 billion at the date of sale. The Company records a provision for indemnified loans when a loan is in default and the put option becomes probable of being exercised, which generally coincides with the receipt of notification by the purchaser that it intends to exercise the put. During the three and nine months ended August 31, 2015, the Company recorded a provision of nil (2014 – nil).
Liquidity and Capital Resources As at August 31, 2015, the Company had total cash and cash equivalents of $50.4 million. Free cash flow, as defined on page 18, generated from continuing operating activities was $17.0 million and $49.2 million for the three and nine months ended August 31, 2015, compared to $22.2 million and $60.0 million in the prior year. During the three and nine months ended August 31, 2015, we generated $3.2 million in cash and used $211.1 million in cash to fund the following:
• We invested $5.5 million and $120.8 million in the alternative asset management platform. • We received $15.9 million from Stream related to the monetization of an investment. • We repurchased a total of 2,120,924 and 5,099,964 (2014 – nil and 1,762,200) shares for $13.4 million and $36.5
million (2014 – nil and $22.1 million). • We purchased a total of 600,000 and 843,506 (2014 – 120,000 and 270,000) shares for $3.6 million and $5.5 million
(2014 – $1.5 million and $3.3 million) as treasury stock for the employee benefit trust. • We paid $6.4 million and $35.7 million in cash dividends, compared to $22.6 million and $67.7 million in 2014. • We repaid $40.0 million of long-term debt in the first quarter of 2015. • We paid $18.4 million to the CRA in relation to the ongoing tax matters. Total long-term debt outstanding at August 31, 2015 was $268.7 million (November 30, 2014 – $308.2 million). The
Company, through its subsidiary AGF Investments Inc., has a four-year unsecured revolving credit facility with a maximum aggregate principal amount of $400.0 million and includes an accordion feature providing for an additional $100.0 million. As at August 31, 2015, $124.9 million was available to be drawn. The loan facility will be available to meet future operational and investment needs. We anticipate that cash balances and cash flow from operations, together with the available loan facility, will be sufficient in the foreseeable future to implement our business plan, finance selling commissions, satisfy regulatory and tax requirements, service debt repayment obligations, pay quarterly dividends, and fund any future share buybacks.
On January 26, 2015, the Company arranged a $100.0 million bridge facility through a Canadian chartered bank to fund its alternative asset investment. The bridge facility was secured by the Company’s term deposits held by the bank and was fully repaid on February 2, 2015.
On December 9, 2014, we announced our intention to reduce the quarterly dividend in fiscal 2015 to $0.08 per share as part of our amended capital allocation strategy.
Capital Management Activities from Continuing Operations We actively manage our capital to maintain a strong and efficient capital base to maximize risk-adjusted returns to shareholders, to invest in future growth opportunities, including acquisitions, and to ensure that the regulatory capital requirements are met for each of our subsidiary companies.
AGF capital consists of shareholders’ equity and long-term debt. On an annual basis, AGF prepares a three-year plan detailing projected operating budgets and capital requirements. AGF is required to prepare and submit a three-year operating plan and budget to AGF’s Finance Committee for approval prior to seeking Board approval. AGF’s Finance Committee consists of the Chairman and CEO, the Vice-Chairman, Executive Vice-President and CFO, the Executive Vice-President and Chief Operating Officer, and President and CIO. Once approved by the Finance Committee, the three-year plans are reviewed and approved by AGF’s Board of Directors. These plans become the basis for the payment of dividends to shareholders, the repurchase of Class B Non-Voting shares and, combined with the reasonable use of leverage, the source of funds for expansion through organic growth and strategic investments.
Normal Course Issuer Bid AGF has obtained applicable regulatory approval to purchase for cancellation, from time to time, certain of its Class B Non-Voting shares through the facilities of the Toronto Stock Exchange (TSX). AGF relies on an automatic purchase plan during the normal course issuer bid. The automatic purchase plan allows for purchases by AGF of its Class B Non-Voting shares during certain pre-determined black-out periods, subject to certain parameters. Outside of these pre-determined black-out periods, shares will be purchased in accordance with management’s discretion. Under its normal course issuer bid, the Class B Non-

Management’s Discussion and Analysis of Financial Condition and Results of Operations
AGF Management Limited – 17 – Third Quarter Report 2015
Voting shares may be repurchased from time to time at prevailing market prices or such other price as may be permitted by the TSX. AGF may purchase up to 6,707,999 Class B Non-Voting shares, or 10% of the public float for such shares, through the facilities of the TSX (or as otherwise permitted by the TSX) between February 4, 2015 and February 3, 2016.
During the three months ended August 31, 2015, 2,120,924 Class B Non-Voting shares were repurchased for a total consideration of $13.4 million at an average price of $6.32 per share. During the nine months ended August 31, 2015, 5,099,964 Class B Non-Voting shares were repurchased for a total consideration of $36.5 million at an average price of $7.16 per share.
During the three months ended August 31, 2015, 600,000 Class B Non-Voting shares were purchased for the employee benefit trust for a total consideration of $3.6 million at an average price of $6.00 per share. During the nine months ended August 31, 2015, 843,506 Class B Non-Voting shares were purchased for the employee benefit trust for a total consideration of $5.5 million at an average price of $6.52 per share.
Dividends The holders of Class B Non-Voting and Class A Voting common shares are entitled to receive cash dividends. Dividends are paid in equal amounts per share on all the Class B Non-Voting shares and all the Class A Voting common shares at the time outstanding without preference or priority of one share over another. No dividends may be declared in the event that there is a default of a condition of our revolving credit facility or where such payment of dividends would create a default.
Our Board of Directors may determine that Class B Non-Voting shareholders shall have the right to elect to receive part or all of such dividend in the form of a stock dividend. They also determine whether a dividend in Class B Non-Voting shares is substantially equal to a cash dividend. This determination is based on the weighted average price at which the Class B Non-Voting shares traded on the TSX during the 10 trading days immediately preceding the record date applicable to such dividend.
The following table sets forth the dividends paid by AGF on Class B Non-Voting shares and Class A Voting common shares for the years indicated:
Ye a rs ende d Nove mber 3 0 2 015 1 2 0 14 20 13 2 0 12 2 011
Per share $ 0.51 $ 1.08 $ 1.08 $ 1.08 $ 1.07 1 Represents the total dividends paid in January 2015, April 2015, July 2015, and to be paid in October 2015.
We review our dividend distribution policy on a quarterly basis, taking into account our financial position, profitability, cash flow and other factors considered relevant by our Board of Directors. The quarterly dividend paid on July 17, 2015 was $0.08 per share. On December 9, 2014, we announced a change in our capital allocation strategy that will result in retained capital being deployed to initiatives with greater potential to increase shareholder value. As part of this strategy, the Company announced an intention to adjust the quarterly dividend to $0.08 per share on both the Class B Non-Voting shares and the Class A Voting common shares for the first quarter of 2015. This change in strategy will provide us with increased flexibility to execute our growth strategy and invest in the growth of the business, while being active in AGF’s share buyback program.
Outstanding Share Data Set out below is our outstanding share data as at August 31, 2015 and 2014. For additional detail, see Note 9 and Note 13 of the Condensed Consolidated Interim Financial Statements.
2 014
SharesClass A Voting common shares 57,600 Class B Non-Voting shares 85,857,580
Stock OptionsOutstanding options 4,940,403 Exercisable options 2,444,143
A s at A ugust 31,
57,600 80,250,635
5,720,011
2 015
2,484,363

Management’s Discussion and Analysis of Financial Condition and Results of Operations
AGF Management Limited – 18 – Third Quarter Report 2015
Key Performance Indicators, Additional IFRS and Non-IFRS Measures We measure the success of our business strategies using a number of KPIs, which are outlined below. With the exception of revenue, the following KPIs are non-IFRS measures, which are not defined under IFRS. They should not be considered as an alternative to net income attributable to equity owners of the Company or any other measure of performance under IFRS.
Revenue Revenue is a measurement defined by IFRS and is recorded net of fee rebates, sales taxes and distribution fees paid to limited partnerships. Revenue is indicative of our potential to deliver cash flow.
We derive our revenue principally from a combination of: • management and advisory fees based on AUM, • DSC earned from investors when mutual fund securities sold on a DSC basis are redeemed, • 31.9% equity interest in S&WHL, • equity interest in InstarAGF, and • long-term investments in the alternative asset management platform.
EBITDA We define EBITDA from continuing operations as earnings before interest, taxes, depreciation and amortization. EBITDA is a standard measure used in the mutual fund industry by management, investors and investment analysts to understand and compare results. We believe this is an important measure as it allows us to assess our investment management businesses without the impact of non-operational items.
Please see the Consolidated Operating Results section on page 10 of this MD&A for a schedule showing how EBITDA reconciles to our IFRS financial statements.
Free Cash Flow Free cash flow from continuing operations represents cash available for distribution to our shareholders, share buybacks and general corporate purposes. We define free cash flow from continuing operations as cash flow from operations before net changes in non-cash balances related to operations less interest paid and adjusted for certain tax items outlined below. Free cash flow is a relevant measure in the investment management business since a substantial amount of cash is spent on upfront commission payments.
($ millions) 2 014 20 15 2 014
Net cash provided by continuing operating activities $ 26.7 $ 27.8 $ 28.8 $ 3.9 Adjusted for:
Net changes in non-cash w orking capital balances related to operations (9.6) (1.7) 6.6 24.1
Taxes paid (refunded) related to transfer pricing audit and other tax contingencies 3.9 – 18.4 39.5
Interest paid (2.4) (2.9) (7.7) (8.9)Prior years' cash taxes paid (refunded) and anticipated cash taxes to be refunded (paid) related to the current year continuing operations (1.6) (1.0) 3.1 1.4
Free cash f low $ 17.0 $ 22.2 $ 49.2 $ 60.0
N ine mo nths ended A ugust 31,
20 15T hree mo nths ended A ugust 31,
EBITDA Margin EBITDA margin provides useful information to management and investors as an indicator of our overall operating performance. We believe EBITDA margin is a valuable measure because it assesses the extent we are able to earn profit from each dollar of revenue. We define EBITDA margin as the ratio of EBITDA to revenue.
($ millions) 2 0 14 2 0 15 2 0 14
EBITDA $ 31.8 $ 38.5 $ 101.7 $ 120.5 Divided by revenue 115.8 116.9 344.6 352.8 EBITDA margin 27.5% 32.9% 29.5% 34.2%
2 0 15T hree mo nths ended A ugust 31, N ine mo nths ended A ugust 31,

Management’s Discussion and Analysis of Financial Condition and Results of Operations
AGF Management Limited – 19 – Third Quarter Report 2015
Pre-tax Profit Margin Pre-tax profit margin provides useful information to management and investors as an indicator of our overall operating performance. We believe pre-tax profit margin is a valuable measure because it assesses the extent we are able to earn profit from each dollar of revenue. We define pre-tax profit margin as the ratio of income from continuing operations before taxes to revenue.
($ millions) 2 0 14 2 0 15 2 0 14
Net income from continuing operations $ 11.9 $ 14.8 $ 40.1 $ 46.5 Add: income taxes 4.0 4.8 13.4 15.9 Income before taxes $ 15.9 $ 19.6 $ 53.5 $ 62.4 Divided by revenue 115.8 116.9 344.6 352.8 Pre-tax profit margin 13.7% 16.8% 15.5% 17.7%
T hree mo nths ended A ugust 31, N ine mo nths ended A ugust 31,
2 0 15
Return on Equity (ROE) We monitor ROE to assess the profitability of the consolidated Company on an annual basis. We calculate ROE by dividing net income attributable to equity owners of the Company by average shareholders’ equity.
($ millions) 2 0 14 2 0 14
Net income from continuing operations (annualized) $ 47.6 $ 59.2 $ 53.5 $ 62.0 Divided by average shareholders' equity 911.3 944.7 919.7 953.2 Return on equity 5.2% 6.3% 5.8% 6.5%
T hree mo nths ended A ugust 31,
2 0 15 2 0 15N ine mo nths ended A ugust 31,
Long-term Debt to EBITDA Ratio Long-term debt to EBITDA ratio provides useful information to management and investors as an indicator of our ability to service our long-term debt. We define long-term debt to EBITDA ratio as long-term debt at the end of the period divided by annualized EBITDA for the period.
($ millions) 2 0 14 2 0 14
Long-term debt $ 268.7 $ 308.2 $ 268.7 $ 308.2 Divided by EBITDA (annualized) 127.2 154.0 135.6 160.7 Long-term debt to EBITDA ratio 211.2% 200.1% 198.2% 191.8%
2 0 15 2 0 15T hree mo nths ended A ugust 31, N ine mo nths ended A ugust 31,
Assets Under Management The amount of AUM and the related fee rates are important to our business as these are the drivers of our revenue from our mutual fund, institutional and sub-advisory accounts and high-net-worth relationships. AUM will fluctuate in value as a result of investment performance, sales and redemptions. Mutual fund sales and AUM determine a significant portion of our expenses because we pay upfront commissions on gross sales and trailing commissions to financial advisors as well as investment advisory fees based on the value of AUM. Investment Performance Investment performance, which represents market appreciation (depreciation) of fund portfolios and is shown net of management fees received, is a key driver of the level of AUM and is central to the value proposition that we offer advisors and unitholders. Growth in AUM resulting from investment performance increases the wealth of our unitholders, and, in turn, we benefit from higher revenues. Alternatively, poor investment performance will reduce our AUM levels and result in lower management fee revenues. Strong relative investment performance may also contribute to growth in gross sales or reduced levels of redemptions. Conversely, poor relative investment performance may result in lower gross sales and higher levels of redemptions. Refer to the ‘Risk Factors and Management of Risk’ section of our Annual MD&A.

Management’s Discussion and Analysis of Financial Condition and Results of Operations
AGF Management Limited – 20 – Third Quarter Report 2015
Net Sales (Redemptions) Gross sales and redemptions are monitored separately and the sum of these two amounts comprises net sales (redemptions). Net sales (redemptions), together with investment performance and fund expenses, determine the level of average daily retail fund AUM, which is the basis on which management fees are charged. The average daily retail fund AUM is equal to the aggregate average daily net asset value of the AGF retail funds. We monitor AUM in our institutional, sub-advisory and high-net-worth businesses separately. We do not compute an average daily retail fund AUM figure for them.
Managing Risk AGF is subject to a number of risk factors that may impact our operating and financial performance. These risks and the management of these risks are detailed in our 2014 Annual MD&A in the section entitled ‘Risk Factors and Management of Risk.’ During the nine months ended August 31, 2015, the Company has identified a change to the operational risk factor that may affect its business or the management of these risks.
Operational Risk Operational risk is related to the processes and systems that support AGF’s business, including fund accounting and administration. Since 2005, AGF has outsourced its fund administration function, including client servicing, to Citigroup Fund Services Canada Inc. (CFSC). CFSC’s decision to exit the fund administration business has provided AGF the opportunity to repatriate the transfer agency business and transition its fund accounting and custody functions to another third party service provider. In April 2015, AGF entered into a transition agreement with CFSC. The transition will encompass the transfer of the revenue and expenses associated with the provision of the transfer agency operations on behalf of the AGF managed mutual funds and investment pools. The transition of the business, which will include the transfer of approximately 185 employees from CFSC to AGF, is expected to be completed early in 2016. AGF will not compensate CFSC for the business but will invest approximately $6.0 million of capital for leaseholds, facilities and technology. The transition of our custody and fund accounting functions from CFSC to another third party provider is expected to be completed in the fourth quarter of 2015. The transfer agency business is expected to be managed on a profitable basis, while lowering the overall costs to the funds. By insourcing our client service function, AGF can better align its client servicing with the sales and marketing function, to ensure continued enhancement to the client service and experience. Any delays or issues related to the transition of these functions could lead to operational and business disruption, as well as a potential negative financial impact.
Contractual Obligations During the nine months ended August 31, 2015, AGF entered into an agreement with CFSC to transition our transfer agency function in house. The transition, which will include the transfer of approximately 185 employees from CFSC to AGF, is expected to be completed early in 2016. As part of this transition agreement, AGF also entered into a four-year service agreement with L&T Infotech Financial Services Technologies Inc. (L&T). The agreement with L&T includes a minimum annual revenue commitment.
Internal Control Over Financial Reporting The Chief Executive Officer and the Chief Financial Officer have designed or caused the design of the Internal Controls Over Financial Reporting (ICFR) and Disclosure Controls and Procedures. There have been no changes in AGF’s internal controls during the three months ended August 31, 2015 that have materially affected, or are reasonably likely to materially affect, our internal control over financial reporting.

Management’s Discussion and Analysis of Financial Condition and Results of Operations
AGF Management Limited – 21 – Third Quarter Report 2015
Selected Quarterly Information (in millions of Canadian dollars, except per share amounts) Aug. 3 1, Ma y 3 1, Fe b. 2 8 , Nov. 3 0 , For the thre e - month pe riod ende d 2 0 15 2 0 15 2 0 15 2 0 14
Revenue (continuing operations) $ 115.8 $ 117.1 $ 111.7 $ 111.7
Free cash flow 1 17.0 16.8 15.4 22.8 EBITDA (continuing operations)1 31.8 36.0 33.9 34.4 Pre-tax income (continuing operations) 15.9 19.6 18.1 16.7 Net income attributable to equity ow ners
of the Company 11.9 14.7 13.6 12.6 Net income (continuing operations) 11.9 14.7 13.6 11.9
EBITDA per share (continuing operations)Basic $ 0.38 $ 0.43 $ 0.40 $ 0.40 Diluted $ 0.38 $ 0.42 $ 0.40 $ 0.40
Earnings per share attributable to equity ow ners of the Company
Basic (continuing operations) $ 0.14 $ 0.17 $ 0.16 $ 0.15 Diluted (continuing operations) $ 0.14 $ 0.17 $ 0.16 $ 0.14 Basic $ 0.14 $ 0.17 $ 0.16 $ 0.14 Diluted $ 0.14 $ 0.17 $ 0.16 $ 0.13
Weighted average basic shares 82,826,845 84,489,294 84,644,212 85,812,669 Weighted average fully diluted shares 83,814,065 85,426,944 85,447,450 87,000,054
(in millions of Canadian dollars, except per share amounts) Aug. 3 1, Ma y 3 1, Fe b. 2 8 , Nov. 3 0 ,For the thre e - month pe riod ende d 2 0 14 2 0 14 2 0 14 2 0 13
Revenue (continuing operations) $ 116.9 $ 119.1 $ 116.9 $ 117.4 Free cash flow 1 22.2 18.0 19.8 23.1 EBITDA (continuing operations)1 38.5 38.1 43.9 33.6 Pre-tax income (continuing operations) 19.6 19.5 23.2 9.7 Net income attributable to equity ow ners
of the Company 14.8 14.5 19.9 7.1 Net income (continuing operations) 14.8 14.5 17.1 7.1
EBITDA per share (continuing operations)Basic $ 0.45 $ 0.44 $ 0.51 $ 0.39 Diluted $ 0.45 $ 0.44 $ 0.51 $ 0.38
Earnings per share attributable to equity ow ners of the Company
Basic (continuing operations) $ 0.17 $ 0.17 $ 0.20 $ 0.08 Diluted (continuing operations) $ 0.17 $ 0.17 $ 0.20 $ 0.08 Basic $ 0.17 $ 0.17 $ 0.23 $ 0.08 Diluted $ 0.17 $ 0.17 $ 0.23 $ 0.08
Weighted average basic shares 85,950,736 86,009,993 86,188,463 87,145,604 Weighted average fully diluted shares 86,459,914 86,563,621 86,742,830 87,911,391
1 As previously defined, see ‘Key Performance Indicators, Additional IFRS and Non-IFRS Measures’ section.
Additional Information Additional information relating to the Company can be found in the Company’s Consolidated Financial Statements and accompanying notes for the three and nine months ended August 31, 2015, the Company’s 2014 Annual Report, the Company’s 2014 Annual Information Form (AIF) and other documents filed with applicable securities regulators in Canada and may be accessed at www.sedar.com.
AGF Management Limited CONDENSED CONSOLIDATED INTERIM FINANCIAL STATEMENTS For the three and nine months ended August 31, 2015 and 2014

AGF Management Limited Consolidated Interim Statement of Financial Position
AGF Management Limited – 23 – Third Quarter Report 2015
(unaudited) August 3 1, Nove mbe r 3 0 ,(in thousands of Canadian dollars) Note 2 0 15 2 0 14
Assets Current Assets
Cash and cash equivalents $ 50,420 $ 261,498 Investments 4 24,737 23,832 Accounts receivable, prepaid expenses and other assets 5 38,722 42,227
113,879 327,557
Investment in associate and joint ventures 5 112,274 91,948 Long-term investments 5 133,755 19,671 Management contracts 7 689,759 689,759 Customer contracts, net of accumulated amortization and derecognition 7 3,852 6,595 Goodw ill 7 244,549 244,549 Other intangibles, net of accumulated amortization and derecognition 7 9,122 12,548 Deferred selling commissions, net of accumulated amortization and derecognition 7 101,674 104,773 Property, equipment and computer softw are, net of accumulated depreciation 9,760 9,353 Deferred income tax assets 3,767 4,503 Other assets 5 3,160 167
Total assets $ 1,425,551 $ 1,511,423
LiabilitiesCurrent Liabilities
Accounts payable and accrued liabilities $ 57,912 $ 65,961 Income tax liability 14, 19 1,973 20,702 Provision for Elements Advantage 1,390 2,045 Derivative f inancial instrument 2,390 1,596
63,665 90,304
Long-term debt 8 268,743 308,199 Deferred income tax liabilities 175,001 175,472 Derivative financial instrument – 1,032 Provision for Elements Advantage 1,111 1,419 Other long-term liabilities 13 7,369 5,222
Total liabilities 515,889 581,648
EquityEquity attributable to ow ners of the Company
Capital stock 9 485,529 517,467 Contributed surplus 13 40,182 39,584 Retained earnings 359,644 361,628 Accumulated other comprehensive income 10 24,307 11,096
Total equity 909,662 929,775 Total liabilities and equity $ 1,425,551 $ 1,511,423
(The accompanying notes are an integral part of these Condensed Consolidated Interim Financial Statements.)

AGF Management Limited Consolidated Interim Statement of Income
AGF Management Limited – 24 – Third Quarter Report 2015
(unaudited)August 31, August 3 1,
(in thousands of Canadian dollars, except per share data) Note 2 0 15 2 014
IncomeManagement and advisory fees $ 105,338 $ 109,580 Deferred sales charges 2,185 2,678 Share of profit of associate and joint ventures 5 1,981 2,584 Fair value adjustments and other income 11, 5 6,341 2,056
Total income 115,845 116,898
Expenses Selling, general and administrative 12 50,086 43,793 Trailing commissions 32,725 32,973 Investment advisory fees 1,243 1,568 Amortization and derecognition of deferred selling commissions 11,068 12,713 Amortization and derecognition of customer contracts 549 916 Amortization and derecognition of other intangibles 1,056 1,626 Depreciation of property, equipment and computer softw are 790 919 Interest expense 2,488 2,804
100,005 97,312
Income before income taxes 15,840 19,586
Income tax expense (benefit)Current 14 4,439 5,021 Deferred 14 (479) (240)
3,960 4,781
Net income for the period $ 11,880 $ 14,805
Earnings per share for the period Basic earnings per share 15 $ 0.14 $ 0.17 Diluted earnings per share 15 $ 0.14 $ 0.17
(The accompanying notes are an integral part of these Condensed Consolidated Interim Financial Statements.)
Thre e months ende d

AGF Management Limited Consolidated Interim Statement of Income
AGF Management Limited – 25 – Third Quarter Report 2015
(unaudited)
August 3 1, August 3 1,(in thousands of Canadian dollars, except per share data) Note 2 0 15 2 0 14
IncomeManagement and advisory fees $ 315,535 $ 328,003 Deferred sales charges 7,205 9,981 Share of profit of associate and joint ventures 5 10,207 8,905 Fair value adjustments and other income 11, 5 11,674 5,925
Total income 344,621 352,814
Expenses Selling, general and administrative 12 141,435 130,869 Trailing commissions 97,532 96,895 Investment advisory fees 3,993 4,549 Amortization and derecognition of deferred selling commissions 31,749 37,509 Amortization and derecognition of customer contracts 2,743 3,135 Amortization and derecognition of other intangibles 3,425 5,787 Depreciation of property, equipment and computer softw are 2,223 2,905 Interest expense 8,048 8,850
291,148 290,499
Income before income taxes 53,473 62,315
Income tax expense (benefit)Current 14 13,208 18,694 Deferred 14 160 (2,804)
13,368 15,890
Income from continuing operations, net of taxes 40,105 46,425
Income from discontinued operations, net of taxes 6 – 2,840
Net income for the period $ 40,105 $ 49,265
Earnings per share for the period Basic earnings per share
Continuing operations 15 $ 0.48 $ 0.54 Discontinued operations 15 – 0.03
$ 0.48 $ 0.57
Diluted earnings per shareContinuing operations 15 $ 0.48 $ 0.54Discontinued operations 15 – 0.03
$ 0.48 $ 0.57(The accompanying notes are an integral part of these Condensed Consolidated Interim Financial Statements.)
Nine months e nde d
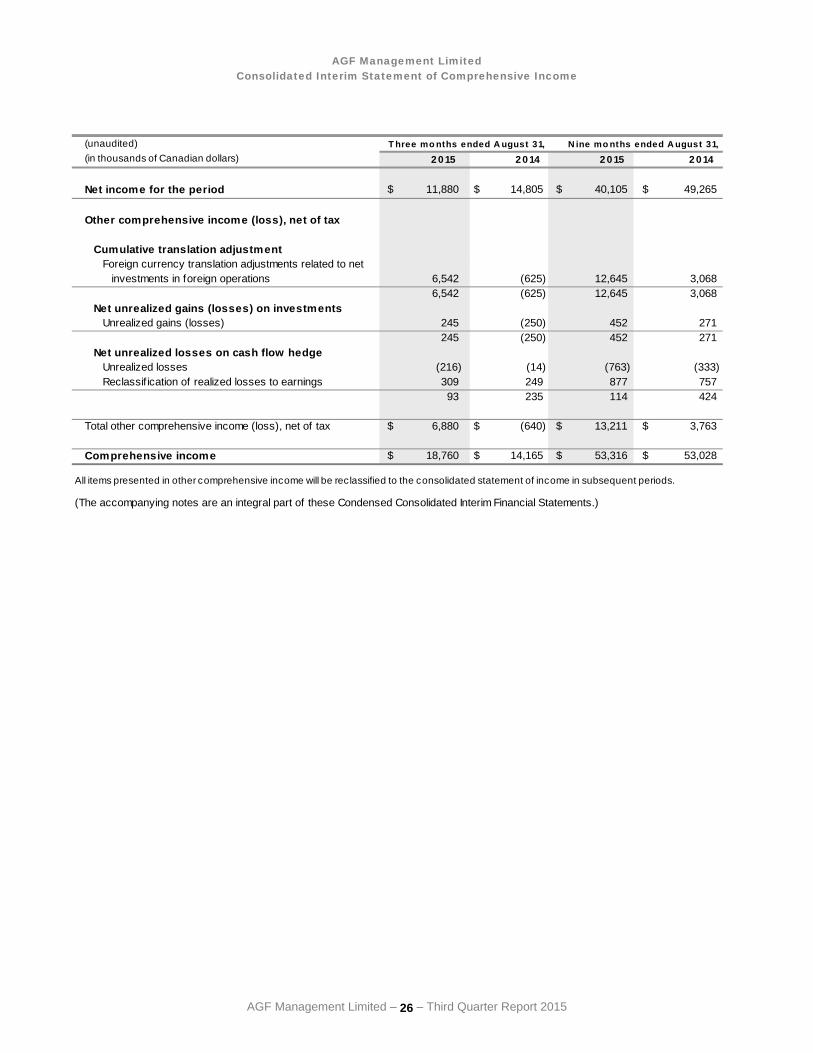
AGF Management Limited Consolidated Interim Statement of Comprehensive Income
AGF Management Limited – 26 – Third Quarter Report 2015
(unaudited)(in thousands of Canadian dollars) 2 0 15 2 0 14 2 0 15 2 0 14
Net income for the period $ 11,880 $ 14,805 $ 40,105 $ 49,265
Other comprehensive income (loss), net of tax
Cumulative translation adjustmentForeign currency translation adjustments related to net
investments in foreign operations 6,542 (625) 12,645 3,068 6,542 (625) 12,645 3,068
Net unrealized gains (losses) on investmentsUnrealized gains (losses) 245 (250) 452 271
245 (250) 452 271 Net unrealized losses on cash flow hedge
Unrealized losses (216) (14) (763) (333)Reclassif ication of realized losses to earnings 309 249 877 757
93 235 114 424
Total other comprehensive income (loss), net of tax $ 6,880 $ (640) $ 13,211 $ 3,763
Comprehensive income $ 18,760 $ 14,165 $ 53,316 $ 53,028
All items presented in other comprehensive income will be reclassified to the consolidated statement of income in subsequent periods.
(The accompanying notes are an integral part of these Condensed Consolidated Interim Financial Statements.)
T hree mo nths ended A ugust 31, N ine mo nths ended A ugust 31,

AGF Management Limited Consolidated Interim Statement of Changes in Equity
AGF Management Limited – 27 – Third Quarter Report 2015
(unaudited)
(in thousands of Canadian dollars)C a p ita l
sto c k
Balance , Decem be r 1, 2013 $ 524,681 $ 28,440 $ 405,989 $ 7,117 $ 966,227 Net income for the period – – 49,265 – 49,265 Other comprehensive income
(net of tax) – – – 3,763 3,763 Comprehensive income for the period – – 49,265 3,763 53,028 Issued through div idend
reinvestment plan 1,959 – – – 1,959 Stock options 4,437 369 – – 4,806 AGF Class B Non-Voting shares
repurchased for cancellation (10,623) – (11,486) – (22,109)AGF Class B Non-Voting shares
issued on acquisition of Acuity 1,941 – – – 1,941 Dividends on AGF Class A
Voting common shares and AGF Class B Non-Voting shares,including tax of $1.0 million – – (70,660) – (70,660)
Equity-settled Restricted Share Unitsand Partner Points, net of tax – 8,321 – – 8,321
Treasury stock (3,260) – – – (3,260)Balance , Augus t 31, 2014 $ 519,135 $ 37,130 $ 373,108 $ 10,880 $ 940,253
Balance , Decem be r 1, 2014 $ 517,467 $ 39,584 $ 361,628 $ 11,096 $ 929,775 Net income for the period – – 40,105 – 40,105 Other comprehensive income
(net of tax) – – – 13,211 13,211 Comprehensive income for the period – – 40,105 13,211 53,316 Issued through div idend
reinvestment plan 474 – – – 474 Stock options 101 1,025 – – 1,126 AGF Class B Non-Voting shares
repurchased for cancellation (30,947) – (5,537) – (36,484)Dividends on AGF Class A
Voting common shares and AGF Class B Non-Votingshares, including tax of $0.4 million – – (36,552) – (36,552)
Equity-settled Restricted Share Unitsand Partner Points, net of tax – (427) – – (427)
Treasury stock (1,566) – – – (1,566)Balance , Augus t 31, 2015 $ 485,529 $ 40,182 $ 359,644 $ 24,307 $ 909,662
(The accompanying notes are an integral part of these Condensed Consolidated Interim Financial Statements.)
T o ta l e q u ity C o n trib u te d
su rp lu sR e ta in e d e a rn in g s
A c c u mu la te d o th e r
c o mp re h e n sive in c o me

AGF Management Limited Consolidated Interim Statement of Cash Flow
AGF Management Limited – 28 – Third Quarter Report 2015
(unaudited)August 3 1, August 3 1,
(in thousands of Canadian dollars) Note 2 0 15 2 0 14
Operating Activities Net income for the period $ 40,105 $ 49,265
Adjustments forNet income from discontinued operations 6 – (2,840)Amortization, derecognition and depreciation 40,140 49,336 Interest expense 8,048 8,850 Income tax expense 14 13,368 15,890 Income taxes paid (32,402) (57,437)Stock-based compensation 13 5,578 2,565 Share of profit of associate and joint venture 5 (10,207) (8,905)Distributions from associate 5 1,680 1,646 Deferred selling commissions paid (28,650) (29,820)Other (2,251) (579)
35,409 27,971
Net change in non-cash w orking capital balances related to operationsAccounts receivable, prepaid expenses and other assets 3,505 8,245 Other assets (3,637) (1,538)Accounts payable and accrued liabilities (7,604) (23,881)Other liabilities 1,173 (6,895)
(6,563) (24,069)
Net cash provided by operating activities 28,846 3,902
Financing Activities Repurchase of Class B Non-Voting shares for cancellation 9 (36,484) (22,109)Issue of Class B Non-Voting shares 9 91 4,068 Purchase of treasury stock 9 (5,523) (3,300)Dividends paid 16 (35,653) (67,747)Repayment of long-term debt 8 (40,000) – Issuance of short-term bridge facility 8 89,100 – Repayment of short-term bridge facility 8 (89,100) – Interest paid (7,664) (8,853)Net cash used in continuing f inancing activities (125,233) (97,941)
Investing Activities Acquisition of Acuity Funds Ltd. and Acuity Investment Management Inc. – (4,440)Purchase of investment in joint venture 5 – (1)Purchase of long-term investments 5 (120,847) (27,500)Return of capital from long-term investments 5 10,120 10,920 Purchase of property, equipment and computer softw are, net of disposals (2,630) (795)Purchase of short-term investments 4 (5,178) (11,830)Proceeds from sale of short-term investments 4 3,844 2,114 Proceeds from sale of discontinued operations – 10,000 Net cash used in continuing investing activities (114,691) (21,532)
Decrease in cash and cash equivalents during the period (211,078) (115,571)
Balance of cash and cash equivalents, beginning of period 261,498 369,865
Balance of cash and cash equivalents, end of period $ 50,420 $ 254,294
(The accompanying notes are an integral part of these Condensed Consolidated Interim Financial Statements.)
Nine months e nde d

AGF Management Limited – 29 – Third Quarter Report 2015
Notes to Condensed Consolidated Interim Financial Statements For the three and nine months ended August 31, 2015 and 2014 (unaudited)
Note 1: General Information AGF Management Limited (AGF or the Company) is a limited liability company incorporated and domiciled in Canada under the Business Corporations Act (Ontario). The address of its registered office and principal place of business is TD Bank Tower, 66 Wellington Street West, Toronto, Ontario.
The Company is an integrated, global wealth management corporation whose principal subsidiaries provide investment management for mutual funds, institutions and corporations, as well as high-net-worth clients. The Company conducts the management and distribution of mutual funds in Canada under the brand names AGF, Elements and Harmony (collectively, AGF Investments). The Company also holds investments in an associate, Smith & Williamson Holdings Limited (S&WHL), and in joint ventures InstarAGF Inc. (InstarAGF), Stream Asset Financial Management LP (SAFMLP) and Stream Asset Financial LP (Stream).
These condensed consolidated interim financial statements were authorized for issue by the Board of Directors on September 29, 2015.
Note 2: Basis of Preparation These condensed consolidated interim financial statements have been prepared in accordance with International Financial Reporting Standards (IFRS) as issued by the International Accounting Standards Board (IASB) applicable to the preparation of interim financial statements, including International Accounting Standard 34 (IAS 34), Interim Financial Reporting. The accounting policies in these condensed consolidated interim financial statements are consistent with those disclosed in the Company’s annual consolidated financial statements for the year ended November 30, 2014, with the exception of the changes described below. The condensed consolidated interim financial statements should be read in conjunction with the Company’s annual consolidated financial statements for the year ended November 30, 2014, which have been prepared in accordance with IFRS as issued by the IASB.
Note 3: Adoption of New and Revised Accounting Standards The Company has adopted the following new and revised standards, along with all consequential amendments to other standards, effective December 1, 2014. These changes were adopted in accordance with the applicable transitional provisions of each new or revised standard.
Amendment to IAS 32, ‘Financial instruments: Presentation’ on offsetting financial assets and financial liabilities. This amendment clarifies that the right of set-off must not be contingent on a future event. It must also be legally enforceable for all counterparties in the normal course of business, as well as in the event of default, insolvency or bankruptcy. The amendment also considers settlement mechanisms. The amendment did not have a significant effect on the Company’s financial statements.
Amendments to IAS 36, ‘Impairment of assets’ on the recoverable amount disclosures for non-financial assets. This amendment removed certain disclosures of the recoverable amount of cash generating units (CGUs) that had been included in IAS 36 by the issue of IFRS 13. The amendment did not have a significant effect on the Company's financial statements.
Amendment to IAS 39, ‘Financial instruments: Recognition and measurement’ on the novation of derivatives and the continuation of hedge accounting. This amendment considers legislative changes to ‘over-the-counter’ derivatives and the establishment of central counterparties. Under IAS 39 novation of derivatives to central counterparties would result in discontinuance of hedge accounting. The amendment provides relief from discontinuing hedge accounting when novation of a hedging instrument meets specified criteria. There was no impact to the Company as a result of the adoption of the amended standard.

AGF Management Limited Notes to Condensed Consolidated Interim Financial Statements
AGF Management Limited – 30 – Third Quarter Report 2015
Note 4: Investments The following table presents a breakdown of investments:
August 31, November 30,(in thousands of Canadian dollars) 2015 2014
Fair value through profit or lossAGF mutual funds and other $ 18,246 $ 17,676 Equity securities 518 544
18,764 18,220
Available for saleEquity securities and term deposits 5,664 5,304
Loans and receivablesCanadian government debt – Federal 309 308
$ 24,737 $ 23,832 During the three and nine months ended August 31, 2015 and 2014, no impairment charges were required.
Note 5: Investment in Associate, Joint Ventures and Long-term Investments (a) Investment in Associate
The Company holds a 31.9% investment in S&WHL accounted for using the equity method. At August 31, 2015, the carrying value was $111.5 million (November 30, 2014 – $91.6 million). During the three and nine months ended August 31, 2015, the Company recognized earnings of $1.8 million and $9.7 million (2014 – $2.2 million and $8.6 million) and received nil and $1.7 million (2014 – nil and $1.6 million) in dividends from S&WHL.
(b) Investment in Joint Ventures
As at August 31, 2015, the Company held a 50.0% interest in InstarAGF, a joint venture with Instar Group Inc. (Instar), and a 37.0% interest in SAFMLP, both of which are alternative asset management companies. The Company accounts for these investments using the equity method.
The Company has recorded losses with respect to its equity investment in InstarAGF only to the extent of its initial investment, which has a carrying value of nil, because it is not contractually obligated to fund the losses. As at August 31, 2015, the Company accumulated unrecognized losses of $1.1 million related to its interest in InstarAGF. In addition, AGF has agreed to advance up to $5.0 million to InstarAGF on an as-needed basis as a working capital loan facility. The loan facility is non-interest bearing and is repayable on a priority basis once InstarAGF begins to earn fees from funds under management. As at August 31, 2015, the Company had recorded a receivable of $4.3 million (November 30, 2014 – $2.1 million), of which $1.3 million was included in accounts receivable, prepaid expenses and other assets and $3.0 million was included in long-term other assets on the consolidated interim statement of financial position.
In addition, during the nine months ended August 31, 2015, AGF advanced $1.0 million to Instar in the form of a promissory note, which bears interest at prime. This amount has been included in accounts receivable, prepaid expenses and other assets on the consolidated interim statement of financial position.
At August 31, 2015, the carrying value of SAFMLP was $0.8 million (November 30, 2014 – $0.3 million). During the three and nine months ended August 31, 2015, the Company recognized earnings of $0.2 million and $0.5 million (2014 – $0.4 million and $0.3 million) related to its investment in SAFMLP.
(c) Investment in Long-term Investments
The Company has committed a total of $150.0 million to funds and investments associated with the alternative asset management platform. The Company may temporarily provide capital to warehouse investments prior to formation of a fund. Upon closing of a fund with external investors, the Company receives a return of its capital in excess of its proportionate participation in the fund. The Company has designated its long-term investments in the funds at fair value through profit or loss (FVTPL).
As at August 31, 2015, of its $150.0 million allocation, the Company had committed $50.0 million to Stream, a midstream oil and gas infrastructure fund. As at August 31, 2015, the Company had invested $33.4 million (November 30, 2014 – $16.6 million) with $16.6 million remaining committed capital to be invested in the Stream fund.
At August 31, 2015, the carrying value of the Company’s investment in Stream was $21.9 million (November 30, 2014 – $16.5 million), which represents the Company’s maximum exposure to loss related to this investment and is recorded in

AGF Management Limited Notes to Condensed Consolidated Interim Financial Statements
AGF Management Limited – 31 – Third Quarter Report 2015
long-term investments on the consolidated interim statement of financial position. During the three and nine months ended August 31, 2015, Stream monetized one of its seed assets, which resulted in the Company receiving a special distribution of $15.9 million, of which $10.1 million represented a return of capital. During the three and nine months ended August 31, 2015, the Company recognized $6.2 million and $8.0 million (2014 – $0.3 million and $0.7 million) of income distributions, including a $5.7 million special distribution. During the three and nine months ended August 31, 2015, the Company recognized $0.9 million and $1.4 million in charges (2014 – $0.6 million and $0.9 million) related to the fair value adjustment on the mark to market of its participation in Stream. The fair value adjustment represents a return of capital received through income distributions.
The Company has committed $100.0 million to InstarAGF’s essential infrastructure fund. During the three and nine months ended August 31, 2015, the Company invested $0.6 million and $104.0 million in the essential infrastructure fund. This fund is expected to achieve its first closing with external investors in the fourth quarter of 2015, at which point the Company will receive a return of its capital in excess of its proportionate participation. On January 27, 2015, the capital invested by the Company, together with amounts invested by Instar, was deployed to acquire an interest in the passenger terminal at Billy Bishop Toronto City Airport alongside other Canadian and international equity investors.
At August 31, 2015, the carrying value of the Company’s investment in the essential infrastructure fund was $108.8 million (November 30, 2014 – nil), which represents the Company’s maximum exposure to loss related to this investment and is recorded in long-term investments on the consolidated interim statement of financial position. During the three and nine months ended August 31, 2015, the Company recognized $2.5 million and $4.8 million (2014 – nil and nil) in accrued returns related to its investment participation in the essential infrastructure fund.
Note 6: Discontinued Operations On August 1, 2012, the Company completed its sale of 100% of the shares of AGF Trust for cash consideration corresponding to the net book value of AGF Trust at closing of $246.3 million. The agreement included a contingent consideration to a maximum of $20.0 million over five years if the credit performance of AGF Trust’s loan portfolio met certain thresholds. In May 2014, the Company finalized an early settlement of the contingent consideration receivable for $10.0 million. The amount receivable was settled on June 4, 2014. During the nine months ended August 31, 2014, the Company realized a gain on discontinued operations related to this settlement of $3.9 million, or $2.8 million after tax. In addition, the Company indemnified the purchaser of AGF Trust against unenforceable loans outstanding or committed as at the date of closing, which may be put back to the Company on a quarterly basis, subject to certain conditions. The put option will expire on October 31, 2017 and indemnifies only against errors in underwriting and not credit deterioration. The carrying value of the loans subject to indemnification was $3.1 billion at the date of sale. The Company records a provision for indemnified loans when a loan is in default and the put option becomes probable of being exercised, which generally coincides with the receipt of notification by the purchaser that it intends to exercise the put. During the three and nine months ended August 31, 2015, the Company recorded a provision of nil (2014 – nil and nil).
Note 7: Intangible Assets During the quarter ended August 31, 2015, the Company completed its impairment test on its goodwill and indefinite life intangibles. For the purposes of assessing impairment, assets are grouped at the lowest levels for which there are separately identifiable cash flows (CGUs). Substantially all of the management contracts are in the retail CGU. The following is a summary of the goodwill allocation by CGU:
(in thousands of Canadian dollars)
Year ended November 30, 2014Opening net book amount $ 151,624 $ 76,656 $ 12,548 $ 3,721 $ 244,549 Impairment – – – – – Disposal – – – – –
$ 151,624 $ 76,656 $ 12,548 $ 3,721 $ 244,549
Period ended August 31, 2015Opening net book amount $ 151,624 $ 76,656 $ 12,548 $ 3,721 $ 244,549 Impairment – – – – – Disposal – – – – –
$ 151,624 $ 76,656 $ 12,548 $ 3,721 $ 244,549
Total
Closing net book amount
Closing net book amount
Investment Management
– Institutional
Investment Management
– Retail
Cypress Capital Management
Ltd.Doherty &
Associates Ltd.

AGF Management Limited Notes to Condensed Consolidated Interim Financial Statements
AGF Management Limited – 32 – Third Quarter Report 2015
To determine whether an impairment loss should be recognized, the carrying value of the assets and liabilities of the CGU is compared to its recoverable amount. The recoverable amount of a CGU is the higher of its fair value less costs to sell and its value in use. Fair value less costs to sell is the best estimate obtainable from the sale of a CGU in an arm’s length transaction between knowledgeable, willing parties, less the costs of disposal. Historically, the Company has determined the recoverability of each of its CGUs based on an analysis of the underlying AUM associated with the CGU and available AUM multiples from recent transactions for similar assets within the same industry. As there has not been a significant volume of recent comparable transactions involving similar businesses, the Company also performed a discounted cash flow analysis and incorporated the results of both approaches in determining its best estimate of the fair value less costs to sell used as the recoverable amount for each CGU. Based on the results of the test, the Company concluded that no goodwill or intangible assets were impaired as at August 31, 2015. Management will continue to regularly monitor its intangibles for indications of potential impairment. The following is a summary of the most significant inputs applied in measuring the recoverable amounts of the Company’s two most significant CGUs as at August 31, 2015:
(in thousands of Canadian dollars)
Recoverable amount applied - overall $ 789,100 $ 121,900 Carrying amount 768,500 77,700
$ 20,600 $ 44,200
AUM multiple approachAUM $ 18,232,000 $ 9,563,300 AUM multiple applied 4.25% 1.15%
$ 763,600 $ 109,300
Discounted cash flow approachDiscount rate 11.75% 15.25%Terminal growth rate 4.50% 4.50%
$ 830,600 $ 139,500
Investment Management
– Institutional
Recoverable amount - median
Excess
Investment Management
– Retail
Recoverable amount - median The following is a summary of a sensitivity analysis performed based on alternative assumptions as at August 31, 2015:
(in thousands of Canadian dollars)
AUM multiple approachAlternative AUM multiple 4.50% 1.25%
$ 808,200 $ 119,000
Alternative AUM multiple 4.00% 1.05%Recoverable amount - low $ 719,000 $ 99,700
Discounted cash flow approachDiscount rate -0.50% -0.50%Terminal growth rate +0.50% +0.50%
$ 959,400 $ 154,100
Discount rate +0.50% +0.50%Terminal growth rate -0.50% -0.50%
$ 733,000 $ 127,300
Investment Management
– Retail
Investment Management
– Institutional
Recoverable amount - low
Recoverable amount - high
Recoverable amount - high
Note 8: Long-term Debt (a) During the nine months ended August 31, 2015, the Company repaid $40.0 million of its revolving credit facility (the Facility).
The Facility has a maximum aggregate principal amount of $400.0 million. As at August 31, 2015, AGF had drawn $270.0 million (November 30, 2014 – $310.0 million) against the Facility in the form of two one-month bankers’ acceptances at an effective average interest rate of 2.5% per annum.

AGF Management Limited Notes to Condensed Consolidated Interim Financial Statements
AGF Management Limited – 33 – Third Quarter Report 2015
(b) On January 26, 2015, the Company arranged for a seven-day $100.0 million short-term bridge facility (the Bridge Facility) through a Canadian chartered bank to fund an alternative asset investment. On January 26, 2015, AGF drew $89.1 million against the Bridge Facility, which was secured by the Company’s term deposits held by the bank. The Bridge Facility was fully repaid on February 2, 2015. Refer to Note 5(c) for additional information on the alternative asset investment.
Note 9: Capital Stock (a) Authorized Capital
The authorized capital of AGF consists of an unlimited number of AGF Class B Non-Voting shares and an unlimited number of AGF Class A Voting common shares. The Class B Non-Voting shares are listed for trading on the Toronto Stock Exchange (TSX).
(b) Changes During the Period
The change in capital stock is summarized as follows:
Nine months e nde d
(in thousands of Canadian dollars, except share amounts) Sha re s Sta te d va lue Sha re s Sta te d va lue
Class A Voting common shares 57,600 $ – 57,600 $ –
Class B Non-Voting sharesBalance, beginning of the period 85,703,751 $ 517,467 87,091,646 $ 524,681 Issued through dividend reinvestment plan 62,230 474 154,288 1,959 Stock options exercised 10,179 101 465,058 4,437 Issued on acquisition of Acuity – – 175,367 1,941 Repurchased for cancellation (5,099,964) (30,947) (1,762,200) (10,623)Treasury stock purchased for employee benefit trust (843,506) (5,523) (270,000) (3,300)Treasury stock released for employee benefit trust 417,945 3,957 3,421 40 Balance, end of the period 80,250,635 $ 485,529 85,857,580 $ 519,135
August 3 1, 2 0 15 August 3 1, 2 0 14
(c) Class B Non-Voting Shares Purchased for Cancellation
AGF has obtained applicable regulatory approval to purchase for cancellation, from time to time, certain of its Class B Non-Voting shares through the facilities of the TSX (or as otherwise permitted by the TSX). AGF relies on an automatic purchase plan during the normal course issuer bid. The automatic purchase plan allows for purchases by AGF of its Class B Non-Voting shares during certain pre-determined black-out periods, subject to certain parameters. Outside of these pre-determined black-out periods, shares will be purchased in accordance with management’s discretion. Under its normal course issuer bid, AGF may purchase up to 10% of the public float outstanding on the date of the receipt of regulatory approval or up to 6,707,999 shares through to February 3, 2016. During the three months ended August 31, 2015, 2,120,924 (2014 – nil) Class B Non-Voting shares were repurchased at a cost of $13.4 million (2014 – nil), and the excess paid of $0.5 million (2014 – nil) over the recorded capital stock value of the shares repurchased for cancellation was charged to retained earnings. During the nine months ended August 31, 2015, 5,099,964 (2014 – 1,762,200) Class B Non-Voting shares were repurchased at a cost of $36.5 million (2014 – $22.1 million) and the excess paid of $5.5 million (2014 – $11.5 million) over the recorded capital stock value of the shares repurchased for cancellation was charged to retained earnings.
(d) Class B Non-Voting Shares Purchased as Treasury Stock for Employee Benefit Trust
During the three and nine months ended August 31, 2015, 600,000 and 843,506 (2014 – 120,000 and 270,000) Class B Non-Voting shares were purchased for the employee benefit trust. Shares purchased for the trust are also purchased under the Company’s normal course issuer bid and recorded as a reduction to capital stock. During the three and nine months ended August 31, 2015, 37,925 and 417,945 (2014 – 2,146 and 3,421) Class B Non-Voting shares purchased as treasury stock were released. As at August 31, 2015, 890,762 (November 30, 2014 – 465,201) Class B Non-Voting shares were held as treasury stock.

AGF Management Limited Notes to Condensed Consolidated Interim Financial Statements
AGF Management Limited – 34 – Third Quarter Report 2015
Note 10: Accumulated Other Comprehensive Income (Loss)
F o reign A vailable currency fo r sale C ash f lo w
(in thousands of Canadian do llars) t ranslat io n securit ies hedge T o tal
Opening composition of accumulated other comprehensive income (loss) at November 30, 2013Accumulated other comprehensive income (loss) $ 6,625 $ 3,154 $ (3,046) $ 6,733 Income tax recovery (expense) – (424) 808 384
Balance, November 30, 2013 6,625 2,730 (2,238) 7,117
Transactions during the year ended November 30, 2014Other comprehensive income 2,717 358 731 3,806 Income tax recovery (expense) – 367 (194) 173
Balance, November 30, 2014 9,342 3,455 (1,701) 11,096
Transactions during the period ended August 31, 2015Other comprehensive income 12,645 467 155 13,267 Income tax expense – (15) (41) (56)
Balance, August 31, 2015 $ 21,987 $ 3,907 $ (1,587) $ 24,307
All items presented in other comprehensive income (loss) will be reclassified to the consolidated statement of income (loss) in subsequent periods.
Note 11: Fair Value Adjustments and Other Income
(in thousands of Canadian dollars) 2015 2014
Fair value adjustment related to investment in AGF mutual funds (Note 4) $ (1,738) $ 572 Fair value adjustment related to long-term investments (Note 5(c)) 1,577 57 Distributions from long-term investments (Note 5(c)) 690 – Special distribution from long-term investment (Note 5(c)) 5,742 – Interest income 122 1,284 Other (52) 143
$ 6,341 $ 2,056
Three months ended August 31,
(in thousands of Canadian dollars) 2 0 15 2 0 14
Fair value adjustment related to investment in AGF mutual funds (Note 4) $ (832) $ 787 Fair value adjustment related to acquisition consideration payable – 422 Fair value adjustment related to long-term investments (Note 5(c)) 3,420 381 Distributions from long-term investments (Note 5(c)) 2,436 233 Special distribution from long-term investment (Note 5(c)) 5,742 – Interest income 914 3,568 Other (6) 534
$ 11,674 $ 5,925
N ine mo nths ended A ugust 31,

AGF Management Limited Notes to Condensed Consolidated Interim Financial Statements
AGF Management Limited – 35 – Third Quarter Report 2015
Note 12: Expenses by Nature
(in thousands of Canadian dollars) 2 0 15 2 014
Selling, general and administrativeEmployee benefit expense $ 25,773 $ 25,618 Restructuring expense 4,418 – Sales and marketing 3,780 3,333 Information technology and facilities 6,543 5,989 Professional fees 4,027 3,562 Fund absorption and other fund costs 4,483 4,848 Other 1,062 443
$ 50,086 $ 43,793
T hree mo nths ended A ugust 31,
(in thousands of Canadian dollars) 2 0 15 2 014
Selling, general and administrativeEmployee benefit expense $ 80,683 $ 78,228 Restructuring expense 4,418 – Sales and marketing 10,060 8,816 Information technology and facilities 18,224 17,138 Professional fees 11,747 11,583 Fund absorption and other fund costs 12,913 13,951 Other 3,390 1,153
$ 141,435 $ 130,869
N ine mo nths ended A ugust 31,
Note 13: Stock-based Compensation and Other Stock-based Payments (a) Stock Option Plans
Under the Company’s stock option plans, an additional maximum of 2,676,107 Class B Non-Voting shares could have been granted as at August 31, 2015 (November 30, 2014 – 3,977,755).
The change in stock options during the nine months ended August 31, 2015 and 2014 is summarized as follows:
Nine months e nde d August 31, 20 15 August 31, 2 014 We ighte d We ighted
ave ra ge avera geOptions e xe rc ise pric e Options e xe rc ise pric e
Class B Non-Voting share optionsBalance, beginning of the period 4,428,542 $ 12.86 4,823,331 $ 14.37 Options granted 1,735,122 8.01 758,250 11.90 Options forfeited (111,938) 14.82 (26,721) 8.93 Options expired (321,536) 14.72 (149,399) 20.37 Options exercised (10,179) 8.93 (465,058) 8.75 Balance, end of the period 5,720,011 $ 11.25 4,940,403 $ 14.37
During the three and nine months ended August 31, 2015, nil and 1,735,122 (2014 – 340,545 and 758,250) stock options were granted and compensation expense and contributed surplus of $0.4 million and $1.0 million (2014 – $0.2 million and $0.8 million) was recorded. The fair value of options granted during the three months ended May 31, 2015 has been estimated at $1.32 per option (2014 – $1.16) using the Black-Scholes option-pricing model, while the fair value of options granted during the three months ended February 28, 2015 has been estimated at $1.40 per option (2014 – $1.16).
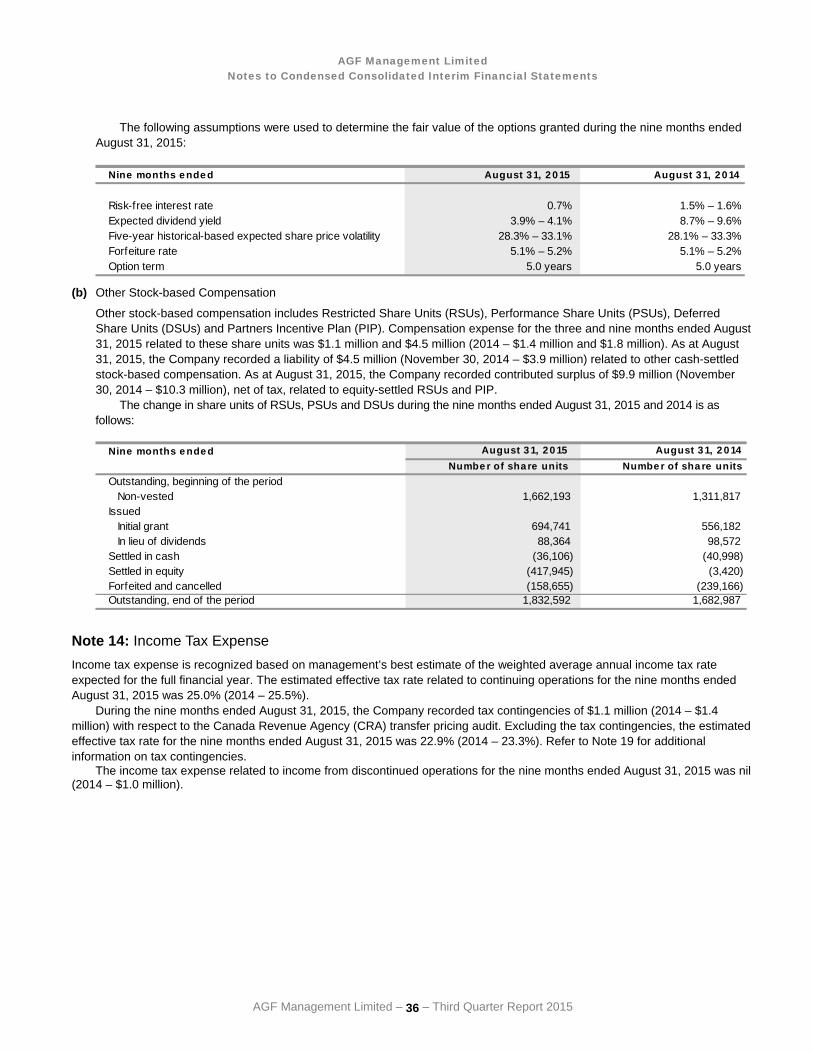
AGF Management Limited Notes to Condensed Consolidated Interim Financial Statements
AGF Management Limited – 36 – Third Quarter Report 2015
The following assumptions were used to determine the fair value of the options granted during the nine months ended August 31, 2015:
Nine months e nde d August 3 1, 2 0 15 August 3 1, 2 0 14
Risk-free interest rate 0.7% 1.5% – 1.6%Expected dividend yield 3.9% – 4.1% 8.7% – 9.6%Five-year historical-based expected share price volatility 28.3% – 33.1% 28.1% – 33.3%Forfeiture rate 5.1% – 5.2% 5.1% – 5.2%Option term 5.0 years 5.0 years
(b) Other Stock-based Compensation
Other stock-based compensation includes Restricted Share Units (RSUs), Performance Share Units (PSUs), Deferred Share Units (DSUs) and Partners Incentive Plan (PIP). Compensation expense for the three and nine months ended August 31, 2015 related to these share units was $1.1 million and $4.5 million (2014 – $1.4 million and $1.8 million). As at August 31, 2015, the Company recorded a liability of $4.5 million (November 30, 2014 – $3.9 million) related to other cash-settled stock-based compensation. As at August 31, 2015, the Company recorded contributed surplus of $9.9 million (November 30, 2014 – $10.3 million), net of tax, related to equity-settled RSUs and PIP. The change in share units of RSUs, PSUs and DSUs during the nine months ended August 31, 2015 and 2014 is as follows:
Nine months e nde d
Outstanding, beginning of the periodNon-vested 1,662,193 1,311,817
IssuedInitial grant 694,741 556,182 In lieu of dividends 88,364 98,572
Settled in cash (36,106) (40,998)Settled in equity (417,945) (3,420)Forfeited and cancelled (158,655) (239,166)Outstanding, end of the period 1,832,592 1,682,987
August 3 1, 20 15 August 31, 2 014Numbe r of share units Numbe r of sha re units
Note 14: Income Tax Expense Income tax expense is recognized based on management’s best estimate of the weighted average annual income tax rate expected for the full financial year. The estimated effective tax rate related to continuing operations for the nine months ended August 31, 2015 was 25.0% (2014 – 25.5%).
During the nine months ended August 31, 2015, the Company recorded tax contingencies of $1.1 million (2014 – $1.4 million) with respect to the Canada Revenue Agency (CRA) transfer pricing audit. Excluding the tax contingencies, the estimated effective tax rate for the nine months ended August 31, 2015 was 22.9% (2014 – 23.3%). Refer to Note 19 for additional information on tax contingencies.
The income tax expense related to income from discontinued operations for the nine months ended August 31, 2015 was nil (2014 – $1.0 million).

AGF Management Limited Notes to Condensed Consolidated Interim Financial Statements
AGF Management Limited – 37 – Third Quarter Report 2015
Note 15: Earnings per Share
(in thousands of Canadian dollars, except per share amounts) 2 015 2 0 14 20 15 2 0 14
Numerator Net income for the period from continuing operations $ 11,880 $ 14,805 $ 40,105 $ 46,425 Net income for the period from discontinued operations – – – 2,840 Net income for the period 11,880 14,805 40,105 49,265
Denominator Weighted average number of shares – basic 82,826,845 85,950,736 83,053,317 86,040,973 Dilutive effect of share-based payments 987,220 509,178 1,085,366 527,766 Weighted average number of shares – diluted 83,814,065 86,459,914 84,138,683 86,568,739
Basic earnings per shareContinuing operations $ 0.14 $ 0.17 $ 0.48 $ 0.54 Discontinued operations – – – 0.03
$ 0.14 $ 0.17 $ 0.48 $ 0.57
Diluted earnings per shareContinuing operations $ 0.14 $ 0.17 $ 0.48 $ 0.54 Discontinued operations – – – 0.03
$ 0.14 $ 0.17 $ 0.48 $ 0.57
T hree mo nths ended A ugust 31, N ine mo nths ended A ugust 31,
Note 16: Dividends During the three and nine months ended August 31, 2015, the Company paid dividends of $0.08 and $0.43 (2014 – $0.27 and $0.81) per share. Total dividends paid, including dividends reinvested, in the three and nine months ended August 31, 2015 were $6.5 million and $36.1 million (2014 – $23.2 million and $69.7 million). On September 29, 2015, the Board of Directors of AGF declared a quarterly dividend on both the Class A Voting common shares and Class B Non-Voting shares of the Company of $0.08 per share in respect of the three months ended August 31, 2015, amounting to a total dividend of approximately $6.4 million. These condensed consolidated interim financial statements do not reflect this dividend payable.
Note 17: Related Party Transactions The Company is controlled by Blake C. Goldring, Chairman and Chief Executive Officer of AGF, through his indirect ownership of all the voting shares of Goldring Capital Corporation, which owns 80% of the Company’s Class A Voting common shares. The remaining 20% of the Class A Voting common shares are held by the Vice-Chairman of AGF, who is also a Director.
The remuneration, including severance, paid to the Directors and other key management personnel of AGF is as follows:
(in thousands of Canadian dollars) 2 0 15 20 14 2 0 15 2 014
Salaries and other short-term employee benefits $ 2,216 $ 1,514 $ 5,019 $ 5,621 Share-based payments 63 377 1,103 342
$ 2,279 $ 1,891 $ 6,122 $ 5,963
N ine mo nths ended A ugust 31,T hree mo nths ended A ugust 31,
Note 18: Fair Value of Financial Instruments Financial assets are classified as FVTPL, available for sale, or loans and receivables. Financial liabilities are classified as FVTPL, other liabilities, or derivatives used for hedging.
The carrying value of accounts receivable and other assets, accounts payable and accrued liabilities and long-term debt approximate fair value.
The table below analyzes financial instruments carried at fair value, by valuation method. The different levels have been defined as follows:
Level 1 Quoted prices (unadjusted) in active markets for identical assets and liabilities,

AGF Management Limited Notes to Condensed Consolidated Interim Financial Statements
AGF Management Limited – 38 – Third Quarter Report 2015
Level 2 Inputs other than quoted prices included within level 1 that are observable for the asset or liability, either directly (that is, as prices) or indirectly (that is, derived from prices), and
Level 3 Inputs for the asset or liability that are not based on observable market data (that is, unobservable inputs).
The following table presents the Company’s assets and liabilities that are measured at fair value as at August 31, 2015:
(in thousands of Canadian dollars)August 3 1, 20 15 Tota l
AssetsFinancial assets at fair value through profit or loss
Cash and cash equivalents $ 50,420 $ – $ – $ 50,420 AGF mutual funds and other 18,246 – – 18,246 Equity securities 518 – – 518 Long-term investments – – 133,755 133,755
Available for saleEquity securities and term deposits 5,664 – – 5,664
Loans and receivablesCanadian government debt – Federal – 309 – 309
Total f inancial assets $ 74,848 $ 309 $ 133,755 $ 208,912
LiabilitiesDerivatives used for hedging $ – $ 2,390 $ – $ 2,390 Total f inancial liabilities $ – $ 2,390 $ – $ 2,390
Le ve l 1 Le ve l 2 Le ve l 3
The following table presents the Company’s assets and liabilities that are measured at fair value as at November 30, 2014:
(in thousands of Canadian dollars)
Nove mber 3 0 , 2 0 14 Tota l
AssetsFinancial assets at fair value through profit or loss
Cash and cash equivalents $ 261,498 $ – $ – $ 261,498 AGF mutual funds and other 17,676 – – 17,676 Equity securities 544 – – 544 Long-term investments – – 19,671 19,671
Available for saleEquity securities and term deposits 5,304 – – 5,304
Loans and receivablesCanadian government debt – Federal – 308 – 308
Total f inancial assets $ 285,022 $ 308 $ 19,671 $ 305,001
LiabilitiesDerivatives used for hedging $ – $ 2,628 $ – $ 2,628 Total f inancial liabilities $ – $ 2,628 $ – $ 2,628
Le ve l 1 Le ve l 2 Le ve l 3
The fair value of financial instruments traded in active markets is determined using the quoted prices where they represent those at which regularly and recently occurring transactions take place.
Level 1 instruments include listed equity securities on major exchanges, investments in AGF mutual funds, highly liquid temporary deposits with an Irish bank and non-Irish banks in Ireland, as well as Singapore bank term deposits.
Level 2 instruments include derivative instruments with major Canadian chartered banks and Canadian federal government debt. The fair value of derivatives used to manage interest rate exposure on deposits and long-term debt is calculated through discounting future expected cash flows using the BA-based swap curve. Since the BA-based swap curve is an observable input, these financial instruments are considered level 2. Canadian federal government debt is measured at amortized cost and its fair value approximates its carrying value due to its short-term nature.

AGF Management Limited Notes to Condensed Consolidated Interim Financial Statements
AGF Management Limited – 39 – Third Quarter Report 2015
Level 3 instruments include long-term investments related to the alternative asset management platform. Instruments classified in this category have a parameter input or inputs that are unobservable and that have a more than insignificant impact on either the fair value of the instrument or the profit or loss of the instrument. The fair value of the long-term investments is calculated using the Company’s percentage ownership and the fair market value of the investment derived from financial information provided by investees. The fair value of the Company’s investment in the essential infrastructure fund at August 31, 2015 has been estimated using cost plus undistributed earnings as there were no significant changes in the expected cash flows or other relevant variables from the date of the Company’s investment to August 31, 2015. The fair value of the Company’s investment in the Stream fund is determined using net asset value (NAV) as calculated by the asset manager. If the NAV were to increase or decrease by 10%, the fair value of the Company’s long-term investment and pre-tax income would increase or decrease by $2.2 million. Refer to Note 5(c) for additional information.
The following table presents changes in level 3 instruments for the nine months ended August 31, 2015:
(in thousands of Canadian dollars) Long- te rminve stme nts
Balance at December 1, 2014 $ 19,671 Purchase of investment, net of return of capital 110,727 Fair value adjustment recognized in profit or loss 3,420 Reclassif ication of investment (63)Balance at August 31, 2015 $ 133,755
There were no transfers into or out of level 1 and level 2 during the three and nine months ended August 31, 2015.
Note 19: Contingencies (a) The Company believes that it has adequately provided for income taxes based on all of the information that is currently
available. The calculation of income taxes in many cases, however, requires significant judgement in interpreting tax rules and regulations. The Company’s tax filings are subject to audits, which could materially change the amount of the current and deferred income tax assets and liabilities, and could, in certain circumstances, result in the assessment of interest and penalties.
In November 2013, the Company received a notice of reassessment (NOR) from the CRA relating to the transfer pricing and allocation of income between one of the Company’s Canadian legal entities and a foreign subsidiary, which would increase the Company’s taxes payable from its original tax filings by $10.0 million, $10.5 million and $15.4 million (before the application of interest and penalties of $21.6 million) for its 2005, 2006 and 2007 fiscal years, respectively. In November 2014, the Company also received a NOR from the CRA relating to the same matter, which would increase the Company’s taxes payable from its original tax filings by $13.6 million (before the application of any interest and penalties of $6.3 million) for its 2008 fiscal year.
The Company strongly disagrees with the CRA’s position and filed an objection to the NOR for 2005, 2006 and 2007 in February 2014 and also objected to the NOR for 2008 in February 2015. In connection with the filing of an objection to the NOR for the 2008 fiscal year, the Company was required to pay, and has paid, approximately $14.5 million (including interest and penalties) during the nine months ended August 31, 2015, even though the ultimate outcome may differ from this amount. The Company is not expected to make any further significant payments with respect to the 2005 to 2008 NOR until the resolution of this matter. Including the payments made during the nine months ended August 31, 2015, the Company has paid approximately $54.0 million with respect to the 2005 to 2008 NOR. In June 2015, the Company has received a $2.0 million refund from taxation authorities for interest relief granted with respect to the 2005-2007 NOR.
In consultation with its external advisors, the Company believes that its tax filing positions continue to be reasonable based on its transfer pricing methodology and the Company is contesting the CRA’s position and any related transfer pricing penalty. The Company believes it is likely that the CRA will reassess its taxes for subsequent years on a similar basis and that these may result in future cash payments on receipt of the reassessments. During the nine months ended August 31, 2015, the Company has recorded a tax provision of $1.1 million (2014 – $1.4 million) in relation to this transfer pricing audit. The amount of tax provision recorded on the consolidated interim statement of financial position reflects management’s best estimate of the final payment to be made on the ultimate resolution of this matter and includes any related estimated interest and penalties for the 2005 to 2015 fiscal years.
Further to the Company’s objection to the NOR, the Company is also seeking Competent Authority relief from double taxation under the applicable tax treaty. The Company’s provision, which reflects its best estimate of the final payment to be made on the ultimate resolution of this matter, includes an expected recovery of approximately $14.8 million for the tax years

AGF Management Limited Notes to Condensed Consolidated Interim Financial Statements
AGF Management Limited – 40 – Third Quarter Report 2015
2005 through 2010. Any relief from double taxation should be granted at the completion of the mutual agreement procedures (“MAP”) under the applicable tax treaty.
In 2013, the Company was accepted by the CRA into a Bilateral Advance Pricing Arrangement (BAPA) between Canada and the relevant tax authorities to establish the appropriate transfer pricing methodologies for the tax years 2009 through 2016. However, due to time limitation on the applicable tax treaty, the Company was subsequently informed by the CRA during the third quarter of 2015 that tax years 2009 and 2010 are no longer covered under the BAPA. The Company is therefore subject to transfer pricing reassessments from the CRA for 2009 and 2010, and any relief from double taxation shall be granted at the completion of the MAP as described above. Under a BAPA, the taxpayer can avoid potential double taxation on transactions covered by the BAPA according to the provisions of the income tax treaty between Canada and the foreign country.
The final result of the audit and appeals process may vary and may be materially different compared to the estimates and assumptions used by management in determining the Company’s consolidated income tax provision and in valuing its income tax assets and liabilities.
(b) In May 2015, the Company received a proposal letter from the CRA relating to foreign accrual property income (FAPI)
earned by its foreign subsidiaries for the 2007 to 2012 fiscal years. The 2007 fiscal year has since been statute-barred. The Company strongly disagrees with the CRA’s position on technical merits and responded to the proposal letter accordingly. In September 2015, as a result of further review, the CRA has withdrawn its proposal on this issue for the 2008 to 2012 fiscal years. The amount of taxes payable reflected in the proposal letter from the CRA in respect of the FAPI issue was estimated at $20.3 million for the 2008 to 2012 fiscal years (excluding any interest and penalties of $7.8 million accrued up to August 31, 2015). Despite the withdrawal of the proposal letter, the audit for the 2008 to 2012 fiscal years continues. Management continues to believe that its tax position is correct and has not recorded a provision for this issue.
(c) In July 2015, the Company received a NOR from the CRA denying $30.5 million of tax-related benefits acquired and utilized by the Company in the 2005 fiscal year. The NOR would increase the Company’s taxes payable from its original tax filings by $10.9 million (before the application of interest and penalties of $9.7 million). The Company strongly disagrees with the CRA’s position and will object to the NOR.
As a result of receiving the NOR, the Company has paid $5.9 million (including interest and penalties) during the three months ended August 31, 2015. Such payment was recorded as a receivable in the income tax liability on the consolidated interim statement of financial position. The ultimate outcome of this matter is not yet determinable.
In consultation with its external advisors, the Company believes that its tax position is probable of being sustained and, as a result, has not recorded a provision in relation to this matter. The outcome of the NOR and anticipated objection is highly uncertain and the final result may vary compared to the estimates and assumptions used by management in determining the Company’s consolidated income tax provision and in valuing its tax assets and liabilities. Depending on the ultimate outcome of this matter, there may be a material impact on the Company’s financial position, results of operations and cash flows.
Note 20: Commitments During the nine months ended August 31, 2015, AGF entered into an agreement with Citigroup Fund Services Canada Inc. (CFSC) to transition the Company’s transfer agency function from CFSC to AGF. The transition, which will include the transfer of approximately 185 employees from CFSC to AGF, is expected to be completed early in 2016. AGF will not compensate CFSC for the business but will invest approximately $6.0 million of capital for leaseholds, facilities and technology. As part of this transition agreement, AGF also entered into a four-year service agreement with L&T Infotech Financial Services Technologies Inc. (L&T). The agreement with L&T includes a minimum annual revenue commitment.
This report contains forward-looking statements with respect to AGF, including its business operations, strategy, financial performance and condition. Although management believes that the expectations reflected in such forward-looking statements are reasonable, such statements involve risks and uncertainties. Actual results may differ materially from those expressed or implied by such forward-looking statements. Factors that could cause results to differ materially include, among other things, general economic and market factors including interest rates, business competition, changes in government regulations or in tax laws, and other factors discussed in materials filed with applicable securities regulatory authorities from time to time.