agf management limited
TRANSCRIPT

AGF Management LimitedEarnings Conference CallThird Quarter 2021
September 29th, 2021

Caution Regarding Forward-Looking StatementsThe forward looking information is provided as of September 29, 2021. Certain information presented in these remarks and in thispresentation that is not historical factual information may constitute forward-looking information within the meaning of securities laws. Actual results could differ materially from a conclusion, forecast or projection contained in such forward-looking information. Forward-looking information may relate to our future outlook and anticipated events or results and may include statements about AGF Management Limited ("AGF") or the investment funds it manages (the "Funds"), including business operations, strategy and expected financial performance and condition. Forward-looking statements include statements that are predictive in nature, depend upon or refer to future events or conditions, or include words such as ‘expects,’ ‘estimates,’ ‘anticipates,’ ‘intends,’ ‘plans,’ ‘believes’ or negative versions thereof and similar expressions, or future or conditional verbs such as ‘may,’ ‘will,’ ‘should,’ ‘would’ and ‘could.’ In addition, any statement that may be made concerning future financial performance (including income, revenues, earnings or growthrates), ongoing business strategies or prospects, fund performance, and possible future action on our part, is also a forward-looking statement.
Forward-looking statements are based on certain factors and assumptions, including expected growth, results of operations, business prospects, business performance and opportunities. While we consider these factors and assumptions to be reasonable based on information currently available, they may prove to be incorrect. Forward-looking statements are based on current expectations and projections about future events and are inherently subject to, among other things, risks, uncertainties and assumptions about our operations, economic factors and the financial services industry generally. They are not guarantees of future performance, and actual events and results could differ materially from those expressed or implied by forward-looking statements made by us due to, but not limited to, important risk factors such as level of assets under our management, volume of sales and redemptions of our investment products, performance of our investment funds and of our investment managers and advisors, client-driven asset allocation decisions, pipeline, competitive fee levels for investment management products and administration, and competitive dealer compensation levels and cost efficiency in our investment management operations, as well as general economic, political and market factors in North America and internationally, interest and foreign exchange rates, global equity and capital markets, business competition, taxation, changes in government regulations, unexpected judicial or regulatory proceedings, technological changes, cybersecurity, the possible effects of war or terrorist activities, outbreaks of disease or illness that affect local, national or international economies (such as COVID-19), natural disasters and disruptions to public infrastructure, such as transportation, communications, power or water supply or other catastrophic events, and our ability to complete strategic transactions and integrate acquisitions, and attract and retain key personnel. We caution that the foregoing list is not exhaustive. The reader is cautioned to consider these and other factors carefully and not place undue reliance on forward-looking statements. Other than specifically required by applicable laws, we are under no obligation (and expressly disclaim any such obligation) to update or alter the forward-looking statements, whether as a result of new information, future events or otherwise. For a more complete discussion of the risk factors that may impact actual results, please refer to AGF’s most recent financial statements and MD&A and, for the Funds, to each Fund’s most recent prospectus and MRFP, as applicable, all available on www.sedar.com.
2

Conference Call Participants
PresentingKevin McCreadie, CFA, MBAChief Executive Officer & Chief Investment Officer
Adrian Basaraba, CPA, CA, CFASenior Vice-President & Chief Financial Officer
Available for questionsJudy G. Goldring, LL.B, LL.D, ICD.DPresident & Head of Global Distribution
3
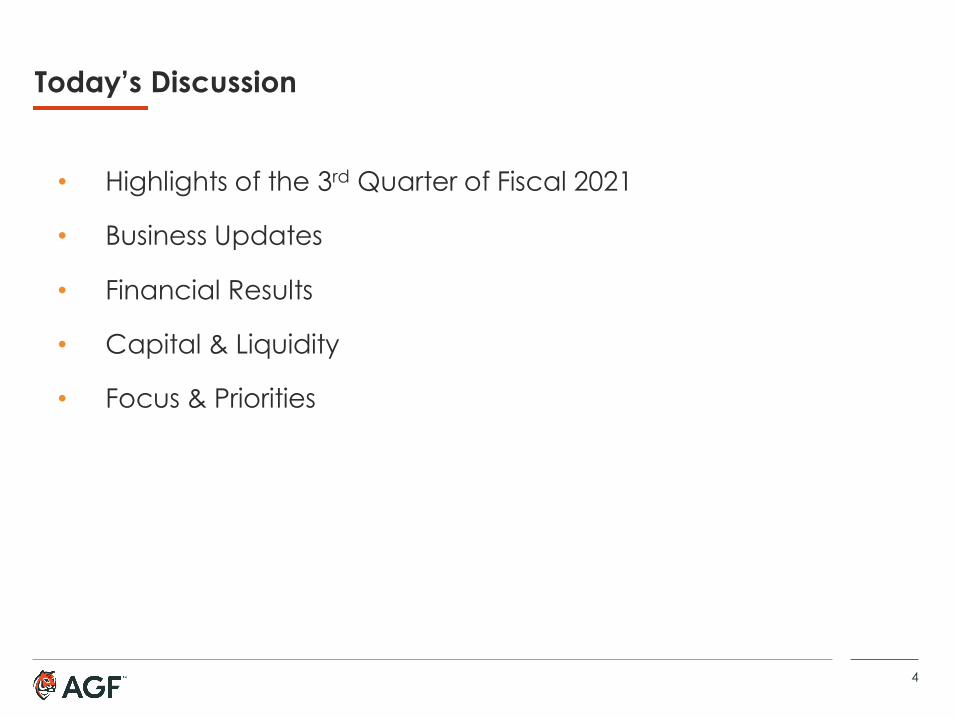
Today’s Discussion
• Highlights of the 3rd Quarter of Fiscal 2021
• Business Updates
• Financial Results
• Capital & Liquidity
• Focus & Priorities
4

Q3 2021 Highlights
Continued progress toward stated objectives
Assets1 reached $43.4 billion
4th consecutive quarter
of mutual fund net sales
AGFIA2 accepted as signatory to UK
Stewardship Code
First Ascent Ventures & SAF Partnerships
Expanding our private alts. business
Adjusted diluted
EPS of $0.21 163% higher than
prior year3
AGF Scholarship Fund
for Indigenous students via partnership with Indspire
(1) Include AUM and fee-earning assets.(2) AGF International Advisors Company Limited (AGFIA)(3) Q3 2020 adjusted diluted EPS of $0.08 excluding Smith & Williamson.
5

Line of Business Performance: Assets Under Management and Fee-earning Assets1
($ millions) Q3 2020 Q3 2021 Change
Mutual funds 19,232 23,792 24%
Institutional, Sub-advisory & ETF 9,252 10,302 11%
Private Client 5,773 7,073 23%
Private Alternatives2 2,207 2,193 (1%)
Total AUM and fee-earning assets 36,464 43,360 19%
(1) Total AUM and Private Alternatives AUM have been reclassified and restated to exclude co-investment AUM for comparative purposes.
(2) Private Alternatives includes AUM and fee-earning assets.
6

Mutual Fund Business Review
Industry Sales ($B)1
58 57
67
100 95
83
(15)
11 11
40 33 33
Q2 2020 Q3 2020 Q4 2020 Q1 2021 Q2 2021 Q3 2021
Gross Sales Net Sales
AGF Retail Mutual Fund Sales ($M)2
450 490
648
1,033 1,032
790
(93)
(4)
66
376 431
288
Q2 2020 Q3 2020 Q4 2020 Q1 2021 Q2 2021 Q3 2021
Gross Sales Net Sales
(1) Industry long-term funds gross and net sales per Investor Economics and IFIC.(2) Retail mutual fund net sales (redemptions) calculated as reported mutual fund net sales (redemptions) less non-recurring
institutional net sales (redemptions) in excess of $5 million invested in our mutual funds.
7
+46%YoY
+129%YoY
+$524YoY
+$292YoY
+61%YoY
+63%YoY
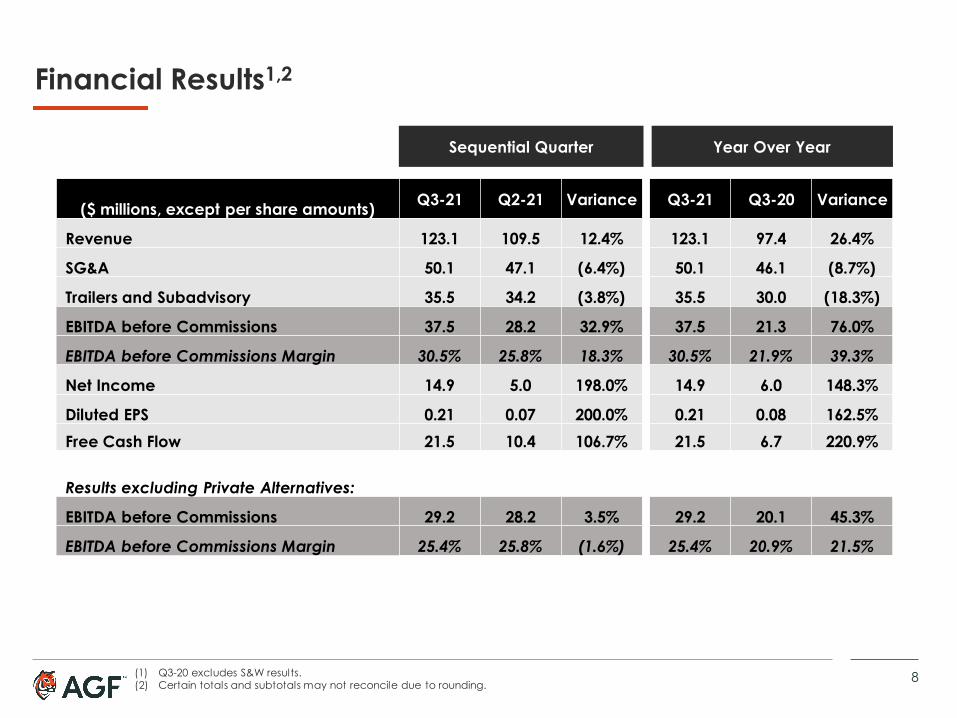
Financial Results1,2
Sequential Quarter Year Over Year
($ millions, except per share amounts) Q3-21 Q2-21 Variance Q3-21 Q3-20 Variance
Revenue 123.1 109.5 12.4% 123.1 97.4 26.4%
SG&A 50.1 47.1 (6.4%) 50.1 46.1 (8.7%)
Trailers and Subadvisory 35.5 34.2 (3.8%) 35.5 30.0 (18.3%)
EBITDA before Commissions 37.5 28.2 32.9% 37.5 21.3 76.0%
EBITDA before Commissions Margin 30.5% 25.8% 18.3% 30.5% 21.9% 39.3%
Net Income 14.9 5.0 198.0% 14.9 6.0 148.3%
Diluted EPS 0.21 0.07 200.0% 0.21 0.08 162.5%Free Cash Flow 21.5 10.4 106.7% 21.5 6.7 220.9%
Results excluding Private Alternatives:
EBITDA before Commissions 29.2 28.2 3.5% 29.2 20.1 45.3%
EBITDA before Commissions Margin 25.4% 25.8% (1.6%) 25.4% 20.9% 21.5%
(1) Q3-20 excludes S&W results.(2) Certain totals and subtotals may not reconcile due to rounding. 8
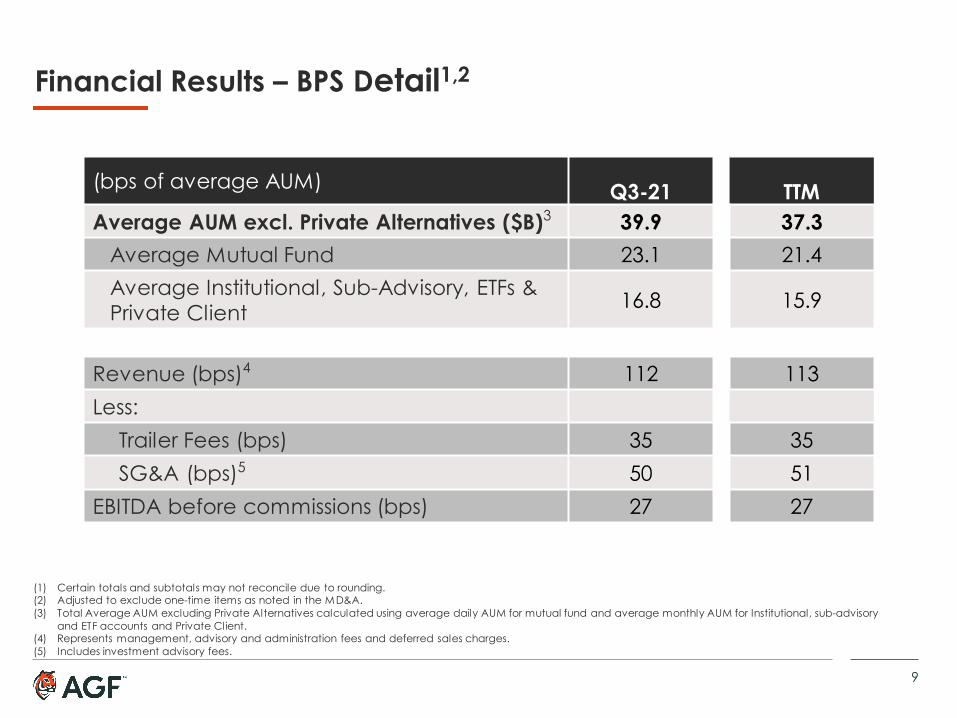
Financial Results – BPS Detail1,2
(bps of average AUM) Q3-21 TTMAverage AUM excl. Private Alternatives ($B)3 39.9 37.3
Average Mutual Fund 23.1 21.4Average Institutional, Sub-Advisory, ETFs & Private Client 16.8 15.9
Revenue (bps)4 112 113Less:
Trailer Fees (bps) 35 35SG&A (bps)5 50 51
EBITDA before commissions (bps) 27 27
(1) Certain totals and subtotals may not reconcile due to rounding.(2) Adjusted to exclude one-time items as noted in the MD&A.(3) Total Average AUM excluding Private Alternatives calculated using average daily AUM for mutual fund and average monthly AUM for Institutional, sub-advisory
and ETF accounts and Private Client.(4) Represents management, advisory and administration fees and deferred sales charges. (5) Includes investment advisory fees.
9
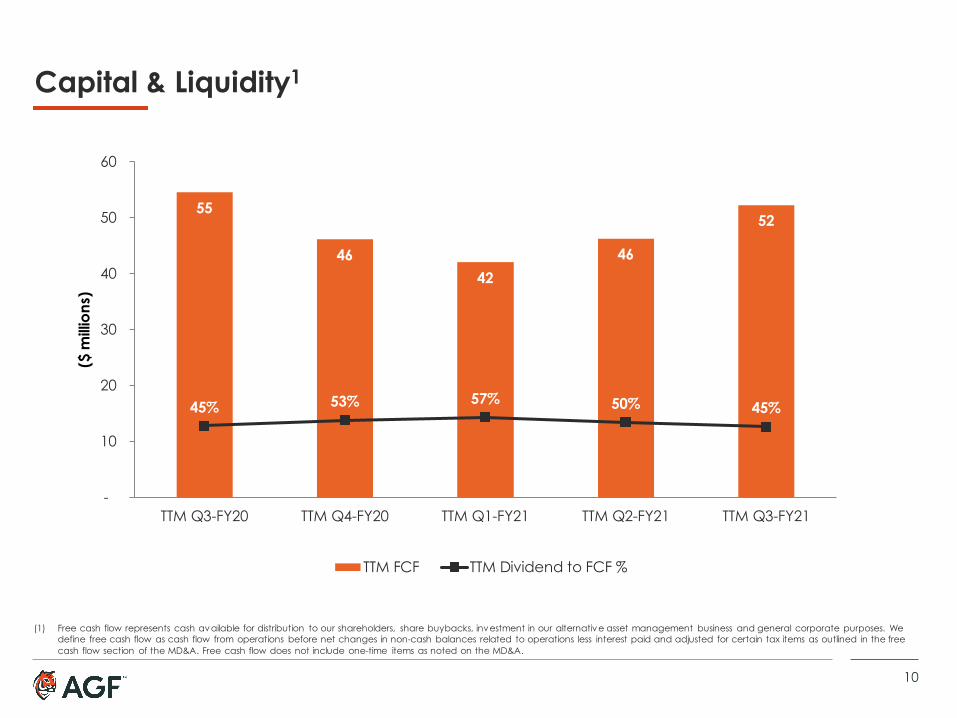
Capital & Liquidity1
55
4642
46
52
45% 53% 57% 50% 45%
-50%
0%
50%
100%
150%
200%
250%
300%
350%
400%
-
10
20
30
40
50
60
TTM Q3-FY20 TTM Q4-FY20 TTM Q1-FY21 TTM Q2-FY21 TTM Q3-FY21
($ m
illion
s)
TTM FCF TTM Dividend to FCF %
(1) Free cash flow represents cash available for distribution to our shareholders, share buybacks, investment in our alternative asset management business and general corporate purposes. We define free cash flow as cash flow from operations before net changes in non-cash balances related to operations less interest paid and adjusted for certain tax items as outlined in the free cash flow section of the MD&A. Free cash flow does not include one-time items as noted on the MD&A.
10
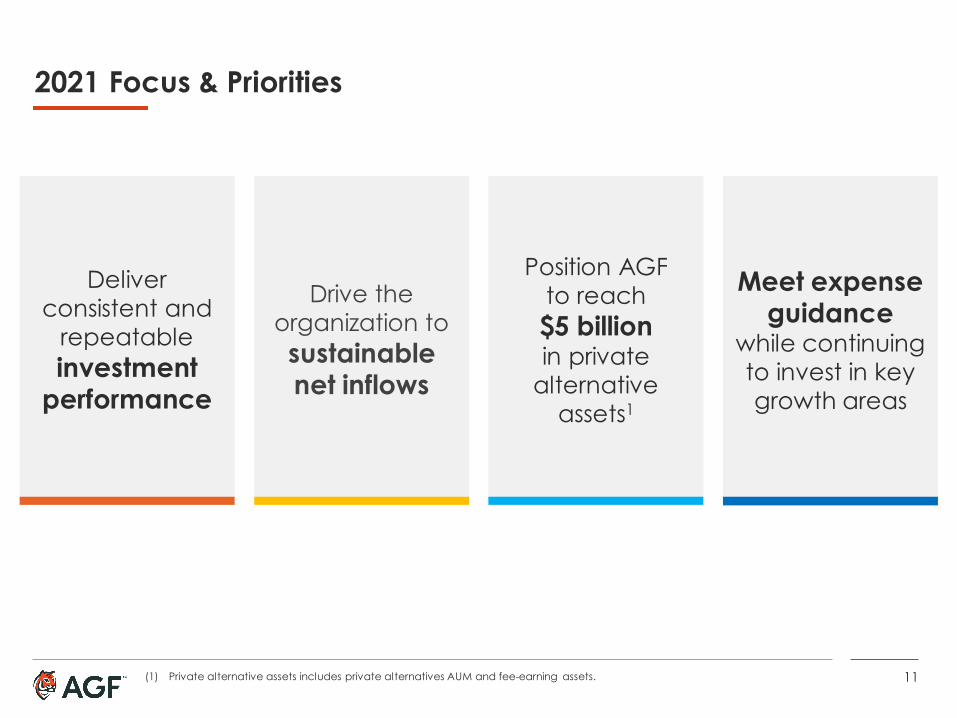
2021 Focus & Priorities
Deliver consistent and
repeatable investment
performance
Drive the organization to sustainable net inflows
Position AGF to reach $5 billion in private
alternative assets1
Meet expense guidance
while continuing to invest in key growth areas
(1) Private alternative assets includes private alternatives AUM and fee-earning assets. 11
Thank You!To learn more about AGF’s history visit:www.agf.com/ca/en/about-agf/our-story