agent-based real-time signal coordination in congested ... · learning (rl) methods for signal...
TRANSCRIPT

USDOT Region V Regional University Transportation Center Final Report
NEXTRANS Project No. 104IPY04
Agent-based Real-time Signal Coordination in Congested Networks
By
Juan C. Medina
Postdoctoral Research Associate
University of Illinois at Urbana Champaign
And
Rahim F. Benekohal (PI)
Professor
University of Illinois at Urbana Champaign
Report Submission Date: January 3, 2014

DISCLAIMER
Funding for this research was provided by the NEXTRANS Center, Purdue University under Grant
No. DTRT07-G-005 of the U.S. Department of Transportation, Research and Innovative
Technology Administration (RITA), University Transportation Centers Program. The contents of
this report reflect the views of the authors, who are responsible for the facts and the accuracy of
the information presented herein. This document is disseminated under the sponsorship of the
Department of Transportation, University Transportation Centers Program, in the interest of
information exchange. The U.S. Government assumes no liability for the contents or use thereof.

1
NEXTRANS Project 0144IPY04 Final Report, Dec 2013
Agent-based Real-time Signal Coordination in Congested Networks
Introduction
This study is the continuation of a previous NEXTRANS study on agent-based reinforcement
learning methods for signal coordination in congested networks. In the previous study, the
formulation of a real-time agent-based traffic signal control in oversaturated networks was
described and exemplified through a case study. The agent-based control was implemented using
two different reinforcement learning algorithms: Q-learning and approximate dynamic
programming. Also, the performance of the network was evaluated using the max-plus algorithm
to provide explicit coordination between the agents. The RL algorithms and max-plus showed
satisfactory performance and were able to efficiently process traffic, reducing the frequency of
queue spillbacks and preventing gridlocks.
This study extends the previous implementations and describes the use of explicit coordinating
mechanisms with Q-learning, mainly through a modified max-plus version developed throughout
this research project. A traffic network similar to that in the previous study is used to compare
the results without explicit coordination, with the standard max-plus and the enhanced
coordination. Results indicate that the enhanced coordination has the potential to further
improve signal operation mainly by reducing the number of stops per vehicle, while maintaining
an efficient vehicle processing rate.
In addition, two more topics were explored and are presented in this report: the use of a function
approximation to reduce memory requirements from large lookup tables and speed up
convergence by means of generalization, and the effects of imperfect information received by
the agents or faulty detectors.
The case studies analyzed in this report are focused on oversaturation and thus, on managing
traffic efficiently while preventing queue spillbacks and gridlocks. In this sense the applications

NEXTRANS Project No 0102IY041Technical Summary - Page 2
described here do not only consider closely-spaced intersections in a grid-like network, but also
high demands in all directions, resulting in scenarios where signal control is not straightforward.
For this reason, it is expected that the findings in this report are also applicable to less challenging
scenarios with similar configurations.
Findings
Compared to a multi-agent system without the enhanced coordination, in the operational mode
(after agents were trained) coordination consistently increased total network throughput in
every simulation run, with an average increase of 4% (about 750 vph). Average number of stops
per vehicle were reduced by about 6% (which represented more than 5000 stops in an hour), and
the proportion of vehicles stopped in the network was lower in more than 75% of the time.
An alternative scenario representing noise in input data or having sink/source points along the
link represented (when turning movements were unaccounted for in the agent’s state definition
or the reward function), showed improved network performance but to a lesser degree, as
expected. The algorithm also provided increased throughput for conditions when traffic demands
are uneven in competing directions of traffic, which represents a more obvious coordination even
for agents without running any coordination algorithm.
On the other hand, a simple linear function approximation of the Q values implemented in the
4x5 oversaturated network was effective for the fully decentralized system proposed in this
research. It accounted for discontinuities generated by penalties in the reward structure when
there was potential for blockage due to downstream congestion and due to lost times when a
phase was terminated.
The function approximation resulted in 1% reduction in the total network throughput and about
3% increase in the number of stops. Therefore, simple approximations such as the one performed
in this study is suitable for systems where these performance drops are acceptable and also in

NEXTRANS Project No 0102IY041Technical Summary - Page 3
cases where fast convergence is needed. Analysis of the policies generated by the agents using
the function approximation showed that the agent behavior followed expected trends, with
phase assignments that were proportional to the state in the two competing traffic directions
and the phase duration.
Finally, the sensitivity of the agents to imperfect incoming information showed that as the sensor
data was increasingly aggregated, performance decreased at a faster rate, as expected. For the
test network and the specified traffic demands, decrease in the total network throughput and
occasional widespread occurrence of blockages was clearly developed at a 50% of the resolution
of the base case. Both throughput and number of stops per vehicle show the negative effects of
the lower data resolution on the performance of an average episode as well as the variability
(standard deviation) of the system in all episodes together. While it was expected to find lower
performance by reducing the resolution of the sensor data, the magnitude of these effects was
not known. It is noted that even in highly oversaturated conditions it was not until the detector
data dropped to half of the initial resolution that the system was critically affected, therefore
showing low sensitivity and robustness at lower aggregation levels.
Recommendations
Enhanced coordination is one of various additions for achieving a more efficient traffic control
system using artificial intelligence in the form of reinforcement learning with a decentralized
architecture. The proposed addition to max-plus provides a new perspective on this type of
applications by adding the concept of corridors in both the state definition and reward. Future
and ongoing additions to the multi-agent system include optimization of signals for multimodal
operations and signal preemption. Additional testing is also recommended in other network
configurations and under varying traffic conditions.
Further analysis of the policies developed using a function approximation are necessary to
understand how the generalization process helped shaping the learned values, and under what

NEXTRANS Project No 0102IY041Technical Summary - Page 4
conditions the function may not provide a good estimate. Alternative implementations using
other function approximation techniques are also recommended for further analysis.
The reliability of the multi-agent system was analyzed under uniform degradation of the precision
of the incoming data. Additional analysis with degradation of the data occurring randomly at
different points in the network will be useful to understand the agents’ sensitivity and response
to random sensors failures. In addition, other scenarios including work zones (long term lane
closures), incidents (short term lane closures), weather effects, etc, are recommended to fully
understand their effects in a network with closely-spaced intersections and intercommunicated
agents.

NEXTRANS Project No 0102IY041Technical Summary - Page 5
Contacts
For more information:
Professor Rahim F. Benekohal University of Illinois at Urbana Champaign 205 N Mathews Ave Urbana, IL, 61801 Phone number: 217-244-6288 Fax number: 217-333-1924 Email Address: [email protected]
NEXTRANS Center Purdue University - Discovery Park 2700 Kent B-100 West Lafayette, IN 47906 [email protected] (765) 496-9729 (765) 807-3123 Fax www.purdue.edu/dp/nextrans

vi
NEXTRANS Project No. 0102IY04
Dynamic Multi Modal Multi-Objective Intersection Signal Priority Optimization
By
Juan C. Medina
Postdoctoral Research Associate
University of Illinois at Urbana Champaign
And
Rahim F. Benekohal (PI)
Professor
University of Illinois at Urbana Champaign
Report Submission Date: January 3, 2014

vii
Contents
1 INTRODUCTION ....................................................................................................................... 9
2 BACKGROUND ....................................................................................................................... 11
2.1 Explicit Signal Coordination ............................................................................................ 11
2.2 Function Approximation in Reinforcement Learning..................................................... 16
3 IMPLEMENTATION ................................................................................................................ 19
3.1 Enhanced Coordination of Agents ................................................................................. 19
3.1.1 Enhanced Coordination Algorithm ......................................................................... 19
3.1.2 Application of Enhanced Coordination in the Learning Process ............................ 22
3.2 Function Approximation ................................................................................................ 23
4 CASE STUDY ........................................................................................................................... 27
4.1 Testing the Enhanced Coordination ............................................................................... 28
4.2 Testing the Function Approximation.............................................................................. 29
5 RESULTS & ANALYSIS ............................................................................................................ 31
5.1 Enhanced Coordination Algorithm ................................................................................. 31
5.1.1 Scenario a - Oversaturation and no Turning Movements ...................................... 33
5.1.2 Scenario b - Oversaturation, with Turning Movements ......................................... 36
5.1.3 Scenario c - Oversaturation with Greater Demands along N-S Corridors .............. 37
5.2 Function Approximation ................................................................................................ 39
5.2.1 Policies .................................................................................................................... 41
5.3 Effects of Imperfect Information on the Agents’ Performance ..................................... 48

viii
6 FINDINGS AND CONCLUSIONS .............................................................................................. 53
7 REFERENCES .......................................................................................................................... 56

9
1 INTRODUCTION
This study is the continuation of a previous NEXTRANS study on agent-based reinforcement
learning (RL) methods for signal coordination in congested networks. In the previous study, the
formulation of a real-time agent-based traffic signal control in oversaturated networks was
described and exemplified through a case study. The agent-based control was implemented using
two different reinforcement learning algorithms: Q-learning and approximate dynamic
programming. Also, the performance of the network was evaluated using the max-plus algorithm
to provide explicit coordination between the agents. The RL algorithms and max-plus showed
satisfactory performance and were able to efficiently process traffic, reducing the frequency of
queue spillbacks and preventing gridlocks. The RL traffic control is completely flexible and can
react fast to sudden changes in demands or traffic conditions by having a cycle-free and
decentralized operation, also offering good scalability and lower vulnerability.
This study extends the previous implementations and describes the use of an explicit
coordinating mechanism with Q-learning, specifically through an enhanced version of the max-
plus algorithm developed throughout this research project. In addition, two more topics were
explored and are presented in this report: the use of a function approximation to avoid the use
of large lookup tables and speed up convergence by means of generalization, and the effects of
imperfect information received by the agents or faulty detectors.
The case studies analyzed in this report are focused on oversaturation and thus, on managing
traffic efficiently while preventing queue spillbacks and gridlocks. In this sense the applications

10
described here do not only consider closely-spaced intersections in a grid-like network, but also
high demands in all directions, resulting in scenarios where signal control is not straightforward.
For this reason, it is expected that the findings in this report are also applicable to less challenging
scenarios with similar configurations.
The remaining of the report is organized as follows. Chapter 2 provides a brief account of past
research regarding communication and coordination of agents in multi-agent environments, as
well as function approximation approaches; Chapter 3 describes details on the implementation
of the enhanced coordination and the function approximation, including the formulation of the
problem for a congested network; Chapter 4 introduces the case study and the conditions in
which the simulation runs were conducted; Chapter 5 presents the results and the analysis of the
coordination algorithm, function approximation, and the effect of imperfect information on the
agents’ performance; Finally, conclusions and recommendations are in Chapter 6.

11
2 BACKGROUND
2.1 Explicit Signal Coordination
Solving the traffic signal control problem and generating a traffic control policy for long-terms
optimal rewards is a difficult task because the system evolves over time based on complex
stochastic processes. The system behavior depends on a wide variety of combination of driver
and vehicle types that produces a series of stochastic trajectories for identical initial conditions.
Driver characteristics such as reaction times, acceleration and deceleration rates, desired speeds,
and lane changing behavior are examples of variables that directly affect the evolution of the
system state over time. Also, in congested conditions, it is of outmost importance to maintain
acceptable operational levels in the whole network, since queue spillbacks and traffic
breakdowns may extend to greater areas and ultimately collapse the system.
Modeling the traffic state as a stochastic process that follows the Markov property, the control
of the traffic signals can be described as a Markov Decision Process (MDP) and there is potential
for finding efficient solutions using RL strategies, also suitable for real time decision support. In
this study, the Q-learning algorithm is used because it is able to address processes with sequential
decision making, do not need to compute the transition probabilities, and is well suited for high
dimensional spaces. Some of the details of the Q-learning implementation were presented in a
previous NEXTRANS report by the authors (Medina and Benekohal, 2012).

12
In addition to agents acting independently, they can also receive information from adjacent
intersections and incorporate it into their decision-making process. This can be achieved in the
form of extended state representations, changes in the reward structure, experience sharing (Q
values), or a combination of these elements. Information sharing can lead to emergent
coordinated behavior that may result in favorable signal progression along corridors, thereby
improving network performance (Medina et al., 2010).
Researchers have also studied other techniques to explicitly create coordinated behavior by
creating temporary groups or coalition of agents. There is extensive research in this area for other
applications than traffic control, and most of the work has been originated from the artificial
intelligent community. Given the focus of this particular report, the review provided here is
centered on cooperative agents that share or exchange information in a decentralized system to
achieve better system-wide performance. Some of the mechanisms for coordinating agents in
the traffic signal control domain are described below. This review is not meant to be
comprehensive, but intended to illustrate some of the approaches used in past research.
Nunez and Oliveira (2003) included a feature for heterogeneous agents to request advice from
agents with a better performance index, similar to supervised learning. Agents exchanged their
state, the best action for such state (as a means of advice), as well as their performance index.
The effects of the advice exchange were tested using a series of 96 individual intersections (not
along an arterial) in a simple simulator, where each intersection had a different learning
algorithm. Results showed that the advice exchange was likely to improve performance and
robustness, but ill advice was also said to be a problem hindering the learning process.
De Oliveira et al. (2006) used a relationship graph as a support for the decision-making process.
Related agents entered a mediation process to determine the best set of actions. Agents had
priorities and the one with highest value was the leader of the mediation. Branch-and-bound was
performed to find the best outcome of the sub-problem. The test was conducted on a 5×5
network in a very simple simulation environment provided by a generic tool for multiagent

13
systems (not a traffic-specific environment). Temporary group formation was achieved and
resulted in improved performance in terms of a cost function, compared to pre-timed
coordinated signals. The agents regrouped (through a new mediation) when traffic patterns
changed, adapting to new conditions.
The max-plus algorithm has been used by other researchers (Vlasssis et al, 2004; Kok et al., 2005,
2006) and it emerges as a viable option for controlling the traffic signals in a network. The max-
plus algorithm uses a message-passing strategy that is based on the decomposition of the
relations in a coordination graph as the sum of local terms between two nodes at the time. This
allows the interchange of messages between neighboring intersections, such that in a series of
iterations the agents will reach a final decision based on their own local payoff function as well
as the global payoff of the network.
Kuyer et al. (2008) used coordination graphs and the max-plus algorithm to connect intersections
close to each other. Networks having up to 15 intersections were tested, finding improved results
compared to Wiering and Shmidhuber (1997) and Bakker et al. (2005). Also, De Oliveira et al.
(2004) made significant contributions using approaches based on swarm intelligence, where
agents behave like a social insect and the stimuli to select one phase or plan is given by a
“pheromone” trail with an intensity related to the number and duration of vehicles in the link.
A different approach by Junges and Bazzan (2007) studied a strategy using a distributed
constraint optimization problem for networks of up to 9×9 intersections, but only for the task of
changing the offset of the intersections given two different signal plans. A scenario without online
capabilities to change the coordinated direction was compared with the coordinated scheme,
showing improvements in the performance. However, for frequent action evaluations, and for
bigger networks, the methodology may not be practical as the computation time increases
exponentially with the number of agents.

14
The max-plus algorithm has been used by the authors (Medina and Benekohal, 2012) to provide
an indication of good coordinating actions, and these results were incorporated to the reward
structure of a RL agent in the form of an incentive towards the coordinated direction. This
addition to the standard definition of a reward is expected to create a tendency to increase the
system throughput and reduce the number of stops.
The max-plus algorithm as explained by Kok and Vlassis (2006) was incorporated in the traffic
control problem, as follows. Let’s suppose that the traffic network is a graph with |V| vertices
(or intersections) and |E| edges (or links). To find the optimal action in the network (a*), agent i
repeatedly sends the following message uij to its neighbors j:
Where Γ(i)\j are all neighbors of i except j, and cij is a normalization value. Message uij is an
approximation of the maximum payoff agent i can achieve with every action of j, and it is
calculated as the sum of the payoff functions fi, fij, and all other incoming messages to agent i,
except that from agent j. Messages uij are exchanged until they converge to a fixed point or until
the agents are told to stop the exchange due to an external signal, for example after the time
available to make a decision is over. It is noted that the messages only depend on the incoming
messages of an agent’s neighbors based on their current actions, thus there is no need to have
these messages optimized, nor evaluated over all possible actions.
On the other hand, the normalization value cij is very useful especially on graphs with cycles since
the value of an outgoing message uij eventually becomes also part of the incoming message for
agent i. Thus, in order to prevent messages from growing extremely large, the average of all
values in uik is subtracted using:
ijj\)i(k
ikijiijiia
jij caua,afafmaxauj
k
kik
k
ij auA
1c

15
In terms of the actual algorithm implementation, the research team decided to use a centralized
system of the max-plus algorithm, given that the agents are implemented in a microscopic traffic
simulator where the states updates in a synchronous fashion. For real-world implementations
the decentralized version of the algorithm should be used. The pseudo code of the centralized
algorithm is shown in Figure 2-1, following the implementation described in Kok and Vlassis
(2006).
Figure 2-1 - Pseudo code of max-plus algorithm, adapted from Kok and Vlassis (2006)

16
2.2 Function Approximation in Reinforcement Learning
Different forms of reinforcement learning, and specifically the original formulations of Q-learning
used in this research, make use of lookup tables to store an agent’s past experience and
knowledge. While tables have the advantage of recording precise information on experiences
from every single state that has been visited, it is expensive in terms of storage requirements and
it doesn’t generalize past experiences to similar states.
Alternatives have been proposed to store an agent’s knowledge using structures different from
lookup tables. A common approach is the use of other structures or a series of functions to model
the change of an agent’s perception of reward in a more compact fashion. These techniques will
be referred in this research as function approximation methods.
Before elaborating on the approach adopted in this study to implement a function
approximation, it is appropriate to first motivate its use by describing some potential benefits.
As expected, the advantages of using function approximation mainly aim at counteracting the
limitations of lookup tables mentioned above: storage requirements and generalization. Storage
requirements are reduced by having a more compact representation of the agent’s knowledge
and the magnitude of these reductions depend on the number of functions and features included
in a given implementation. On one end, if all elements perceived by the agents (and included in
the state) are incorporated in the same number of functions, a great number of parameters will
be required and the reduction in storage requirements may not be as critical as expected.
However, if the number of functions is reduced and the elements can be combined efficiently,
the storage allocation will be a major benefit achieved with a function approximation.
In addition to lessen storage requirements, function approximation also provides a generalization
of the lookup table that is useful to obtain information about states that have not been visited
or those from which not enough experience has been gathered. This is because it is often the

17
case that states with similar characteristics will tend to produce similar Q values in the lookup
tables, with the exception of boundaries or discontinuities.
In particular, for our traffic signal problem, features to be used in a function approximation could
be related to current traffic demands, queues, delays or any other feature to which the agent has
access in order to estimate the state values (or discounted rewards). Therefore, it may be
convenient to include in the functions a set of features with impact on the state and reward
definitions, and moreover, those features having a significant role in the estimation of Q values
if a lookup table were used.
The combination of features to approximate the lookup table may include linear or non-linear
regressions methods, decision trees, and often in practice, artificial neural networks to model
complex interactions. It is recognized, however, that simple solutions may be preferred over
complex ones, and the exploration of linear regressions should precede more elaborated
methods.
General approaches to produce a more compact state or action representation through function
approximation have recently been summarized for the robot reinforcement learning domain by
Kober and Peters (2012) in the following: neural networks (multi-layer perceptrons, fuzzy neural
networks, and explanation-based neural networks), generalization from neighboring cells, local
models through regression, and Gaussian model regression.
Earlier work by Mahavedan and Connell (1991) proposed basic but key ideas for generalization
of the state space from neighboring cells through the use of the Hamming distance, a measure
to determine how different states are based on the number of bits that are different between
them. This form of generalization significantly sped up the learning process but it was dependent
on the state encoding. Further refinements also by the same authors featured statistical
clustering for generalization, which reduced coding limitations of the Hamming distance by
grouping states based on the effect that an action will have on them. Generalization with

18
Hamming distance improved learning time of standard Q-learning with lookup tables, and it was
further improved by implementing the statistical clustering for the domain of a mobile robot.
Neural network applications opened their way into reinforcement learning with research by
Barto and Anandan (1985). Implementations for decisions between multiple actions (not only
two possible actions) have been proposed by past research, perhaps being the QCON proposed
by Lin (1993) one of the earliest ones, with the drawback of having as many networks as the
number of possible actions the agent can take. This is circumvented, as shown by Mahadevan et
al. (1991) by modifying the network structure and having one output neuron for each action set,
where sets are ‘antagonists’ or play opposed roles for the agent.
Neural networks have been used since in a very wide range of applications, including traffic signal
control. A series of approaches have been proposed, from completely centralized to partially and
fully decentralized. Research by Bingham (1998, 2001) in traffic signal control using fuzzy rules
and a neural network, Abdulhai (2003) using a Cerebellar Model Articulation Controller (CMAC),
Choy et al. (2003) with hierarchical agents and a neural network, and Xie (2007) and Zhang (2007),
are examples in this domain.
On the other hand, Irodova and Sloan (2005) described examples of earlier research on function
approximation for model-free reinforcement learning, such as Q-learning. They cite the
formulations by Stone and Veloso (1999) using a function approximation for a multi-agent system
based on action-dependent features to partition the state space into regions, and the seminal
book by Russel and Norvig (2003) “Artificial Intelligence, a Modern Approach”. The work
conducted by Irodova and Sloan followed a different approach using a linear approximation, and
is important to the research presented in this document since this was the approach adopted in
this study.

19
3 IMPLEMENTATION
3.1 Enhanced Coordination of Agents
Previous analysis have shown that the addition of Max-Plus in the reinforcement learning process
as formulated in (Medina and Benekohal, 2012), has the potential for improving network
performance; however, an important limitation was the conflicting coordination between
neighboring intersections.
This situation can be illustrated when the demands at two adjacent intersections suggest that
there should be coordination along the direction of the link connecting them, but the influence
from other neighbors result in only one of the intersections assigning green light to that direction.
This, and other similar cases were frequently observed when max-plus alone was implemented
in a saturated network, where differences in link occupancy was high and conflicting coordination
did not result in multiple intersections assigning green time along the same direction. Thus, an
improvement was needed.
3.1.1 Enhanced Coordination Algorithm
In an effort to improve the performance of max-plus, specifically for traffic signal systems, it was
desirable to reduce the conflicting coordination between neighboring agents. This could be
achieved by adding coordination along corridors, thus extending the area of influence of a
coordinated move using a proposed strategy that is referred to as “enhanced coordination”.

20
In the enhanced coordination, each intersection takes the results from max-plus and
communicates the preferred direction of coordination among neighboring agents, as well as the
ratio between benefits of the coordinated and the competing directions (called “decision
strength”). Benefits of each direction can be found in Figure 2-1 as gi(ai).
Then, for each corridor, the frequency of agents preferring such direction is tallied and used to
create a corridor ranking. Each intersection maintains an updated list of corridors in their ranking
order, which is updated with every iteration of the max-plus algorithm. Therefore, the ranking is
updated in real-time along with max-plus and it can also function in a decentralized fashion.
Finally, each agent applies their coordinated direction and the decision strength to their learning
process.
The enhanced coordination algorithm was directly embedded into the max-plus routine. The
algorithm is described as followed in three main steps (steps 0 to 2). Steps 0 and 1 should be
executed before the max-plus algorithm, and the lines in Step 2 can be placed right after gi(ai) is
determined in Figure 2-1. It is noted that in Step 2, the score for a given corridor is increased by
an additional unit if the immediate preceding neighbor in the same corridor has the same
coordinated direction, further promoting traffic progression.
- Step 0: Definition of possible corridors for coordination (corridors can have any length
and any direction of traffic. e.g. in a grid network, a corridor can be composed of adjacent
intersections in the E-W direction):
- For all corridors, r:
Assign ra to a unique direction of traffic, found when action a is taken. i.e. E-W, N-S, or any other direction if the network is not grid-like
Initialize counters to store the current benefit (rb=0)

21
Initialize variable to store the decision strength (rs=0)
- Step 1: Initialization (before max-plus is executed):
- For all corridors, r:
Initialize counters to store the current benefit (rb=0)
Initialize variable to store the decision strength (rs=0)
- For all agents, i:
Assign all corridors, r, to which agent i belongs
- Step 2: During max-plus execution (after gi(ai) is determined in Figure 2-1):
Assign direction of coordination: 𝐷𝑖𝑟𝐶𝑜𝑜𝑟𝑑𝑖 = 𝑎𝑟𝑔max𝑎𝑖
𝑔𝑖(𝑎𝑖)
Compute decision strength: 𝐺𝑟𝑎𝑡𝑖𝑜𝑖 =max𝑎𝑖
𝑔𝑖(𝑎𝑖)
min𝑎𝑖
𝑔𝑖(𝑎𝑖)
Update corridor indices:
o For all r containing i:
rb rb +1, if 𝐷𝑖𝑟𝐶𝑜𝑜𝑟𝑑𝑖 = 𝑟𝑎 rb rb +1, if 𝐷𝑖𝑟𝐶𝑜𝑜𝑟𝑑𝑘,𝑘<𝑖 = 𝑟𝑎
rs 𝐺𝑟𝑎𝑡𝑖𝑜𝑖, if 𝐷𝑖𝑟𝐶𝑜𝑜𝑟𝑑𝑖 = 𝑟𝑎 and 𝐺𝑟𝑎𝑡𝑖𝑜𝑖 > rs Send updated ri , rs to all i belonging to r Update ranking of corridors based on changes in rb
Select coordinated direction from top-ranked corridor (r), and its strength from rs
The enhanced algorithm reduces the probability of conflicting coordination along designated
corridors, based on real-time assessments of the number of vehicles expected to be processed
by each corridor. Therefore, improvements in total network throughput are expected by
increasing the throughput of coordinated corridors.

22
3.1.2 Application of Enhanced Coordination in the Learning Process
Results from the enhanced coordination algorithm are applied in the learning process by means
of two mechanisms: a) directly in the cost function by increasing the weight of the traffic
receiving green time, and b) as a bias in the final cost when actions are compared to each other.
The implementation of these two mechanisms is further described as follows:
3.1.2.1 Mechanism A
The addition of coordination directly in the cost function allows for a wide variety of effects of
the coordination, ranging from small to large contributions in the whole cost. In the enhanced
coordination, the effects are applied at three levels based on the value of the decision strength
(rs) for the whole corridor. A larger rs indicates a larger difference between competing directions,
which can be translated to greater incentives to coordinate in the preferred direction. The three
levels of coordination are:
- Level 0: the action being evaluated is not associated with the desired direction of
coordination, therefore having no effect in the cost.
- Level 1: the action is associated with the coordinated direction, and rs is not greater than
1.2. The effect of the vehicles receiving green is increased (in this implementation, a 25%
increase was used.
- Level 2: The action is associated with the coordinated direction, and rs is greater than 1.2.
The effect of the vehicles receiving green is increased in a greater proportion than in Level
1 (in this implementation, a 50% increase was used).

23
Also, the agent is now able to see the level of coordination (0, 1, or 2) that is applied in the cost
function by means of an additional dimension in the state representation for each of the
competing directions. This allows for a direct learning of “coordinated states” separately from
“uncoordinated states”.
3.1.2.2 Mechanism B
The bias in the final reward of an action is estimated by applying the corridor rs to the action that
is associated with the coordinated direction, and the inverse of rs to the remaining actions. This
provides a subtle bias towards the coordinated direction, and promotes coordination based on
the degree of variation between demands in competing directions.
A previous implementation of the max-plus algorithm by the authors (Medina and Benekohal,
2012) included the max-plus results as a bias in the final cost only. The Gratio from the
intersection (as opposed from corridor rs) was used to bias the action associated with the
coordinated direction of the intersection based on max-plus results. Thus, in this study when
results of the enhanced coordination are compared to max-plus, the Gratio of the max-plus
results is not only included in the cost of the action associated to the coordinated direction, but
also to the other directions by using its inverse. This modification has shown improved results
and it follows the exact same ideas used in the enhanced coordination, for a more meaningful
comparison.
3.2 Function Approximation
A linear function approximation using elements from the state (and also the reward function)
was implemented following an approach based on the same learning process used for the Q-
values in the lookup tables.

24
Therefore, a similar update rule was applied to the multipliers accompanying the selected
features from the state representation. A previous work from Idorova and Sloan (2005) has been
used as a reference for the formulation of the learning process in the linear function
approximation. For a Q-learning agent, element-based actions are identified and a Q function is
created for each of such actions, which in turn include a set of multipliers that will be trained
based on the agent’s experience. Thus, a generic Q function for a given action (a) could be
expressed as follows:
Where f1, ..., fn are the features or elements representative of the state and cost, and θa1 are the
multipliers. For such Qa functions, multipliers θa1 will be updated following a standard Q-value
algorithm but with respect to the particular slope for each θa1, as follows:
𝜃𝑘𝑎(𝑠, 𝑎) = (𝑐𝑠𝑠′
𝑎 + 𝛾max𝑎′
𝑄(𝑠 ′, 𝑎′))𝑑𝑄𝑎(𝑠,𝑎)
𝑑𝜃𝑘𝑎
and,
𝜃𝑘𝑎(𝑠, 𝑎) = (1 − 𝛼)𝜃𝑘
𝑎(𝑠, 𝑎)𝑑𝑄𝑎(𝑠,𝑎)
𝑑𝜃𝑘𝑎 + 𝛼𝜃𝑘
𝑎(𝑠, 𝑎)
Where �̂�𝑎(𝑠, 𝑎) is the current estimation of the value of the state-action pair, which is later
weighted along with the past accumulated knowledge 𝑄(𝑠, 𝑎). 𝑑𝑄𝑎(𝑠,𝑎)
𝑑𝜃𝑘𝑎 is the partial derivative
of the value of the state-action pair with respect to the current multiplier θak for action a.
Similar to the lookup table representation for standard Q-learning, the expression for the
function approximation is completely decentralized and does not increase in size as the number
of intersections increases.
nan1
a1
a f...fa,sQ

25
The selection of the features to be included in the function approximation, and the number of
functions to be estimated were determined from the original definition of the reward structure
used in experiments with successful results in the case study described in the next chapter.
Thus, continuous rewards along a range of values from previous implementations were
identified, as well as the discontinuities due to penalties. More specifically, the discontinuities
were created by the indication of potential blockages in downstream links and the lost time due
to the phase change.
In the reward function from the lookup table implementation the potential for blockages (P1) was
penalized using the following expression:
Where 𝛽𝐷𝑖𝑟(𝑎) is a scaling factor for a given direction of traffic that will be selected by an action
a, set to 1 in this case; 𝑆𝐷𝑖𝑟(𝑎)2 is the square of the value of the state component in the direction
potential blockage is expected; and 𝑏𝐷𝑖𝑟(𝑎)𝑑𝑜𝑤𝑛 is the blockage factor (or blockage intensity) in the
immediate downstream intersection in the same direction of traffic, which is also reflected in the
state space as a separate dimension.
Penalty P1 will only be in effect whenever there is potential for blockage in any of the immediate
downstream intersection, and therefore will create a discontinuity in the reward function in such
cases. Given that only two directions of traffic are considered in the network, three cases are
considered: blockage in the current direction of traffic only, blockage in the two directions of
traffic, and no blockages. It is noted that for a given action the case of blockage only in the
opposing direction of traffic was not considered since it will affect the reward of the opposing
action.
down)a(Dir
2)a(Dir)a(Dir1 b*S*)a(P

26
In addition to this penalty, agents incurred in a second penalty (P2) due to lost time when the
signal phase is changed. This penalty was not always present in the reward function and therefore
it creates a discontinuity for some of the states. The value of the penalty decreased with the
phase duration, representing the greater percentage of the cycle time that is lost if phases are
changed often. The form of the penalty function is:
Where 𝑡𝑃ℎ𝑎𝑠𝑒 is the time that has elapsed since the beginning of the current phase (to be finished
by action a), 𝛽/𝐷𝑖𝑟(𝑎) is a scaling factor for the direction of traffic currently receiving green
(opposed to direction a), and 𝑆/𝐷𝑖𝑟(𝑎) is the state of such direction.
The combination of these two discontinuities due to penalties resulted in a total of six functions
to be approximated: 3 levels of blockages x 2 levels of phase changes (one per action).
Each of these functions had their own set of θa (for a given action a), which were calibrated
through the updating process described above as the agents trained. The action features selected
for the function approximation were the state of the two directions of traffic at a given time (𝑠𝐸𝑊
and 𝑠𝑁𝑆) and the current phase duration (𝑡𝑃ℎ𝑎𝑠𝑒). This indicates that a total of three sets of thetas
had to be estimated for each of the six functions, for a total of 18 parameters in the function
approximation problem for a given action.
)a(Dir/)a(Dir/
Phase
Phase2 S**
5.0t
12t*2)a(P

27
4 CASE STUDY
The proposed coordination of reinforcement learning agents and the function approximation was
evaluated in a simulated environment (VISSIM) using a traffic network that the authors have
previously studied with earlier versions of the multi-agent system (Medina and Benekohal, 2012).
This network is interesting because it offers a challenging scenario with different number of
lanes, and one-way and two-way arterials with very high demand that intersect each other. The
network geometry is based on a section of downtown Springfield, Illinois, but the traffic demands
have been increased to create a high degree of oversaturation. The network geometry and
corridor designations are shown in Figure 4-1.
The demands, in terms of number of vehicles per lane, are the same at all entry points (1000
vphpl), for a total of 27000 vph. There are greater total volumes on all the links in the N-S
direction together compared to the E-W direction.
In VISSIM, the simulations start with an empty network, thus a warm-up period needs to be
considered before data is collected. In previous work (Medina and Benekohal, 2012), the traffic
scenarios were observed during 15 minutes after a warm-up period of 400 seconds, so a single
replication of the simulated scenario was run for a total of 1300 seconds.

28
Figure 4-1 - Case study network with corridor designation.
4.1 Testing the Enhanced Coordination
For the enhanced coordinating mechanism, three scenarios were evaluated in the network: a)
oversaturation (1000 vphpl on each entry approach) with no turning movements allowed, b)
same as Scenario a, but 5% left-turns and 5% right turns are allowed at all intersections where
turning was possible, and c) when demands are 1000 vphpl on the N-S directions and 800 vphpl
in the E-W directions.
The first scenario (a) was selected to illustrate the full potential of the coordination algorithm,
with all vehicles expected in the coordinated movements actually following that path, and thus
no adverse effects from left and right turning vehicles blocking or slowing down through
movements. The second scenario (b) was selected to determine the deterioration in the
coordination benefits if 10% of the demands did not follow a through path, as the agents were

29
expecting. This is because the agents do not receive a-priori information on the intended path or
destination of the vehicles, and left-turning movements were completed on a permitted basis.
Under these conditions, left and right turners can be thought of noise or imperfect information
to the information received by the agents. Lastly, the third scenario (c) shows the differences in
the performance of the strategies when the demands are uneven and coordinating on the
direction of higher demands is a more obvious choice than in the first two scenarios.
In each of the three scenarios, three control strategies are tested: 1) agents operating without
max-plus, 2) agents with max-plus as a bias of the rewards, and 3) agents with the enhanced
coordination algorithm. The enhanced algorithm used all E-W and N-S streets as potential
corridors, thus there were 4 corridors in the E-W direction and 5 corridors in the N-S direction.
It is noted that a previous study by the authors (3,4) established that the network throughput of
the agents without max-plus (strategy 1) was similar or better to that obtained when the traffic
signal settings were optimized using a commercial package (TRANSYT7F). This assessment was
performed for the scenario with 20% left-turn and 10% right-turn traffic and for running times of
1300 seconds with 400 seconds of warm up time.
4.2 Testing the Function Approximation
Experiments were conducted to determine the performance of the agents with and without
state-action approximations using the linear approach described in Chapter 3. The scenario
selected for these experiments was same 4x5 network used for the enhance coordination under
constant oversaturated conditions and with demands at all entry links of 1000 vphpl.
Results from the first scenario were obtained during a training period of 150 replications using
the standard lookup table. Then, the agents were training starting from no knowledge using the
function approximation for the same number of replications, and the results were compare to
those with the lookup table. Overall measures of performance were analyzed, including
throughput and overage number of stops per vehicle.

30

31
5 RESULTS & ANALYSIS
5.1 Enhanced Coordination Algorithm
For each of the three control strategies, the agents were initially trained under scenario a) from
Section 4.1, i.e. with demands of 1000 vphpl at all entry points and without turning movements.
The curves of the agent training in terms of total network throughput and average number of
stops per vehicle are shown in Figures 5-1. One independent run of 1300 seconds corresponds to
a single replication in the Figure. The initial random seed was different for each replication and
the same sequence of seeds was used for the three strategies, eliminating variations in the
generated demands and making pair-wise comparisons possible.
From Figure 5-1, it is noted that the agents running the enhanced coordination reached higher
throughput levels and fewer number of stops per vehicle at the end of the training periods. It is
also noted that the curves continued improving for a greater number of replications for the
enhanced coordination, which was expected given the larger state space due to the coordinating
directions. All strategies reach a plateau when the training was stopped, after 200 replications.
After the training process, agents from strategies 1, 2, and 3 were considered in operational
mode. The three scenarios (a, b, and c) were evaluated by collecting data from 30 additional
replications running the traffic signals with the trained agents.

32
a) Network throughput
b) Stops per vehicle
Figure 5-1 - Learning curves for strategies with and without coordination
4200
4300
4400
4500
4600
4700
4800
4900
5000
5100
5200
5300
5400
5500
0 20 40 60 80 100 120 140 160 180 200
Tota
l N
etw
ork
Th
rou
gh
pu
t (V
eh
icle
s th
at
left
th
e N
etw
ork
)
Replication
3-point Moving Average (no Max-Plus)
3-point Moving Average (Max-Plus)
3-point Moving Average (Enhanced Coordination)
3
3.5
4
4.5
5
5.5
6
0 20 40 60 80 100 120 140 160 180 200
Av
era
ge
Sto
ps
pe
r V
eh
icle
Replication
3-point Moving Average (no Max-Plus)
3-point Moving Average (Max-Plus)
3-point Moving Average (Enhanced Coordination)

33
During the runs for the operational mode, measurements of the network congestion, showed
that even after 400 seconds of warm-up period, the network was still in the process of reaching
a steady state (nearly constant congestion). The congestion measurements were obtained by
observing the proportion of vehicles that were stopped or traveling at a speed of 3 mph or lower
(practically stopped). Therefore, comparisons of agents in the operating mode in terms of total
throughput and congestion, were obtained from longer runs that better represented the
congestion generated by the demands, between seconds 900 and 1800.
Extended simulation running time at the same high volume levels also represent more
challenging scenarios for a traffic control system, with longer sustained peak level demands. This
new setup paired with measurements of congestion over time also show that the agents maintain
saturation levels and prevent the network from worsening its condition.
5.1.1 Scenario a - Oversaturation and no Turning Movements
Results from the operational mode in scenario a (no turning movements and oversaturated
demands) in terms of total network throughput indicates clear performance improvements when
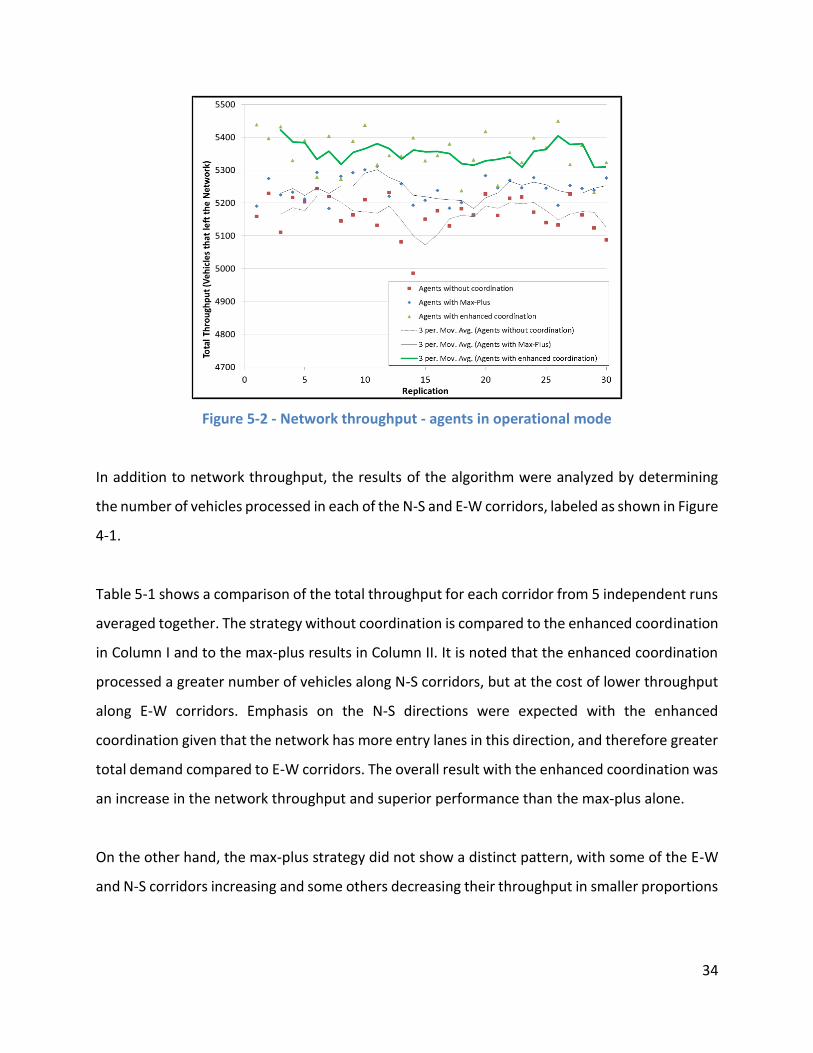
the enhanced coordination was implemented, as shown in Figure 5-2. On average, the enhanced
coordination processed about 5350 vehicles. This is, 186 vehicles more than the agents without
coordination in a 15 minute-period, or about 750 per hour. A similar comparison with the number
of stops per vehicle showed that the reduction with the enhanced coordination was on average
0.24 fewer stops per vehicle, which represents about 5200 fewer vehicle stops in an hour.
34
Figure 5-2 - Network throughput - agents in operational mode
In addition to network throughput, the results of the algorithm were analyzed by determining
the number of vehicles processed in each of the N-S and E-W corridors, labeled as shown in Figure
4-1.
Table 5-1 shows a comparison of the total throughput for each corridor from 5 independent runs
averaged together. The strategy without coordination is compared to the enhanced coordination
in Column I and to the max-plus results in Column II. It is noted that the enhanced coordination
processed a greater number of vehicles along N-S corridors, but at the cost of lower throughput
along E-W corridors. Emphasis on the N-S directions were expected with the enhanced
coordination given that the network has more entry lanes in this direction, and therefore greater
total demand compared to E-W corridors. The overall result with the enhanced coordination was
an increase in the network throughput and superior performance than the max-plus alone.
On the other hand, the max-plus strategy did not show a distinct pattern, with some of the E-W
and N-S corridors increasing and some others decreasing their throughput in smaller proportions

35
than the enhanced coordination. This resulted in small differences in throughput between Max-
Plus and the agents without coordination.
TABLE 5-1 - Individual Corridor Throughput – Average of 5 runs
An alternative measure to determine the benefits of coordination was to identify the total
number of vehicles in the network that a given point in time were stopped (defined as travelling
at less than 3.1 mph and with a headway of less than 65 ft). Adequate coordination is expected
to maintain green indication along corridors with enough demand as to reduce the overall
number of vehicles stopped in the network. In addition, for fuel consumption purposes, it is also
desired to reduce the number of vehicles idle in the network. Results for the three strategies are
shown in Table 5-2, based on the same seeds used to construct Table 5-1.
1 WB 9.4 4.6
2 EB -37 10.6
3 WB -16 -3.8
3 EB -13.6 -2.2
4 WB -14.8 -4.8
4 EB -19 -8.4
-91 -4
A SB 45.2 -10.8
B NB 21.4 -12.6
C SB 24.8 -1.8
D NB 17 -6.8
D SB 54.4 18.6
E NB 15.8 4.2
E SB 53.2 24
231.8 14.8
DirectionCorridor
Total EW
Total NS
Diffe rence in throughput compared to
agents without coordination
Enhanced
coordination
(I)
Max-plus
(II)

36
TABLE 5-2 - Comparison of Stopped Vehicles in the Network – 5 runs
Results show that for all five runs analyzed, the coordinating mechanisms resulted in fewer
vehicles stopped in the network during the great majority of the simulation time (>73% of the
time). Similarly, the magnitude of the reduction in vehicles stopped was in the order of 1.8% to
4.6% for the enhanced coordination, and between 2.1% and 6.2% with max-plus.
5.1.2 Scenario b - Oversaturation, with Turning Movements
As mentioned above, the agents were also evaluated in a second scenario with 5% of vehicles
turning left and 5% turning right at each intersection, when possible. The agent formulation was
not updated to include turning movements and the agents were not re-trained exclusively for
this scenario. Therefore, in this scenario, turning movements can represent a noise in the data
and eventual sink and source points in the network that subtract and add vehicles on each link.
This scenario is intended to test the capacity of the agents when imperfect information is
received. In addition, turning movements also reduce the volume that can be coordinated along
the E-W and N-S corridors. Results from this scenario in terms of total network throughput are
shown in Figure 5-3 for the three strategies during 30 independent replications.
Enhanced
CoordinationMax plus
Enhanced
CoordinationMax plus
1 93.4% 83.0% -4.6% -2.9%
2 80.7% 78.4% -3.0% -2.3%
3 88.7% 99.7% -3.2% -6.2%
4 75.6% 79.8% -1.8% -2.5%
5 79.4% 73.6% -2.6% -2.1%
Fewer vehicles stopped
than without
coordina tion
(% of time)
Vehicles stopped
(compard to no
coordina tion)Run

37
Figure 5-3 - Network throughput with turning movements – agents in operational mode.
From Figure 5-3, the agents with the enhanced coordination still process a greater number of
vehicles even with the turning movements not included in the agent definition. The performance
of the agents with the Max-Plus algorithm is also improved with respect to the strategy without
coordination, but it is surpassed by the enhanced coordination.
As expected, the magnitude of the benefits using coordination was reduced compared to
scenario a (Figure 5-2). The average difference between the enhanced coordination and the Max-
Plus was about 70 vehicles (compared to 112 vehicles without turning movement), and between
the enhanced and no coordination it was 135 vehicles (compared to 186 vehicles without turning
movements).
5.1.3 Scenario c - Oversaturation with Greater Demands along N-S Corridors
The third scenario in which the agents were tested was a similar oversaturated network with
greater demands along the corridors in the N-S direction (1000 vphpl) compared to the demands

38
in the entry links along the E-W corridors (800 vphpl). The choices for coordination in this case
were more obvious for all three strategies, since the link occupation was likely to be higher in the
direction with higher demands. Results for the network in terms of throughput are shown in
Figure 5-4. The enhanced coordination with directional demands resulted in greater network
throughput compared to the other two strategies (max-plus and without coordination).
However, the differences between them were smaller than in the case with even demand
distributions since the agents without coordination will identify potential for coordination along
the busiest corridors solely on the basis of the link occupancy. When the demands are similar in
the two directions of traffic these trends cannot be easily identified without a coordination
scheme, and are difficult to find with max-plus alone. This case further indicates that the
enhanced coordination may be suited for cases with similar and uneven coordination in
oversaturated conditions.
Figure 5-4 - Network throughput with directional demands – agents in operational mode.

39
5.2 Function Approximation
Experiments were conducted to determine the performance of the agents with and without
state-action approximations using the linear approach described above. The performance of the
network for the two implementations in terms of total throughput as the agents trained is shown
in Figure 5-5.
Figure 5-5 - Network throughput with and without function approximation
From Figure 5-5, agents storing their knowledge using a function approximation converged to a
given throughput level very rapidly, given the number of parameters to be calibrated (a total of
18 thetas per agent). However, the performance at the end of the training period was lower than
that of the agents updating a full lookup table. These results were expected and also agree with
results from previous research running simple function approximation methods. The reduction
in the average network throughput for the last 50 replications (when agents can were trained)
with the function approximation was in the order of 1% of the total, thus this approach may be
3800
4000
4200
4400
4600
4800
5000
5200
0 10 20 30 40 50 60 70 80 90 100 110 120 130 140 150
Net
wo
rk T
hro
ugh
pu
t (v
ehic
les
pro
cess
ed)
Replication
Q-learning Function Approximation
Q-learning Lookup Table
10 per. Mov. Avg. (Q-learning Function Approximation)
10 per. Mov. Avg. (Q-learning Lookup Table)

40
worth to be considered when training time or samples are limited, and in cases when rapid
convergence is desired (e.g. field deployments with limited simulation training).
Regarding the spread of the exploration in the state space, the percentage of states visited out
of all possible combination of states was very low and in the order of 1%. However, this could be
attributed to combinations that are not practically observable, continuous oversaturation levels
(preventing instances with low link occupancy), and the fast convergence of the functions given
the low number of parameters. In comparison, it is recalled that only 1% to 3% of all possible
states were also visited during training in the lookup table implementations.
Following the same format as in previous sections, the average number of stops versus
throughput were plotted for the last 50 replications of the training period (Figure 5-6). Here the
difference in the performance between the two implementations is more evident, but in total
the average number of stops per vehicle only increased by 3% with the use of the function
approximation.
An examination of the network performance in terms of the total congestion in the inner links at
the end of the simulation period showed that agents running the function approximation
generated lower delays for those vehicles already in the network, indicating that more vehicles
were left outside of the network by having shorter cycle lengths and greater lost times. This also
resulted in lower delays for the vehicles inside the network at the expense of those outside of
the network boundaries in the implementation running the function approximation.

41
Figure 5-6 - Number of stops and throughput with and without function approximation
5.2.1 Policies
Policies found by the agents with the function approximation were further analyzed to determine
if the behavior of the traffic signals at the level of a single intersection was as expected. Policies
were found after the parameters of the function approximation had converged through training.
The parameters (θan) were used to determine the expected value of the state assuming that the
agent commits to an action, as shown in Chapter 3. Then, the state values of the two actions
were compared and the highest expected reward determined the agent’s action of choice
assuming a greedy behavior.
Given that there are multiple dimensions in the state representation, it is difficult to visualize the
change of state values using all variables. Therefore, only cases without blockages and for a given
phase duration were analyzed at once.
4
4.5
5
5.5
6
6.5
7
4200 4400 4600 4800 5000 5200
Ave
rage
Sto
ps
per
Veh
icle
Throughput
Q-learning Look-up table
Q-learning Function Approximation

42
The planes for each of the two functions that determine the state values (one per action) were
overlapped to determine the intersecting line. The intersection indicates the points at which the
agent may change its decision. Once this line was determined, the policies given the E-W and N-
S states could be directly observed in terms of the action selection.
An example of the changes in the state values for each action at intersection number 16 in the
4x5 network illustrated in Figure 4-1 is shown below in Figure 5-7. This example assumes that at
the moment of the analysis the green indication was displayed on the E-W direction, there were
no blockages, and the phase duration was 10 seconds. Intersection 16 has two-way streets with
a single lane for the E-W directions and two lanes in the N-S direction.
In Figure 5-7, the state values are provided for different combinations of E-W and N-S
states. The current signal status is important because if the agent decides to change the phase,
there will be lost time and therefore a reduction in the state value. In a greedy action selection
policy the agent will select the action with higher expected value, thus the intersection of these
two scatter plots (after the plots were approximated to surfaces) was found and it is shown in
Figure 5-8.
A better visualization of the agent policy, instead of the value of the states, can be plotted
by indicating the action selection given the state on the E-W and the N-S directions. Essentially,
the procedure simply requires subtracting the two surfaces and finding the positive and negative
regions, which represent the agent decision on next phase. Thus, if the subtraction is completed
as value (E-W) – value (N-S), positive values will indicate that the agent would choose giving green
to the E-W direction and negative values would indicate that agent choice is the N-S direction
instead.

43
a) Value of changing the phase to N-S
b) Value of continuing the phase in E-W
Figure 5-7 - Value of states for Intersection 16

44
Figure 5-8 - Expected state values for competing actions in intersection 16 without blockages
The results of this process for intersection 16 are shown in Figure 5-9, for the case when the
green indication is currently on the E-W direction (Figure 5-9(a)), and also for the case when
green is currently on the N-S direction (Figure 5-9(b)). Notice that the phase duration is also
important since the planes from Figures 5-6 and 5-7, and therefore Figure 5-8, are a function of
this variable. The effect of phase duration in the policy will be further described in the next
section.
The range of values in Figure 5-9 for the E-W and N-S states only show the combinations
that were often experienced by the agent and not the whole set of possible state values (from 0
to 19). This indicates that combinations such as E-W state=15 and N-S state=18 were not
observed. The range of values also shows that the N-S approaches stored more vehicles than the
E-W. This is expected given the difference in the number of lanes and also because the signal
operation was based mainly on queue management, not on actual number of vehicles at the
signal. The agent objective is to process vehicles and prevent queue backups and blockages, thus
maintaining similar-sized queues could be a valid policy.

45
a) Policy when E-W is receiving green time b) Policy when N-S is receiving green time
Figure 5-9 - Agent policy at intersection 16 when green is given to any of the two approaches
From Figure 5-9, it is noted that at intersection 16 there is a tendency to continue displaying the
green indication on the approach that currently has the right of way. This is clearly seen in the
surface projected at the bottom of Figures 5-9(a) and 5-9(b)). This result was also expected given
the penalty for lost time.
In general, policies at intersection 16 follows expected behavior because the agent would
continue the current phase if the state value remains high, and select the opposite action if the
state for the competing demands is high and the current is low. Furthermore, a bias towards
selecting the phase currently displayed gives an indication of the effects of the lost time
parameter in the reward structure, described in Chapter 3.
In addition to the policies for intersection 16, other intersections in the network were analyzed
to determine if similar policies resulted at locations with different number of lanes and traffic
patterns. One of the selected locations was intersection 1 (see Figure 4-1), which had two one-
way streets, each street with three through lanes.
Give Green to N-S
Continue Green on E-W
Continue Green on N-S
Give Green to E-W

46
The policies for intersection 1 are shown in Figure 5-10, and indicate similar trends to those
observed for intersection 16. There is preference to continue the green indication in the direction
that currently has it, unless the difference in the states is large enough to switch phases and
justify the lost time. From the range of values, it is also observed that more vehicles were queued
in the N-S direction compared to the E-W direction. This is because the N-S approach was directly
located at an entry points, whereas the E-W approach was next to an exit link. The number of
vehicles in the N-S link grows faster and more uniformly than on E-W, but it is possible that the
N-S traffic could not always be processed due to possible downstream restrictions. The E-W link,
on the other hand, could always go through the intersection since the receiving link was an exit.
The surface on Figure 5-10(a) follows a-priori expectations by not terminating the E-W phase
(processing vehicles towards the exit) unless a significant number of vehicles build enough
pressure to enter the network.
A third intersection, with different geometry, was also explored to determine the agent policy.
At intersection 8 (see Figure 4.1) there were three lanes in the N-S direction at an entry point,
and only one crossing lane per direction on the E-W direction. The agent policies are shown in
Figure 5-11, where it is noticed that there is more pressure to provide green to N-S than to E-W
even in cases where the current signal is in the E-W direction. This also follows expectation given
the difference in number of lanes and volumes between competing links.

47
a) Agent policy when green is given to E-W b) Agent policy when green is given to N-S
Figure 5-10 - Agent policy at intersection 1 when green is given to any of the two approaches
a) Agent policy when green is given to E-W b) Agent policy when green is given to N-S
Figure 5-11 - Agent policy at intersection 8 when green is given to any of the two approaches
Continue Green on E-W
Give Green to N-S
Give Green to E-W
Continue Green on N-S
Continue Green on E-W
Give Green to N-S
Give Green to E-W
Continue Green on N-S

48
In addition to the policies for fixed phase duration, the change in the decision-making surface
was also analyzed for a case when the phase duration varied. This is shown for intersection 8 in
Figure 5-12.
As the phase duration increased, the agent’s actions also shifted. The policy behavior shows that
opportunities to change the current phase were reduced as the phase duration increased. For
example, if the green signal is currently assigned to the N-S direction and the phase duration is
increasing, there are a decreasing number of combinations of E-W and N-S states that would
result in the agent changing the green phase to E-W. However, the combination of states that
could result in a phase change are very likely and include higher accumulating demands in the E-
W direction and lower discharging demands in the N-S direction.
a) Phase duration = 5 s b) Phase duration = 10 s c) Phase duration = 20 s
Figure 5-12 - Changes in policy when phase duration increases in Intersection 8
5.3 Effects of Imperfect Information on the Agents’ Performance
An additional analysis was also conducted running additional scenarios to determine the effects
of having deficient or imperfect information received by the agents. The same 4x5 network used

49
for the improved coordination and the function approximation was used for the analysis. A single
simulation run was defined to be 15-minute long after the network was initialized for 400
seconds, for a total length of 1300 seconds. Results from each scenario were based on 150 runs,
with the agents accumulating experience on the network as the number of episodes increased.
The selected scenarios include the base case with detections that provided up to 20 levels of link
occupancy (used in previous analysis in Sections 5-1 and 5-2), in which some aggregation is
already included, followed by data aggregation that provided 90% of the base resolution (up to
18 levels), 75% of the base resolution (up to 15 levels), 50% of the base resolution (up to 10
levels), and 25% of the base resolution (up to 5 levels).
In this particular context, aggregated data is used as a proxy for imperfect data in which an agent
can’t precisely determine the state of the system, but only obtain a coarser representation. In
real-world applications, uncertainty in sensor data may have the same effect in a traffic
controller, where the precision of the incoming information only allows for recognition of a lower
number of potential states, each including several other states at finer resolutions.
For each resolution level, the training was conducted over 120 episodes or runs, and the analysis
was based on 30 episodes obtained after the training runs were completed. The training period
(≤ 120th episode) and the final data points for performance evaluation (>120th episode) are
shown in Figure 5-13 in terms of total network throughput and average stops per vehicle. Figure
5-13 displays a 10-point moving average for each resolution.

50
a) Total network throughput
b) Average stops per vehicle
Figure 5-13 - Network Performance during agent training with different data resolutions
4200
4300
4400
4500
4600
4700
4800
4900
5000
0 20 40 60 80 100 120 140 160
Ave
rage
Ne
two
rk T
hro
ug
hp
ut
Episode (Training)
10 per. Mov. Avg. (Base Resolution) 10 per. Mov. Avg. (90% Resolution)
10 per. Mov. Avg. (75% Resolution) 10 per. Mov. Avg. (50% Resolution)
10 per. Mov. Avg. (25% Resolution)
4.5
4.7
4.9
5.1
5.3
5.5
5.7
5.9
6.1
6.3
6.5
0 20 40 60 80 100 120 140 160
Ave
rage
Sto
ps
pe
r V
eh
icle
Episode (Training)
10 per. Mov. Avg. (Base Resolution) 10 per. Mov. Avg. (90% Resolution)
10 per. Mov. Avg. (75% Resolution) 10 per. Mov. Avg. (50% Resolution)
10 per. Mov. Avg. (25% Resolution)

51
From Figure 5-13 it can be seen how the network as a whole improved performance from the
very first episodes onward. However, this is not necessarily true for all aggregation levels. The
overall network performance deteriorated with the decrease in sensor data resolution.
While it was expected to find lower performance by reducing the resolution of the sensor data,
the magnitude of these effects was not known. From Figure 5-13(a) and 5-13(b), the performance
degradation does not seem to be proportional to the reduction in resolution, and rather seems
to have sudden changes, particularly for the network throughput. These performance drops were
mainly the result of underestimation of queue lengths, and therefore the occurrence of blockages
due to queue spillbacks. Greater uncertainty in the queue length led to greater changes of
blockages.
Similar results were observed in terms of the average number of stops but to a lesser degree,
except for the performance when the resolution was down to 25% of the base case, where the
number of stops increased significantly.
A combination of these two measures of performance, including a description of the data
dispersion for each of the resolution levels is shown in Figure 5-14. The average performance of
each resolution level is based on the last 30 episodes, and the standard deviation of both
variables is described by the ellipses surrounding the average value.

52
Figure 5-14 - Effect of Lower Detector Resolution on Network Throughput and Stops per
Vehicle
The reduction in detector resolution produced limited effects both in terms of throughput and
number of stops for the cases with 90% and 75% of the initial resolution. At these levels the
agents managed to continue processing vehicles in oversaturated conditions, only with
occasional blockages but without gridlocks. At lower resolution levels, the dispersion increased
more significantly for the total throughput than for the number of stops, showing a more
widespread occurrence of blockages and even localized gridlocks particularly at the end of each
run.
4.5
4.7
4.9
5.1
5.3
5.5
5.7
4000 4200 4400 4600 4800 5000 5200
Ave
rage
Nu
mb
er
of
Sto
ps
pe
r V
eh
icle
Average Network Throughput
Standard resolution (100%)
90% resolution
75% resolution
50% resolution
25% resolution
Ellipses indicate plus and minus one standard deviation from the average value

53
6 FINDINGS AND CONCLUSIONS
In this report, the coordination of reinforcement learning agents for controlling the signals of a
traffic network is explored. The authors have previously observed the emergent coordination
resulting from agents that shared information about their states with immediate neighbors, and
also using the max-plus algorithm. In this study, an enhanced max-plus was developed, achieving
improved performance in oversaturated conditions compared to previous max-plus
implementations. Compared to a multi-agent system without the enhanced coordination, in the
operational mode (after agents were trained) coordination consistently increased total network
throughput in every simulation run, with an average increase of 4% (about 750 vph). Average
number of stops per vehicle were reduced by about 6% (which represented more than 5000 stops
in an hour), and the proportion of vehicles stopped in the network was lower in more than 75%
of the time.
An alternative scenario representing noise or sink and source points, with turning movements
that were unaccounted for in the agent’s state definition or the reward function, showed
improved network performance but to a lesser degree, as expected. The algorithm also provided
increased throughput for conditions when traffic demands are uneven in competing directions
of traffic, which represents a more obvious coordination even for agents without running any
coordination algorithm.
Enhanced coordination is one of various additions for achieving a more efficient traffic control
system using artificial intelligence in the form of reinforcement learning with a decentralized
architecture. The proposed addition to max-plus provides a new perspective on this type of
applications by adding the concept of corridors in both the state definition and reward. Future
and ongoing additions to the multi-agent system include optimization of signals for multimodal
operations and signal preemption.

54
In addition to an enhanced coordination algorithm, the implementation of a function
approximation to store the agents’ knowledge is described. This mechanism replaces the
traditional lookup table, reducing memory requirements and convergence time by means of
generalization. Results in the 4x5 oversaturated network indicated that a simple linear
approximation of the Q values was effective for the fully decentralized system proposed in this
research, accounting for discontinuities generated by penalties in the reward structure when
there was potential for blockage due to downstream congestion and due to lost times when a
phase was terminated.
Performance in terms of network throughput and number of stops showed for the case study
that the function approximation resulted in 1% reduction in the total network throughput and
about 3% increase in the number of stops. Therefore, simple approximations such as the one
performed in this study is suitable for systems where these performance drops are acceptable
and also in cases where fast convergence is needed. The policies generated by the agents using
the function approximation indicated that the agent behavior followed expected trends, with
phase assignments that were proportional to the state in the two competing traffic directions
and the phase duration.
Finally, the sensitivity of the agents to imperfect data in the form of coarse aggregation was
tested at different detector data resolutions. As the sensor data given to the agents was
increasingly aggregated, performance decreased at a faster rate, as expected. For the test
network and the specified traffic demands, decrease in the total network throughput and
occasional widespread occurrence of blockages was clearly developed at a 50% of the resolution
of the base case. Both throughput and number of stops per vehicle show the negative effects of
the lower data resolution on the performance of an average episode as well as the variability
(standard deviation) of the system in all episodes together. While it was expected to find lower
performance by reducing the resolution of the sensor data, the magnitude of these effects was

55
not known. It is noted that even in highly oversaturated conditions it was not until the detector
data dropped to half of the initial resolution that the system was critically affected.
The design of online countermeasures to help prevent system gridlocks for cases when reliability
of sensor data decreases to a critical point may be a challenging task. In a RL system designed for
robust operation, the state expressiveness should be enough to account for such events. For
example, including state variables that can identify traffic operation in inclement weather, or
after the occurrence of incidents. The state space exponentially increases with the increase in
the number of variables, but function approximation methods may relief concerns in this regard.
56
7 REFERENCES
1. Abdulhai, B., Pringle, R., and Karakoulas, G.J. (2003) Reinforcement Learning for True
Adaptive Traffic Signal Control, ASCE Journal of Transportation Engineering, Vol. 129, No
3, pp. 278-285.
2. Bakker, B., Steingrover, M., Schouten, R., Nijhuis, and E., Kester, L. (2005) Cooperative
Multi-agent Reinforcement Learning of Traffic Lights. Gama, J., Camacho, R., Brazdil, P.B.,
Jorge, A.M., Torgo, L. (eds.) ECML 2005. LNCS (LNAI), Vol. 3720. Springer, Heidelberg.
3. Barto, A.G. and Anandan, P. (1985) Pattern recognizing stochastic learning automata. IEEE
Transactions on Systems, Man, and Cybernetics, Vol. 15, No. 3, pp. 360-375.
4. Bingham, E. (1998) Neurofuzzy Traffic Signal Control. Master’s thesis, Dept. of Engineering
Physics and Mathematics, Helsinki Univ. of Technology, Helsinki, Finland.
5. Bingham, E. (2001) Reinforcement Learning in Neurofuzzy Traffic Signal Control, European
Journal of Operations Research, Vol. 131, No. 2, pp. 232–241.
6. Choy, M. C., Cheu, R. L., Srinivasan, D., and Logi, F. (2003) Real-time Coordinated Signal
Control Using Agents with Online Reinforcement Learning. Proceedings of the 82nd
Transportation Research Board Annual Meeting. Washington, D.C.
7. De Oliveira, D., Ferreira, P. R. Jr., Bazzan, A. L.C., and Kluegl, F. A. Swarm-based Approach
for Selection of Signal Plans in Urban Scenarios. IV International Workshop on Ant Colony
Optimization and Swarm Intelligence (ANTS), Brussels. 2004.
8. De Oliveira, D., and Bazzan, A. L.C. (2006) Emergence of Traffic Lights Synchronization.
Proceedings 20th European Conference on Modelling and Simulation. Germany.
9. Irodova, M., Sloan, R.H. (2005) Reinforcement Learning and Function Approximation,
FLAIRS Conference, pp. 455-460.

57
10. Junges, R., and Bazzan, A.L.C. (2007) Modelling Synchronization of Traffic Lights as a
DCOP. Proceedings of the 5th European Workshop on Multiagent Systems, pp. 564-579,
Tunisia.
11. Kober J., Peters, J. Reinforcement Learning in Robotics: A Survey (2012). Reinforcement
Learning Adaptation, Learning, and Optimization, Vol. 12, pp. 579-610.
12. Kok, J. R., Vlassis, N. (2005) Using the Max-plus Algorithm for Multiagent Decision Making
in Coordination Graphs. RoboCup-2005: Robot Soccer World Cup IX, Osaka, Japan.
13. Kok, J. R., Vlassis, N. (2006) Collaborative Multiagent Reinforcement Learning by Payoff
Propagation, Journal of Machine Learning Research, Vol. 7, pp. 1789-1828.
14. Kuyer L., Whiteson, S., Bakker, B., and Vlassis, N. (2008) Multiagent Reinforcement
Learning for Urban Traffic Control using Coordination Graphs. Proceedings 19th European
Conference on Machine Learning, Antwerp, Belgium.
15. Mahadevan, S., and Connell, J. (1991) Automatic Programming of Behavior-based Robots
using Reinforcement Learning. Artificial Intelligence, Vol. 55, pp. 311-365.
16. Medina, J.C., Hajbabaie, A., Benekohal, R.F. (2010) Arterial Traffic Control Using
Reinforcement Learning Agents and Information from Adjacent Intersections in the State
and Reward Structure. Presented at the 13th International IEEE Annual Conference on
Intelligent Transportation Systems, Madeira, Portugal.
17. Medina, J.C. and Benekohal, R.F. Agent-based Traffic Management and Reinforcement
Learning in Congested Intersection Network. NEXTRANS Project No. 072IY03. 2012.
18. Medina, J.C., Benekohal, R.F. Traffic Signal Control using Reinforcement Learning and the
Max-Plus Algorithm as a Coordinating Strategy. Presented at the 15th International IEEE
Annual Conference on Intelligent Transportation Systems. Anchorage, AK, 2012.
19. Nunes, L., Oliveira, E. (2003) Cooperative Learning using Advice Exchange. Adaptive
Agents and Multi-agent Systems, Lecture Notes in Computer Science. Springer-Verlag,
Berlin, Heidelberg, Vol. 2636, pp. 33-48.
20. Russel, S., and Norvig, P. (2003) Artificial Intelligence a Modern Approach. Upper Saddle
River, NJ: Prentice Hall, 2nd edition.

58
21. Stone, P., and Veloso, M. M. (1999) Team-partitioned, Opaque-transition Reinforcement
Learning. RoboCup-98: Robot Soccer World Cup II, pp. 261–272.
22. Vlassis, N., Elhorst, R., and Kok, J. R. (2004) Anytime Algorithms for Multiagent Decision
Making using Coordination Graphs. Proceedings of the International Conference on
Systems, Man, and Cybernetics (SMC), The Hague, The Netherlands.
23. Wiering, M. and Schmidhuber, J. (1997) HQ-Learning. Adaptive Behavior, Vol. 6, No. 2, pp.
219-246.
24. Xie, Y. (2007) Development and Evaluation of an Arterial Adaptive Traffic Signal Control
System using Reinforcement Learning, Doctoral Dissertation, Texas A&M University:
College Station, TX.
25. Zhang, Y., Xie, Y., and Ye, Y. (2007) Development and Evaluation of a Multi-Agent Based
Neuro-Fuzzy Arterial Traffic Signal Control System, Texas A&M University, pp. 122
(SWUTC #473700- 00092-1).