africa: intra-regional trade a function of diverse exports barriers boost intra-regional trade is...
TRANSCRIPT
Africa: Intra-regional trade A function of diverse exports
Update Economics research 12 April 2018
Economics & Politics
Africa
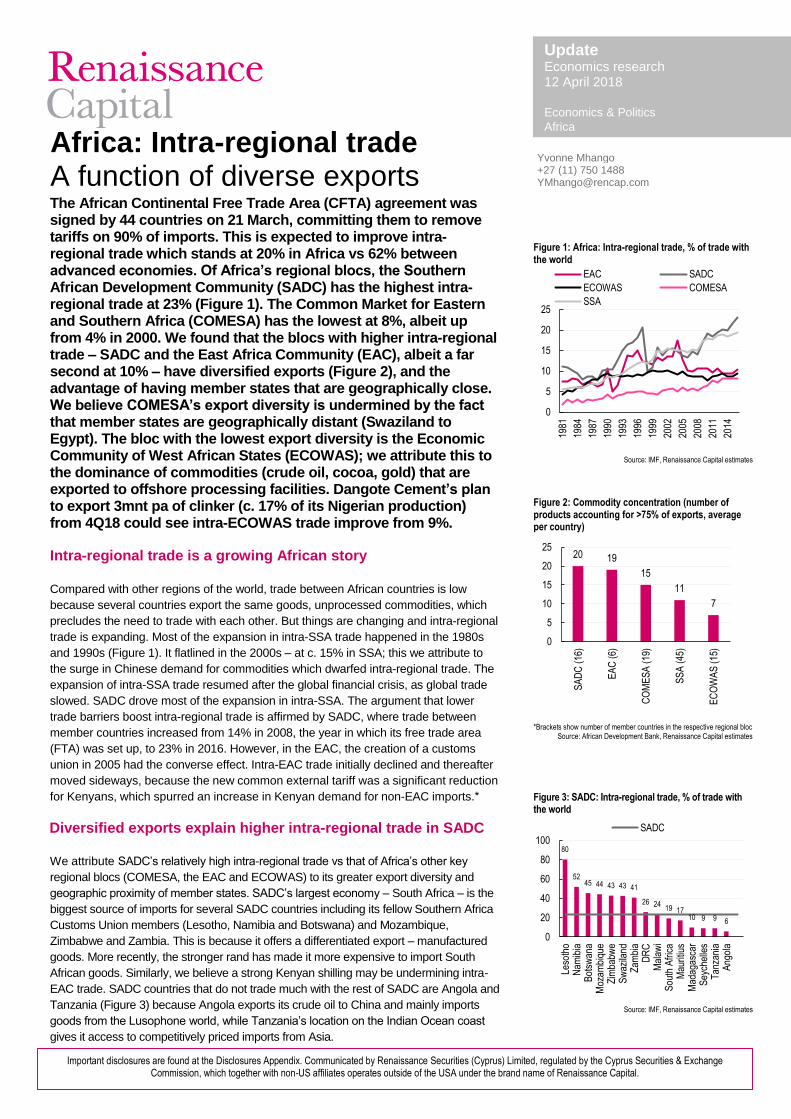
The African Continental Free Trade Area (CFTA) agreement was signed by 44 countries on 21 March, committing them to remove tariffs on 90% of imports. This is expected to improve intra-regional trade which stands at 20% in Africa vs 62% between advanced economies. Of Africa’s regional blocs, the Southern African Development Community (SADC) has the highest intra-regional trade at 23% (Figure 1). The Common Market for Eastern and Southern Africa (COMESA) has the lowest at 8%, albeit up from 4% in 2000. We found that the blocs with higher intra-regional trade – SADC and the East Africa Community (EAC), albeit a far second at 10% – have diversified exports (Figure 2), and the advantage of having member states that are geographically close. We believe COMESA’s export diversity is undermined by the fact that member states are geographically distant (Swaziland to Egypt). The bloc with the lowest export diversity is the Economic Community of West African States (ECOWAS); we attribute this to the dominance of commodities (crude oil, cocoa, gold) that are exported to offshore processing facilities. Dangote Cement’s plan to export 3mnt pa of clinker (c. 17% of its Nigerian production) from 4Q18 could see intra-ECOWAS trade improve from 9%.
Intra-regional trade is a growing African story
Compared with other regions of the world, trade between African countries is low
because several countries export the same goods, unprocessed commodities, which
precludes the need to trade with each other. But things are changing and intra-regional
trade is expanding. Most of the expansion in intra-SSA trade happened in the 1980s
and 1990s (Figure 1). It flatlined in the 2000s – at c. 15% in SSA; this we attribute to
the surge in Chinese demand for commodities which dwarfed intra-regional trade. The
expansion of intra-SSA trade resumed after the global financial crisis, as global trade
slowed. SADC drove most of the expansion in intra-SSA. The argument that lower
trade barriers boost intra-regional trade is affirmed by SADC, where trade between
member countries increased from 14% in 2008, the year in which its free trade area
(FTA) was set up, to 23% in 2016. However, in the EAC, the creation of a customs
union in 2005 had the converse effect. Intra-EAC trade initially declined and thereafter
moved sideways, because the new common external tariff was a significant reduction
for Kenyans, which spurred an increase in Kenyan demand for non-EAC imports.*
Diversified exports explain higher intra-regional trade in SADC
We attribute SADC’s relatively high intra-regional trade vs that of Africa’s other key
regional blocs (COMESA, the EAC and ECOWAS) to its greater export diversity and
geographic proximity of member states. SADC’s largest economy – South Africa – is the
biggest source of imports for several SADC countries including its fellow Southern Africa
Customs Union members (Lesotho, Namibia and Botswana) and Mozambique,
Zimbabwe and Zambia. This is because it offers a differentiated export – manufactured
goods. More recently, the stronger rand has made it more expensive to import South
African goods. Similarly, we believe a strong Kenyan shilling may be undermining intra-
EAC trade. SADC countries that do not trade much with the rest of SADC are Angola and
Tanzania (Figure 3) because Angola exports its crude oil to China and mainly imports
goods from the Lusophone world, while Tanzania’s location on the Indian Ocean coast
gives it access to competitively priced imports from Asia.
T
Yvonne Mhango +27 (11) 750 [email protected]
Figure 1: Africa: Intra-regional trade, % of trade with the world
Source: IMF, Renaissance Capital estimates
Figure 2: Commodity concentration (number of products accounting for >75% of exports, average per country)
*Brackets show number of member countries in the respective regional blocSource: African Development Bank, Renaissance Capital estimates
Figure 3: SADC: Intra-regional trade, % of trade with the world
Source: IMF, Renaissance Capital estimates
0
5
10
15
20
25
1981
1984
1987
1990
1993
1996
1999
2002
2005
2008
2011
2014
EAC SADC
ECOWAS COMESA
SSA
20 19
15
11
7
0
5
10
15
20
25
SA
DC
(16
)
EA
C (
6)
CO
ME
SA
(19
)
SS
A (
45)
EC
OW
AS
(15
)
80
5245 44 43 43 41
26 2419 17
10 9 9 6
0
20
40
60
80
100
Leso
tho
Nam
ibia
Bot
swan
aM
ozam
biqu
eZ
imba
bwe
Sw
azila
ndZ
ambi
aD
RC
Mal
awi
Sou
th A
fric
aM
aurit
ius
Mad
agas
car
Sey
chel
les
Tan
zani
aA
ngol
a
SADC
Important disclosures are found at the Disclosures Appendix. Communicated by Renaissance Securities (Cyprus) Limited, regulated by the Cyprus Securities & Exchange Commission, which together with non-US affiliates operates outside of the USA under the brand name of Renaissance Capital.
2
Renaissance Capital 12 April 2018
Africa: Intra-regional trade
▪ How can one play the intra-regional trade story? Our SSA cements analyst,
Temi Aduroja, thinks it can be played through the cement sector. In East Africa,
Bamburi Cement (BUY; TP KES201; CP KES173) exports its cement to EAC
members, Uganda, Rwanda, Burundi, as well as the Republic of Congo. In
Kenya, it exports 0.5mnt pa (c. 27% of its Kenyan production) to Uganda. And in
Uganda, Bamburi exports 60% of its Ugandan output to Rwanda. Given the
clinker deficit in Kenya, ARM Cement (HOLD; TP18.5; CP KES8.4) exports
clinker from its Tanzanian plant to Kenya.
▪ In West Africa, Dangote Cement (HOLD; TP NGN257; CP NGN255) currently
exports Nigerian cement by road to Ghana and Togo but in small quantities – c.
6% of its total Nigerian production. Dangote Cement is on track to start exporting
3mnt pa of clinker (c. 17% of its Nigerian production) through Port Harcourt and
Apapa in Nigeria from 4Q18. The company plans to export this clinker to Ghana,
Cameroon and Cote d’Ivoire. This implies upside for intra-regional trade in
ECOWAS.
▪ The limitations for intra-regional trade of cement include the cost of
transportation (poor infrastructure makes it expensive to transport cement by
road), taxes and regulations.
▪ Intra-regional trade can also be played through the banks, via trade finance and
cross-border transactions. In West Africa, our SSA banks analyst, Ola
Ogunsanya, believes United Bank for Africa (BUY; TP NGN15.3; CP NGN11.1)
and Ecobank Transnational Inc (HOLD; TP NGN16.1; CP NGN17.6) have a
much stronger intra-regional customer base. Both banks are strong in the
francophone region, and they have several customers that trade between the
ECOWAS countries. In East Africa, she picks Equity Bank (HOLD; TP KES55.7;
CP KES56.0) just by virtue of it having a wider presence in the East African
region.
▪ That said, the banks operate as independent entities in each country despite
having a group regional/Pan-Africa presence. Simply put, having customers that
engage in intra-regional trade is an added benefit, and does not contribute much
in terms of the number of customers or profits. The other limitations are the high
cost of transactions; customers will have to bear FX costs and bank charges.
Sometimes there are regulatory constraints depending on the type of
transaction.

3
Renaissance Capital 12 April 2018
Africa: Intra-regional trade
Figure 4: Map showing countries that signed up to the CFTA
Source: African Union
▪ We think intra-regional trade is a function of the degree of export
diversification. Africa’s trade patterns are a legacy of its colonial history. During
colonialism, the continent was primarily a source of raw materials. Transport
infrastructure was built to ferry commodities from the mines and farms to the
nearest port and were shipped to the colonising country. Sixty years since the
end of colonialism, Africa still largely exports raw materials, only that most of it is
now headed to Asia, instead of Europe. A handful of SSA countries – including
South Africa, Kenya and Mauritius – have moved up the value chain and
produce manufactured goods, which implies that they have more diversified
exports. The regional groups that these countries belong to – SADC and EAC –
have relatively higher intra-regional trade, because these countries offer a
differentiated product. We also believe the geographic proximity of their member
states helps. On the other end of the spectrum are the oil exporters that produce
one export, such as Nigeria (Figure 5). We believe this partly explains the low
intra-regional trade in the regional bloc that Nigeria belongs to, ECOWAS.
Zambia
Zimbabwe
Angola
Tanzania
DRC
Namibia
Botswana
Lesotho
Malawi
Mauritius Mozambique
Seychelles
South Africa Swaziland
Algeria
Ben
in
Burkina Faso
Cameroon
Cape Verde
Central African Republic
Chad
Cote d’Ivoire
Comoros
Djibouti
Egypt
Equatorial Guinea
Ethiopia
The Gambia
Gabon
Gha
na
Liberia
Libya
Kenya
Mali Mauritania Niger
Rwanda Sao Tome & Principe
Senegal
Sudan
South Sudan T
ogo
Tunisia
Uganda
Nigeria
Sierra Leone
Guinea Guinea Bissau
Eritrea
Burundi

4
Renaissance Capital 12 April 2018
Africa: Intra-regional trade
Figure 5: Africa: Commodity concentration (number of products accounting for >75% of exports)
Source: African Development Bank
▪ Salient statistics on regional blocs. COMESA has the most members states
(19), the biggest economy, with a GDP of $808bn, and the largest land area at
10.6mn km2 (Figure 6). Egypt accounts for 40-50% of COMESA’s GDP. The
EAC has the fewest countries at six, and the smallest land area, 2.5mn km2.
SADC has the second-biggest economy, with an estimated GDP of $682bn in
2017, of which 50% is due to South Africa. The EAC has the smallest economy
with a GDP of $172bn; Kenya accounts for 46% of the bloc’s GDP. At $3,741,
SADC has the highest GDP per capita, while the EAC has the lowest at $790,
mainly due to South Sudan. When South Sudan is excluded, the EAC’s GDP per
capita improves to $903. ECOWAS is the only regional bloc where the dominant
economy – Nigeria accounts for 70% of its GDP – practically exports only one
commodity. We believe this largely explains the low trade between the countries
in the West African regional group.
Figure 6: A statistical snapshot of Africa’s main regional blocs
Population, mn
Land area, km2
GDP, $bn
GDP per capita, $
# of countries
Diversification index*
EAC 169 2,467,202 172 790 6 7.5 SADC 337 9,864,699 682 3,741 16 8.2 ECOWAS 362 5,112,709 566 1,060 15 5.5 COMESA 513 10,568,242 808 2,763 19 7.4
*Measures the extent to which exports are diversified. A higher index indicates more export diversification. Source: IMF, African Development Bank, websites of regional blocs, CIA world factbook
▪ Of Africa’s main regional blocs, SADC has the highest intra-regional trade
at 23%. SADC is a regional bloc with 16-member countries (the most recent
addition being Comoros, which joined in August 2017). It became a legally
binding arrangement in 1992, (when it succeeded the Southern African
Development Coordinating Conference, a loose association that was established
in 1980). SADC aims to foster development, growth and alleviate poverty via
regional integration.
▪ Intra-regional trade in SADC increased from 14% in 2008, the year in which
the SADC FTA was established, to 23% in 2016. An FTA implied the partial or
full abolishment of customs tariffs on inner borders. Only Angola and the
Democratic Republic of Congo (DRC) are not yet participating in the FTA. The
regional bloc had planned to progress to a customs union by 2010, which would
mean the introduction of a common external tariff on the exterior borders of the
union. However, this has not come to pass because of the EU Economic
Partnership Agreements (EPA) that provided, for several SADC countries, more
benefits than deeper regional market integration within a SADC custom union.
103
88
68
5448
3631 31
25 22 19 19 16 15 149 8 8 7 7 7 7 6 6 6 5 5 5 5 5 4 4 4 4 4 4 4 4 3 3 3 3 2 2 2 1 1 1 1 1 1 1 1
0
20
40
60
80
100
120
Sou
th A
fric
aT
unis
iaM
oroc
coK
enya
Egy
ptM
aurit
ius
Mad
agas
car
Tan
zani
aS
waz
iland
Sie
rra
Leon
eE
ritre
aS
eneg
alB
otsw
ana
Uga
nda
Zim
babw
eC
ape
Ver
deM
ali
Moz
ambi
que
Cot
e d'
Ivoi
reE
thio
pia
Gha
naN
amib
iaB
enin
Con
go, K
insh
asa
Leso
tho
Cam
eroo
nD
jibou
tiR
wan
daS
outh
Sud
anT
ogo
Cen
tral
Afr
ican
Rep
ublic
Gam
bia
Libe
riaM
aurit
ania
Sao
Tom
e &
Prin
cipe
Sey
chel
les
Som
alia
Zam
bia
Bur
kina
Fas
oC
omor
osG
uine
aM
alaw
iE
quat
oria
l Gui
nea
Gab
onN
iger
Ang
ola
Bur
undi
Cha
dC
ongo
, Bra
zzav
ille
Gui
nea-
Bis
sau
Liby
aN
iger
iaS
udan

5
Renaissance Capital 12 April 2018
Africa: Intra-regional trade
▪ In 2008, SADC joined with COMESA and the EAC to form the Africa Free Trade
Zone, which was intended to ease access to markets within the zone and end
the challenge of countries belonging to several regional blocs that have different
objectives. In 2012, this idea was extended to ECOWAS and the Economic
Community of Central African States (ECCAS). In 2015, negotiations were
launched to create a Continental Free Trade Area (CFTA). This culminated in 44
African countries signing the CFTA in March 2018.
Figure 7: Map showing SADC countries Source: Renaissance Capital
▪ ECOWAS is a 15-member regional bloc in West Africa that was established
in 1975 with a mandate of promoting economic integration. This implies the
harmonisation of economic policies across states through the partial or full
abolition of tariff and non-tariff barriers on trade. ECOWAS includes two sub-
regional blocs: 1) the West African Economic and Monetary Union (UEMOA is
the French acronym), which is made up of eight mainly French-speaking
countries that share a customs union and currency union (they use the CFA
franc, pegged to the euro); 2) the West African Monetary Zone comprises six
mainly English-speaking countries with a plan of adopting its own currency, the
eco. UEMOA is probably one of Africa’s most advanced regional blocs (in terms
of degree of integration), as it is a customs union and monetary union. However,
this is not reflected in ECOWAS’s intra-regional trade, which is low compared
with Africa’s other key regional blocs.
Zambia
Zimbabwe
Angola
Tanzania
DRC
Namibia
Botswana
Lesotho
Malawi
Mauritius
Seychelles
South Africa Swaziland
Comoros

6
Renaissance Capital 12 April 2018
Africa: Intra-regional trade
Figure 8: Map showing ECOWAS countries Source: Renaissance Capital
▪ Crude oil accounts for over 95% of Nigeria’s exports; we believe this
explains why ECOWAS only accounts for 3% of its total trade. Intra-regional
trade in ECOWAS is low, compared with that of other regional blocs, at 9%. Only
COMESA’s comes in lower than ECOWAS, at 8%. We believe trade between
ECOWAS member countries is not as high as that of SADC and the EAC,
because its biggest economy by a large margin, Nigeria, does little trade with
other ECOWAS members. This is because crude oil accounts for over 95% of
Nigeria’s exports, which is largely refined offshore (due to the dearth of refineries
and processing facilities in the region). Nigeria also needs manufactured imports
that cannot be sourced within ECOWAS. Dangote Cement’s plan to start
exporting 3mnt pa of clinker (c. 17% of its Nigerian production) in 4Q18 could
see Nigeria’s trade with the rest of ECOWAS improve from a low of 3% today.
Planned exports of refined oil products from the Dangote oil refinery, from 2020,
could also potentially improve Nigeria’s trade with other ECOWAS countries.
▪ Of the bigger ECOWAS members, the ones that do a relatively high share of
their trade within the region are Senegal and Mali. Cote d’Ivoire and Ghana’s
intra-regional trade is 16% and 11% respectively, which is a decent margin
above the ECOWAS average.
Nigeria
Gha
na
Cot
e d’
Ivoi
re
Senegal
Mali Niger
Guinea
Ben
in
Burkina Faso
Cape Verde
The Gambia
Guinea Bissau
Sierra Leone
Liberia
Tog
o

7
Renaissance Capital 12 April 2018
Africa: Intra-regional trade
Figure 9: ECOWAS: Intra-regional trade, % of trade with the world
Source: IMF, Renaissance Capital estimates
▪ The EAC is one of the smaller regional blocs, however with relatively high
intra-regional trade due to relatively diverse exports from its biggest
member state, Kenya. The EAC also benefits from geographically close
member states. The EAC is made up of six countries from the African Great
Lakes region of Eastern Africa. South Sudan is the EAC’s newest member; it
joined in 2016. The regional bloc was founded in 1967, collapsed in 1977 and
was restored in 2000. A customs union was signed in 2004 and commenced in
2005. The EAC’s biggest exporter, Kenya, continued to pay tariffs on goods
entering the other four-member states, on a sliding scale until 2000. A common
external tariff applies to imports from non-member states. Tariffs on intra-EAC
trade were partially liberalised and were fully removed at the end of the decade.
▪ In 2008, after talks with SADC and COMESA, the EAC committed to an
expanded FTA that included the member states of all three regional blocs.
▪ In 2010, the EAC established its own common market for goods, labour and
capital with the region. EAC is Africa’s first and only common market (this is
usually built upon an FTA with no tariffs for goods and relatively free movement
of capital and of services, but not as advanced in the reduction of non-tariff trade
barriers). The EAC’s ultimate goals are a common currency and a full political
federation.
55.0
25.4
22.3
21.6
21.2
20.2
15.5
11.1
11.0
10.2
6.8
5.1
3.3
1.2
0.9
0
10
20
30
40
50
60
Tog
o
Sen
egal
Mal
i
Gui
nea-
Bis
sau
Bur
kina
Fas
o
Gam
bia
Cot
e d'
Ivoi
re
Gha
na
Nig
er
Ben
in
Sie
rra
Leon
e
Gui
nea
Nig
eria
Cap
e V
erde
Libe
ria
8
Renaissance Capital 12 April 2018
Africa: Intra-regional trade
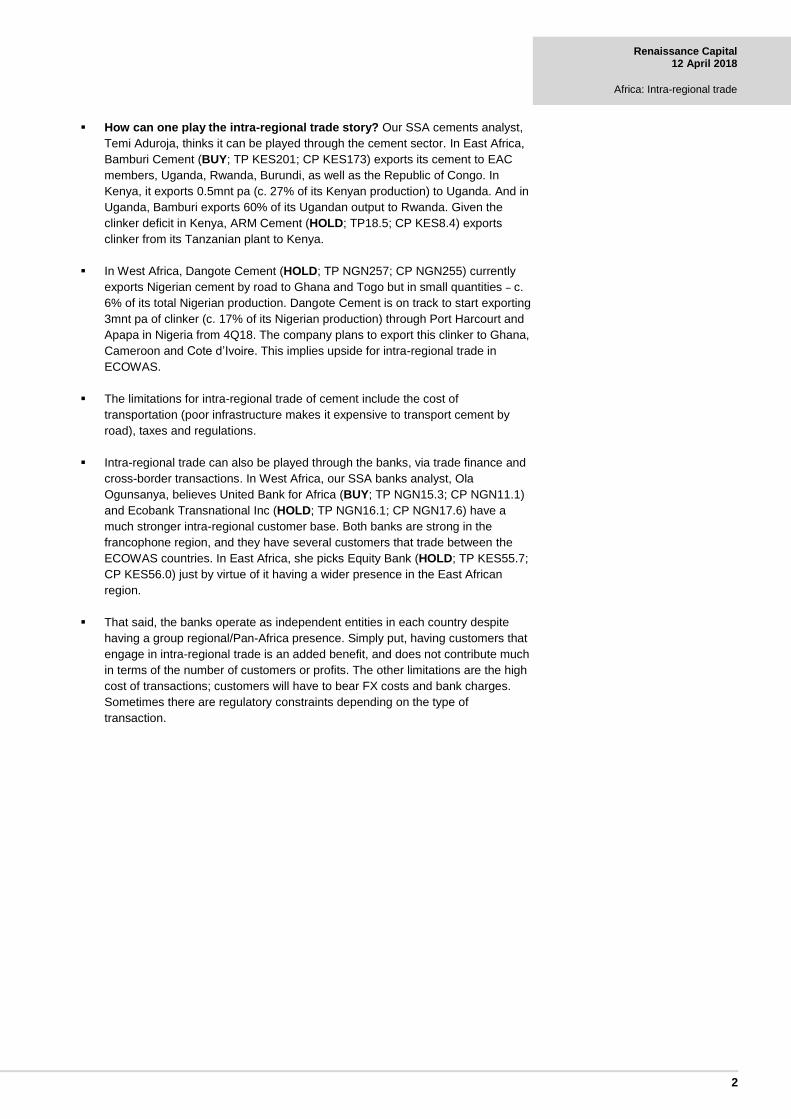
Figure 10: Map of EAC countries
Source: Renaissance Capital
▪ Over the past decade, EAC’s intra-regional trade has just moved sideways in the
10% region. We attribute this to the creation of a customs union in 2005 that
inadvertently undermined intra-regional trade. This is because of the new
common external tariff applied to imports from non-EAC states, which was
significant reduction for Kenya. This spurred a strong increase in Kenyan
demand for imports from the rest of the world. In more recent years, we think a
strong Kenyan shilling has sustained the attractiveness of imports and
undermined the competitiveness of Kenyan exports. The Kenyan shilling is 15%
overvalued, according to this analyst’s real effective exchange rate model.
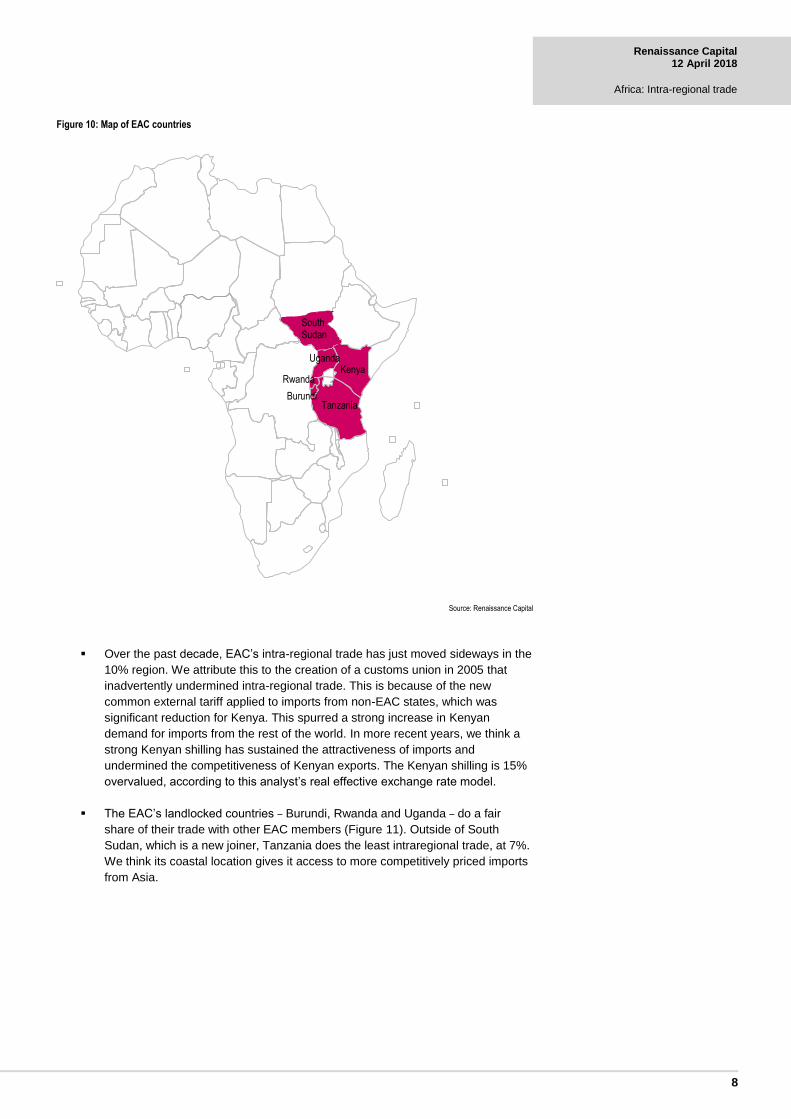
▪ The EAC’s landlocked countries – Burundi, Rwanda and Uganda – do a fair
share of their trade with other EAC members (Figure 11). Outside of South
Sudan, which is a new joiner, Tanzania does the least intraregional trade, at 7%.
We think its coastal location gives it access to more competitively priced imports
from Asia.
Kenya
Tanzania
Uganda
Rwanda
Burundi
South Sudan
South Sudan
9
Renaissance Capital 12 April 2018
Africa: Intra-regional trade
Figure 11: EAC: Intra-regional trade, % of trade with the world
Source: Source: IMF, Renaissance Capital estimates
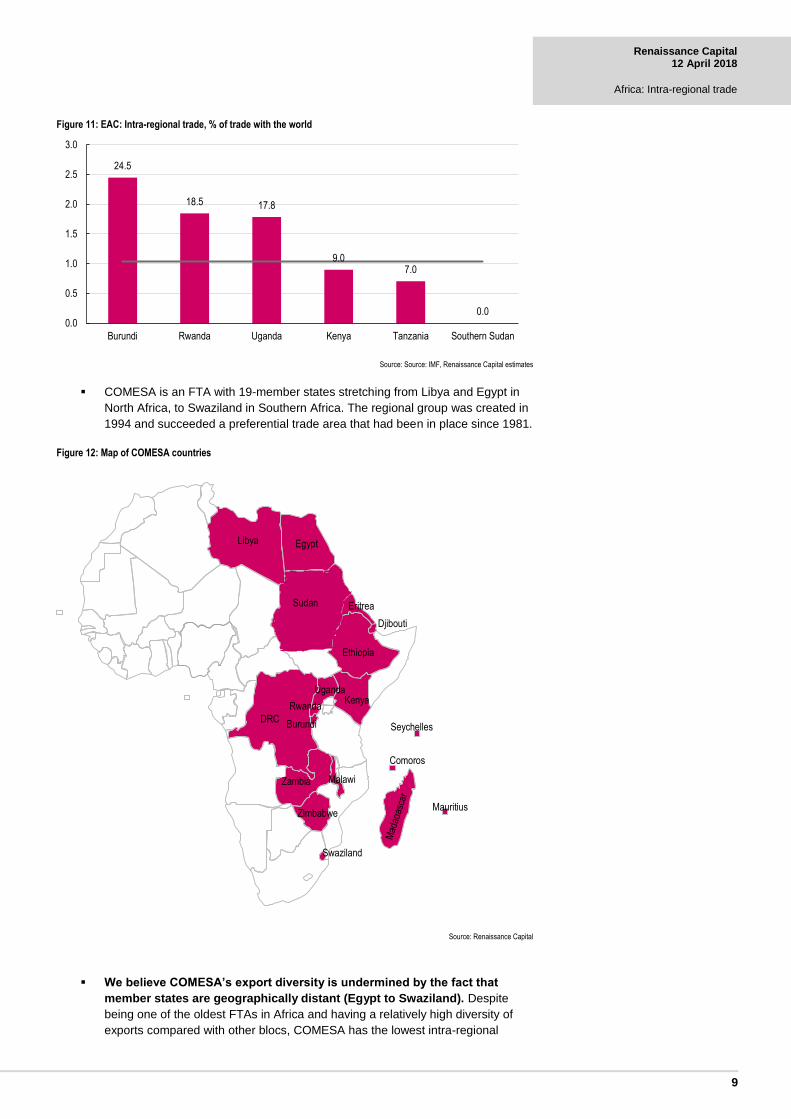
▪ COMESA is an FTA with 19-member states stretching from Libya and Egypt in
North Africa, to Swaziland in Southern Africa. The regional group was created in
1994 and succeeded a preferential trade area that had been in place since 1981.
Figure 12: Map of COMESA countries
Source: Renaissance Capital
▪ We believe COMESA’s export diversity is undermined by the fact that
member states are geographically distant (Egypt to Swaziland). Despite
being one of the oldest FTAs in Africa and having a relatively high diversity of
exports compared with other blocs, COMESA has the lowest intra-regional
24.5
18.5 17.8
9.07.0
0.00.0
0.5
1.0
1.5
2.0
2.5
3.0
Burundi Rwanda Uganda Kenya Tanzania Southern Sudan
Kenya
Zambia
Zimbabwe
DRC
Ethiopia
Burundi
Comoros
Djibouti
Egypt
Eritrea
Libya
Malawi
Mauritius
Rwanda
Seychelles
Swaziland
Uganda
Sudan
10
Renaissance Capital 12 April 2018
Africa: Intra-regional trade
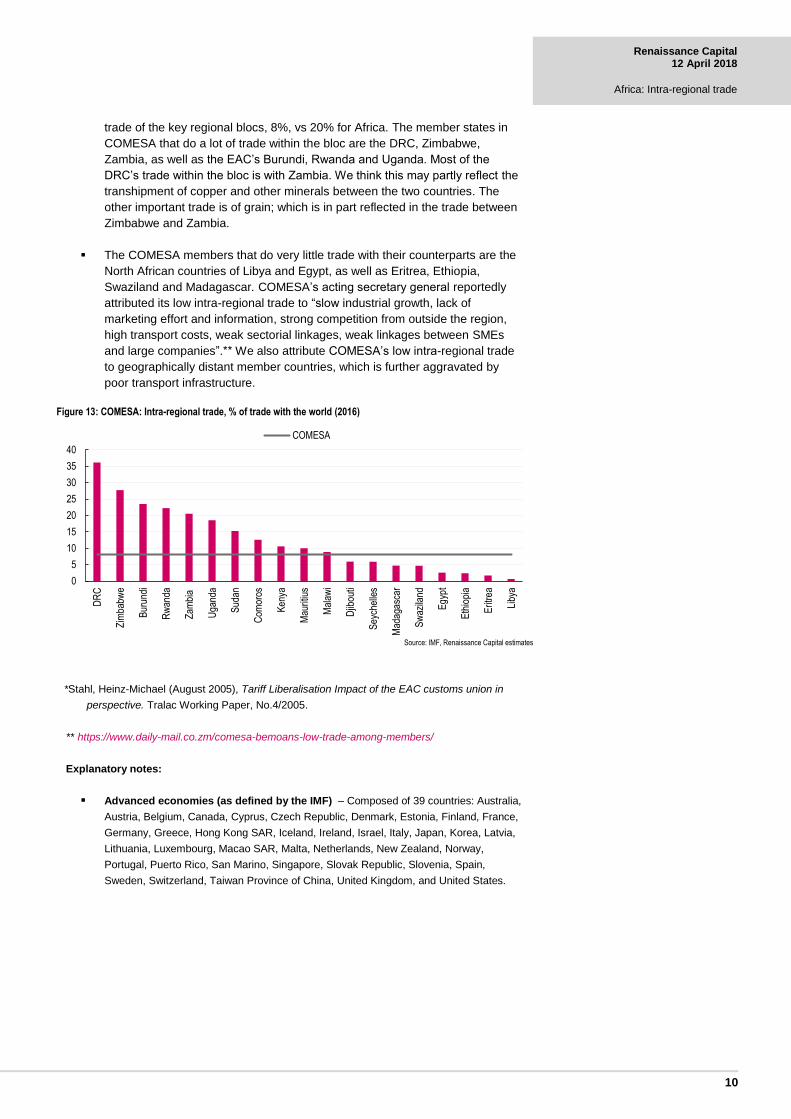
trade of the key regional blocs, 8%, vs 20% for Africa. The member states in
COMESA that do a lot of trade within the bloc are the DRC, Zimbabwe,
Zambia, as well as the EAC’s Burundi, Rwanda and Uganda. Most of the
DRC’s trade within the bloc is with Zambia. We think this may partly reflect the
transhipment of copper and other minerals between the two countries. The
other important trade is of grain; which is in part reflected in the trade between
Zimbabwe and Zambia.
▪ The COMESA members that do very little trade with their counterparts are the
North African countries of Libya and Egypt, as well as Eritrea, Ethiopia,
Swaziland and Madagascar. COMESA’s acting secretary general reportedly
attributed its low intra-regional trade to “slow industrial growth, lack of
marketing effort and information, strong competition from outside the region,
high transport costs, weak sectorial linkages, weak linkages between SMEs
and large companies”.** We also attribute COMESA’s low intra-regional trade
to geographically distant member countries, which is further aggravated by
poor transport infrastructure.
Figure 13: COMESA: Intra-regional trade, % of trade with the world (2016)
Source: IMF, Renaissance Capital estimates
*Stahl, Heinz-Michael (August 2005), Tariff Liberalisation Impact of the EAC customs union in
perspective. Tralac Working Paper, No.4/2005.
** https://www.daily-mail.co.zm/comesa-bemoans-low-trade-among-members/
Explanatory notes:
▪ Advanced economies (as defined by the IMF) – Composed of 39 countries: Australia,
Austria, Belgium, Canada, Cyprus, Czech Republic, Denmark, Estonia, Finland, France,
Germany, Greece, Hong Kong SAR, Iceland, Ireland, Israel, Italy, Japan, Korea, Latvia,
Lithuania, Luxembourg, Macao SAR, Malta, Netherlands, New Zealand, Norway,
Portugal, Puerto Rico, San Marino, Singapore, Slovak Republic, Slovenia, Spain,
Sweden, Switzerland, Taiwan Province of China, United Kingdom, and United States.
0
5
10
15
20
25
30
35
40
DR
C
Zim
babw
e
Bur
undi
Rw
anda
Zam
bia
Uga
nda
Sud
an
Com
oros
Ken
ya
Mau
ritiu
s
Mal
awi
Djib
outi
Sey
chel
les
Mad
agas
car
Sw
azila
nd
Egy
pt
Eth
iopi
a
Erit
rea
Liby
a
COMESA
11
Renaissance Capital 12 April 2018
Africa: Intra-regional trade
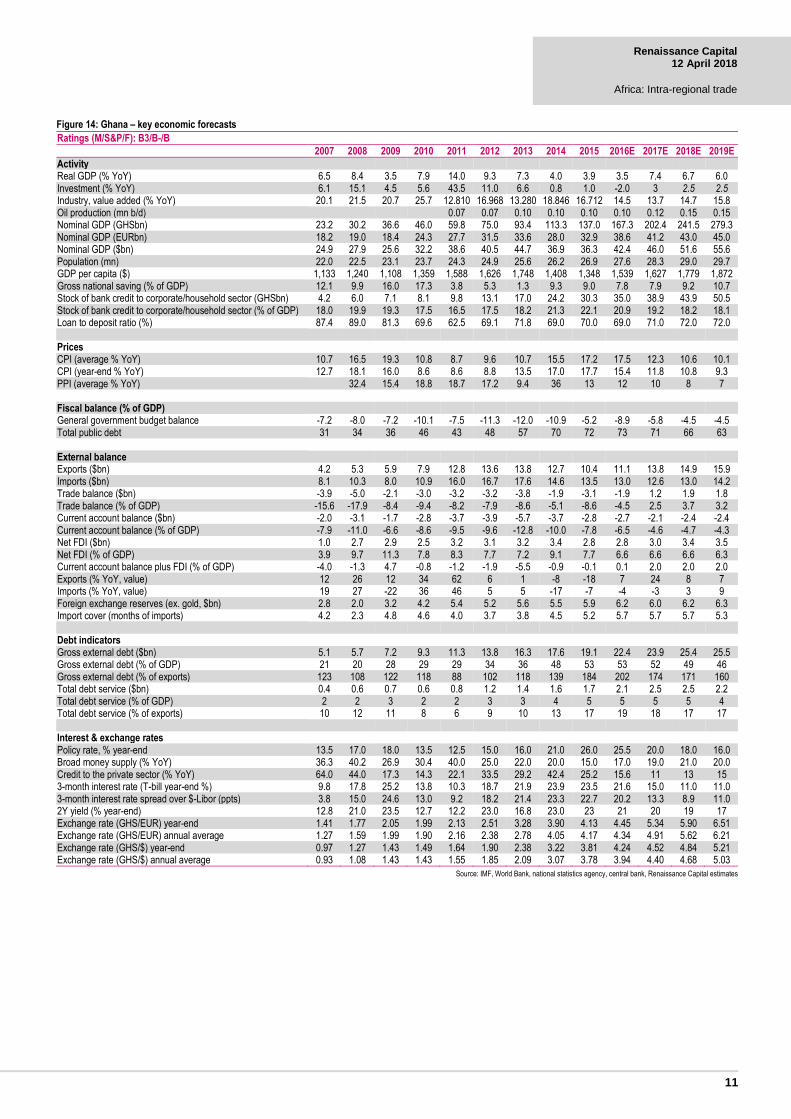
Figure 14: Ghana – key economic forecasts Ratings (M/S&P/F): B3/B-/B
2007 2008 2009 2010 2011 2012 2013 2014 2015 2016E 2017E 2018E 2019E
Activity
Real GDP (% YoY) 6.5 8.4 3.5 7.9 14.0 9.3 7.3 4.0 3.9 3.5 7.4 6.7 6.0 Investment (% YoY) 6.1 15.1 4.5 5.6 43.5 11.0 6.6 0.8 1.0 -2.0 3 2.5 2.5 Industry, value added (% YoY) 20.1 21.5 20.7 25.7 12.810 16.968 13.280 18.846 16.712 14.5 13.7 14.7 15.8 Oil production (mn b/d) 0.07 0.07 0.10 0.10 0.10 0.10 0.12 0.15 0.15 Nominal GDP (GHSbn) 23.2 30.2 36.6 46.0 59.8 75.0 93.4 113.3 137.0 167.3 202.4 241.5 279.3 Nominal GDP (EURbn) 18.2 19.0 18.4 24.3 27.7 31.5 33.6 28.0 32.9 38.6 41.2 43.0 45.0 Nominal GDP ($bn) 24.9 27.9 25.6 32.2 38.6 40.5 44.7 36.9 36.3 42.4 46.0 51.6 55.6 Population (mn) 22.0 22.5 23.1 23.7 24.3 24.9 25.6 26.2 26.9 27.6 28.3 29.0 29.7 GDP per capita ($) 1,133 1,240 1,108 1,359 1,588 1,626 1,748 1,408 1,348 1,539 1,627 1,779 1,872 Gross national saving (% of GDP) 12.1 9.9 16.0 17.3 3.8 5.3 1.3 9.3 9.0 7.8 7.9 9.2 10.7 Stock of bank credit to corporate/household sector (GHSbn) 4.2 6.0 7.1 8.1 9.8 13.1 17.0 24.2 30.3 35.0 38.9 43.9 50.5 Stock of bank credit to corporate/household sector (% of GDP) 18.0 19.9 19.3 17.5 16.5 17.5 18.2 21.3 22.1 20.9 19.2 18.2 18.1 Loan to deposit ratio (%) 87.4 89.0 81.3 69.6 62.5 69.1 71.8 69.0 70.0 69.0 71.0 72.0 72.0
Prices
CPI (average % YoY) 10.7 16.5 19.3 10.8 8.7 9.6 10.7 15.5 17.2 17.5 12.3 10.6 10.1 CPI (year-end % YoY) 12.7 18.1 16.0 8.6 8.6 8.8 13.5 17.0 17.7 15.4 11.8 10.8 9.3 PPI (average % YoY) 32.4 15.4 18.8 18.7 17.2 9.4 36 13 12 10 8 7
Fiscal balance (% of GDP)
General government budget balance -7.2 -8.0 -7.2 -10.1 -7.5 -11.3 -12.0 -10.9 -5.2 -8.9 -5.8 -4.5 -4.5 Total public debt 31 34 36 46 43 48 57 70 72 73 71 66 63
External balance
Exports ($bn) 4.2 5.3 5.9 7.9 12.8 13.6 13.8 12.7 10.4 11.1 13.8 14.9 15.9 Imports ($bn) 8.1 10.3 8.0 10.9 16.0 16.7 17.6 14.6 13.5 13.0 12.6 13.0 14.2 Trade balance ($bn) -3.9 -5.0 -2.1 -3.0 -3.2 -3.2 -3.8 -1.9 -3.1 -1.9 1.2 1.9 1.8 Trade balance (% of GDP) -15.6 -17.9 -8.4 -9.4 -8.2 -7.9 -8.6 -5.1 -8.6 -4.5 2.5 3.7 3.2 Current account balance ($bn) -2.0 -3.1 -1.7 -2.8 -3.7 -3.9 -5.7 -3.7 -2.8 -2.7 -2.1 -2.4 -2.4 Current account balance (% of GDP) -7.9 -11.0 -6.6 -8.6 -9.5 -9.6 -12.8 -10.0 -7.8 -6.5 -4.6 -4.7 -4.3 Net FDI ($bn) 1.0 2.7 2.9 2.5 3.2 3.1 3.2 3.4 2.8 2.8 3.0 3.4 3.5 Net FDI (% of GDP) 3.9 9.7 11.3 7.8 8.3 7.7 7.2 9.1 7.7 6.6 6.6 6.6 6.3 Current account balance plus FDI (% of GDP) -4.0 -1.3 4.7 -0.8 -1.2 -1.9 -5.5 -0.9 -0.1 0.1 2.0 2.0 2.0 Exports (% YoY, value) 12 26 12 34 62 6 1 -8 -18 7 24 8 7 Imports (% YoY, value) 19 27 -22 36 46 5 5 -17 -7 -4 -3 3 9 Foreign exchange reserves (ex. gold, $bn) 2.8 2.0 3.2 4.2 5.4 5.2 5.6 5.5 5.9 6.2 6.0 6.2 6.3 Import cover (months of imports) 4.2 2.3 4.8 4.6 4.0 3.7 3.8 4.5 5.2 5.7 5.7 5.7 5.3
Debt indicators
Gross external debt ($bn) 5.1 5.7 7.2 9.3 11.3 13.8 16.3 17.6 19.1 22.4 23.9 25.4 25.5 Gross external debt (% of GDP) 21 20 28 29 29 34 36 48 53 53 52 49 46 Gross external debt (% of exports) 123 108 122 118 88 102 118 139 184 202 174 171 160 Total debt service ($bn) 0.4 0.6 0.7 0.6 0.8 1.2 1.4 1.6 1.7 2.1 2.5 2.5 2.2 Total debt service (% of GDP) 2 2 3 2 2 3 3 4 5 5 5 5 4 Total debt service (% of exports) 10 12 11 8 6 9 10 13 17 19 18 17 17
Interest & exchange rates
Policy rate, % year-end 13.5 17.0 18.0 13.5 12.5 15.0 16.0 21.0 26.0 25.5 20.0 18.0 16.0 Broad money supply (% YoY) 36.3 40.2 26.9 30.4 40.0 25.0 22.0 20.0 15.0 17.0 19.0 21.0 20.0 Credit to the private sector (% YoY) 64.0 44.0 17.3 14.3 22.1 33.5 29.2 42.4 25.2 15.6 11 13 15 3-month interest rate (T-bill year-end %) 9.8 17.8 25.2 13.8 10.3 18.7 21.9 23.9 23.5 21.6 15.0 11.0 11.0 3-month interest rate spread over $-Libor (ppts) 3.8 15.0 24.6 13.0 9.2 18.2 21.4 23.3 22.7 20.2 13.3 8.9 11.0 2Y yield (% year-end) 12.8 21.0 23.5 12.7 12.2 23.0 16.8 23.0 23 21 20 19 17 Exchange rate (GHS/EUR) year-end 1.41 1.77 2.05 1.99 2.13 2.51 3.28 3.90 4.13 4.45 5.34 5.90 6.51 Exchange rate (GHS/EUR) annual average 1.27 1.59 1.99 1.90 2.16 2.38 2.78 4.05 4.17 4.34 4.91 5.62 6.21 Exchange rate (GHS/$) year-end 0.97 1.27 1.43 1.49 1.64 1.90 2.38 3.22 3.81 4.24 4.52 4.84 5.21 Exchange rate (GHS/$) annual average 0.93 1.08 1.43 1.43 1.55 1.85 2.09 3.07 3.78 3.94 4.40 4.68 5.03
Source: IMF, World Bank, national statistics agency, central bank, Renaissance Capital estimates

12
Renaissance Capital 12 April 2018
Africa: Intra-regional trade
Figure 15: Kenya – key economic forecasts
Ratings (Moody's/S&P/F): B1/B+/B+ 2007 2008 2009 2010 2011 2012 2013 2014 2015 2016E 2017E 2018E 2019E
Activity
Real GDP (% YoY) 6.9 0.2 3.3 8.4 6.1 4.5 5.7 5.3 5.6 5.8 4.4 4.6 5.0 Private consumption (% YoY) 7.3 -1.3 5.0 7.2 2.8 5.7 8.3 7.6 6.1 6.2 2.5 3 3.5 Government consumption (% YoY) 3.5 2.5 3.8 9.2 10.6 7.3 1.1 8.2 7.9 7.5 7.8 7.5 7.5 Investment (% YoY) 18.5 13.6 9.5 2.8 7.7 6 6.5 7.5 8.1 8 7 6.5 6.5 Industry, value added (% YoY) 7.1 4.7 2.8 7.9 6.7 3.5 5.8 6.1 6.7 5.5 4.6 5.0 5.0 Nominal GDP (KESbn) 2,151 2,483 2,864 3,169 3,726 4,255 4,745 5,398 6,261 7,159 8,142 9,142 10,269 Nominal GDP (EURbn) 23.3 24.4 26.6 30.2 30.1 39.2 41.5 47 57 64 71 72 76 Nominal GDP ($bn) 32.0 35.9 37.1 40.0 42.0 50.4 55.1 61.3 63.7 70.5 78.9 86.7 93.7 Population (mn) 35.7 36.7 37.7 38.5 39.5 40.7 41.8 43.0 44.2 45.5 46.7 48.0 49.4 GDP per capita ($) 896 978 983 1,040 1,062 1,237 1,319 1,427 1,441 1,552 1,689 1,805 1,898 Gross national saving (% of GDP) 15.1 12.7 14.4 12.4 9.4 9.6 11.3 12.2 10.9 15.5 15.4 14.0 13.5 Stock of bank credit to corporate/household sector (KESbn) 541 686 758 915 1,191 1,360 1,580 2,035 2,402 2,570 2,596 2,699 2,888 Stock of bank credit to corporate/household sector (% of GDP) 25 28 26 29 32 32 33 38 38 36 32 30 28 Loan to deposit ratio (%) 72 73 75 74 80 77 74 76 77 75 77 78 78
Prices
CPI (average % YoY) 4.3 16.2 9.4 3.8 13.6 9.6 5.7 6.9 6.6 6.2 7.8 5.9 7.8 CPI (year-end % YoY) 5.6 17.8 5.3 4.5 18.6 3.2 7.1 6.0 8.0 6.0 4.5 9.0 7.8
Fiscal balance (% of GDP)*
General government budget balance -3.2 -4.2 -4.9 -4.8 -5.8 -5.5 -6.1 -8.5 -7.4 -8.9 -8.0 -7.0 6.5 General government primary balance -0.8 -1.8 -2.7 -2.5 -2.2 -2.9 -3.3 -4.8 -5.3 -5.7 -5.1 -3.2 -2.3 Total public debt 43.1 44.4 45.1 47.5 44.8 43.2 41.5 46.7 51.3 52.7 56.2 57.0 58.0
External balance
Exports ($bn) 4.1 5.0 4.5 5.2 5.8 6.1 5.8 6.2 6.0 5.7 5.8 5.7 6.0 Imports ($bn) 8.4 10.7 9.5 12.1 14.8 16.4 16.8 17.6 15.6 15.6 16.2 17.6 18.4 Trade balance ($bn) -4.3 -5.6 -5.0 -6.9 -9.0 -10.3 -11.0 -11.4 -9.6 -9.8 -10.4 -11.8 -12.5 Trade balance (% of GDP) -13.3 -15.7 -13.5 -17.3 -21.5 -20.4 -19.9 -18.6 -15.0 -13.9 -13.2 -13.6 -13.3 Current account balance ($bn) -1.1 -2.0 -1.6 -2.5 -4.5 -4.3 -4.9 -6.3 -4.3 -3.9 -5.3 -6.9 -6.0 Current account balance (% of GDP) -3.4 -5.6 -4.4 -6.3 -10.6 -8.5 -8.8 -10.3 -6.8 -5.5 -6.7 -8.0 -6.4 Net FDI ($bn) 0.7 0.1 0.6 0.7 0.8 0.8 0.5 0.8 1.1 1.4 1.5 1.8 1.9 Net FDI (% of GDP) 2.3 0.3 1.6 1.7 1.9 1.7 0.9 1.2 1.7 2.0 1.9 2.0 2.0 Current account balance plus FDI (% of GDP) -1.1 -5.3 -2.8 -4.5 -8.7 -6.8 -8.0 -9.1 -5.1 -3.5 -4.8 -5.9 -4.4 Exports (% YoY, value) 18 22 -11 14 12 6 -5 6 -3 -4 0 2 4 Imports (% YoY, value) 24 27 -11 27 22 11 3 5 -12 0 17 10 5 Foreign exchange reserves (ex. gold, $bn) 3.4 2.9 3.8 4.0 4.0 5.4 6.2 6.9 7.2 7.0 7.0 7.0 7.1 Import cover (months of merchandise imports) 4.8 3.2 4.9 4.0 3.2 3.9 4.4 4.7 5.6 5.4 5.2 4.8 4.6
Debt indicators
Gross external debt ($bn) 7.5 7.6 9.3 9.1 10.3 14.3 16.3 22.8 27.1 31.8 36.5 40.0 39.5 Gross external debt (% of GDP) 24 21 25 23 25 28 30 37 43 45 46 46 42 Gross external debt (% of exports) 182 151 207 176 179 233 279 370 452 553 631 697 661 Total debt service ($bn) 0.5 0.4 0.4 0.4 0.7 2.4 3.0 3.7 1.7 1.4 2.0 2.2 2.3 Total debt service (% of GDP) 1 1 1 1 2 5 5 6 3 2 3 3 2 Total debt service (% of exports) 11 8 9 5 11 39 51 59 29 25 43 34 34
Interest & exchange rates
Central bank rate (CBR), % year-end 8.8 8.5 7.0 6.0 18.0 11.0 8.5 8.5 11.5 10.0 10.0 9.5 9.0 Broad money supply (% YoY) 20.9 13.0 16.0 21.7 19.1 14.9 14.7 16.9 14.0 17.0 3.0 6.0 9.0 Credit to the private sector (% YoY) 16.4 27.2 19.5 21.3 30.1 11.1 16.2 28.8 18.0 7.0 1.0 4.0 7.0 3-month interest rate (T-bill year-end %) 6.9 8.6 6.8 2.3 18.3 8.3 9.5 8.6 9.8 9.4 8.0 7.5 7.5 3-month interest rate spread over $-Libor (ppts) 0.9 5.8 6.2 1.5 17.2 7.8 9.5 8.0 9.0 8.0 6.3 5.4 7.5 5Y yield (% avg) 11.5 10.5 10.5 9.5 14.5 13.5 12.9 12.6 13.2 12.7 13.0 12.5 12.5 Exchange rate (KES/EUR) year-end 93 109 109 108 110 113 119 110 113 108 122 131 140 Exchange rate (KES/EUR) annual average 92 102 108 105 124 109 114 116 110 112 115 127 135 Exchange rate (KES/$) year-end 63.8 78.2 75.8 80.7 85.1 86.0 86.3 90.6 102.3 102.5 103.4 107.5 111.6 Exchange rate (KES/$) annual average 67.3 69.2 77.2 79.2 88.8 84.5 86.1 88.0 98.3 101.5 103.2 105.5 109.6
*Fiscal year to 30 June (2000 is FY00/01).
Source: IMF, World Bank, national statistics agency, central bank, Renaissance Capital estimates
13
Renaissance Capital 12 April 2018
Africa: Intra-regional trade
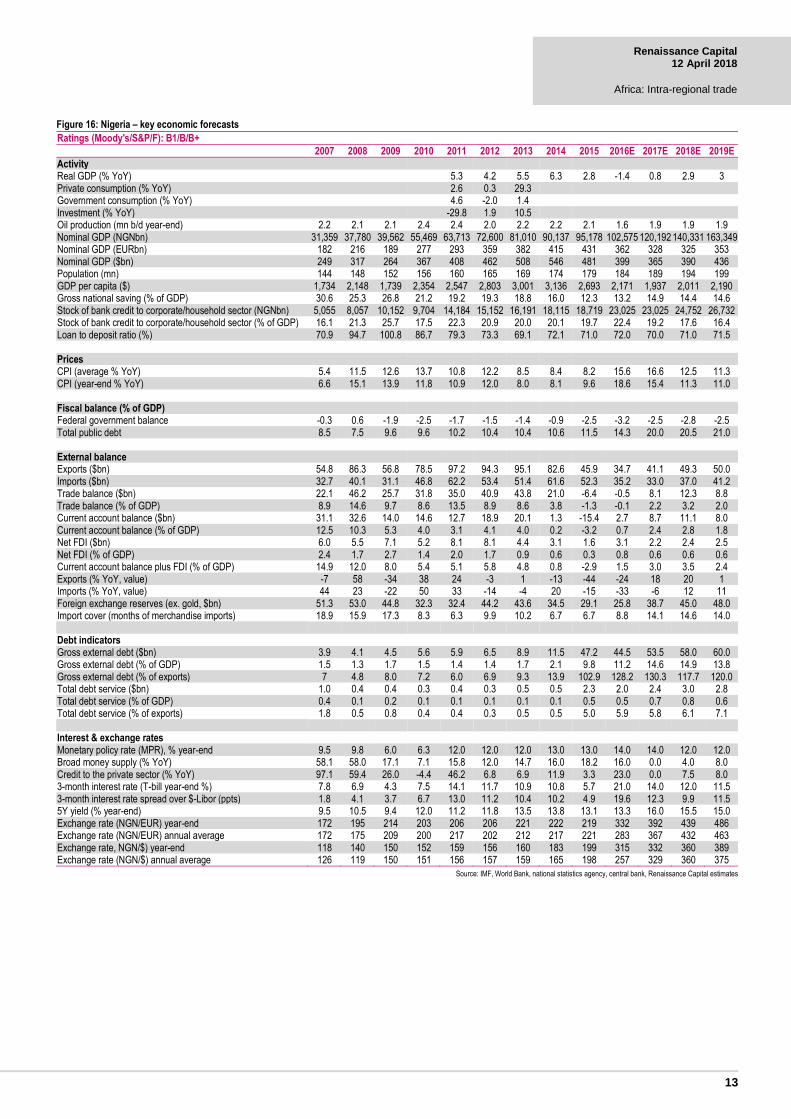
Figure 16: Nigeria – key economic forecasts Ratings (Moody's/S&P/F): B1/B/B+
2007 2008 2009 2010 2011 2012 2013 2014 2015 2016E 2017E 2018E 2019E
Activity Real GDP (% YoY) 5.3 4.2 5.5 6.3 2.8 -1.4 0.8 2.9 3 Private consumption (% YoY) 2.6 0.3 29.3 Government consumption (% YoY) 4.6 -2.0 1.4 Investment (% YoY) -29.8 1.9 10.5 Oil production (mn b/d year-end) 2.2 2.1 2.1 2.4 2.4 2.0 2.2 2.2 2.1 1.6 1.9 1.9 1.9 Nominal GDP (NGNbn) 31,359 37,780 39,562 55,469 63,713 72,600 81,010 90,137 95,178 102,575 120,192 140,331 163,349 Nominal GDP (EURbn) 182 216 189 277 293 359 382 415 431 362 328 325 353 Nominal GDP ($bn) 249 317 264 367 408 462 508 546 481 399 365 390 436 Population (mn) 144 148 152 156 160 165 169 174 179 184 189 194 199 GDP per capita ($) 1,734 2,148 1,739 2,354 2,547 2,803 3,001 3,136 2,693 2,171 1,937 2,011 2,190 Gross national saving (% of GDP) 30.6 25.3 26.8 21.2 19.2 19.3 18.8 16.0 12.3 13.2 14.9 14.4 14.6 Stock of bank credit to corporate/household sector (NGNbn) 5,055 8,057 10,152 9,704 14,184 15,152 16,191 18,115 18,719 23,025 23,025 24,752 26,732 Stock of bank credit to corporate/household sector (% of GDP) 16.1 21.3 25.7 17.5 22.3 20.9 20.0 20.1 19.7 22.4 19.2 17.6 16.4 Loan to deposit ratio (%) 70.9 94.7 100.8 86.7 79.3 73.3 69.1 72.1 71.0 72.0 70.0 71.0 71.5
Prices CPI (average % YoY) 5.4 11.5 12.6 13.7 10.8 12.2 8.5 8.4 8.2 15.6 16.6 12.5 11.3 CPI (year-end % YoY) 6.6 15.1 13.9 11.8 10.9 12.0 8.0 8.1 9.6 18.6 15.4 11.3 11.0
Fiscal balance (% of GDP) Federal government balance -0.3 0.6 -1.9 -2.5 -1.7 -1.5 -1.4 -0.9 -2.5 -3.2 -2.5 -2.8 -2.5 Total public debt 8.5 7.5 9.6 9.6 10.2 10.4 10.4 10.6 11.5 14.3 20.0 20.5 21.0
External balance Exports ($bn) 54.8 86.3 56.8 78.5 97.2 94.3 95.1 82.6 45.9 34.7 41.1 49.3 50.0 Imports ($bn) 32.7 40.1 31.1 46.8 62.2 53.4 51.4 61.6 52.3 35.2 33.0 37.0 41.2 Trade balance ($bn) 22.1 46.2 25.7 31.8 35.0 40.9 43.8 21.0 -6.4 -0.5 8.1 12.3 8.8 Trade balance (% of GDP) 8.9 14.6 9.7 8.6 13.5 8.9 8.6 3.8 -1.3 -0.1 2.2 3.2 2.0 Current account balance ($bn) 31.1 32.6 14.0 14.6 12.7 18.9 20.1 1.3 -15.4 2.7 8.7 11.1 8.0 Current account balance (% of GDP) 12.5 10.3 5.3 4.0 3.1 4.1 4.0 0.2 -3.2 0.7 2.4 2.8 1.8 Net FDI ($bn) 6.0 5.5 7.1 5.2 8.1 8.1 4.4 3.1 1.6 3.1 2.2 2.4 2.5 Net FDI (% of GDP) 2.4 1.7 2.7 1.4 2.0 1.7 0.9 0.6 0.3 0.8 0.6 0.6 0.6 Current account balance plus FDI (% of GDP) 14.9 12.0 8.0 5.4 5.1 5.8 4.8 0.8 -2.9 1.5 3.0 3.5 2.4 Exports (% YoY, value) -7 58 -34 38 24 -3 1 -13 -44 -24 18 20 1 Imports (% YoY, value) 44 23 -22 50 33 -14 -4 20 -15 -33 -6 12 11 Foreign exchange reserves (ex. gold, $bn) 51.3 53.0 44.8 32.3 32.4 44.2 43.6 34.5 29.1 25.8 38.7 45.0 48.0 Import cover (months of merchandise imports) 18.9 15.9 17.3 8.3 6.3 9.9 10.2 6.7 6.7 8.8 14.1 14.6 14.0
Debt indicators Gross external debt ($bn) 3.9 4.1 4.5 5.6 5.9 6.5 8.9 11.5 47.2 44.5 53.5 58.0 60.0 Gross external debt (% of GDP) 1.5 1.3 1.7 1.5 1.4 1.4 1.7 2.1 9.8 11.2 14.6 14.9 13.8 Gross external debt (% of exports) 7 4.8 8.0 7.2 6.0 6.9 9.3 13.9 102.9 128.2 130.3 117.7 120.0 Total debt service ($bn) 1.0 0.4 0.4 0.3 0.4 0.3 0.5 0.5 2.3 2.0 2.4 3.0 2.8 Total debt service (% of GDP) 0.4 0.1 0.2 0.1 0.1 0.1 0.1 0.1 0.5 0.5 0.7 0.8 0.6 Total debt service (% of exports) 1.8 0.5 0.8 0.4 0.4 0.3 0.5 0.5 5.0 5.9 5.8 6.1 7.1
Interest & exchange rates Monetary policy rate (MPR), % year-end 9.5 9.8 6.0 6.3 12.0 12.0 12.0 13.0 13.0 14.0 14.0 12.0 12.0 Broad money supply (% YoY) 58.1 58.0 17.1 7.1 15.8 12.0 14.7 16.0 18.2 16.0 0.0 4.0 8.0 Credit to the private sector (% YoY) 97.1 59.4 26.0 -4.4 46.2 6.8 6.9 11.9 3.3 23.0 0.0 7.5 8.0 3-month interest rate (T-bill year-end %) 7.8 6.9 4.3 7.5 14.1 11.7 10.9 10.8 5.7 21.0 14.0 12.0 11.5 3-month interest rate spread over $-Libor (ppts) 1.8 4.1 3.7 6.7 13.0 11.2 10.4 10.2 4.9 19.6 12.3 9.9 11.5 5Y yield (% year-end) 9.5 10.5 9.4 12.0 11.2 11.8 13.5 13.8 13.1 13.3 16.0 15.5 15.0 Exchange rate (NGN/EUR) year-end 172 195 214 203 206 206 221 222 219 332 392 439 486 Exchange rate (NGN/EUR) annual average 172 175 209 200 217 202 212 217 221 283 367 432 463 Exchange rate, NGN/$) year-end 118 140 150 152 159 156 160 183 199 315 332 360 389 Exchange rate (NGN/$) annual average 126 119 150 151 156 157 159 165 198 257 329 360 375
Source: IMF, World Bank, national statistics agency, central bank, Renaissance Capital estimates
14
Renaissance Capital 12 April 2018
Africa: Intra-regional trade
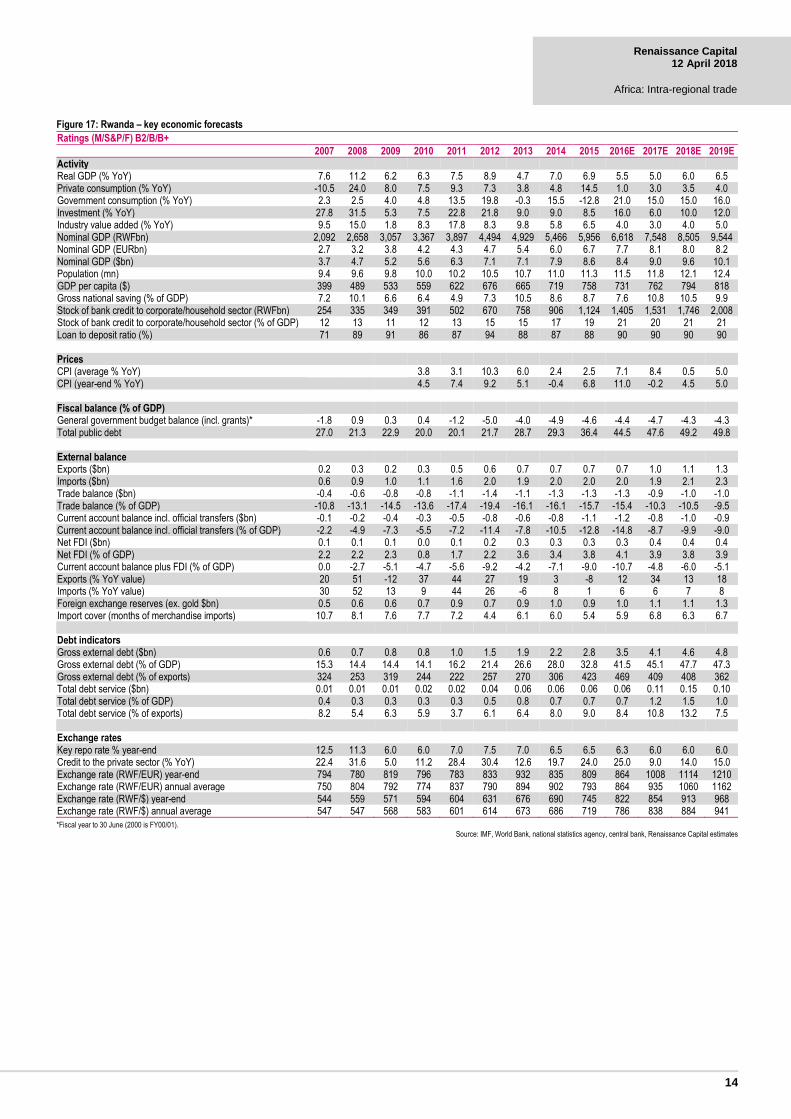
Figure 17: Rwanda – key economic forecasts Ratings (M/S&P/F) B2/B/B+
2007 2008 2009 2010 2011 2012 2013 2014 2015 2016E 2017E 2018E 2019E
Activity
Real GDP (% YoY) 7.6 11.2 6.2 6.3 7.5 8.9 4.7 7.0 6.9 5.5 5.0 6.0 6.5 Private consumption (% YoY) -10.5 24.0 8.0 7.5 9.3 7.3 3.8 4.8 14.5 1.0 3.0 3.5 4.0 Government consumption (% YoY) 2.3 2.5 4.0 4.8 13.5 19.8 -0.3 15.5 -12.8 21.0 15.0 15.0 16.0 Investment (% YoY) 27.8 31.5 5.3 7.5 22.8 21.8 9.0 9.0 8.5 16.0 6.0 10.0 12.0 Industry value added (% YoY) 9.5 15.0 1.8 8.3 17.8 8.3 9.8 5.8 6.5 4.0 3.0 4.0 5.0 Nominal GDP (RWFbn) 2,092 2,658 3,057 3,367 3,897 4,494 4,929 5,466 5,956 6,618 7,548 8,505 9,544 Nominal GDP (EURbn) 2.7 3.2 3.8 4.2 4.3 4.7 5.4 6.0 6.7 7.7 8.1 8.0 8.2 Nominal GDP ($bn) 3.7 4.7 5.2 5.6 6.3 7.1 7.1 7.9 8.6 8.4 9.0 9.6 10.1 Population (mn) 9.4 9.6 9.8 10.0 10.2 10.5 10.7 11.0 11.3 11.5 11.8 12.1 12.4 GDP per capita ($) 399 489 533 559 622 676 665 719 758 731 762 794 818 Gross national saving (% of GDP) 7.2 10.1 6.6 6.4 4.9 7.3 10.5 8.6 8.7 7.6 10.8 10.5 9.9 Stock of bank credit to corporate/household sector (RWFbn) 254 335 349 391 502 670 758 906 1,124 1,405 1,531 1,746 2,008 Stock of bank credit to corporate/household sector (% of GDP) 12 13 11 12 13 15 15 17 19 21 20 21 21 Loan to deposit ratio (%) 71 89 91 86 87 94 88 87 88 90 90 90 90
Prices
CPI (average % YoY) 3.8 3.1 10.3 6.0 2.4 2.5 7.1 8.4 0.5 5.0 CPI (year-end % YoY) 4.5 7.4 9.2 5.1 -0.4 6.8 11.0 -0.2 4.5 5.0
Fiscal balance (% of GDP)
General government budget balance (incl. grants)* -1.8 0.9 0.3 0.4 -1.2 -5.0 -4.0 -4.9 -4.6 -4.4 -4.7 -4.3 -4.3 Total public debt 27.0 21.3 22.9 20.0 20.1 21.7 28.7 29.3 36.4 44.5 47.6 49.2 49.8
External balance
Exports ($bn) 0.2 0.3 0.2 0.3 0.5 0.6 0.7 0.7 0.7 0.7 1.0 1.1 1.3 Imports ($bn) 0.6 0.9 1.0 1.1 1.6 2.0 1.9 2.0 2.0 2.0 1.9 2.1 2.3 Trade balance ($bn) -0.4 -0.6 -0.8 -0.8 -1.1 -1.4 -1.1 -1.3 -1.3 -1.3 -0.9 -1.0 -1.0 Trade balance (% of GDP) -10.8 -13.1 -14.5 -13.6 -17.4 -19.4 -16.1 -16.1 -15.7 -15.4 -10.3 -10.5 -9.5 Current account balance incl. official transfers ($bn) -0.1 -0.2 -0.4 -0.3 -0.5 -0.8 -0.6 -0.8 -1.1 -1.2 -0.8 -1.0 -0.9 Current account balance incl. official transfers (% of GDP) -2.2 -4.9 -7.3 -5.5 -7.2 -11.4 -7.8 -10.5 -12.8 -14.8 -8.7 -9.9 -9.0 Net FDI ($bn) 0.1 0.1 0.1 0.0 0.1 0.2 0.3 0.3 0.3 0.3 0.4 0.4 0.4 Net FDI (% of GDP) 2.2 2.2 2.3 0.8 1.7 2.2 3.6 3.4 3.8 4.1 3.9 3.8 3.9 Current account balance plus FDI (% of GDP) 0.0 -2.7 -5.1 -4.7 -5.6 -9.2 -4.2 -7.1 -9.0 -10.7 -4.8 -6.0 -5.1 Exports (% YoY value) 20 51 -12 37 44 27 19 3 -8 12 34 13 18 Imports (% YoY value) 30 52 13 9 44 26 -6 8 1 6 6 7 8 Foreign exchange reserves (ex. gold $bn) 0.5 0.6 0.6 0.7 0.9 0.7 0.9 1.0 0.9 1.0 1.1 1.1 1.3 Import cover (months of merchandise imports) 10.7 8.1 7.6 7.7 7.2 4.4 6.1 6.0 5.4 5.9 6.8 6.3 6.7
Debt indicators
Gross external debt ($bn) 0.6 0.7 0.8 0.8 1.0 1.5 1.9 2.2 2.8 3.5 4.1 4.6 4.8 Gross external debt (% of GDP) 15.3 14.4 14.4 14.1 16.2 21.4 26.6 28.0 32.8 41.5 45.1 47.7 47.3 Gross external debt (% of exports) 324 253 319 244 222 257 270 306 423 469 409 408 362 Total debt service ($bn) 0.01 0.01 0.01 0.02 0.02 0.04 0.06 0.06 0.06 0.06 0.11 0.15 0.10 Total debt service (% of GDP) 0.4 0.3 0.3 0.3 0.3 0.5 0.8 0.7 0.7 0.7 1.2 1.5 1.0 Total debt service (% of exports) 8.2 5.4 6.3 5.9 3.7 6.1 6.4 8.0 9.0 8.4 10.8 13.2 7.5
Exchange rates
Key repo rate % year-end 12.5 11.3 6.0 6.0 7.0 7.5 7.0 6.5 6.5 6.3 6.0 6.0 6.0 Credit to the private sector (% YoY) 22.4 31.6 5.0 11.2 28.4 30.4 12.6 19.7 24.0 25.0 9.0 14.0 15.0 Exchange rate (RWF/EUR) year-end 794 780 819 796 783 833 932 835 809 864 1008 1114 1210 Exchange rate (RWF/EUR) annual average 750 804 792 774 837 790 894 902 793 864 935 1060 1162 Exchange rate (RWF/$) year-end 544 559 571 594 604 631 676 690 745 822 854 913 968 Exchange rate (RWF/$) annual average 547 547 568 583 601 614 673 686 719 786 838 884 941
*Fiscal year to 30 June (2000 is FY00/01). Source: IMF, World Bank, national statistics agency, central bank, Renaissance Capital estimates
15
Renaissance Capital 12 April 2018
Africa: Intra-regional trade
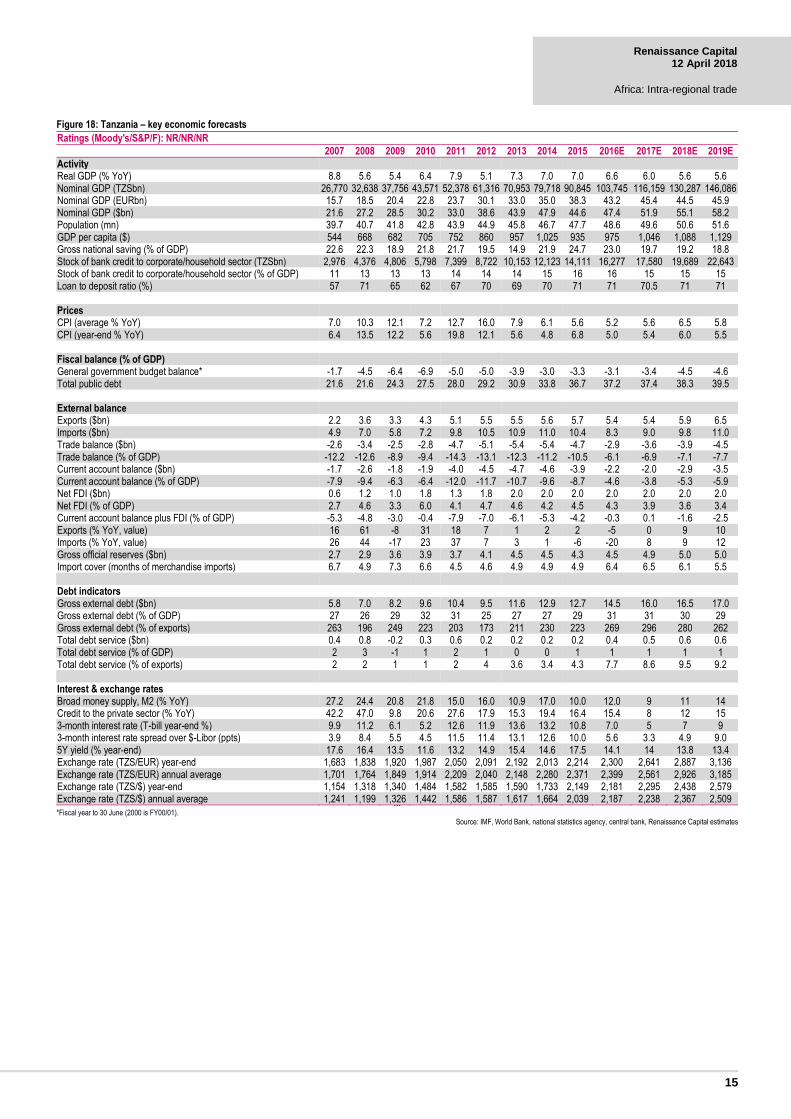
Figure 18: Tanzania – key economic forecasts Ratings (Moody's/S&P/F): NR/NR/NR
2007 2008 2009 2010 2011 2012 2013 2014 2015 2016E 2017E 2018E 2019E
Activity Real GDP (% YoY) 8.8 5.6 5.4 6.4 7.9 5.1 7.3 7.0 7.0 6.6 6.0 5.6 5.6 Nominal GDP (TZSbn) 26,770 32,638 37,756 43,571 52,378 61,316 70,953 79,718 90,845 103,745 116,159 130,287 146,086 Nominal GDP (EURbn) 15.7 18.5 20.4 22.8 23.7 30.1 33.0 35.0 38.3 43.2 45.4 44.5 45.9 Nominal GDP ($bn) 21.6 27.2 28.5 30.2 33.0 38.6 43.9 47.9 44.6 47.4 51.9 55.1 58.2 Population (mn) 39.7 40.7 41.8 42.8 43.9 44.9 45.8 46.7 47.7 48.6 49.6 50.6 51.6 GDP per capita ($) 544 668 682 705 752 860 957 1,025 935 975 1,046 1,088 1,129 Gross national saving (% of GDP) 22.6 22.3 18.9 21.8 21.7 19.5 14.9 21.9 24.7 23.0 19.7 19.2 18.8 Stock of bank credit to corporate/household sector (TZSbn) 2,976 4,376 4,806 5,798 7,399 8,722 10,153 12,123 14,111 16,277 17,580 19,689 22,643 Stock of bank credit to corporate/household sector (% of GDP) 11 13 13 13 14 14 14 15 16 16 15 15 15 Loan to deposit ratio (%) 57 71 65 62 67 70 69 70 71 71 70.5 71 71 Prices CPI (average % YoY) 7.0 10.3 12.1 7.2 12.7 16.0 7.9 6.1 5.6 5.2 5.6 6.5 5.8 CPI (year-end % YoY) 6.4 13.5 12.2 5.6 19.8 12.1 5.6 4.8 6.8 5.0 5.4 6.0 5.5 Fiscal balance (% of GDP) General government budget balance* -1.7 -4.5 -6.4 -6.9 -5.0 -5.0 -3.9 -3.0 -3.3 -3.1 -3.4 -4.5 -4.6 Total public debt 21.6 21.6 24.3 27.5 28.0 29.2 30.9 33.8 36.7 37.2 37.4 38.3 39.5 External balance Exports ($bn) 2.2 3.6 3.3 4.3 5.1 5.5 5.5 5.6 5.7 5.4 5.4 5.9 6.5 Imports ($bn) 4.9 7.0 5.8 7.2 9.8 10.5 10.9 11.0 10.4 8.3 9.0 9.8 11.0 Trade balance ($bn) -2.6 -3.4 -2.5 -2.8 -4.7 -5.1 -5.4 -5.4 -4.7 -2.9 -3.6 -3.9 -4.5 Trade balance (% of GDP) -12.2 -12.6 -8.9 -9.4 -14.3 -13.1 -12.3 -11.2 -10.5 -6.1 -6.9 -7.1 -7.7 Current account balance ($bn) -1.7 -2.6 -1.8 -1.9 -4.0 -4.5 -4.7 -4.6 -3.9 -2.2 -2.0 -2.9 -3.5 Current account balance (% of GDP) -7.9 -9.4 -6.3 -6.4 -12.0 -11.7 -10.7 -9.6 -8.7 -4.6 -3.8 -5.3 -5.9 Net FDI ($bn) 0.6 1.2 1.0 1.8 1.3 1.8 2.0 2.0 2.0 2.0 2.0 2.0 2.0 Net FDI (% of GDP) 2.7 4.6 3.3 6.0 4.1 4.7 4.6 4.2 4.5 4.3 3.9 3.6 3.4 Current account balance plus FDI (% of GDP) -5.3 -4.8 -3.0 -0.4 -7.9 -7.0 -6.1 -5.3 -4.2 -0.3 0.1 -1.6 -2.5 Exports (% YoY, value) 16 61 -8 31 18 7 1 2 2 -5 0 9 10 Imports (% YoY, value) 26 44 -17 23 37 7 3 1 -6 -20 8 9 12 Gross official reserves ($bn) 2.7 2.9 3.6 3.9 3.7 4.1 4.5 4.5 4.3 4.5 4.9 5.0 5.0 Import cover (months of merchandise imports) 6.7 4.9 7.3 6.6 4.5 4.6 4.9 4.9 4.9 6.4 6.5 6.1 5.5 Debt indicators Gross external debt ($bn) 5.8 7.0 8.2 9.6 10.4 9.5 11.6 12.9 12.7 14.5 16.0 16.5 17.0 Gross external debt (% of GDP) 27 26 29 32 31 25 27 27 29 31 31 30 29 Gross external debt (% of exports) 263 196 249 223 203 173 211 230 223 269 296 280 262 Total debt service ($bn) 0.4 0.8 -0.2 0.3 0.6 0.2 0.2 0.2 0.2 0.4 0.5 0.6 0.6 Total debt service (% of GDP) 2 3 -1 1 2 1 0 0 1 1 1 1 1 Total debt service (% of exports) 2 2 1 1 2 4 3.6 3.4 4.3 7.7 8.6 9.5 9.2 Interest & exchange rates Broad money supply, M2 (% YoY) 27.2 24.4 20.8 21.8 15.0 16.0 10.9 17.0 10.0 12.0 9 11 14 Credit to the private sector (% YoY) 42.2 47.0 9.8 20.6 27.6 17.9 15.3 19.4 16.4 15.4 8 12 15 3-month interest rate (T-bill year-end %) 9.9 11.2 6.1 5.2 12.6 11.9 13.6 13.2 10.8 7.0 5 7 9 3-month interest rate spread over $-Libor (ppts) 3.9 8.4 5.5 4.5 11.5 11.4 13.1 12.6 10.0 5.6 3.3 4.9 9.0 5Y yield (% year-end) 17.6 16.4 13.5 11.6 13.2 14.9 15.4 14.6 17.5 14.1 14 13.8 13.4 Exchange rate (TZS/EUR) year-end 1,683 1,838 1,920 1,987 2,050 2,091 2,192 2,013 2,214 2,300 2,641 2,887 3,136 Exchange rate (TZS/EUR) annual average 1,701 1,764 1,849 1,914 2,209 2,040 2,148 2,280 2,371 2,399 2,561 2,926 3,185 Exchange rate (TZS/$) year-end 1,154 1,318 1,340 1,484 1,582 1,585 1,590 1,733 2,149 2,181 2,295 2,438 2,579 Exchange rate (TZS/$) annual average 1,241 1,199 1,326 1,442 1,586 1,587 1,617 1,664 2,039 2,187 2,238 2,367 2,509 ,,,
*Fiscal year to 30 June (2000 is FY00/01). Source: IMF, World Bank, national statistics agency, central bank, Renaissance Capital estimates
16
Renaissance Capital 12 April 2018
Africa: Intra-regional trade
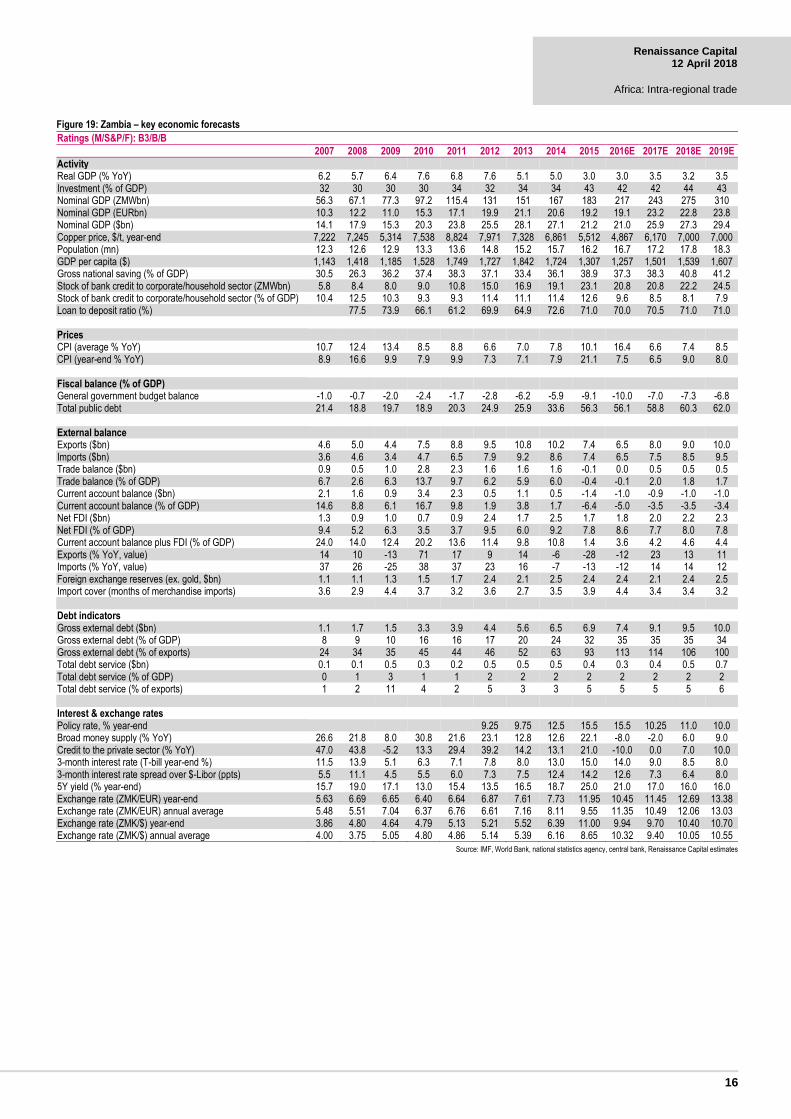
Figure 19: Zambia – key economic forecasts Ratings (M/S&P/F): B3/B/B
2007 2008 2009 2010 2011 2012 2013 2014 2015 2016E 2017E 2018E 2019E
Activity
Real GDP (% YoY) 6.2 5.7 6.4 7.6 6.8 7.6 5.1 5.0 3.0 3.0 3.5 3.2 3.5 Investment (% of GDP) 32 30 30 30 34 32 34 34 43 42 42 44 43 Nominal GDP (ZMWbn) 56.3 67.1 77.3 97.2 115.4 131 151 167 183 217 243 275 310 Nominal GDP (EURbn) 10.3 12.2 11.0 15.3 17.1 19.9 21.1 20.6 19.2 19.1 23.2 22.8 23.8 Nominal GDP ($bn) 14.1 17.9 15.3 20.3 23.8 25.5 28.1 27.1 21.2 21.0 25.9 27.3 29.4 Copper price, $/t, year-end 7,222 7,245 5,314 7,538 8,824 7,971 7,328 6,861 5,512 4,867 6,170 7,000 7,000 Population (mn) 12.3 12.6 12.9 13.3 13.6 14.8 15.2 15.7 16.2 16.7 17.2 17.8 18.3 GDP per capita ($) 1,143 1,418 1,185 1,528 1,749 1,727 1,842 1,724 1,307 1,257 1,501 1,539 1,607 Gross national saving (% of GDP) 30.5 26.3 36.2 37.4 38.3 37.1 33.4 36.1 38.9 37.3 38.3 40.8 41.2 Stock of bank credit to corporate/household sector (ZMWbn) 5.8 8.4 8.0 9.0 10.8 15.0 16.9 19.1 23.1 20.8 20.8 22.2 24.5 Stock of bank credit to corporate/household sector (% of GDP) 10.4 12.5 10.3 9.3 9.3 11.4 11.1 11.4 12.6 9.6 8.5 8.1 7.9 Loan to deposit ratio (%) 77.5 73.9 66.1 61.2 69.9 64.9 72.6 71.0 70.0 70.5 71.0 71.0
Prices
CPI (average % YoY) 10.7 12.4 13.4 8.5 8.8 6.6 7.0 7.8 10.1 16.4 6.6 7.4 8.5 CPI (year-end % YoY) 8.9 16.6 9.9 7.9 9.9 7.3 7.1 7.9 21.1 7.5 6.5 9.0 8.0
Fiscal balance (% of GDP)
General government budget balance -1.0 -0.7 -2.0 -2.4 -1.7 -2.8 -6.2 -5.9 -9.1 -10.0 -7.0 -7.3 -6.8 Total public debt 21.4 18.8 19.7 18.9 20.3 24.9 25.9 33.6 56.3 56.1 58.8 60.3 62.0
External balance
Exports ($bn) 4.6 5.0 4.4 7.5 8.8 9.5 10.8 10.2 7.4 6.5 8.0 9.0 10.0 Imports ($bn) 3.6 4.6 3.4 4.7 6.5 7.9 9.2 8.6 7.4 6.5 7.5 8.5 9.5 Trade balance ($bn) 0.9 0.5 1.0 2.8 2.3 1.6 1.6 1.6 -0.1 0.0 0.5 0.5 0.5 Trade balance (% of GDP) 6.7 2.6 6.3 13.7 9.7 6.2 5.9 6.0 -0.4 -0.1 2.0 1.8 1.7 Current account balance ($bn) 2.1 1.6 0.9 3.4 2.3 0.5 1.1 0.5 -1.4 -1.0 -0.9 -1.0 -1.0 Current account balance (% of GDP) 14.6 8.8 6.1 16.7 9.8 1.9 3.8 1.7 -6.4 -5.0 -3.5 -3.5 -3.4 Net FDI ($bn) 1.3 0.9 1.0 0.7 0.9 2.4 1.7 2.5 1.7 1.8 2.0 2.2 2.3 Net FDI (% of GDP) 9.4 5.2 6.3 3.5 3.7 9.5 6.0 9.2 7.8 8.6 7.7 8.0 7.8 Current account balance plus FDI (% of GDP) 24.0 14.0 12.4 20.2 13.6 11.4 9.8 10.8 1.4 3.6 4.2 4.6 4.4 Exports (% YoY, value) 14 10 -13 71 17 9 14 -6 -28 -12 23 13 11 Imports (% YoY, value) 37 26 -25 38 37 23 16 -7 -13 -12 14 14 12 Foreign exchange reserves (ex. gold, $bn) 1.1 1.1 1.3 1.5 1.7 2.4 2.1 2.5 2.4 2.4 2.1 2.4 2.5 Import cover (months of merchandise imports) 3.6 2.9 4.4 3.7 3.2 3.6 2.7 3.5 3.9 4.4 3.4 3.4 3.2
Debt indicators
Gross external debt ($bn) 1.1 1.7 1.5 3.3 3.9 4.4 5.6 6.5 6.9 7.4 9.1 9.5 10.0 Gross external debt (% of GDP) 8 9 10 16 16 17 20 24 32 35 35 35 34 Gross external debt (% of exports) 24 34 35 45 44 46 52 63 93 113 114 106 100 Total debt service ($bn) 0.1 0.1 0.5 0.3 0.2 0.5 0.5 0.5 0.4 0.3 0.4 0.5 0.7 Total debt service (% of GDP) 0 1 3 1 1 2 2 2 2 2 2 2 2 Total debt service (% of exports) 1 2 11 4 2 5 3 3 5 5 5 5 6
Interest & exchange rates
Policy rate, % year-end 9.25 9.75 12.5 15.5 15.5 10.25 11.0 10.0 Broad money supply (% YoY) 26.6 21.8 8.0 30.8 21.6 23.1 12.8 12.6 22.1 -8.0 -2.0 6.0 9.0 Credit to the private sector (% YoY) 47.0 43.8 -5.2 13.3 29.4 39.2 14.2 13.1 21.0 -10.0 0.0 7.0 10.0 3-month interest rate (T-bill year-end %) 11.5 13.9 5.1 6.3 7.1 7.8 8.0 13.0 15.0 14.0 9.0 8.5 8.0 3-month interest rate spread over $-Libor (ppts) 5.5 11.1 4.5 5.5 6.0 7.3 7.5 12.4 14.2 12.6 7.3 6.4 8.0 5Y yield (% year-end) 15.7 19.0 17.1 13.0 15.4 13.5 16.5 18.7 25.0 21.0 17.0 16.0 16.0 Exchange rate (ZMK/EUR) year-end 5.63 6.69 6.65 6.40 6.64 6.87 7.61 7.73 11.95 10.45 11.45 12.69 13.38 Exchange rate (ZMK/EUR) annual average 5.48 5.51 7.04 6.37 6.76 6.61 7.16 8.11 9.55 11.35 10.49 12.06 13.03 Exchange rate (ZMK/$) year-end 3.86 4.80 4.64 4.79 5.13 5.21 5.52 6.39 11.00 9.94 9.70 10.40 10.70 Exchange rate (ZMK/$) annual average 4.00 3.75 5.05 4.80 4.86 5.14 5.39 6.16 8.65 10.32 9.40 10.05 10.55
Source: IMF, World Bank, national statistics agency, central bank, Renaissance Capital estimates
17
Renaissance Capital 12 April 2018
Africa: Intra-regional trade
Analysts certification
This research report has been prepared by the research analyst(s), whose name(s) appear(s) on the front page of this document, to provide background information about the issuer or issuers (collectively, the “Issuer”) and the securities and markets that are the subject matter of this report. Each research analyst hereby certifies that with respect to the Issuer and such securities and markets, this document has been produced independently of the Issuer and all the views expressed in this document accurately reflect his or her personal views about the Issuer and any and all of such securities and markets. Each research analyst and/or persons connected with any research analyst may have interacted with sales and trading personnel, or similar, for the purpose of gathering, synthesizing and interpreting market information. If the date of this report is not current, the views and contents may not reflect the research analysts’ current thinking.
Each research analyst also certifies that no part of his or her compensation was, or will be, directly or indirectly related to the specific ratings, forecasts, estimates, opinions or views in this research report. Research analysts’ compensation is determined based upon activities and services intended to benefit the investor clients of Renaissance Securities (Cyprus) Limited and any of its affiliates (“Renaissance Capital”). Like all of Renaissance Capital’s employees, research analysts receive compensation that is impacted by overall Renaissance Capital profitability, which includes revenues from other business units within Renaissance Capital.
Important issuer disclosures
Important issuer disclosures outline currently known conflicts of interest that may unknowingly bias or affect the objectivity of the analyst(s) with respect to an issuer that is the subject matter of this report. Disclosure(s) apply to Renaissance Securities (Cyprus) Limited or any of its direct or indirect subsidiaries or affiliates (which are individually or collectively referred to as “Renaissance Capital”) with respect to any issuer or the issuer’s securities.
A complete set of disclosure statements associated with the issuers discussed in this Report is available using the ‘Stock Finder’ or ‘Bond Finder’ for individual issuers on the Renaissance Capital Research Portal at: http://research.rencap.com/eng/default.asp
Investment ratings
Investment ratings may be determined by the following standard ranges: Buy (expected total return of 15% or more); Hold (expected total return of 0-15%); and Sell (expected negative total return). Standard ranges do not always apply to emerging markets securities and ratings may be assigned on the basis of the research analyst’s knowledge of the securities.
Investment ratings are a function of the research analyst’s expectation of total return on equity (forecast price appreciation and dividend yield within the next 12 months, unless stated otherwise in the report). Investment ratings are determined at the time of initiation of coverage of an issuer of equity securities or a change in target price of any of the issuer’s equity securities. At other times, the expected total returns may fall outside of the range used at the time of setting a rating because of price movement and/or volatility. Such interim deviations will be permitted but will be subject to review by Renaissance Capital’s Research Management.
Where the relevant issuer has a significant material event with further information pending or to be announced, it may be necessary to temporarily place the investment rating Under Review. This does not revise the previously published rating, but indicates that the analyst is actively reviewing the investment rating or waiting for sufficient information to re-evaluate the analyst’s expectation of total return on equity.
Where coverage of the relevant issuer is due to be maintained by a new analyst, on a temporary basis the relevant issuer will be rated as Coverage in Transition. Previously published investment ratings should not be relied upon as they may not reflect the new analysts’ current expectations of total return. While rated as Coverage in Transition, Renaissance Capital may not always be able to keep you informed of events or provide background information relating to the issuer.
If issuing of research is restricted due to legal, regulatory or contractual obligations publishing investment ratings will be Restricted. Previously published investment ratings should not be relied upon as they may no longer reflect the analysts’ current expectations of total return. While restricted, the analyst may not always be able to keep you informed of events or provide background information relating to the issuer.
Where Renaissance Capital has neither reviewed nor revised its investment ratings on the relevant issuer for a period of 180 calendar days, coverage shall be discontinued.
Where Renaissance Capital has not provided coverage of an issuer for a period of 365 calendar days, coverage shall be discontinued.
Where Renaissance Capital has not expressed a commitment to provide continuous coverage and/or an expectation of total return, to keep you informed, analysts may prepare reports covering significant events or background information without an investment rating (Not Covered).
Your decision to buy or sell a security should be based upon your personal investment objectives and should be made only after evaluating the security’s expected performance and risk.
Renaissance Capital reserves the right to update or amend its investment ratings in any way and at any time it determines.
Disclosures appendix
18
Renaissance Capital 12 April 2018
Africa: Intra-regional trade
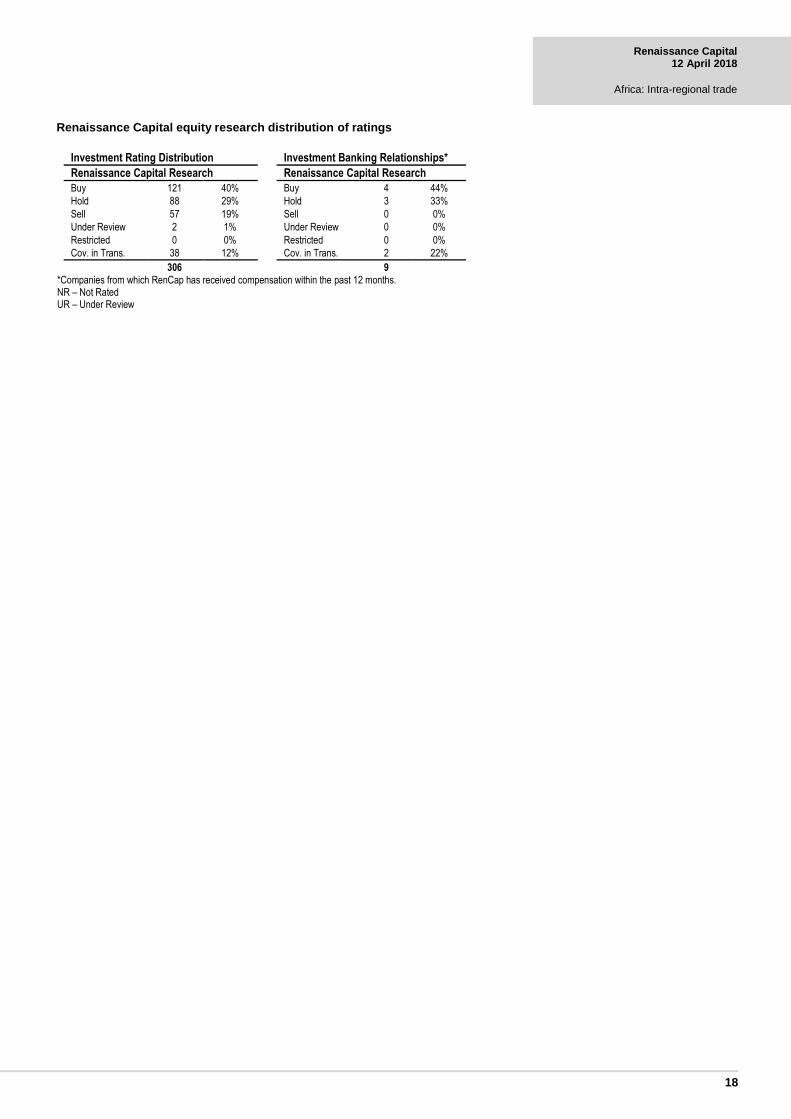
Renaissance Capital equity research distribution of ratings
Investment Rating Distribution Investment Banking Relationships*
Renaissance Capital Research Renaissance Capital Research
Buy 121 40% Buy 4 44%
Hold 88 29% Hold 3 33%
Sell 57 19% Sell 0 0%
Under Review 2 1% Under Review 0 0%
Restricted 0 0% Restricted 0 0%
Cov. in Trans. 38 12% Cov. in Trans. 2 22%
306 9
*Companies from which RenCap has received compensation within the past 12 months. NR – Not Rated UR – Under Review
Renaissance Capital research team
Head of Research – Eurasia Daniel Salter +44 (207) 005-7824 [email protected]
Head of Research – Africa Johann Pretorius +27 (11) 750-1450 [email protected]
Head of Research – Sub-Saharan Africa Yvonne Mhango +27 (11) 750-1488 [email protected]
Name Telephone number Coverage Name Telephone number Coverage
Macro Oil & Gas
Charles Robertson +44 (207) 005-7835 Global Alexander Burgansky +44 (207) 005-7982 Russia/CIS, Africa
Yvonne Mhango +27 (11) 750-1488 Sub-Saharan Africa Temilade Aduroja +234 (1) 448-5300 x5363 Sub-Saharan Africa
Oleg Kouzmin +7 (495) 258-7770 x4506 Russia/CIS Oleg Chistyukhin +7 (495) 258-7770 x4073 Russia/CIS
Equity Strategy Metals & Mining
Daniel Salter +44 (207) 005-7824 Global Johann Pretorius +27 (11) 750-1450 South Africa
Charles Robertson +44 (207) 005-7835 Global Steven Friedman +27 (11) 750-1481 South Africa
Vikram Lopez +44 (207) 005-7974 Global Kabelo Moshesha +27 (11) 750-1472 South Africa
Siphelele Mhlongo +27 (11) 750-1420 South Africa
Fixed Income Strategy Derick Deale +27 (11) 750-1458 South Africa
Gregory Smith +44 (207) 005-7761 Frontier/Emerging Markets
Oleg Kouzmin +7 (495) 258-7770 x4506 Russia/CIS Telecoms/Transportation
Alexander Kazbegi +41 (78) 883-4527 Global
Financials Artem Yamschikov +7 (495) 258-7770 x7511 Russia/CIS
Ilan Stermer +27 (11) 750-1482 South Africa Mikhail Arbuzov +7 (495) 258-7770 x4594 Russia/CIS
Phago Rakale +27 (11) 750-1498 South Africa
Francois Du Toit +27 (11) 750-1162 South Africa Real Estate
Olamipo Ogunsanya +234 (1) 448-5300 x5368 Sub-Saharan Africa David Ferguson +7 (495) 641-4189 Russia/CIS, Africa
Metin Esendal +44 (207) 005-7925 Europe Kirill Panarin +7 (495) 258-7770 x4009 Russia/CIS, Africa
Oluwatoyosi Oni +234 (1) 448-5300 x5356 Sub-Saharan Africa Vladislav Petrukhin +7 (495) 258-7770 x7549 Russia/CIS, Africa
Consumer/Retail/Agriculture Media/Technology
David Ferguson +7 (495) 641-4189 Russia/CIS, Africa David Ferguson +7 (495) 641-4189 Russia/CIS, Africa
Kirill Panarin +7 (495) 258-7770 x4009 Russia/CIS, Africa Kirill Panarin +7 (495) 258-7770 x4009 Russia/CIS, Africa
Vladislav Petrukhin +7 (495) 258-7770 x7549 Russia/CIS, Africa Vladislav Petrukhin +7 (495) 258-7770 x7549 Russia/CIS, Africa
Zaheer Joosub +27 (11) 750-1427 South Africa
Adedayo Ayeni +234 (1) 448-5390 Sub-Saharan Africa Healthcare
Robyn Collins +27 (11) 750-1480 South Africa Robyn Collins +27 (11) 750-1480 South Africa
Metin Esendal +44 (207) 005-7925 Turkey Alexander Kazbegi +41 (78) 883-4527 Georgia
Metin Esendal +44 (207) 005-7925 Turkey
Diversified/Industrials
Brent Madel +27 (11) 750-1160 South Africa Materials
Metin Esendal +44 (207) 005-7925 Turkey Temilade Aduroja +234 (1) 448-5300 x5363 Sub-Saharan Africa
Renaissance Capital research is available via the following platforms: Renaissance research portal: research.rencap.com Bloomberg: RENA <GO> Capital IQ: www.capitaliq.com
Thomson Reuters: thomsonreuters.com/financial Factset: www.factset.com
Renaissance Capital Moscow T + 7 (495) 258-7777
Renaissance Capital Ltd. London T + 44 (203) 379-7777
Renaissance Capital Johannesburg T +27 (11) 750-1400
Renaissance Securities (Cyprus) Ltd. Nicosia T + 357 (22) 505-800
Renaissance Securities (Nigeria) Ltd. Lagos T +234 (1) 448-5300
Renaissance Capital Nairobi T +254 (20) 368-2000
Renaissance Capital Dubai T +971 (4) 409-2000
Renaissance Capital Cape Town T +27 (11) 750-1164
© 2018 Renaissance Securities (Cyprus) Limited, an indirect subsidiary of Renaissance Financial Holdings Limited ("Renaissance Capital"), which together with other subsidiaries operates outside of the USA under the brand name of Renaissance Capital, for contact details see Bloomberg page RENA, or contact the relevant office. All rights reserved. This document and/or information has been prepared by and, except as otherwise specified herein, is communicated by Renaissance Securities (Cyprus) Limited, regulated by the Cyprus Securities and Exchange Commission (License No: KEPEY 053/04). The RenCap-NES Leading GDP Indicator is a model that seeks to forecast GDP growth and was developed by and is the exclusive property of Renaissance Capital and the New Economic School (e-mail: [email protected]).
This document is for information purposes only. The information presented herein does not comprise a prospectus of securities for the purposes of EU Directive 2003/71/EC or Federal Law No. 39-FZ of 22 April 1994 (as amended) of the Russian Federation "On the Securities Market". Any decision to purchase securities in any proposed offering should be made solely on the basis of the information to be contained in the final prospectus published in relation to such offering. This document does not form a fiduciary relationship or constitute advice and is not and should not be construed as an offer, or a solicitation of an offer, or an invitation or inducement to engage in investment activity, and cannot be relied upon as a representation that any particular transaction necessarily could have been or can be effected at the stated price. This document is not an advertisement of securities. Opinions expressed herein may differ or be contrary to opinions expressed by other business areas or groups of Renaissance Capital as a result of using different assumptions and criteria. All such information and opinions are subject to change without notice, and neither Renaissance Capital nor any of its subsidiaries or affiliates is under any obligation to update or keep current the information contained herein or in any other medium.
Descriptions of any company or companies or their securities or the markets or developments mentioned herein are not intended to be complete. This document and/or information should not be regarded by recipients as a substitute for the exercise of their own judgment as the information has no regard to the specific investment objectives, financial situation or particular needs of any specific recipient. The application of taxation laws depends on an investor’s individual circumstances and, accordingly, each investor should seek independent professional advice on taxation implications before making any investment decision. The information and opinions herein have been compiled or arrived at based on information obtained from sources believed to be reliable and in good faith. Such information has not been independently verified, is provided on an ‘as is’ basis and no representation or warranty, either expressed or implied, is provided in relation to the accuracy, completeness, reliability, merchantability or fitness for a particular purpose of such information and opinions, except with respect to information concerning Renaissance Capital, its subsidiaries and affiliates. All statements of opinion and all projections, forecasts, or statements relating to expectations regarding future events or the possible future performance of investments represent Renaissance Capital’s own assessment and interpretation of information available to them currently.
The securities described herein may not be eligible for sale in all jurisdictions or to certain categories of investors. Options, derivative products and futures are not suitable for all investors and trading in these instruments is considered risky. Past performance is not necessarily indicative of future results. The value of investments may fall as well as rise and the investor may not get back the amount initially invested. Some investments may not be readily realisable since the market in the securities is illiquid or there is no secondary market for the investor’s interest and therefore valuing the investment and identifying the risk to which the investor is exposed may be difficult to quantify. Investments in illiquid securities involve a high degree of risk and are suitable only for sophisticated investors who can tolerate such risk and do not require an investment easily and quickly converted into cash. Foreign-currency-denominated securities are subject to fluctuations in exchange rates that could have an adverse effect on the value or the price of, or income derived from, the investment. Other risk factors affecting the price, value or income of an investment include but are not necessarily limited to political risks, economic risks, credit risks, and market risks. Investing in emerging markets such as Russia, other CIS, African or Asian countries and emerging markets securities involves a high degree of risk and investors should perform their own due diligence before investing.
Excluding significant beneficial ownership of securities where Renaissance Capital has expressed a commitment to provide continuous coverage in relation to an issuer or an issuer’s securities, Renaissance Capital and its affiliates, their directors, representatives, employees (excluding the US broker-dealer unless specifically disclosed), or clients may have or have had interests in the securities of issuers described in the Investment Research or long or short positions in any of the securities mentioned in the Investment Research or other related financial instruments at any time and may make a purchase and/or sale, or offer to make a purchase and/or sale, of any such securities or other financial instruments from time to time in the open market or otherwise, in each case as principals or as agents. Where Renaissance Capital has not expressed a commitment to provide continuous coverage in relation to an issuer or an issuer’s securities, Renaissance Capital and its affiliates (excluding the US broker-dealer unless specifically disclosed) may act or have acted as market maker in the securities or other financial instruments described in the Investment Research, or in securities underlying or related to such securities. Employees of Renaissance Capital or its affiliates may serve or have served as officers or directors of the relevant companies. Renaissance Capital and its affiliates may have or have had a relationship with or provide or have provided investment banking, capital markets, advisory, investment management, and/or other financial services to the relevant companies, and have established and maintain information barriers, such as ‘Chinese Walls’, to control the flow of information contained in one or more areas of Renaissance Capital, into other areas, units, groups or affiliates of the Firm.
The information herein is not intended for distribution to the public and may not be reproduced, redistributed
or published, in whole or in part, for any purpose without the written permission of Renaissance Capital, and neither Renaissance Capital nor any of its affiliates accepts any liability whatsoever for the actions of third parties in this respect. This information may not be used to create any financial instruments or products or any indices. Neither Renaissance Capital and its affiliates, nor their directors, representatives, or employees accept any liability for any direct or consequential loss or damage arising out of the use of all or any part of the information herein
Bermuda: Neither the Bermuda Monetary Authority nor the Registrar of Companies of Bermuda has approved the contents of this document and any statement to the contrary, express or otherwise, would constitute a material misstatement and an offence.
EEA States: Distributed by Renaissance Securities (Cyprus) Limited, regulated by Cyprus Securities and Exchange Commission, or Renaissance Capital Limited, member of the London Stock Exchange and regulated in the UK by the Financial Conduct Authority (“FCA”) in relation to designated investment business (as detailed in the FCA rules).
Cyprus: Except as otherwise specified herein the information herein is not intended for, and should not be relied upon by, retail clients of Renaissance Securities (Cyprus) Limited. The Cyprus Securities and Exchange Commission Investor Compensation Fund is available where Renaissance Securities (Cyprus) Limited is unable to meet its liabilities to its retail clients, as specified in the Customer Documents Pack.
UAE: Approved for distribution in the Dubai International Financial Centre by Renaissance Capital (Dubai) Ltd which is regulated by the Dubai Financial Services Authority (“DFSA”). Material is intended only for persons who meet the criteria for Professional Clients under the Rules of the DFSA and no other person should act upon it.
United Kingdom: Approved and distributed by Renaissance Capital Limited only to persons who are eligible counterparties or professional clients (as detailed in the FCA Rules). The information herein does not apply to, and should not be relied upon by, retail clients; neither the FCA’s protection rules nor compensation scheme may be applied.
Kenya: Distributed by Renaissance Capital (Kenya) Limited, regulated by the Capital Markets Authority.
Nigeria: Distributed by RenCap Securities (Nigeria) Limited, authorised dealing member of The Nigerian Stock Exchange, or Renaissance Securities (Nigeria) Limited, entities regulated by the Securities and Exchange Commission.
Russia: Distributed by Renaissance Broker Limited or Renaissance Online Limited, entities regulated by the Bank of Russia.
South Africa: Distributed by Rencap Securities (Proprietary) Limited, an authorised Financial Services Provider and member of the JSE Limited. The information contained herein is intended for Institutional investors only.
Turkey: Distributed by Renaissance Capital Menkul Degerler A.S. - Warning Note Published Pursuant to the “Communiqué on Principles Regarding Investment Services, Activities and Ancillary Services” by the Capital Markets Board: “The investment information, comments and advices given herein are not part of investment advisory activity. Investment advisory services are provided by authorized institutions to persons and entities privately by considering their risk and return preferences. Whereas the comments and advices included herein are of general nature. Therefore, they may not fit to your financial situation and risk and return preferences. For this reason, making an investment decision only by relying on the information given herein may not give rise to results that fit your expectations.”
United States: Distributed in the United States by RenCap Securities, Inc., member of FINRA and SIPC, or by a non-US subsidiary or affiliate of Renaissance Financial Holdings Limited that is not registered as a US broker-dealer (a "non-US affiliate"), to major US institutional investors only. RenCap Securities, Inc. accepts responsibility for the content of a research report prepared by another non-US affiliate when distributed to US persons by RenCap Securities, Inc. Although it has accepted responsibility for the content of this research report when distributed to US investors, RenCap Securities, Inc. did not contribute to the preparation of this report and the analysts authoring this are not employed by, and are not associated persons of, RenCap Securities, Inc. Among other things, this means that the entity issuing this report and the analysts authoring this report are not subject to all the disclosures and other US regulatory requirements to which RenCap Securities, Inc. and its employees and associated persons are subject. Any US person receiving this report who wishes to effect transactions in any securities referred to herein should contact RenCap Securities, Inc., not its non-US affiliate. RenCap Securities, Inc. is a subsidiary of Renaissance Financial Holdings Limited and forms a part of a group of companies operating outside of the United States as "Renaissance Capital." Contact: RenCap Securities, Inc., 780 Third Avenue, 20th Floor, New York, New York 10017, Telephone: +1 (212) 824-1099.
Other distribution: The distribution of this document in other jurisdictions may be restricted by law and persons into whose possession this document comes should inform themselves about, and observe, any such restriction.
Additional information (including information about the RenCap-NES Leading GDP Indicator) and supporting documentation is available upon request.
Renaissance Capital equity research disclosures (SA stocks)