working paper 198 - can intra-regional trade act as a
TRANSCRIPT

Can Intra-Regional Trade Act as a Global Shock Absorber in Africa?
Mthuli Ncube, Zuzana Brixiova, and Qingwei Meng
No 198– February, 2014

Correct citation: Ncube, M.; Brixiova, Z.; and Meng, Q. (2014), Can Intra-Regional Trade Act as a Global Shock
Absorber in Africa?, Working Paper Series N° 198 African Development Bank, Tunis, Tunisia.
Steve Kayizzi-Mugerwa (Chair) Anyanwu, John C. Faye, Issa Ngaruko, Floribert Shimeles, Abebe Salami, Adeleke Verdier-Chouchane, Audrey
Coordinator
Working Papers are available online at
http:/www.afdb.org/
Copyright © 2014
African Development Bank
Angle de l’avenue du Ghana et des rues Pierre de
Coubertin et Hédi Nouira
BP 323 -1002 Tunis Belvédère (Tunisia)
Tel: +216 71 333 511
Fax: +216 71 351 933
E-mail: [email protected]
Salami, Adeleke
Editorial Committee Rights and Permissions
All rights reserved.
The text and data in this publication may be
reproduced as long as the source is cited.
Reproduction for commercial purposes is
forbidden.
The Working Paper Series (WPS) is produced by
the Development Research Department of the
African Development Bank. The WPS disseminates
the findings of work in progress, preliminary
research results, and development experience and
lessons, to encourage the exchange of ideas and
innovative thinking among researchers,
development practitioners, policy makers, and
donors. The findings, interpretations, and
conclusions expressed in the Bank’s WPS are
entirely those of the author(s) and do not
necessarily represent the view of the African
Development Bank, its Board of Directors, or the
countries they represent.

Can Intra-Regional Trade Act as a Global Shock Absorber
in Africa?
Mthuli Ncube1, Zuzana Brixiova2 , Qingwei Meng3 4
1 The Chief Economist and Vice President of the African Development Bank. E-mail: [email protected]
2 Advisor to the Chief Economist and Vice President of the African Development Bank. E-mail: [email protected]
3 Research Economist in the African Development Bank. E-mail: [email protected]
4 The authors are grateful to Zorobabel Bicaba, Daniel Gurara, Basil Jones, Albert Mafusire, Andreas Wörgötter, and an
anonymous reviewer for helpful comments that improved the paper. Views expressed are those of the authors and do not necessarily reflect those of the African Development Bank.
AFRICAN DEVELOPMENT BANK GROUP
Working Paper No. 198
February 2014
Office of the Chief Economist

ABSTRACT The global financial crisis has
reiterated the need for Africa to
build resilience to global output
shocks. In this paper we examine
empirically the role of intra-regional
and intra-African trade linkages in
being an absorber of the global
output shocks in two African
regional economic communities. We
find that deeper intra-regional and
intra-African trade ties have helped
the East African Community (EAC)
absorb the global output shocks. In
contrast, the Southern Africa
Custom Union (SACU) region has
been less able to cope with global
output shocks partly due to weaker
regional integration. Intra-regional
and intra-African trade with fast-
growing economies, together with
geographically diversified trade
linkages, can strengthen the
capacity to absorb global shocks.
Key words: Intra-regional trade; output co-movement; regional economic communities, Africa JEL classification: E32; F42; F15; C53

5
1. Introduction The recent global financial crisis has brought about renewed emphasis on the links of African countries with the global economy, both individually and collectively, via regional economic communities (RECs). On balance, Africa has exhibited resilience during the global financial crisis. Still, differences emerged across countries and Africa’s regions, with RECs showing different degrees of output co-movements with the global economy.5 This paper examines the role that intra-regional and intra-African trade can play in explaining such differences in output co-movements and in protecting African countries from global output shocks. It focuses on the East African Community (EAC) and the Southern Africa Customs Union (SACU) because of different patterns of trade and growth that these RECs exhibited. This paper seeks to answer the following questions: Can intra-regional trade help explain the differences in output co-movements between African countries/regions and advanced economies? How can African countries and regions mitigate the impact of global output shocks through regional integration? With rising frequency of global output shocks, answering these questions is of great importance to policymakers in Africa and elsewhere. Except for South Africa, the output shock transmission from the global economy to Africa, and especially its RECs, has been relatively understudied.6 The recent research on the global shock spillovers to Africa during and after the global financial crisis includes Drummond and Ramirez (2009), Gurara and Ncube (2013); and Tapsoba and Diallo (2014). This paper adds to this stream of literature by examining the impact of global output shocks on Africa’s RECs with a structural vector autoregressive (SVAR) model utilizing real GDP data, as in Kim and Chow (2003), Brixiova et al. (2010) and others.7 The links of output shock synchronization and intra-regional trade are tested by regressing output co-movements on pair-wise trade linkages, including intra-industry trade as in Calderon et al. (2009) and IMF (2013).
We found that the deeper intra-regional trade in the EAC region as well as the EAC region’s trade links with the rest of Africa have increased the community’s resilience to global output shocks. However, the SACU region proved less immune to such shocks. This can be in part explained by South Africa’s developed financial system which facilitated heavy exposure to global shocks also via financial linkages, as evidenced by capital outflows that the country experienced. In turn, the small SACU members were exposed to global output shocks both directly through their trade linkages with Europe and through their trade with South Africa.8 The policy implications from our analysis nuance the common recommendation of promoting regional integration in Africa to build resilience. While intra-regional trade can help build resilience, this is not an automatic result. To benefit from regional integration in the presence of global shocks, countries need to diversify their geographical composition of trade to include fast growing economies, both in Africa and other regions.
5 As other developing economies, African countries experienced a notable increase in output co-movements with advanced economies
during the global financial crisis. However, the degree of this co-movement differed across countries and sub-regions, and was, in particular, much higher for the SACU than the EAC economies. 6 Ҫakir and Kabundi (2011), de Waal (2013), Ncube and Ndou (2013) studied this transmission to South Africa.
7 To our knowledge, this approach, relying on output data, has not been applied to Africa’s RECs. The advantage of output data is their
timeliness and quality, which is comparable to those in other developing regions (AfDB, 2013). Research investigating shock synchronization within Africa’s RECs frequently relies on the SVAR model with decomposition as in Blanchard and Quah (1989). Bayoumi and Eichengreen (1993) applied this identification scheme to the optimal currency area theory. Mafusire and Brixiova (2013), among others, utilized this approach in the context of the EAC convergence and readiness for monetary union. 8 African exports are vulnerable to banking crises in the countries they export to (Berman and Martin, 2012).

6
The rest of the paper is organized as follows: Section 2 reviews the literature while Section 3 outlines key stylized facts on growth. Section 4 carries out the empirical investigation of Africa’s resilience to global output shocks. Section 5 concludes with policy recommendations.
2. A Review of the Literature This paper builds on two streams of literature. The first is the literature on output co-movements between the global economy and Africa, with the global economy encompassing both the advanced economies and the BRICs. The transmission mechanisms of global output shocks to Africa, and especially its RECs, are relatively understudied. Existing empirical findings on this important topic are following. First, utilizing panel regressions of growth of the domestic real GDP per capita on growth in the USA, Japan and the EU, IMF (2007) found that one percentage point decrease in growth in the EU (US) leads to 0.25 (0.1) percentage point decline in growth in Sub-Saharan Africa. Second, trade linkages were viewed as key for transmission. Linking domestic growth with that of the trading partners, Ndulu and O’Connell (2007) showed that 1 percentage increase in growth of real GDP of trading partners leads to 0.4 increase in the domestic real GDP growth.9 Third, one percentage increase in real GDP growth in Eurozone (BRICs) would lead to 0.34 – 0.6 increase in Africa (0.09 – 0.23 percentage point in Africa) (Gurara and Ncube, 2013). Finally, Diallo and Tapsoba (2014) demonstrated that sub-Saharan Africa’s business cycle has been shifting from EU to BRICs. Regarding drivers of output shock (e.g., the business cycle) synchronization, trade integration, together with financial linkages, has emerged as one of the key factors in the earlier literature.10 The second stream of literature we build on is therefore the literature linking trade and growth that shows that business cycles are more synchronized between countries that have substantial bilateral trade. More specifically, the empirical literature provides ample evidence that higher trade integration leads to more synchronized business cycles in the advanced economies, starting with the pioneering work of Frankel and Rose (1997) and elaborated in Clark and van Wincoop (2001), Gruben et al. (2002), Imbs (2004) and others. Calderon et al. (2007) found positive and statistically significant impact of the trade intensity on the output shock synchronization also among developing countries, but smaller than that among the advanced economies.11 In turn, Tapsoba (2010) showed that trade intensity increased the business cycle synchronization also in Africa, but again less so than in advanced economies. The differences in the impact of trade on output shock synchronization can be explained by patterns of output specialization and bilateral trade (Calderon et al., 2007). This literature builds on earlier work of Krugman (1991) who found that business cycles can be more synchronized among countries with similar production structures. Frankel and Rose (1997) and Fidrmuc (2004) demonstrated that intra-industry trade leads to greater output shock synchronization, while Kose and Yi (2001) demonstrated the role of vertical integration. The objective of this paper is two-fold. The first goal is to examine the output shock synchronization between Africa’s RECs on the one hand and the advanced economies on the
9 Similarly, according to Drummond and Ramirez (2009), one percentage point decrease in growth in the ‘rest of the world’ leads to 0.4
percentage point decrease in Africa. 10
Other factors include common perceptions/shifts in business sentiments (IMF, 2013). Theoretical underpinnings to linking the business cycle synchronization to that of trade intensity can be found in Stockmann (1988) who decomposed growth in a country to (i) aggregate shocks and (ii) sector-specific shocks. 11
The authors use data for 147 developing countries during the period 1960 – 1999.

7
other. The second goal is to study the determinants of this synchronization and in particular the relationship between output shock co-movements and bilateral (intra-industry) trade in member countries within RECs. This will help determine if and how intra-regional – and intra-industry – trade in Africa facilitates output shock synchronization.
3. Stylized Facts
3.1. Growth Patterns Since the early 2000s, Africa has posted rapid growth. Moreover, its growth was broad-based, with more than 60 percent of countries having grown on average at 4 or more percent a year. Still, substantial differences in growth patterns prevail across countries and regions. With the EAC region containing some of the fastest growing countries in the world, its growth was both faster and less volatile than that of the SACU region in the past three decades (Table 1). This growth acceleration reflected benign external conditions as well as improved macroeconomic management and business environment. Unlike the fast growing EAC, the SACU countries have been characterized by a low growth and high inequality. Unemployment, especially among youth, income inequality, and widespread poverty, is a key challenge for these middle income countries.12 Table 1. Real GDP Growth and Volatility: Africa, EAC, SACU and Advanced Economies
1981 - 90 1991 - 2000 2001 - 07
2008 - 10
2011 - 12
EAC - growth 3.9 2.6 6.1 5.5 5.4
relative SD 0.40 0.72 0.19 … …
SACU - growth 1.7 2.0 4.4 1.8 3.1
relative SD 1.47 1.00 0.29 … …
SSA - growth 2.4 2.0 6.2 4.7 5.2
relative SD 0.91 0.85 0.16 … …
Advanced Ec.- growth 3.3 2.9 2.4 -0.1 1.6
relative SD 0.42 0.30 0.29 … … Source: Authors’ calculations based on IMF WEO (December 2013) database. Note: Advanced economies are defined as in the IMF WEO database. SD stands for standard deviation. Growth (relative standard deviation) is calculated as average of annual growth rates (annual relative standard deviations) over a given period.
During the global financial crisis, the EAC region’s limited financial integration into global markets protected it from direct financial shocks. The impact of indirect financial channels was subdued, as the EAC banks tend to fund their loans from deposits. The crisis was thus transmitted mostly through trade and in some cases also foreign investment, aid, remittances and tourism receipts (Brixiova and Ndikumana, 2013).13 In contrast, South Africa, which is closely integrated into the global financial system, was impacted through both financial and trade channels (Ncube et al., 2012a and 2012b; Ncube and Ndou, 2013). In turn, the crisis was transmitted to the small SACU members via trade with South Africa and EU.
12
Despite the EAC’s overall high growth, a closer look reveals notable differences among members at any point of time and in individual countries over time. Countries that were pulling the sub-region’s growth rate down in the 1980s and the early 1990s were leading it from mid-1990s on (e.g., Rwanda, as it emerged from conflict). 13
The impact of falling import demand can be amplified by disruptions in trade finance, in particular in low income countries with less developed financial sector (Berman and Martin, 2012; Turner et. al., 2011).

8
The negative impact of the global financial crisis on growth was notable in both the EAC and the SACU regions in 2009, but both sub-regions have recovered fast. In the EAC region, the strong fundamentals and buffers established prior to the crisis facilitated, through counter-cyclical policies and public investment, this fast growth revival. High growth and timely recovery during this global recession is in sharp contrast with the 1991 crisis, when the EAC region grew less than the world economy and recovered with significant delay (Figure 1). Figure 1. Real GDP Growth around the Past Two Global Crises Figure 1a. Real GDP growth, 1989 - 94 Figure 1b. Real GDP growth, 2007 - 12
Source: Authors’ calculations based on IMF WEO (December 2013) database.
3.2. Output Co-movements
Output co-movement between the advanced economies and Africa’s RECs and countries reflect the degree of shock synchronization between these groups of countries. These co-movements could be induced either by large common (global) shocks affecting simultaneously advanced and African countries or spill-overs of country specific shocks in advanced economies to Africa (IMF, 2013). As in other developing countries, the co-movement of the EAC and the SACU regions with advanced economies rose during the financial crisis, but markedly more so in the SACU than the EAC region (Figure 2). The chart below also captures the decisive role of South Africa within the SACU group. Looking at individual countries reveals that growth rates of the individual EAC members were correlated with growth of the EAC region. The real GDP growth rates of Kenya, Rwanda, Tanzania, Uganda and the EAC exhibited co-movements with those of Africa. With the exception of the crisis period, the co-movements of the growth rates of the EAC countries with the global economy are weak and in some cases negative, suggesting overall low shock synchronization between the advanced economies and the EAC (Table A1, Annex I). Except for South Africa which accounts for most of the SACU’s output, the co-movements of growth of the SACU members with the SACU region are weaker than in the EAC.14 The SACU is highly correlated with Africa, reflecting the important economic role played by South
14
Only correlation between South Africa and the SACU are statistically significant, reflecting South Africa’s economic weight in the customs union.
-4.0
-2.0
0.0
2.0
4.0
6.0
8.0
1989 1990 1991 1992 1993 1994
per
cen
t
EAC SACU
SSA Advanced
-4.0
-2.0
0.0
2.0
4.0
6.0
8.0
2007 2008 2009 2010 2011 2012
per
cen
t
EAC SACU
SSA Advanced

9
Africa on the continent. In turn, growth rates of the SACU countries are more closely than EAC’s growth rates associated with those of advanced economies (Table A1, Annex I). Figure 2. The Evolution of Output Co-movements, 1990 - 2011
Source: Authors’ calculations based on IMF WEO (December 2013) database. Note: This co-movement is measured by correlations of growth rates, as in IMF (2013).
3.3. Structural Similarity
Countries’ structural characteristics impact their responses to shocks. Structural similarity facilitates shock synchronization, i.e. common shocks would impact countries with similar output structures in similarly ways. In this section we examine the degree of structural similarity between the EAC and the SACU regions and advanced economies, as well as that of individual countries and their RECs. Shocks in RECs may not be synchronized due to asymmetric, country-specific shocks and/or differences in the transmission mechanisms of common shocks. Structural similarity reduces the impact of these factors.15
a. Structural Similarity Measured by the Value Added
The similarity of production of the individual member states with the structure of the regional economic block is measured by the Bray-Curtis index. The index, which takes values between [0, 1], is a distance metric where lower values indicate a greater structural similarity of outputs
between countries and regions. Denoting ijtx to be the share of sector i in the total value
added of country j in year t, itX to be the share of sector i in the total value added of the
regional bloc, and N as the total number of sector, the index is described as:16
15
Understanding of the degree of shock synchronization with their RECs is important for the small REC members (e.g., all the SACU countries but South Africa and Burundi and Rwanda in the EAC). Where synchronization is weak, the countries can mitigate shocks via fiscal transfers or flexible labor markets.
16 Alternatively, ijtx can be interpreted as the share of sector i in the total value added of the regional bloc and itX as the share of sector
i in the total value added of the SSA or the group of advanced economies. For comparing the structural similarity of the EAC and SACU
blocs with that of the advanced economies, ijtx can be interpreted as the share of sector i in the total value added of the regional bloc and
itX as the share of sector i in the total value added of the group of advanced economies.
-0.1
0
0.1
0.2
0.3
0.4
0.5
0.6
0.7
0.8
0.9
1990-99 2000-07 2008-11
Africa EAC SACU

10
N
i
itijt
N
i
itijt
jkt
Xx
Xx
d
1
1)1(
According to this index the EAC countries have output structures closer to their bloc than the SACU countries, with South Africa accounting for most of the region while the other economies are less developed and have different structures. In both RECs, countries’ output structures have been converging to that of the group (Figure 3a). As the SACU, which consists of middle income countries and where South Africa prevails, is more developed than the EAC low income countries, its output structure is closer than the ECA’s to structure of the advanced economies (Figure 3b). The distance between the EAC’s output structure and that of the advanced economies has remained mostly unchanged over the past three decades. Figure 3. Bray-Curtis Structural Similarity Index for Output, 1980 - 2012 3a. Individual Countries and RECs 3b. RECs and Advanced Economies
Source: Authors’ calculations based on the UN national accounts database.
b. Structural Similarity Measured by Intra-Industry Trade
Intra-industry trade flows are measured using Grubel-Lloyd index, which is derived in detail in Grubel and Lloyd (1971) and defined as follows:
100)2(
9
09
0
i
i
ijktijkt
ijktijkt
ijktijkt
ijktijktijktijkt
jkt
MX
MX
MX
MXMXIIT
where IIT represents the intra-industry index; ijktX and ijktM represent, respectively, country j’s
exports and imports of product class i to and from country k in year t. The ratio takes the minimum value of zero if there is no intra-industry trade and the maximum value of 100 if
0.00
0.05
0.10
0.15
0.20
0.25
0.30
0.35
0.40
1980
1982
1984
1986
1988
1990
1992
1994
1996
1998
2000
2002
2004
2006
2008
2010
2012
0.00
0.05
0.10
0.15
0.20
0.25
0.30
0.35
0.40
1980
1982
1984
1986
1988
1990
1992
1994
1996
1998
2000
2002
2004
2006
2008
2010
2012
EAC SACU

11
there is only intra-industry trade.17 The overall bilateral index of intra-industry trade between countries j and k is a weighted average of the indices for all product classes in which the shares of total trade of product i over total commodity trade is used as weights. The intra-industry trade has remained relatively low in both RECs until about mid-2000s, with the higher – and rising rapidly – intra-industry trade intensity in the EAC since then (Figure 4). Once again, these indices confirm greater structural similarity and hence likelihood of greater output shock synchronization among the EAC than the SACU members. Figure 4. Grubel-Lloyd Intra-Industry Trade Index, 1990 - 2012
Source: Authors’ calculations based on the UN Comtrade database.
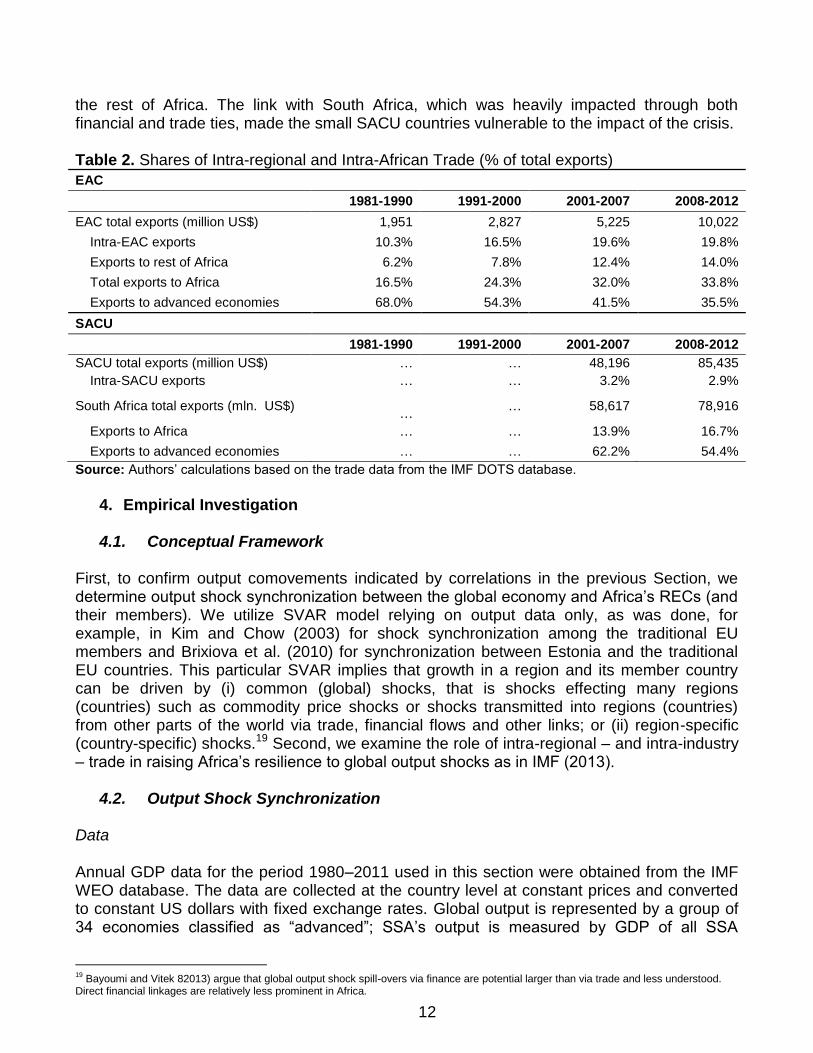
3.4. Intra-Regional Trade
Due to numerous impediments, Africa’s regional trade is low compared to other world regions (Freemantle, 2013; Ancharaz et al. 2011; Longo and Sekkat, 2004). Specifically, the average share of intra-African exports in total exports during 2000 - 2012 was 11 percent, relative to 25 percent in Latin America and 51 percent in Asia. Again, differences exist among Africa’s sub-regions, with the intra-regional trade taking the largest – and increasing – share of total trade in the EAC. The trade integration in the SACU is low (Table 2). Due to their deeper trade integration the total exports of the EAC countries fell less during the global crisis than in the SACU countries. Differently put, the EAC countries were shielded from a major drop in import demand in advanced economies that impacted the SACU countries. Another distinctive feature of the EAC members is their greater degree of trade diversification than in most of their peers in terms of export products. In Kenya, Uganda and Tanzania, the top three products account for less than 40 percent of total exports, well below levels in the SACU. Necessities, especially food, accounted for most of the EAC’s exports (total and to the rest of Africa), making the EAC less vulnerable to global slump. Most of the manufacturing goods, for which the demand in advanced economies fell during the crisis, are exported to the East Africa, including through informal channels.18 The SACU countries were less resilient to the global shock caused by the financial crisis, as they have close trade ties with South Africa, while having minimal trade ties with each other or
17
We use the one-digit SITC (Revision 3) classification to compute the index for each product class. 18
Uganda’s informal exports to its five neighbouring countries accounted for about half and one third of its total exports to these countries in 2009 and 2010, respectively. Main commodities traded through the informal trade in East Africa are food and manufacturing (Afrika and Ajumbo, 2012; Lesser and Moisé-Leeman, 2009).
10
15
20
25
30
35
40
45
50
1990
1992
1994
1996
1998
2000
2002
2004
2006
2008
2010
EAC SACU
12
the rest of Africa. The link with South Africa, which was heavily impacted through both financial and trade ties, made the small SACU countries vulnerable to the impact of the crisis. Table 2. Shares of Intra-regional and Intra-African Trade (% of total exports)
EAC
1981-1990 1991-2000 2001-2007 2008-2012
EAC total exports (million US$) 1,951 2,827 5,225 10,022
Intra-EAC exports 10.3% 16.5% 19.6% 19.8%
Exports to rest of Africa 6.2% 7.8% 12.4% 14.0%
Total exports to Africa 16.5% 24.3% 32.0% 33.8%
Exports to advanced economies 68.0% 54.3% 41.5% 35.5%
SACU
1981-1990 1991-2000 2001-2007 2008-2012
SACU total exports (million US$) … … 48,196 85,435
Intra-SACU exports … … 3.2% 2.9%
South Africa total exports (mln. US$)
… … 58,617 78,916
Exports to Africa … … 13.9% 16.7%
Exports to advanced economies … … 62.2% 54.4%
Source: Authors’ calculations based on the trade data from the IMF DOTS database.
4. Empirical Investigation
4.1. Conceptual Framework
First, to confirm output comovements indicated by correlations in the previous Section, we determine output shock synchronization between the global economy and Africa’s RECs (and their members). We utilize SVAR model relying on output data only, as was done, for example, in Kim and Chow (2003) for shock synchronization among the traditional EU members and Brixiova et al. (2010) for synchronization between Estonia and the traditional EU countries. This particular SVAR implies that growth in a region and its member country can be driven by (i) common (global) shocks, that is shocks effecting many regions (countries) such as commodity price shocks or shocks transmitted into regions (countries) from other parts of the world via trade, financial flows and other links; or (ii) region-specific (country-specific) shocks.19 Second, we examine the role of intra-regional – and intra-industry – trade in raising Africa’s resilience to global output shocks as in IMF (2013).
4.2. Output Shock Synchronization Data Annual GDP data for the period 1980–2011 used in this section were obtained from the IMF WEO database. The data are collected at the country level at constant prices and converted to constant US dollars with fixed exchange rates. Global output is represented by a group of 34 economies classified as “advanced”; SSA’s output is measured by GDP of all SSA
19
Bayoumi and Vitek 82013) argue that global output shock spill-overs via finance are potential larger than via trade and less understood. Direct financial linkages are relatively less prominent in Africa.

13
countries with available data; and regional outputs of the EAC and the SACU are represented by the total GDP of their members, domestic output is captured by GDP of each country.20 Structural VAR Approach21 Using structural vector auto-regression (SVAR), this section evaluates to what extent growth in the members of two regional economic communities is impacted by global, regional and country-specific shocks.22 Our framework draws on three variables, namely, constant global,
regional, and domestic outputs ( Gy , Ry and Dy ) all expressed in logarithms. They are
impacted by global, regional, and country-specific shocks ( G , R and D ) according to:
D
t
R
t
G
t
D
t
R
t
G
t
LALALA
LALALA
LALALA
y
y
y
)3(
333231
232221
131211
where is the first difference operator and pp
ijijijijij LaLaLaaLA 2210 is a polynomial
function of the lag operator, L. Structural shocks in the economy are classified into global, regional and country-specific as follows:
i. Global (common) shocks affect real GDP growth in all countries, i.e. they are due to (i)
global events, such as global financial crisis and ensuing financial uncertainty or (ii)
shocks to advanced economies that were transmitted to most developing countries;
ii. Regional shocks affect output growth in the regional economic communities (RECs).
They reflect (i) common regional events, such as revival of the EAC, signing of EAP
with the EU or (ii) shocks to some members of RECs transmitted to others; and
iii. Country-specific output shocks affect individual countries. They are due to changes in
macroeconomic policy, terms of trade shocks, productivity shocks, among others.
We also test a SVAR system where Africa replaces global output. Specifically, in (3) D
ty and D
t are replaced by C
ty and C
t which denote the logarithm of continental output and the
continental shock impacting output growth in African RECs and countries, respectively. We also impose long-run identifying restrictions on the impacts of shocks on the output growth where neither global nor regional growth rates are impacted by country-specific shocks in individual African countries. Further, global (continental) output growth is not affected by regional or country-specific shocks experienced in Africa.23 The restrictions placed
on (3) are thus 0231312 LALALA . As standard in structural VAR analysis, we assume
20
We calculate the first differences of the logarithm of the output variables. The results of the stationarity tests (ADF, KPSS) are reported in Table A1, Annex II. For robustness check, we carry out variance decompositions utilizing GDP in constant international dollars from the World Bank’s database (Annex III). 21
As IMF (2007) underscores, any analysis at the global level faces trade-offs between the sophistication of the modeling framework— in this case, the economic interpretation of the shocks—and availability of data. The limited availability of data does not allow for carrying out GVAR analysis as in de Waal (2013). 23
These assumptions are based on the small share of Africa in the global output.

14
that the three types of shocks are not correlated and have unit variance, that is It )var( . For
each country, we obtain variance decomposition and impulse response.24 Variance Decomposition We estimate the relative importance of the global, regional and domestic shocks in explaining the output growth changes in the selected African countries through structural variance decomposition. The reported results are those at the 10th year horizon, estimated from (3) with the long-run restrictions (Table 3).25 Table 3. Variance Decomposition: Global, Regional and Domestic Shocks
Panel A. Variance decompositions for EAC member states
Output Growth Standard Error Global Shock EAC Shock Domestic Shock
Burundi 0.04 3.37 21.08 75.55
Kenya 0.02 0.29 79.21 20.50
Rwanda 0.13 0.43 10.54 89.03
Tanzania 0.02 21.32 71.56 7.12
Uganda 0.03 9.16 1.20 89.65
Panel B. Variance decompositions for SACU member states
Output Growth Standard Error Global Shock SACU Shock Domestic Shock
Botswana 0.05 45.44 1.60 52.95
Lesotho 0.02 0.02 21.44 78.54
Namibia 0.03 12.39 34.19 53.43
S. Africa 0.02 2.47 97.03 0.50
Swaziland 0.04 41.69 8.98 49.33
Notes: Variance decomposition of forecast errors explains percentage of growth variation due to shocks in the global economy, regions and individual countries. Results are obtained by estimating the VAR model as in (3).
Several observations can be made from Table 3. First, in most countries studied, the domestic growth is impacted mainly by country-specific shocks. Hence in most African countries, idiosyncratic factors and country-specific conditions still drive growth. Second, regional shocks play a more significant role in the growth fluctuations of EAC countries, explaining on average one third of the forecast error variances. In contrast, regional shocks can only explain on average only less than one fifth of the output growth fluctuations of the small SACU members.26 The results confirm that output shocks were more synchronized within the EAC than the SACU regions. Third, compared with the EAC, growth rates of the small SACU members are more likely to be influenced by the global economy (they explain about 25 percent of the output variance). The SACU countries were more affected by the crisis due to, among other factors, South Africa’s deeper integration into the global financial system.
24
The lag structure – of order one – was determined using standard information criteria, including Akaike, Schwarz, Hannon-Quinn, etc. The results of the post-estimation Lagrange Multiplier tests show that residuals are not serially correlated; and the Jarque-Bera test results indicate that residuals are normally distributed. 25
Cholesky decomposition obtained by estimating (3) without imposing the long-run restrictions but by providing structure through ordering is in Annex III. Results of variance decompositions for global and regional growth at various horizons and domestic growth from one-year to nine-year horizons are available upon request. 26
Being a large economy within SACU, South Africa is heavily affected by regional shocks, by design.

15
On balance, variance decomposition based on our SVAR model of global, regional and country-specific growths gives empirical evidence that the EAC members are experiencing greater co-movements in output than countries in the SACU. In contrast, the SACU countries are more exposed to the global shocks, transmitted to them directly and via South Africa.27 When Sub-Saharan Africa’s growth replaces global growth in our model, country-specific shocks remain the main factor behind growth fluctuations in most countries. Continental and regional shocks are notably more important in the EAC than in the SACU’s (small states) output fluctuations, consistently with the EAC countries having closer trade ties with each other and the rest of Africa. For the EAC, continental and regional shocks explain on average about one third and one fourth of the variance of domestic growth, respectively (Table 4). Table 4. Variance Decomposition: Continental, Regional and Domestic Shocks
Panel A. Variance decompositions for EAC member states
Output Growth Standard Error SSA Shock EAC Shock Domestic Shock
Burundi 0.04 18.16 36.31 45.53
Kenya 0.02 26.54 59.10 14.35
Rwanda 0.13 10.02 1.62 88.36
Tanzania 0.03 88.01 6.56 5.43
Uganda 0.03 18.89 34.41 46.69
Panel B. Variance decompositions for SACU member states
Output Growth Standard Error SSA Shock SACU Shock Domestic Shock
Botswana 0.05 9.99 35.90 54.10
Lesotho 0.02 7.42 19.94 72.64
Namibia 0.03 29.53 10.10 60.36
S. Africa 0.02 83.48 15.79 0.73
Swaziland 0.04 29.53 9.69 60.78
Notes: Variance decomposition of forecast errors explains percentage of growth variation due to shocks in Africa, regions and individual countries. Results are obtained by estimating the VAR model as specified in (3).
Impulse Responses Impulse response functions give additional insights into output co-movements by tracing the effects of shocks over time. Figure A1, Annex IV shows responses of domestic growth to one standard deviation in global, regional and country-specific shocks, based on the estimates of (3). In the EAC countries, regional shocks have more profound effects on growth than country specific shocks, especially in the longer run. Consistently with findings from the variance decompositions, the EAC members do not respond significantly to global shocks, suggesting that the EAC countries are more resilient to global shocks than the SACU region. Regarding impulse responses of the small SACU countries, with the exception of Botswana, growth rates respond most significantly to country specific shocks. Except for South Africa, growth of individual countries tends to be independent of the regional shocks. Overall, responses of the SACU countries to regional shocks are even less noticeable than those to
27
The relative importance of global (continental), regional and domestic shocks observed in Cholesky decompositions are mostly consistent with those in structural decomposition (Annex III).

16
global shocks, indicating that the region is less integrated than the EAC and more exposed to global shocks. Figure A2, Annex II shows the responses of the domestic growth to positive one standard deviation in continental, regional, and country-specific shocks in the EAC and the SACU.28 While the effects of continental shocks on growth of the EAC countries are relatively substantial and persistent, particularly in the longer run, they play a minor role in the case of the SACU members. However, the responses of EAC member states’ output growth rates to regional shocks are now low, suggesting that economic development of the EAC is closely linked to that of Africa, as also indicated by structural similarity index and output co-movements (Figure 2). In contrast to the EAC, the small SACU members respond mostly to country-specific shocks and are also more likely to be influenced by the global shocks. 4.3 The Role of Trade Linkages29 What is the role of trade linkages in transmitting shocks from (i) the advanced economies or Africa into regional communities or (ii) from the advanced economies, Africa, and the regional communities into REC’s members? Figure 5 illustrates that ‘where you export matters’, that is that the trade linkages seem positively associated with output co-movements.30 African exports are vulnerable to banking crises in the countries they export to (Berman and Martin, 2012). Greater diversification across trading partners helps reduce vulnerability to slowdown in individual trading partners (Figure 5 and Abiad et al., 2012).31 As shown by Krugman (1991), Frankel and Rose (1997) and Fidrmuc (2004) for developed countries and Calderon (2007) for developing countries, the response of output co-movements to trade depends on the structure of production among country-pairs and intra-industry trade. To assess the role of intra-regional trade as a buffer against output shocks from advanced economies, we regress growth correlations between country pairs on trade linkages between them for both RECs. When growth rates are more correlated due to deeper intra-regional trade linkages, intra-regional trade should help absorb global shocks. Table 5 shows results of pooled OLS and (country-pair) fixed-effect regressions, using data during 1981–2011. The dependent variable is output synchronization (Syncjkt) measured by the pair-wise correlations of real annual GDP growth between countries j and k in each REC and period. Intra-industry trade (iitjkt) is measured by the pair-wise Grubel-Lloyd index. Bilateral trade linkage (btjkt) is measured by the exports between countries j and k as percent of their total exports. Structural similarity (djkt) is measured by the pair-wise Bray-Curtis index.
The results of pooled OLS regression – with positive and statistically significant coefficients
on intra-industry trade and bilateral trade ties within the two RECs – suggest that an increase
in intra-regional trade tends to raise output co-movements between the REC members.32 The
28
The impulse responses are obtained from the VAR model as specified in (3) for each of the sample countries. 29
In Africa, the impact of financial linkages would be lower due to its limited financial integration. 30
As IMF (2013) point out, the impact of trade is difficult to separate from effects of common border and language, currency and cultural similarity, which all facilitate trade. 31
Abiad et al. (2012) also suggest that increased financial openness, changes in the composition in the capital flows, and income equality raise resilience to shocks. 32
While the results of the fixed effect regression are not significant, the coefficients have the same sign.

17
result is consistent with the observation that the EAC countries trade more with each other and on average record higher growth rates than the SACU members.
Figure 5. Growth in selected countries and weighted growth of their key trading partners (%) 5a. Botswana and trading partners (%) 5b. Burundi and trading partners (%)
5c. Kenya and trading partners (%) 5d. Namibia and trading partners (%)
5e. Rwanda and trading partners (%) 5f. South Africa and trading partners (%)
5g. Tanzania and trading partners (%) 5h. Uganda and trading partners (%)
Source: Authors’ calculations based on the IMF and WTO databases.
-10
-5
0
5
10
2007 2008 2009 2010 2011 2012
Botswana - trading partners
Botswana
-10.0
-5.0
0.0
5.0
10.0
2007 2008 2009 2010 2011 2012
Burundi - trading partners Burundi
-10.0
-5.0
0.0
5.0
10.0
2007 2008 2009 2010 2011 2012
Kenya - trading partners Kenya
-10.0
-5.0
0.0
5.0
10.0
2007 2008 2009 2010 2011 2012
Namibia - trading partners Namibia
-10
-6
-2
2
6
10
2007 2008 2009 2010 2011 2012
Rwanda - trading partners Rwanda
-10.0
-5.0
0.0
5.0
10.0
2007 2008 2009 2010 2011 2012
South Africa - trading partners
South Africa
0.0
2.0
4.0
6.0
8.0
10.0
12.0
2007 2008 2009 2010 2011 2012
Tanzania - trading partners Tanzania
0.0
2.0
4.0
6.0
8.0
10.0
12.0
2007 2008 2009 2010 2011 2012
Uganda - trading partners Uganda

18
The EAC’s deeper intra-regional trade and its fewer trade ties with advanced economies have strengthened capacity of this REC to reduce exports volatility and mitigate global output shocks. Further, unlike the case of the SACU where the small countries export mostly to South Africa, the EAC’s regional trade is better diversified among various members and other countries in the region (Sudan, Democratic Republic of Congo). This underscores the importance of export diversification and trading with fast growing economies. Table 5. Trade Linkages and Output Co-movements – Regression Results
Pooled OLS regressions Fixed-effect regressions
(1) (2) (3) (4) (5) (6) (7) (8)
djkt –0.14 (–1.63)
–0.27 (–1.30)
–0.07 (–0.43)
–0.43 (–1.16)
iitjkt 0.15** (2.28)
0.02 (0.15)
–0.16 (–0.50)
–0.15 (–0.43)
btjkt 0.13** (2.11)
0.08 (1.03)
0.09 (0.98)
0.04 (0.31)
constant –0.08 (–0.56)
0.52*** (3.82)
0.76** (2.67)
0.07 (0.11)
0.02 (0.07)
–0.12 (–0.19)
0.58 (1.28)
–0.75 (1.20)
Obs. 56 30 26 20 56 30 26 20
Pairs 20 20 10 10 20 20 10 10
R2 0.04 0.11 0.20 0.22 0.04 0.11 0.20 0.15
Note: The t-statistics for robust errors are reported in parentheses. *, **, *** denote significance at the 10 percent, 5 percent, and 1 percent levels, respectively. All indices are in logs.
5. Conclusions
In this paper we have sought answers to the following questions: Can intra-regional trade help explain the differences in output co-movements between the advanced economies and the EAC and the SACU regions? What can other African countries and regions learn from the EAC about mitigating the impact of global output shocks on their economies? We have studied the EAC and the SACU regions because of the markedly different growth outcomes and the intensity of the intra-regional and intra-Africa trade that they exhibited. Several empirical methods, including structural VAR and panel regressions, were utilized to answer the above questions. We found that in part due to its deeper intra-regional trade ties – both within the REC and with Africa – the EAC has exhibited greater resilience to output shocks stemming from the global financial crisis than the SACU region. The example of small SACU countries shows once again that excessive trade concentration on one or two trading partners exposed to substantial exogenous shocks creates a major vulnerability. The policy implications from our analysis go beyond a simple suggestion to promote regional integration to build resilience. The example of the small SACU members, which trade heavily with South Africa (and the EU) but relatively little with other emerging markets, shows that countries would benefit from export diversification into the fast growing economies to reduce their exposure to the global output shocks. The global financial crisis and the increased frequency of aggregate shocks have raised interest of African policy-makers and the public in building resilience of their economies. In this paper we show that regional integration, in particular intra-regional and intra-Africa trade

19
with fast-growing economies, together with geographically diversified trade links, can strengthen the capacity of countries to absorb global output shocks. This paper has raised several important issues for future research. First is the relation between regional integration and intra-regional trade on the one hand and strengthening multilateral trade ties on the other. It needs to be underscored that our results should not be interpreted as support to regional integration via preferential regional trade agreements at the expense of multilateral trade. Intra-regional trade in Africa would benefit from improved regional infrastructure, reducing red tape at the border, improving business environment, and facilitating labor mobility, which are all factors that would facilitate trade in general. The specific barriers to regional trade vary across Africa’s regions and are left to further research. Second, we have focused on the transmission of shocks from the advanced economies to Africa, leaving the impact of shocks in emerging markets on Africa to further investigation.33 Third, future research could examine if and how the intra-regional trade in Africa facilitates regional value chains and integration of African countries into the global value chains.34
33
Drummond and Liu (2013) studied spill-overs from changes in China’s investment to Sub-Saharan Africa’s export. They found that one percentage increase (decline) in China’s domestic investment growth is associated with an average 0.6 percentage increase (decline) in Sub-Saharan Africa’s exports. 34
Bems at el. (2010) examine the implications of trade in intermediate goods for transmission of shocks across border and the empirical relationship between demand, trade and production.

20
Annex I. Output Co-movements 1980 – 2012 Table A1. Correlation Coefficients for the GDP Growth Variables
Panel A. Correlation coefficients for the variables used in the EAC analyses
Output Growth Burundi Kenya Rwanda Tanzania Uganda EAC SSA
Kenya 0.29 (0.10)
1
Rwanda 0.13 (0.47)
0.07 (0.70)
1
Tanzania 0.26 (0.15)
0.49*** (0.00)
0.30* (0.10)
1
Uganda –0.41** (0.02)
0.15 (0.43)
0.02 (0.92)
0.28 (0.12)
1
EAC 0.28 (0.12)
0.76*** (0.00)
0.48*** (0.01)
0.84*** (0.00)
0.41** (0.02)
1
SSA 0.18 (0.32)
0.38** (0.03)
0.31* (0.09)
0.68*** (0.00)
0.41** (0.02)
0.70*** (0.00)
1
Advanced Global –0.05 (0.79)
0.15 (0.42)
–0.06 (0.76)
–0.10 (0.60)
–0.19 (0.31)
–0.05 (0.78)
0.00 (0.99)
Panel B. Correlation coefficients for the variables used in the SACU analyses
Output Growth Botswana Lesotho Namibia S. Africa Swaziland SACU SSA
Lesotho –0.01 (0.94)
1
Namibia –0.05 (0.77)
–0.11 (0.54)
1
South Africa 0.11 (0.55)
0.00 (1.00)
0.16 (0.39)
1
Swaziland 0.31* (0.08)
0.02 (0.91)
–0.30* (0.09)
0.06 (0.73)
1
SACU 0.16 (0.38)
0.00 (0.99)
0.19 (0.30)
1.00*** (0.00)
0.08 (0.68)
1
SSA –0.05 (0.78)
0.05 (0.80)
0.17 (0.34)
0.82*** (0.00)
–0.10 (0.59)
0.81*** (0.00)
1
Advanced Global 0.53*** (0.00)
0.04 (0.83)
0.19 (0.29)
0.32* (0.07)
0.36** (0.04)
0.36** (0.04)
0.00 (0.99)
Source: Authors’ calculations based on the IMF WEO database.

21
Annex II. Stationarity Tests Table A1. Test for Stationarity of the Real GDP Growth Rate
Panel A. Tests for stationarity for the variables used in the EAC analyses
GDP Obs. Augmented Dickey-Fuller Test KPSS Test
(Log difference) t-statistic p-value LM-statistic 10% level
Burundi 31 –3.82*** 0.01 0.16 0.35
Kenya 31 –3.42** 0.02 0.13 0.35
Rwanda 31 –5.06*** 0.00 0.27 0.35
Tanzania 31 –1.90 0.33 0.52** 0.35
Uganda 31 –3.10** 0.04 0.34 0.35
EAC 31 –2.55 0.12 0.40* 0.35
SSA 31 –2.89* 0.06 0.51** 0.35
Advanced Global 31 –3.74*** 0.01 0.39* 0.35
Panel B. Tests for stationarity for the variables used in the SACU analyses
GDP Obs. Augmented Dickey-Fuller Test KPSS Test
(Log difference) t-statistic p-value LM-statistic 10% level
Botswana 31 –4.13*** 0.00 0.46* 0.35
Lesotho 31 –7.25*** 0.00 0.11 0.35
Namibia 31 –5.58*** 0.00 0.62** 0.35
South Africa 31 –4.17*** 0.00 0.40* 0.35
Swaziland 31 –1.12 0.69 0.54** 0.35
SACU 31 –4.22*** 0.00 0.39* 0.35
SSA 31 –2.89* 0.06 0.51** 0.35
Advanced Global 31 –3.74*** 0.01 0.39* 0.35
Notes: The augmented Dickey-Fuller test for unit root and the Kwiatkowski-Phillips-Schmidt-Shin (KPSS) test for stationarity are applied to the constant GDP series in the log difference form. For most of the time series, at least one of the two tests confirms the stationarity at the 10% significance level. .

22
Annex III—Variance Decomposition with GDP Table A1. Cholesky Variance Decomposition: Global, Regional and Domestic Shocks (GDP in constant 2005 prices and exchange rates)
Panel A. Variance decompositions for EAC member states
Output Growth Standard Error Global Shock EAC Shock Domestic Shock
Burundi 0.04 5.86 16.97 77.17
Kenya 0.02 3.40 56.94 39.66
Rwanda 0.13 1.28 20.21 78.51
Tanzania 0.02 10.74 35.53 53.73
Uganda 0.03 0.29 31.08 68.63
Panel B. Variance decompositions for SACU member states
Output Growth Standard Error Global Shock SACU Shock Domestic Shock
Botswana 0.05 24.75 3.52 71.72
Lesotho 0.02 0.75 2.92 96.33
Namibia 0.03 18.99 2.29 78.72
S. Africa 0.02 27.40 72.29 0.31
Swaziland 0.04 10.44 29.15 60.41
Notes: Variance decomposition of forecast errors explains percentage of growth variation due to shocks in the global economy, regions and individual countries. Results are obtained by estimating the VAR model as in (3).
Table A2. Cholesky Variance Decomposition: SSA, Regional and Domestic Shocks (GDP in constant 2005 prices and exchange rates)
Panel A. Variance decompositions for EAC member states
Output Growth Standard Error SSA Shock EAC Shock Domestic Shock
Burundi 0.04 11.40 10.83 77.77
Kenya 0.02 16.33 43.62 40.05
Rwanda 0.13 8.58 13.28 78.13
Tanzania 0.03 45.61 11.86 42.54
Uganda 0.03 13.28 18.41 68.31
Panel B. Variance decompositions for SACU member states
Output Growth Standard Error SSA Shock SACU Shock Domestic Shock
Botswana 0.05 2.37 7.82 89.82
Lesotho 0.02 0.58 5.41 94.01
Namibia 0.03 9.14 5.78 85.08
S. Africa 0.02 73.75 25.75 0.50
Swaziland 0.04 8.57 3.43 88.00
Notes: Variance decomposition of forecast errors explains percentage of growth variation due to shocks in Africa, regions and individual countries. Results are obtained by estimating the VAR model as specified in (3).

23
Table A3. Variance Decomposition: Global, Regional and Domestic Shocks (in constant international $)
Panel A. Variance decompositions for the EAC member states
Output Growth
Standard Error
Cholesky Decomposition Structural Decomposition
Global EAC Domestic Global EAC Domestic
Burundi 0.05 0.59 37.94 61.46 30.79 24.75 44.46
Kenya 0.02 3.86 55.47 40.67 2.69 83.95 13.36
Rwanda 0.19 3.81 29.08 67.11 1.51 16.20 82.29
Tanzania 0.02 5.07 60.08 34.85 28.01 66.85 5.14
Uganda 0.02 1.66 34.63 63.71 3.14 12.51 84.34
Panel B. Variance decompositions for the SACU member states
Output Growth
Standard Error
Cholesky Decomposition Structural Decomposition
Global SACU Domestic Global SACU Domestic
Botswana 0.04 26.53 1.99 71.48 68.39 4.52 27.09
Lesotho 0.02 0.67 0.71 98.62 3.09 2.03 94.89
Namibia 0.03 10.28 3.98 85.74 10.06 17.19 72.76
S. Africa 0.02 20.95 70.32 8.73 1.20 88.21 10.59
Swaziland 0.05 11.95 19.03 69.02 30.37 10.42 59.21
Notes: Variance decomposition of forecast errors explains percentage of growth variation due to shocks in the global economy, regions and individual countries. Results are obtained by estimating the VAR model as in (3).
Table A4. Variance Decomposition: Continental, Regional and Domestic Shocks (in constant international $)
Panel A. Variance decompositions for EAC member states
Output Growth
Standard Error
Cholesky Decomposition Structural Decomposition
Africa EAC Domestic Africa EAC Domestic
Burundi 0.05 40.80 1.14 58.06 47.23 23.34 29.43
Kenya 0.02 52.78 12.61 34.61 53.00 21.26 25.74
Rwanda 0.19 22.13 25.59 52.28 23.63 3.10 73.26
Tanzania 0.02 72.59 5.83 21.58 75.31 11.82 12.87
Uganda 0.02 12.73 20.42 66.85 40.36 2.01 57.63
Panel B. Variance decompositions for SACU member states
Output Growth
Standard Error
Cholesky Decomposition Structural Decomposition
Africa SACU Domestic Africa SACU Domestic
Botswana 0.04 9.83 2.19 87.98 17.43 2.60 79.97
Lesotho 0.02 7.27 1.87 90.86 4.02 0.22 95.75
Namibia 0.03 11.04 3.98 84.98 11.56 10.32 78.12
S. Africa 0.02 52.30 41.71 5.99 77.23 18.64 4.13
Swaziland 0.05 1.11 4.24 94.65 19.71 4.47 75.82
Notes: Variance decomposition of forecast errors explains percentage of output growth variation due to shocks in Africa, regions and individual countries. Results are obtained by estimating the VAR model as in (3).

24
Annex IV. Impulse Response Functions Figure A1. Responses of Countries’ Growth to Global, Regional and Domestic Shocks Panel A. Impulse responses for the EAC member states
-0.010
0.000
0.010
0.020
0.030
0.040
1 2 3 4 5 6 7 8 9 10
Response of Burundi's output growth to structural shocks
Global Shock EAC Shock
Domestic Shock
-0.005
0.000
0.005
0.010
0.015
0.020
1 2 3 4 5 6 7 8 9 10
Response of Kenya's output growth to structural shocks
Global Shock EAC Shock
Domestic Shock
-0.020
0.000
0.020
0.040
0.060
0.080
0.100
0.120
0.140
1 2 3 4 5 6 7 8 9 10
Response of Rwanda's output growth to structural shocks
Global Shock EAC Shock
Domestic Shock
-0.010
-0.005
0.000
0.005
0.010
0.015
1 2 3 4 5 6 7 8 9 10
Response of Tanzania's output growth to structural shocks
Global Shock EAC Shock
Domestic Shock
-0.015
-0.010
-0.005
0.000
0.005
0.010
0.015
0.020
0.025
0.030
0.035
1 2 3 4 5 6 7 8 9 10
Response of Uganda's output growth to structural shocks
Global Shock EAC Shock
Domestic Shock

25
Panel B. Impulse responses for the SACU member states
Notes: Impulse responses trace the effects of one standard deviation global, regional and domestic shocks on countries’ output growth over time. Results from Cholesky specification are similar to those above.
-0.010
0.000
0.010
0.020
0.030
0.040
0.050
1 2 3 4 5 6 7 8 9 10
Response of Botswana's output growth to structural shocks
Global Shock SACU Shock
Domestic Shock
-0.010
-0.005
0.000
0.005
0.010
0.015
0.020
1 2 3 4 5 6 7 8 9 10
Response of Lesotho's output growth to structural shocks
Global Shock SACU Shock
Domestic Shock
-0.010
-0.005
0.000
0.005
0.010
0.015
0.020
0.025
1 2 3 4 5 6 7 8 9 10
Response of Namibia's output growth to structural shocks
Global Shock SACU Shock
Domestic Shock
-0.005
0.000
0.005
0.010
0.015
0.020
0.025
1 2 3 4 5 6 7 8 9 10
Response of S. Africa's output growth to structural shocks
Global Shock SACU Shock
Domestic Shock
-0.010
-0.005
0.000
0.005
0.010
0.015
0.020
0.025
0.030
1 2 3 4 5 6 7 8 9 10
Response of Swaziland's output growth to structural shocks
Global Shock SACU Shock
Domestic Shock

26
Figure A2. Responses of Countries’ Growth to SSA, Regional and Domestic Shocks Panel A. Impulse responses for the EAC member states
-0.015
-0.010
-0.005
0.000
0.005
0.010
0.015
0.020
0.025
0.030
0.035
1 2 3 4 5 6 7 8 9 10
Response of Burundi's output growth to structural shocks
SSA Shock EAC Shock Domestic Shock
0.000
0.002
0.004
0.006
0.008
0.010
0.012
0.014
0.016
0.018
1 2 3 4 5 6 7 8 9 10
Response of Kenya's output growth to structural shocks
SSA Shock EAC Shock Domestic Shock
-0.020
0.000
0.020
0.040
0.060
0.080
0.100
0.120
0.140
1 2 3 4 5 6 7 8 9 10
Response of Rwanda's output growth to structural shocks
SSA Shock EAC Shock Domestic Shock
0.000
0.002
0.004
0.006
0.008
0.010
0.012
0.014
0.016
1 2 3 4 5 6 7 8 9 10
Response of Tanzania's output growth to structural shocks
SSA Shock EAC Shock Domestic Shock
-0.020
-0.015
-0.010
-0.005
0.000
0.005
0.010
0.015
0.020
0.025
1 2 3 4 5 6 7 8 9 10
Response of Uganda's output growth to structural shocks
SSA Shock EAC Shock Domestic Shock

27
Panel B. Impulse responses for the SACU member states
Notes: Impulse responses trace the effects of one standard deviation SSA, regional and domestic shocks on countries’ output growth over time. Results from Cholesky specification are similar to those above. Impulse responses with confidence intervals are available upon request.
-0.020
-0.010
0.000
0.010
0.020
0.030
0.040
0.050
1 2 3 4 5 6 7 8 9 10
Response of Botswana's output growth to structural shocks
SSA Shock SACU Shock
Domestic Shock
-0.010
-0.005
0.000
0.005
0.010
0.015
0.020
1 2 3 4 5 6 7 8 9 10
Response of Lesotho's output growth to
structural shocks
SSA Shock SACU Shock
Domestic Shock
-0.010
-0.005
0.000
0.005
0.010
0.015
0.020
0.025
0.030
1 2 3 4 5 6 7 8 9 10
Response of Namibia's output growth to structural shocks
SSA Shock SACU Shock
Domestic Shock
-0.005
0.000
0.005
0.010
0.015
0.020
0.025
1 2 3 4 5 6 7 8 9 10
Response of S. Africa's output growth to structural shocks
SSA Shock SACU Shock
Domestic Shock
-0.015
-0.010
-0.005
0.000
0.005
0.010
0.015
0.020
0.025
0.030
1 2 3 4 5 6 7 8 9 10
Response of Swaziland's output growth to structural shocks
SSA Shock SACU Shock
Domestic Shock

28
References Abiad, A. et al. (2012), ‘The Rising Resilience of Emerging Market and Developing Economies’, IMF Working Paper WP/12/300. African Development Bank (2013), Situational Analysis of the Reliability of Economic Statistics in Africa: Special Focus on GDP Measurement, AfDB: Tunis. Afrika, J. K. and Ajumbo, G. (2012), ‘Informal Cross Border Trade in Africa: Implications and Policy Recommendations’, African Development Bank Economic Brief Vol. 3(10). Ancharaz, V.; Mbekeani, K. and Brixiova, Z. (2011), ‘Impediments to Regional Trade Integration in Africa’, African Development Bank Economic Brief, Vol. 2(11). Bayoumi, T. and Vitek, F. (2013), ‘Macroeconomic Model Spillovers and their Discontent’, IMF Working Paper No. IMF/WP/13/4. Bayoumi, T. and Eichengreen, B. (1993), ‘Shocking Aspects of European Monetary Integration’, in Torres, F. and F. Giavazzi (eds), Adjustment and Growth in the European Monetary Union, pp. 193-229, Cambridge University Press, Cambridge, UK. Bems, R.; Johnson, R. and Kei-Mu, Y. (2010), ‘Demand Spillovers and the Collapse of Trade in the Global Recession’, IMF Economic Review Vol. 58 (2), 295 – 326. Berman, N. and Martin, P. (2012), ‘The Vulnerability of Sub-Saharan Africa to Financial Crises: The Case of Trade’, IMF Economic Review Vol. 60 (3), 329 – 345. Blanchard O. and Quah D. (1989), ‘Dynamic Efficiency of Aggregate Demand and Supply Disturbances’, American Economic Review, 79, 655-673. Brixiova, Z. and Ndikumana, L. (2013), ‘The Global Financial Crisis and Africa: The Effects and Policy Responses’, in Handbook of the Political Economy of Financial Crises, edited by J. Epstein and M. Wolfson, Oxford University Press. Brixiova, Z., Morgan, M. H. and Wörgötter, A. (2010), ‘On the Road to Euro: How Synchronized is Estonia with the Euro Zone?’, European Journal of Comparative Economics, Vol. 7 (1), 203–227. Ҫakir, M. Y. and Kabundi, A. (2011), ‘Trade Shocks from BRIC to South Africa: a Global VAR Analysis’, University of Johannesburg. Calderon, C.; Chong, A. and Stein, E. (2007), ‘Trade Intensity and Business Cycle Synchronization: Are Developing Countries Any Different?’, Journal of International Economics, Vol. 71 (1), 2 – 21. Clark, T. E. and van Wincoop, E. (2001), ‘Borders and Business Cycles’, Journal of International Economy, Vol. 55, 59 – 84.

29
De Waal, A. (2013), ‘The Impact of Economic Shocks in the Rest of the World on South Africa: Evidence from a Global VAR’, University of Pretoria Working Paper No. 28. Diallo, O. and Tapsoba, J. S-A. (2014), Rising BRICs and Changes in Sub-Saharan Africa’s Business Cycle Patterns, IMF Working Paper No. WP/14/35. Drummond, P. and Liu, E. X. (2013), ‘Africa’s Rising Exposure to China: How Large are Spillovers through Trade?’, IMF Working Paper No. WP/13/250. Drummond, P. and Ramirez, G. (2009), ‘Spillovers from the Rest of the World into Sub-Saharan African Countries’, IMF Working Paper No. WP/09/155. Fidrmuc, J. (2004), ‘The Endogeneity of the Optimum Currency Area Criteria, Intra-industry Trade, and EMU Enlargement’, Contemporary Economic Policy, Vol. 22 (1), 1–12. Frankel J. and Rose A. K. (1998), ‘The Endogeneity of the Optimal Currency Area Criteria’, Economic Journal, Vol. 108, 1009-1025. Frankel, J. A., and Rose, A. K. (1997), ‘Is EMU More Justifiable Ex Post Than Ex Ante?’, European Economic Review, Vol. 41 (3–5), 753– 60. Freemantle, S. (2013), ‘Intra-African Trade: Challenging and Critical’, Standard Bank Africa Marco Insight and Strategy. Grubel, H. G. and Loyd, P. J. (1971), ‘The Empirical Measurement of Intra-Industry Trade’, Economic Record, Vol. 47 (120), 494–517. Gruben, W. C.; Koo, J. and Millis, E. (2002), ‘How Much Does International Trade Affects Business Cycle Synchronization?’ Federal Reserve Bank of Dallas Working Paper No. 0203. Gurara, D. Z. and Ncube, M. (2013), ‘Global Economic Spillovers to Africa – GVAR Approach’, African Development Bank Working Paper No. 183. Imbs, J. (2004), ‘Trade, Finance, Specialization, and Synchronization’, Review of Economics and Statistics, Vol. 86 (3), 723–734. International Monetary Fund (2013), ‘Dancing Together? Spillovers, Common Shocks, and the Role of the Financial and Trade Linkages’, in the IMF World Economic Outlook 2013: Transitions and Tensions (October), IMF: Washington, DC. International Monetary Fund (2007), ‘Decoupling the Train?’, in the IMF World Economic Outlook 2007: Spillovers and Cycles in the Global Economy (April), IMF: Washington, DC. International Monetary Fund (2005), ‘Two Current Issues Facing Developing Countries’ in the IMF World Economic Outlook 2005: Globalization and External Imbalances (April), IMF: Washington, DC. Kim, Y. and Chow, H. K. (2003), ‘Optimum Currency Area in Europe: An Alternative Assessment’, Economics Letters, Vol. 81 (3), 297–304.

30
Kose, M. A., Otrok, C. and Prasad, E. S. (2008), ‘Global Business Cycles: Convergence or Decoupling?’, IMF Working Paper No. 08/143. Kose, M. A. and Yi, K. M. (2001), ‘International Trade and Business Cycles? Is Vertical Integration the Missing Link?’, American Economic Review Papers and Proceedings, 371-375. Krugman, P. (1991), Geography and Trade, The MIT Press, Cambridge, MA. Lesser, C. and Moisé-Leeman, E. (2009), ‘Informal Cross-Border Trade and Trade Facilitation Reform in Sub-Saharan Africa’, OECD Trade Policy Working Paper No. 86. Longo, R. and Sekkat, K. (2004), ‘Economic Obstacles to Expanding Intra-African Trade’, World Development, Vol. 32 (8), 1309–1321. Mafusire, A. and Brixiova, Z. (2013), ‘Macroeconomic Shock Synchronization in the East African Community’, Global Economy Journal, Vol. 13 (2), 261 – 280. Ncube, M. and Ndou, E. (2013), Monetary Policy and the Economy of South Africa, Palgrave McMillan. Ncube, M., Ndou, E. and Gumata, N. (2012a), ‘How are the US Financial Shocks Transmitted into South Africa? Structural VAR Evidence’, African Development Bank Working Paper No. 157. Ncube, M., Ndou, E. and Gumata, N. (2012b). The Impact of Euro Area Monetary and Bond Yield Shocks on the South African Economy: Structural Vector Auto-regression Model Evidence, African Development Bank Working Paper No. 161. Ndulu, B., and O’Connell, S. (2007). ‘Policy Plus: African Growth Performance, 1960-2000,’ in Ndulu, B, O’Connell, S., Bates, R., Collier, P., Soludo, C., Azam, J-P., Fosu, A., Gunning, J.W. and Njinkeu, D. (eds), The Political Economy of Economic Growth in Africa, 1960-2000, Cambridge University Press, Cambridge, UK. Stockmann, A. C. (1988), ‘Sectoral and National Aggregate Disturbances in Seven European Countries’, Journal of Monetary Economics, Vol. 21, 387 – 410. Tapsoba, J. S-A. (2010), ‘Trade Intensity and Business Cycle Synchronicity in Africa’, African Development Review, Vol. 22 (1), 149 – 172. Turner, T.; Mokaddem, L. and Ben Ahmed, G. (2010), ‘Assessment of Trade Finance Market in Africa Post-Crisis’, African Development Bank Working Paper No. 118.

31
Recent Publications in the Series
nº Year Author(s) Title
197 2014 Mthuli Ncube, Basil Jones, and
Zorobabel Bicaba Estimating the Economic Cost of Fragility in Africa
196 2014 Guy Blaise Nkamleu and Bernadette
Dia Kamgnia
Uses and Abuses of Per-diems in Africa: A Political
Economy of Travel Allowances
195 2013 Mthuli Ncube, John Anyanwu and
Kjell Hausken
Inequality, Economic Growth, and Poverty in the Middle
East and North Africa (MENA)
194 2013 Amadou B. Diallo The Impact of Community Development Works
Programs (CWP) on Households’ Wellbeing in Albania
193 2013 Issa Faye, Ousman Gajigo, and
Emelly Mutambatsere
Large Scale Agribusiness Investments and Implications
in Africa: Development Finance Institutions'
Perspectives
192 2013 Adeleke Salami and Damilola Felix
Arawomo
Empirical Analysis of Agricultural Credit in Africa: Any
Role for Institutional Factors?
191 2013 Cisse Fatou and Ji Eun Choi Do Firms Learn by Exporting or Learn to Export:
Evidence from Senegalese Manufacturers’ Plants
190 2013 Giovanni Caggiano, Pietro Calice,
and Leone Leonida
Early Warning Systems and Systemic Banking Crises in
Low Income Countries: A Multinomial Logit Approach
189 2013 Eliphas Ndou, Nombulelo Gumata,
Mthuli Ncube and Eric Olson
An Empirical Investigation of the Taylor Curve in South
Africa
188 2013 Mthuli Ncube and Zuzana Brixiova Remittances and Their Macroeconomic Impact:
Evidence from Africa
