aerodynamic analysis of the self-suspended flare
TRANSCRIPT

Q
BDTB NO. 199 23 FEBROm 1972
AERODYNAMIC ANALYSIS
OF THE
SELF-SUSPENDED FLARE
Statement A« Approved for public release} distribution unlimited.
PREPARED BT
D D C
V^ APR I* ,97?
c .
RESEARCH AND DEVELOPMENT DEPARTMENT
NAVAL AMMUNITION DEPOT. CRANE, INDIANA
•S^s V» MI5I
J?/^ i

..,;----. -· - -~--- - < • • ~ - ~
Best Available
Copy
UNCLASSIFIED SoomtvCUijjifj^tion
DOCUMENT CONTROL DATA R&D Swueilv clmtiMUh'mtion ol till*, *wdfr uf tttomtfrnct ami htdifMinii MtnolHlitm iuu*t be mnt9r*d whim Ifr» vwrmll rmpoet In rl»a»Ui»tl)
Government and Aeronautical Products Wv. 600 North Second Street Hopkins. Minnesota SS343
2«. RCPOnT tCCURITV CLAHiriCATION
Unclassified »6. CROUP
* RCPORT TITLE
Aerodynamic Analysis of the Self-Suspended Flare
4 OCSCRI.<TIVC HOItt (Trp* ol npetl and Incluttv d»l»i)
Final Summary Report uTHOmsi (Flm nam*. mioil* mn • Su TMoniii (Flm MM. mBK Inlilsl, tear nrnrntüT
G. 0. Stllley
• «CROAT DATE
1 October 1972 M. CONTMACT en anANT NO.
N00164-69-C-0662 6. »MOJCCT NO.
\
». TOTAL NO. OF PAOe»
207 7k. NO. or ncFt
30 M. OMiaiNATOM't HIPORT NUMBCKHI
RDTRN0. 199
M. OTHKR KCPORT NOIII (Any elht numbart Html mmr bm »flfnwd IM» nport)
I«. D((< RIBUTION tTATtMtNT
Stetenent tx Approved for public release; distribution unllnited.
II. »OPPLCMtNTARV NOTKt
this document may be better studied on microfiche
J. *BtTR«CT
12. tPONJCRING MILITARY ACTIVITY
Naval Amunltlon Depot Crane» Indiana 47522
This report summarizes and describes the work accomplished on Contract N00164-69-C-0662 (which was a digital computer simulation and calculation of trajectories of Self-Suspended Flares) during the period June 1969 thru June 1970. Theoretical trajectories are presented for various Initial conditions and disk configurations.
DD IFN0O'VM473 S/N OlOt.807-6901
(PAGE I)
Securilv Clarification

■»carity CUMlflottoii
OLK «T nok« MOLC «T
Pyrothacnlcs Mro^ynamlcs Flares lllunrl nation Trujactorles Spinning Disk
± DO .Mv..1473 <BACK» (PAGE 2)
UNCLASSIFIED tecuritir ClaasiflealtMi
NAVAL AMMUNITION DEPOT Crane, Indiana
RDTR NO. 199 23 February 1972
AERODYNAMIC ANALYSIS OF THE SELF-SUSPENDED FLARE
By G. D. Stilley
This report was reviewed for adequacy and technical accuracy by D. L. CARSTENS, Mechanical Engineer, and 0. K. SANDERS, Aerodynamic Engineer, Engineering Sciences Division
.... k
rti
Released by: r
S. M. FASIG j Director, Research and Development Department
A lliQ-
Statement At Approved for public release; distribution unlimited«
NAVAL AMMUNITION DEPOT CRANE, INDIANA
AERODYNAMIC ANALYSIS OF THE SELF-SUSPENDED FLARE
FINAL SUMMARY REPORT
PERIOD JUNE 1969 THROUGH JUNE 1971
BY G. D. STILLEY
CONTRACT N00164-69-C-06G2
1 OCTOBER 1971
HONEYWELL INC GOVERNMENT AND AERONAUTICAL PRODUCTS
DIVISION 600 NORTH SECOND STREET
HOPKINS, MINNESOTA 55343
FOREWORD
This report presents the conclusions, recommendations, and typical results available from the efforts to date on the project entitled "Aerodynamic Analysis of the Self-Suspended Flare. " This project was conducted by the
Government and Aeronautical Products Division of Honeywell Inc. for the
Research and Development Department of the Naval Ammunition Depot (NAD), Crane, Indiana, under Contract N00164-69-C-0662. The effort
described was essentially conducted during the period from Tune 1969
through June 1970, with intermittent computer, documentation, and present-
ation efforts in the interim.
The cognizant Project Engineer for NAD/Crane was Mr. J. J. Riester. The principal investigator for Honeywell was Mr. G. D. Stilley, with support from other aerodynamics, computer programming, wind tunnel, and flight test photography personnel, as required. The studies were also supported by in-house facilities consisting of a subsonic wind tunnel, a CDC 6600 com- puter terminal, a Honeywell Computer Network teletype computer terminal, several cameras, and by a semi-automatic motion analyzer for film data. The efforts were also supported on a mutual team work basis by free-flight test facilities at Hurricane Mesa, which were the responsibility of a separate contractor, Denver Research Institute, under direct contract with NAD/Crane.
Some informal consultive support was obtained from Dr. J. D. Nicolaides
and Dr. C. W. Ingram of the Aerospace Engineering Department at Notre Dame University and from Dr. E. E. Covert from the magnetic support wind tunnel facility at the Massachusetts Institute of Technology (MIT).
This technical report has been reviewed and is approved.

ACKNOWLEDGEMENT/DISCLAIMER
It is recognized that the name "Frisbee" is a copyrighted trademark of the Whamo Corporation. Therefore, the more precise and legally correct way to describe the domed, cupped configurations studied herein would be with the terms "frisbee-like configuration, " etc. However, in the interest of brevity and clarity, especially on figures, this report will define the word "frisbee" to mean "frisbee-like configuration. " Therefore, "solid frisbee" would refer to a frisbee-like configuration whose top is domed
similarly to the "Frisbee" but whose bottom surface is filled in flush» etc.
TABLE OF CONTENTS
Section Page
I. INTRODUCTION 1
II. SUMMARY 5
III. CONCLUSIONS AND RECOMMENDATIONS 7
IV. TECHNICAL DISCUSSION 11
A. Summary of Technical Considerations and Efforts 12
1. Problem Identification/Definition 13
2. Technical Approach 15
3. Aerodynamic Force, Moment, and Axes Definitions 17
4. Trajectory Simulation Development 21
5. Preliminary Flight Dynamics Analyses 24
6. Fuzing Investigations 26
7. Aerodynamic Investigations 26
8. Preliminary Hurricane Mesa Tests 29
9. Nonspinning Wind Tunnel Tests 30
10. Interim Investigations 32
11. Hurricane Mesa Tests 35
12. Hurricane Mesa Data Reduction 47
13. Spinning Model Wind Tunnel Tests 49
14. Stability/Precession Criteria 51
15. Trajectory Computations 53
16. Recent Efforts 54

TABLE OF CONTENTS (Continued)
Section Pag<
B. Results 56
1. Theoretical Trajectories 56
a. Typical Nonprecessing Inert Flare Trajectories 57
b. Typical Trajectories for Clay Pigeons and Frisbees 57
c. Simulated Mesa Toss of Inert Flares 63
d. Simulated Air Drop of Inert Flare 70
e. Simulated Live Flare Trajectories 70
f. Typical Equilibrium Glide Conditions 81
g. Typical Trajectories for Other Applications 85
2. Stability and Precessional Criteria for Spinning Disks 85
a. Introduction 85
b. Stability and Precessional Criteria Defined 88
c. Stability and Precessional Criteria for Level Launch 89
d. Application of the Criteria to Frisbees and Clay Pigeons 92
e. Application of Criteria to Self-Suspended Flares 98
3. Configuration Aerodynamic Characteristics 100
a. Configuration Aerodynamic Data 100
b. Thickness Effects 108
c. Corner Radius Effects 108
TABLE OF CONTENTS (Continued)
Section Pag
d. Spin Effects
e. Combustion Effects
f. Cavity Effects
g. Aerodynamic Damping
h. Idealized Aerodynamic Requirements/ Alternate Configurations
i. Wind Tunnel Model Configurations
j. Recommended Extension of Present Wind Tunnel Test Data
4. Free-Flight Testing
a. Hurricane Mesa Tests
b. Hurricane Mesa Test Instrumentation
c. Typical Hurricane Mesa Results for Standard Inert Flares
d. Typical Hurricane Mesa Results for Special Inert Flares
e. Typical Flight Test Results for Live Flares
f. Flight Test Results on Spin Decay
g. Correlation of Flight Test and Predicted Results
h. Auxiliary Observations from Other Flight Tests
5. Math Models/Computer Program
a. Basic
b. Linearized Analysis
109
114
114
119
119
124
124
129
129
131
135
137
142
145
145
146
147
147
148

•>
TABLE OF CONTENTS (Concluded)
Section Page
c. Typical Aerodynamic Coefficient and Inertial Data for Computer Program 148
d. Sample Simulation Results 149
e. Possible Math Model/Computer Program Modifications 149
V. BIBUOGRAPHY 163
Appendix A. Preliminary Combustion Wake Effect Analysis 169
Appendix B. Equations for Trajectory Simulation 178
Appendix C. Equations for Stability/Precession Analysis 199
Appendix D. Typical Configuration Data Input for Trajectory Simulation 203

\
LIST OF FIGURES
Figure Page
1 Self-Suspended Flare Concept 2
2 Recommended Aerodynamic Configurations, Self- Suspended Flare 9
3 Possible Alternate Aerodynamic Configurations, Self-Suspended Flare 10
4 Gyroscopic Precession Principles 14
5 Aerodynamic Axes, Forces, and Moments 18
6 Typical Preliminary Trajectory Computations 23
7 Pitching Moment Coefficients for Typical Self-Suspended Flare Configurations 28
8 Typical Installation (Sidewall Mount). Wind Tunnel Tests 31
9 Typical Smoke Tunnel Tests of Spinning Clay Pigeons 34
10 Typical Dummy Flare Configurations 37
11 View from Tracking Station of Self-Suspended Flare Flight Test Site at Hurricane Mesa 38
12 Composite View of Hurricane Mesa Trajectory and Impact Terrain from Boresight Camera 39
13 Hurricane Mesa Launch Site Arrangement 40
14 Top View of Flare Launcher 41 r 15 Tracking Camera Arrangement 42
16 Desired Live Flare Behavior 45
17 Typical Live Flare Behavior 46
18 Spinning Wind Tunnel Model Installation 50
19 Spinning Wind Tunnel Model Internal Components 52
20 Typical Idealized Self-Suspended Flare Trajectories - Nonburning 58

LIST OF FIGURES (Continued)
Figure Page
21 Typical Frisbee Trajectory Simulation Results - Position 59
22 Typical Frisbee Trajectory Simulation Results - Orientation Angles 60
23 Simulated Trap Range Flight of Clay Pigeon - Position 61
24 Simulated Trap Range Flight of Clay Pigeon - Orienta- tion Angles 62
25 Typical Simulation Results for Cliff Toss of Clay Pigeon - Position 64
26 Typical Simulation Results for Cliff Toss of Clay Pigeon - Orientation Angles 65
27 Simulated Hurricane Mesa Trajectory for 12-Inch, 12-Pound Dummy Flare - Position 66
28 Simulated Hurricane Mesa Trajectory for 12-Inch, 12-Pound Dummy Flare - Orientation Angles 67
29 Simulated Hurricane Mesa Trajectory for 8-Inch, 5-Pound Dummy Flare - Position 68
30 Simulated Hurricane Mesa Trajectory for 8-Inch, 5-Pound Dummy Flare - Orientation Angles 69
31 Simulated Air Launch of 8-Inch, 5-Pound Dummy Flare - Position 71
32 Simulated Air Launch of 8-Inch, 5-Pound Dummy Flare - Orientation Angles 72
33 Typical Effect of Flare Mass Loss on Trajectory of Nonprecessing 12-Inch, 12-Pound Flare 73
34 Typical tiffect of Flare Mass Loss on Trajectory of Nonprecessing 8-Inch, 5-Pound Flare 74
35 Typical Effect of Thurst, Mass Loss, and Cavity Aerodynamics on Nonprecessing Flare Trajectory (8:1 Cylinder) 76
LIST OF FIGURES (Continued)
Figure Page
36 Typical Effect of Thrust, Mass Loss, and Cavity Aerodynamics on Precessing Flare Trajectory (8:1 Cylinder) - Position 77
37 Typical Effect of Thrust, Mass Loss, and Cavity Aerodynamics on Precessing Flare Trajectory (8:1 Cylinder) - Orientation Angles 78
38 Locus of Burnout Points for Typical Constant Altitude Self-Suspended Flare 80
39 Normalized Fall Distance for Self-Suspended Flare 82
40 Typical Trajectory for Flying Disks - 30 Degree Launch Elevation 86
41 Typical Trajectory for Flying Disks - 45 Degree Launch Elevation 87
42 Pitching Moment Coefficients for Typical Hollow Self- . Suspended Flare Shapes (Nonspinning) 102
43 Normal Force Coefficients for Typical Hollow Self- Suspended Flare Shapes (Nonspinning) 103
44 Axial Force Coefficients for Typical Hollow Self- Suspended Flare Shapes (Nonspinning) 104
45 Pitching Moment Coefficients for Typical Solid Self-Suspended Flare Shapes (Nonspinning) 105
46 Normal Force Coefficients for Typical Solid Self- Suspended Flare Shapes (Nonspinning) 106
47 Axial Force Coefficients for Typical Solid Self- Suspended Flare Shapes (Nonspinning) 107
48 Effect of Peripheral Speed Ratio on the Aerodynamic Characteristics of a Right Circular Cylinder 110
49 Effect of Cavity on Pitching Moment Coefficient of Baseline S'ilf-Suspended Flare Shape (Nonspinning) 114
50 Effect of Cavity on Normal Force Coefficient of Base- line Self-Suspended Flare Shape (Nonspinning) 115
LIST OF FIGURES (Concluded)
Figure Page
51 Effect of Cavity on Axial Force Coefficient of Baseline Self-Suspended Flare Shape (Nonspinning) 116
52 Effect of Angle of Attack on Pitch Damping 119
53 Idealized Pitching Moment for the Self-Suspended Flare 121
54 Wind Tunnel Model. Frisbee 124
55 Wind Tunnel Model, Clay Pigeon 123
56 Wind Tunnel Model. 8:1 Right Circular Cylinder 126
57 Wind Tunnel Model, 4:1 Spinning Model Assembly 127
58 Hurricane Mesa Photographic Instrumentation Arrange- ment 132
59 Impact Area and Tracking Grid 133
60 Typical Boresight Camera Flare Image Size 136
61 Typical Flight Test Trajectories for a Standard Inert Flare 138
62 Comparison of Typical Computer Trajectory Simulation with Flight Test Data 139
63 Typical Flare Positions Obtained from Terrain Matching 140
64 Typical Flight Test Trajectory for a Special Light Weight Inert Flare 141
65 Typical Live Self-Suspended Flare Trajectory. Shot 32 143
66 Typical Live Self-Suspended Flare Trajectories. Shots 27, 29. and 32 144
LIST OF TABLES
X
Table
1
2
4
5
6
7
8
9
10
11
12
Page
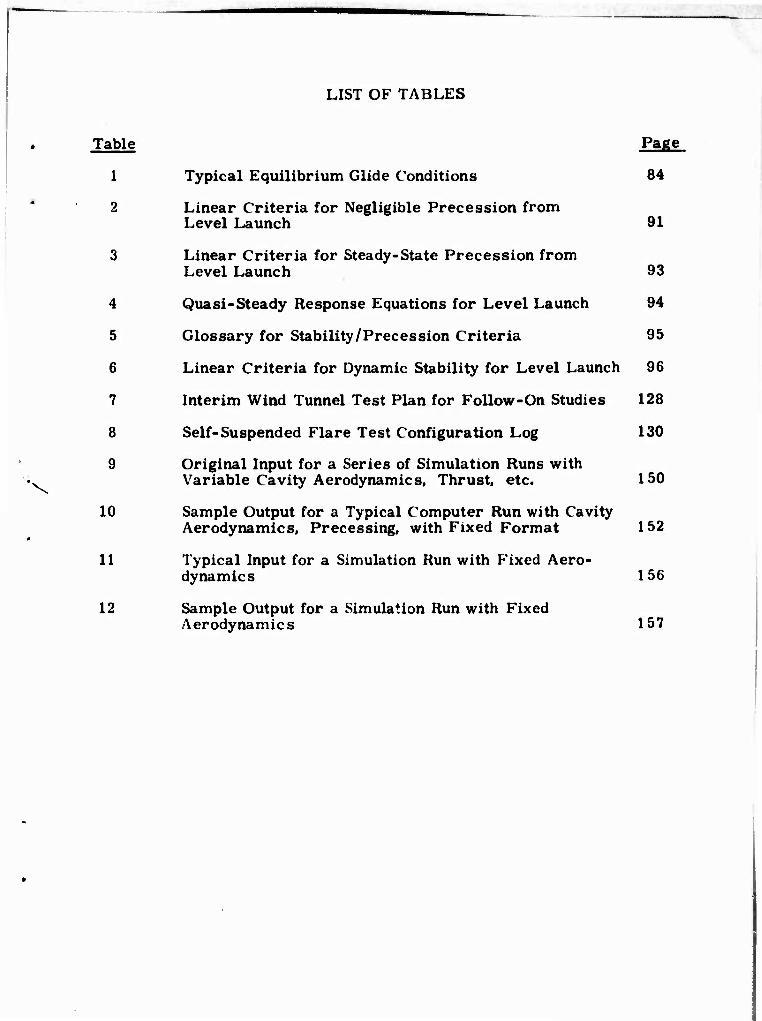
Typical Equilibrium Glide Conditions 84
Linear Criteria for Negligible Precession from Level Launch 91
Linear Criteria for Steady-State Precession from Level Launch 93
Quasi-Steady Response Equations for Level Launch 94
Glossary for Stability/Precession Criteria 95
Linear Criteria for Dynamic Stability for Level Launch 96
Interim Wind Tunnel Test Plan for Follow-On Studies 128
Self-Suspended Flare Test Configuration Log 130
Original Input for a Series of Simulation Runs with Variable Cavity Aerodynamics, Thrust, etc. 150
Sample Output for a Typical Computer Run with Cavity Aerodynamics, Precessing, with Fixed Format 152
Typical Input for a Simulation Run with Fixed Aero- dynamics 156
Sample Output for a Simulation Run with Fixed Aerodynamics 157
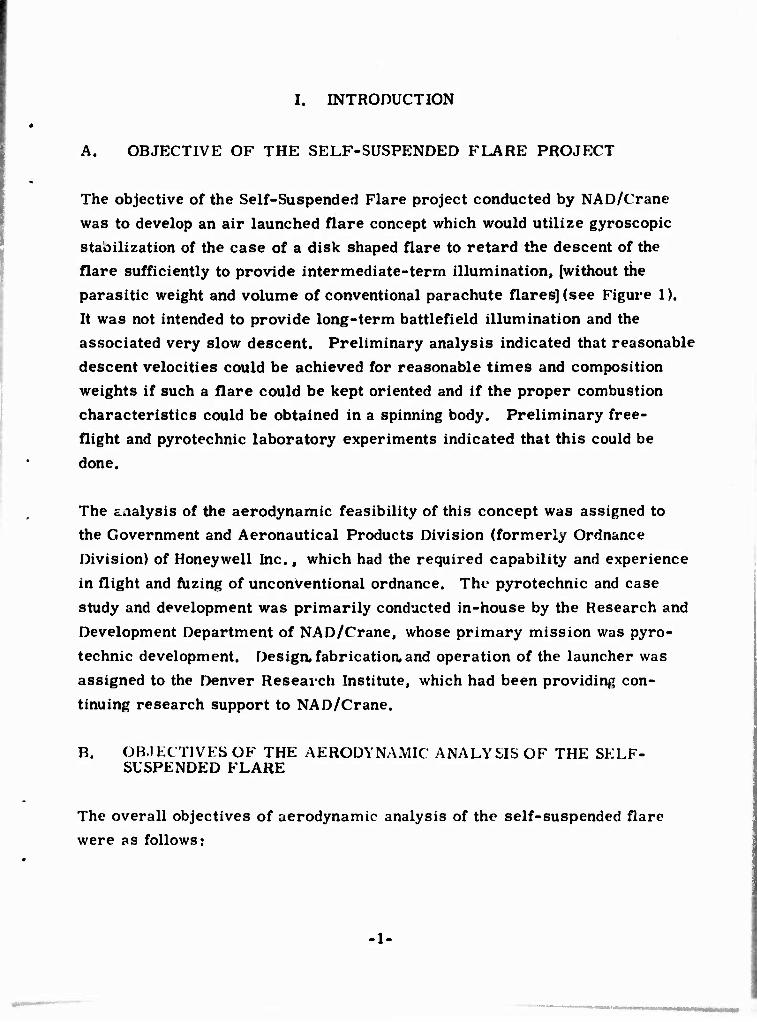
I. INTRODUCTION
A. OBJECTIVE OF THE SELF-SUSPENDED FLARE PROJECT
The objective of the Self-Suspended Flare project conducted by NAD/Crane
was to develop an air launched flare concept which would utilize gyroscopic
stabilization of the case of a disk shaped flare to retard the descent of the
flare sufficiently to provide intermediate-term illumination, [without the
parasitic weight and volume of conventional parachute flares] (see Figure 1).
It was not intended to provide long-term battlefield illumination and the
associated very slow descent. Preliminary analysis indicated that reasonable
descent velocities could be achieved for reasonable times and composition
weights if such a flare could be kept oriented and if the proper combustion
characteristics could be obtained in a spinning body. Preliminary free-
flight and pyrotechnic laboratory experiments indicated that this could be
done.
The analysis of the aerodynamic feasibility of this concept was assigned to
the Government and Aeronautical Products Division (formerly Ordnance
Division) of Honeywell Inc., which had the required capability and experience
in flight and fuzing of unconventional ordnance. Tht" pyrotechnic and case
study and development was primarily conducted in-house by the Research and
Development Department of NAD/Crane, whose primary mission was pyro-
technic development. Design, fabrication and operation of the launcher was
assigned to the Denver Research Institute, which had been providing con-
tinuing research support to NAD/Crane.
B. OBJECTIVES OF THE AERODYNAMIC ANALYSIS OF THE SELF- SUSPENDED FLARE
The overall objectives of aerodynamic analysis of the self-suspended flare
were as follows:

- _—.. -, .
PATH OF FLIGHT
. v.
Figure 1. Self-Suspended Flare Concept
2-

Establish by analytical means the aerpdynamic feasibility of the self- suspended flare concept.
Define the optimum aerodynamic configuration.
Obtain aerodynamic data for use in further developmem.
C. INTERIM GOALS FOR THE AERODYNAMIC ANALYSIS OF THE SELF-SUSPENDED FLARE
Because of the complexity of the task and the magnitude of the effort that
could have been required to guarantee achievement of these objectives,
compared to the time, funds, and flare combustion data available, interim
goals were identified which would both have a higher probability of success
and provide a firmer basis for planning of more extensive follow-on efforts.
D. SCOPE OF EFFORTS, AERODYNAMIC ANALYSIS OF THE SELF- SUSPENDED FLARE (CONTRACT N00164-69-C-0662)
The planned scope of the efforts directed at these interim goals, which were
considered compatible with the overall Self-Suspended Flare project
development status and funding level, encompassed the following major
tasks, in addition to the necessary coordination and documentation:
Trajectory simulation.
Nonspinning wind tunnel tests of three basic configurations (each to be solid and hollow).
Establishment of aerodynamic criteria.
As the Hurricane Mesa tests materialized, the coordination/liaison efforts
became more significant than normal.
On the basis of the preliminary results obtained and the concurrent scheduling
of relatively independent Hurricane Mesa tests, these tasks were informally
diverted, in concurrence with the NAD/Crane Project Engineer, to include
full scale participation in the Hurricane Mesa tests of November 1969.
3-
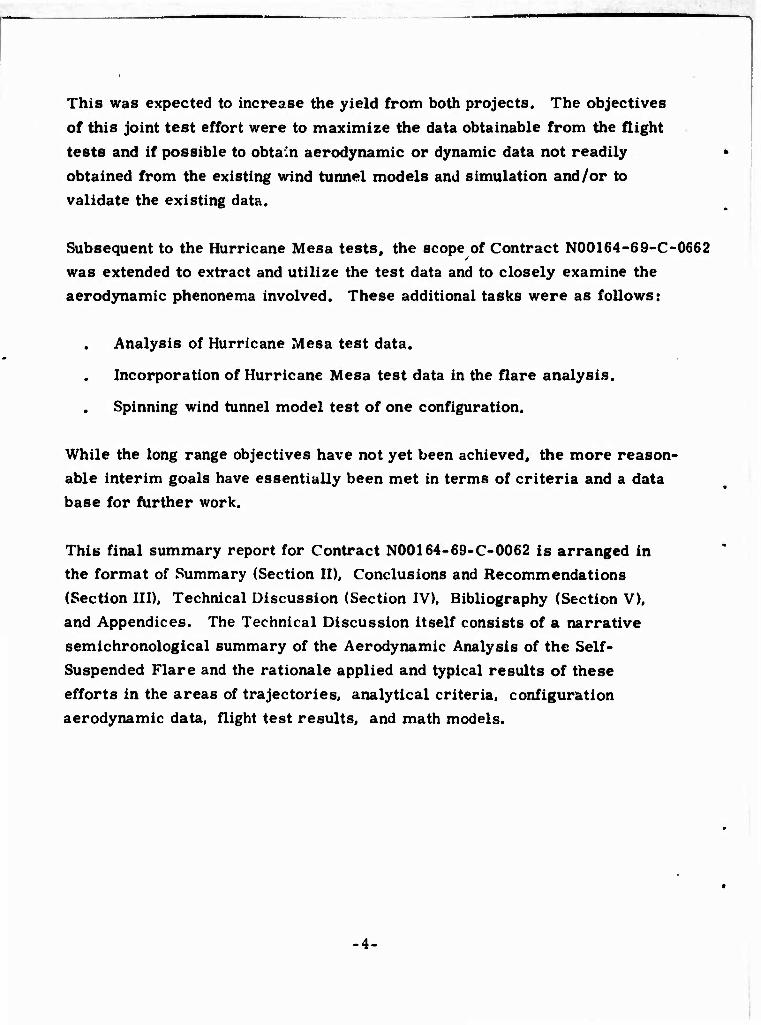
This was expected to increase the yield from both projects. The objectives of this joint test effort were to maximize the data obtainable from the flight tests and if possible to obtain aerodynamic or dynamic data not readily obtained from the existing wind tunnel models and simulation and/or to validate the existing data.
Subsequent to the Hurricane Mesa tests, the scope of Contract N00164-69-C-0662 was extended to extract and utilize the test data and to closely examine the aerodynamic phenonema involved. These additional tasks were as follows:
Analysis of Hurricane Mesa test data.
. Incorporation of Hurricane Mesa test data in the flare analysis.
Spinning wind tunnel model test of one configuration.
While the long range objectives have not yet been achieved, the more reason- able interim goals have essentially been met in terms of criteria and a data base for further work.
This final summary report for Contract N00164-69-C-0062 is arranged in the format of Summary (Section II), Conclusions and Recommendations (Section III), Technical Discussion (Section IV), Bibliography (Section V), and Appendices. The Technical Discussion itself consists of a narrative semichronological summary of the Aerodynamic Analysis of the Self- Suspended Flare and the rationale applied and typical results of these efforts in the areas of trajectories, analytical criteria, configuration aerodynamic data, flight test results, and math models.

II. SUMMARY
A. THEORETICAL DEVELOPMENT
The following are the accomplishments of the Aerodynamic Analysis of the
Self-Suspended Flare in theoretical development:
A relatively versatile trajectory simulation has been developed and typical results are presented herein.
Results correlate qualitatively with available free-flight tests and analytical solutions.
Preliminary analytical criteria relating aerodynamic, inertial, and delivery characteristics have been derived and correlated with the well-known flight of toy frisbees and the flight of clay pigeons on the range or tossed from Hurricane Mesa.
Key features for those devices are the hollow domed shape, light weight, and delivery orientation.
Cursory applications of the trajectory model to other ordnance delivery applications show promise for these applications.
The trajectory simulation is available for study of perfornance of ' inert disks or burning flares (linear burning, constant thrust).
The simulation permits the assumption of either steady gyroscopic precession under the aerodynamic moments, or gyroscopic rigidity, depending on the purpose of the study and the available data.
For the low burning pressures originally anticipated for the flare, the analysis indicated negligible effect on the aerodynamic forces.
B. TESTING
The following are the accomplishments of the Aerodynamic Analysis of the
Self-Suspended Flare in testing:
Preliminary wind tunnel tests have been conducted on typical solid and hollow candidate shapes and trends observed.
Configuration parameters warranting further wind tunnel test with existing techniques have been identified.
-5-
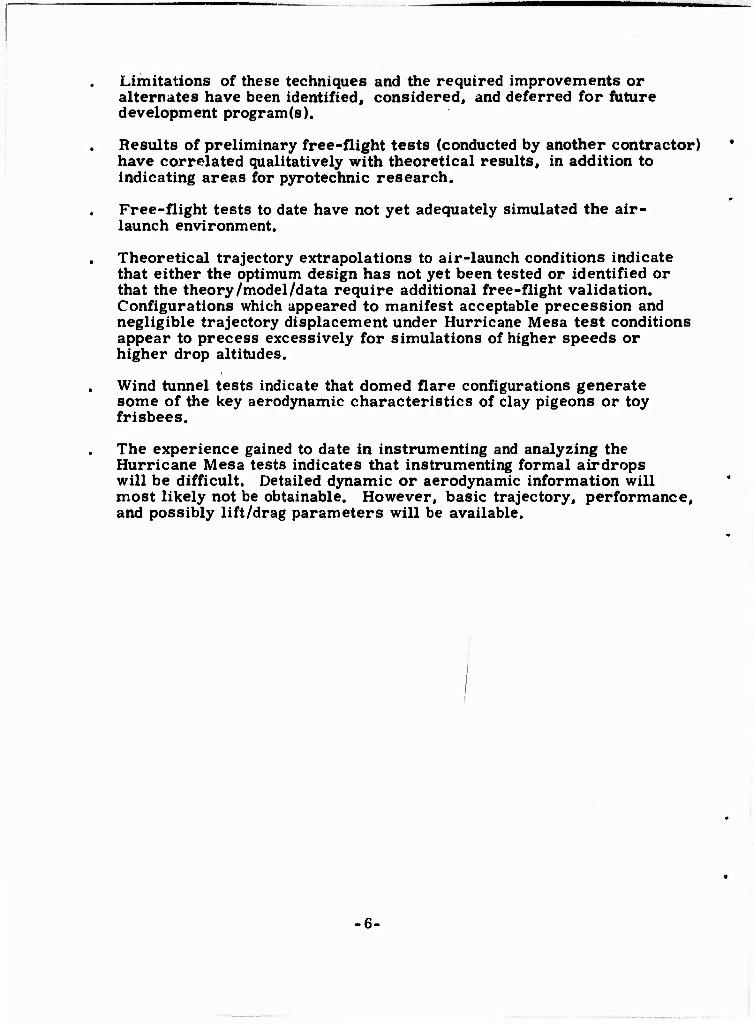
Limitations of these techniques and the required improvements or alternates have been identified, considered, and deferred for future development program(s).
Results of preliminary free-flight tests (conducted by another contractor) have correlated qualitatively with theoretical results, in addition to indicating areas for pyrotechnic research.
Free-flight tests to date have not yet adequately simulated the air- launch environment.
Theoretical trajectory extrapolations to air-launch conditions indicate that either the optimum design has not yet been tested or identified or that the theory/model/data require additional free-flight validation. Configurations which appeared to manifest acceptable precession and negligible trajectory displacement under Hurricane Mesa test conditions appear to precess excessively for simulations of higher speeds or higher drop altitudes.
Wind tunnel tests indicate that domed flare configurations generate some of the key aerodynamic characteristics of clay pigeons or toy frisbees.
The experience gained to date in instrumenting and analyzing the Hurricane Mesa tests indicates that instrumenting formal airdrops will be difficult. Detailed dynamic or aerodynamic information will most likely not be obtainable. However, basic trajectory, performance, and possibly lift/drag parameters will be available.
-6-
III. CONCLUSIONS AND RECOMMENDATIONS
A. CONCLUSIONS
The following are the conclusions of the Aerodynamic Analysis of the Self-
Suspended Flare:
Interim goals of establishment of trajectory models and aerodynamic requirements have been met and validated on typical configurations.
Adaptation to denser ordnance items could take either the course of configuration and delivery as scaled analogies to frisbee tosses with tilted domed, cupped configurations or by neutralizing the aerodynamic characteristics with relatively thick cylinders, or by a combination thereof.
Math models are available to perform preliminary application require- ment studies in parallel with the completion of feasibility/configuration efforts.
As may well have been expected within the scope of the program to date, insufficient data are yet available to conclusively establish concept feasibility or infeasibility and the optimum configuration required.
Such feasibility and configuration establishment will entail additional effort balanced between analysis, computer simulation, wind tunnel testing, pyrotechnic development, and free-flight testing of inert and live flares.
In view of some of the results and limitations of the aerodynamic studies to date, informal flight tests of typical configurations, at the earliest opportunity, would be extremely valuable to provide the following:
— Interim concept validation/configuration selection prior to committment to live flare demonstration.
— Validation of available math models and/or aerodynamic data.
— Identification of technical problems for both flare development and flight test instrumentation.
— Adequate emphasis in forthcoming studies between applications, flight dynamics, and pyrotechnic development.
B. RECOMMENDATIONS
The following are the recommendations for future development:
From the available data, the most promising configurations appear to be the 3:1 to 2:1 diameter-to-thickness ratio right-circular cylinder and the relatively thick domed/cupped clay pigeon-like shape, (see Figures 2, and 3) which also show some possible alternates.
Because of the interaction between aerodynamics and launch conditions, the choice of configuration and/or launcher design must take into account the importance of flare orientation at launch to provide desired steady-state glide characteristics.
The next step in flare development should be preliminary flight tests using available models (large 6:1 and 4:1 cylinders) and the most promising and easily made candidates such as 3:1 or 2:1 cylinders - small heavy cylindrical or clay pigeon shapes (perhaps ballasted actual or plastic clay pigeons),using the present launcher for the large models or a modified clay pigeon launcher for the small models.
The near-term subsequent steps in aerodynamic development should consist of the following:
- Systematic iteration of this family of configurations with the avail- able wind tunnel techniques and math models to separate effects of corner radii, thickness, and cavity.
- Extension of the aerodynamic criteria and math models as required.
- Instrumented flight tests for gross performance data whose nature would be partially contingent on the results of the informal flight tests.
- The development of improved wind-tunnel techniques should probably be deferred because of the complexity, time, and cost involved and the unknown effects, although a Magnus moment balance measure- ment should be obtained as soon as economically possible.
-8-
V«-ix = 0.05t -0.1t
RIGHT-CIRCULAR CYLINDER FOR LEVEL OR TILTED LAUNCH
DOMED/CUPPED FOR TILTED LAUNCH
Figure 2. Recommended Aerodynamic Configurations, Self-Suspended Flare
MAGNUS ROTOR
"OONUT"
FLIGHT ORIENTATION
LAUNCH ORIENTATION
DOMED DISK LAUNCHED ON EDGE
Figure 3. Possible Alternate Aerodynamic Configtu ations, Telf-Suspended Flare
10-

IV. TECHNICAL DISCUSSION
This section presents a description of the technical problems and/or the efforts directed at their solution, followed by presentation of the typical results of these efforts.
-11-
I
A. SUMMARY OF TECHNICAL CONSIDERATIONS AND EFFORTS
The efforts expended to date on the Aerodynamic Analysis of the Self-Suspended Flare have encompassed overlapping tasks of dynamic analysis, aerodynamic analysis, wind tunnel testing, and free-flight testing. The somewhat arbitrary distinctions are that the dynamic analyses meant trajectory and stability and
precession analyses utilizing the physical and aerodynamic coefficients for a
given configuration, or generation of analytical solutions. The aerodynamic analyses meant determining the aerodynamic coefficients of a given configura- tion from estimates based on theory, available data, or new wind tunnel data, and synthesizing promising configurations for further study. Wind tunnel
testing included the actual fabrication of models and wind tunnel testing and data reduction for static and dynamic aerodynamic coefficients. Since the contractor was not responsible for conducting free-flight tests, the flight test efforts included observation and photography of tests, recommendation of instrumentation and test conditions, and analysis of photographic data for trajectory parameters.
These efforts were directed toward the ultimate objectives of establishing
the feasibility of the concept and specifying the optimum flare configuration and delivery conditions. The relatively austere allowable scope of the effort,
especially as originally planned independent of flight tests, did not provide a guarantee that these objectives could be met in this phase of Self-Suspended Flare development. It was hoped, however, that the interim goal of estab- lishing aerodynamic criteria could be achieved.
These aerodynamic criteria would be intended to provide satisfactory flight behavior if and when met by some available future configuration/delivery combination. Of course, if it were then immediately obvious that such
criteria could never be met, then infeasibility would be indicated. The goals
of criteria establishment has been achieved and validated for familiar flying
objects, but the available data to not yet permit conclusions about the ability to meet them in practice with the Self-Suspended Flare.
-12-
The considerations and efforts will be described in a loosely chronological
narrative because of the considerable overlap, shifts in emphasis, and cross
interpretation involved.
1. Problem Identification/ Definition
The right-hand rule of gyroscopic precession means that if a torque is applied
to a symmetrical spinning object, the object will rotate steadily about an axis
at right angles to the axis about which the torque is applied. This rotation
will be at a rate proportional to the applied torque and inversely proportional
to the angular momentum about the spin axis. This steady-state rotation is
referred to as gyroscopic precession, and the steady-state rotations of the
flare will thus be referred to as precession in this report.
This right-hand rule ignores the transient accelerations of the spinning object
which usually have a negligible effect on the amplitudes of the motion for most
rapidly spinning bodies. The high frequency transients are quite frequently
referred to as nutations.
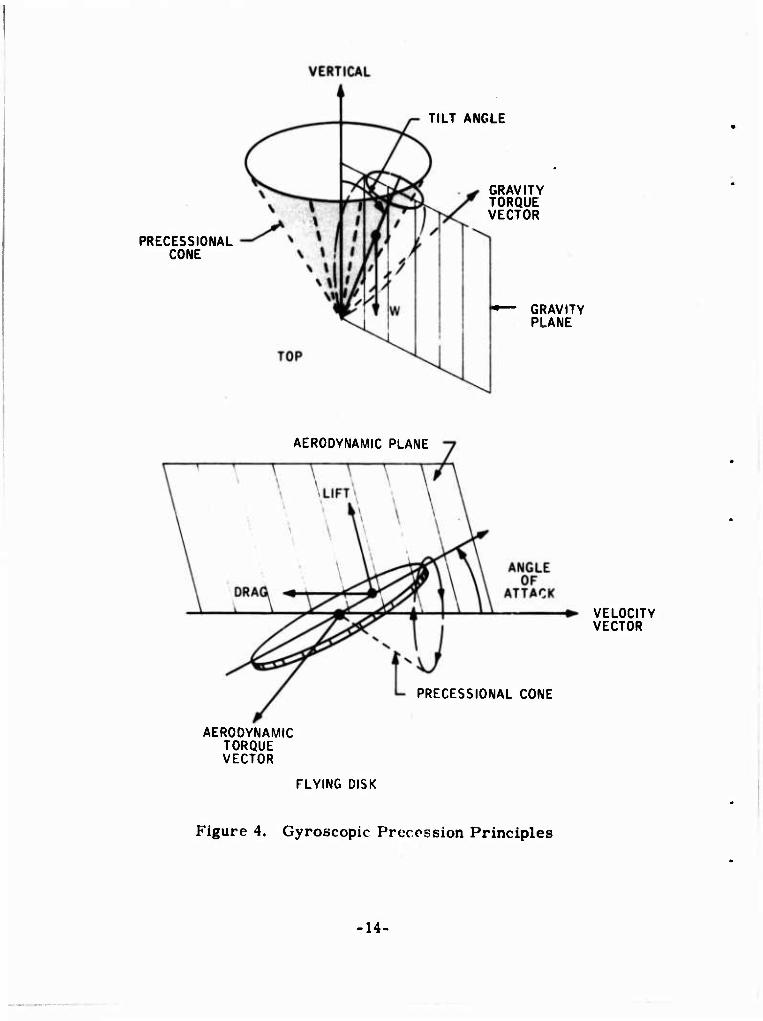
The gyroscopic precession of a top involves coning of the spin axis about the
vertical because the forcing moment due to gravity is always in the plane
which contains the vertical and the spin axis and which rotates with the spin
axis. Therefore, instead of tipping over at right angles to the torque, the
top keeps chasing the gravity torque. This plane could be called the gravity
plane (see Figure 4).
The gyroscopic precession of a disk flying roughly edge-on involves rolling
about the velocity vector because the aerodynamic overturning moment due
to an angle of attack with respect to the velocity vector is in the plane which
contains the velocity vector and the spin axis. It rotates with the spin axis
as it precejses about the velocity vector and maintains the angle of attack.
This plane will be called the aerodynamic plane (see Figure 4).
13-
PRECESSIONAL CONE
TILT ANGLE
GRAVITY TORQUE VECTOR
GRAVITY PLANE
AERODYNAMIC PLANE
VELOCITY VECTOR
PRECESSIONAL CONE
AERODYNAMIC TORQUE VECTOR
FLYING DISK
Figure 4. Gyroscopic Precession Principles
14-
Because the disk in free-flight is "suspended" at its center of gravity, it
does not have a corresponding moment due to gravity which would directly
cause the more desirable coning about the vertical.
Both of these effects can be demonstrated with toy or laboratory gyroscopes
which are suspended by the end of the spin axis or at the center of gravity,
respectively. It was recognized that in addition to any initial inclination to
the velocity vector, the curvature of the path under gravity could impose an
additional angle of attack leading to roll precession.
Somehow, toy frisbees and clay pigeons have been able to bypass this appli-
cation of the right hand rule of gyroscopics. This was apparently attributable
to the cupped shape of these objects or to some di'iedral-like response to
sideslip caused by tilting. Therefore the problem was to determine if this
behavior could be identified and extrapolated to an initially solid body launched
at high speed for a finite flight time.
2. Technical Approach
The approach to dynamic analysis of the flight of the flare is the standard one
in flight dynamics; separation of the slowly varying parameters which define
the trajectory from the higher frequency motions or oscillations about the
trajectory. The trajectories would then be calculated by digital simulation,
while the motions of the body with respect to the trajectory would be treated
by stability/response analytical solutions at selected points on the trajectory.
If insufficient data were available to quantitatively predict the stability/ response of a specific case, the analysis would take the form of stability/
response criteria to be met by the missing data for satisfactory behavior.
The two separated motions could later be combined in a 6-degree-of-freedom
simulation if desired.
The separation was necessary and reasonable because the spin rate introduces
nutational motions, normally excited by impulsive inputs, with frequencies
15-
on the order of twice the spin rate. This frequency would call for fantasti-
cally large amounts of computer time for the flight times involved, and the
simulation would fail if complete aerodynamic data for a stable body were
not provided. By the same token, the high frequency motions would normally
have such low amplitudes for a stable body that they would have negligible
effect on the trajectory. T'.e latter observation was validated by the stability
analysis.
These dynamic analyses would draw on aerodynamic data as available from
literature, theoretical estimates, and wind tunnel tests of representative
configurations. To serve as a starting point, the configurations selected for
initial study were a 16 inch diameter, 2 inch thick right circular cylinder
yielding an 8: 1 diameter to thickness ratio, and solid and hollow versions of
the familiar clay pigeon and the toy frisbee.
This cylinder at that time appeared to be the prime candidate for tactical
deployment. The frisbee and clay pigeon presented possible variations in
corner radius and thickness from the cylinder, which, of course, was
expected to be the preferred shape for pyrotechnic design. Since they were
part of the inspiration of the concept and their flight characteristics were
supposedly well-known, the results obtained were expected to assist in
validation of the techniques developed for the Aerodynamic Analysis of the
Self-Suspended Flare.
Initially, the approach did not include formal flight testing because launcher
design and operation was the responsibility of another contractor and the
schedule was not necessarily compatible. As the study proceeded, this
launcher became available and the level of the aerodynamic contractor'^
participation in the testing increased. This division of responsibility limited
the in-house "flight test" to observations of informal clay pigeon and toy
frisbee flights. In retrospect, a parallel program of more formal in-house
small scale flight tests would have been valuable if the scope and funds had
permitted.
16-
3. Aerodynamic Force. Moment, and Axes Definitions
The aerodynamic coefficients presented in this report are defined in terms of
the aerodynamic axis systems and Figure 5 (and nomenclature of Appendix B).
The aerodynamic axes have their origin at the center of gravity of the disk
and are expressed in terms of the aerodynamic plane in a manner somewhat
analogous to symmetrical projectiles, except that the disk is considered at rest or at zero orientation and angle of attack when edge-on. Because of
rotational symmetry, this aerodynamic plane is independent of arbitrary
transverse axes of the body. The aerodynamic plane is defined to be the
plane containing the positive spin axis (designated Z.) and the velocity vector.
The aerodynamic roll axis, (X*) is perpendicular to the spin axis in this
aerodynamic plane. The aerodynamic pitch axis, (Y.) then completes the
right-hand rule triad of axes. X. and Y. may be considered to define the
disk plane.
The aerodynamic plane corresponds to the pitch plane as the disk is tilted in
the wind tunnel for measurements of forces and moments. The angle of attack, ir-, is defined as the angle between the velocity vector and the disk
plane (or X- axis) measured in the aerodynamic plane perpendicular to the
disk plane. The aerodynamic forces expressed in standard body axis form
for projectiles or missiles are the axial force A, parallel and opposite to
the X- axis, while the normal force, N, is normal to the disk plane and
parallel and opposite to the positive spin axis. The normal force may be
considered to act at the center of pressure, which is X forward of the cp center of gravity along the X. axis.
The velocity axis forces, lift (L) and drag (D) are, as usual, perpendicular
and parallel respectively to the velocity vector in the aerodynamic plane. L and I) or N and A can be resolved back and forth as most convenient, but
the present day integral wind tunnel balances are parallel and perpendicular
to N and A and give them more directly.
-17-
LIFT FORCE AND COEFFICIENT NORMAL FORCE AND COEFFICIENT
AXIAL FORCE AND COEFFICIENT
AERODYNAMIC PLANE
Figure 5. Aerodynamic Axes, Forces, and Moments
18-
If there were a side force (Y), which would have to be due to spin for these disks with axes of symmetry, it would be defined as parallel to the aero-
dynamic pitch axis, Y.. This force has been ignored so far but could
become significant. It would be expressed in the Magnus force coefficient
form (CY ) with the coefficient a function of the angle of attack. tu
The pitching moment (M) is considered to be a torque/couple in the aero-
dynamic plane or a torque vector along the positive Y. axis, positive over-
turning. In addition to the static moment, MT(a), due to the angle of attack
of the disk, the pitching moment description includes a damping moment
(M(Q) = MQ Q.) due to an angular rate about the Y. axis. This pitch damping
moment is also a function of the angle of attack. The effect of the spin on the pitching moment is considered negligible.
The standard aerodynamics/ballistics approach to expressing^the aerodynamic
forces and moments in terms of shape dependent dimensionless coefficients
which are independent of size and mass and velocity (except as dependent on
Mach number or Reynolds number) has been followed here. The wind tunnel
data are all presented in this form. The reference area for this process has 2
been taken as the disk "cross-sectional" area (S = n r ) in square feet and
the reference length as the diameter (d) in feet. Defining the dynamic pres-
sure as q, the force coefficients,of the form C«, and momenv coefficients,
of the form C^, are related to their respective forces (F) and moments (M) by the following typical expressions:
CF - F/qS
CM = M/qSd
_ 2 where q ~ 1/2 nV (pounds per square foot)
o = atmospheric density (slugs per cubic foot)
-19-
These coefficients which depend on angular rates are further defined in a
standard form of dimensionless angular rate in the form
^M TOUT"
The rolling moment ^ is defined about the aerodynamic roll axis X., which forms the intersection between the disk plane and the aerodynamic plane. It
is considered to be made up of a static moment due to spin and angle of attack, called the Magnus moment, and the roll damping due to roll rate P. about
the aerodynamic roll axis. The Magnus moment coefficient is normalized to spin rate in the from C* , which is itself a function of angle of attack, and
the roll damping is of the standard form C. . These coefficients, as is the 'p
pitch damping, are made.dimensionless by the standard aforementioned approach of normalizing them to the dimensionless pitch, roll, or spin rates (or reduced
frequency)-QAd/2V, PAd/2V, ud/2V. In the case of roll, the parameter is
sometimes called the equivalent roll helix angle, and for spin it is usually
called the peripheral speed ratio and sometimes expressed as (V /V). The use of the d/2 in these reduced frequencies reflects both aircraft practice in
the case of the roll helix angle and the relationship of the Magnus effect or airfoil circulation to the surface velocity. However, many ballisticians do
not use the factor of 2 in their definitions, so that care must be taken in comparing and or using data from different sources.
The yawing moment 67V is defined about the positive spin axis Z., and, in this case, is considered to consist of any spin torques. For a symmetrical
disk with no driving vanes, the aerodynamic torque coefficient would consist
of only the spin damping coefficient (C ). No data are available on the
actual magnitude and angle of attack dependence of this coefficient since its
effect was undetected in tests so far. Ff there are aerodynamic driving torques, these would be expressed as C
o
20-
Spin torques and/or jet damping due to the flare exhaust would require special
definitions tailored to the assumed characteristics (usually related to thrust
and/or mass flow rates).
The inertial and dynamic axes used for analysis of the flight dynamics will be
presented in detail in Appendix B.
In this report, the word camber will be used to refer to the curvature of the centerline of a cross section of the disk. In airfoil theory, the characteristics
of a basic finite thickness symmetrical airfoil may be considered to be super- imposed on the effects of the curvature and orientation of an infinitesimally
thin (or flat plate) airfoil. Most low-speed aircraft have thick airfoils whose camber is at least sufficient to provide flat lower surfaces, while in the
Wright brothers aircraft the wings were essentially cambered flat plate air-
foils.
4. Trajectory Simulation Development
On the basis of the separation of the high frequency dynamic motions from
the slow precession and linear velocities defining the trajectory, a quasi- steady math model and digital computer program were developed to simulate
flare trajectories. This program allows for gyroscopic precession under
the aerodynamic moments and translation under the aerodynamic forces experienced as a function of angle of attack, spin, and angular rates.
The forces are considered radial (axial) and normal to the disk, and the
moments are considered to be either overturning (pitching) in the aerodynamic plane or rolling about a radial axis in the plane. The program allows for spin decay under air friction. It allows for linear decrease of mass with time, but this linearity could easily be modified for a nonlinear rate. The
mass is assumed to be lost from the inner surface of an annulus of pyro-
technic. The aerodynamic forces and moment coefficients defined in
-21-

section I.A. 3. may be tabulated as a function of the cavity radius of this annulus for four values of cavity radius, or as one function representing a solid body or a burning body with negligible change in aerodynamics.
The aerodynamic forces and moments are assumed to by symmetrical with respect to the aerodynamic plane containing the velocity vector and the spin axis, except for the Magnus moment which is the rolling moment induced by the interaction of spin and the airflow. At the present time this Magnus rolling moment coefficient is assumed to be a parametric fraction of the
pitching moment coefficient. The fraction KM can be varied, or, in effect,
the aerodynamic plane could be considered to be rotated slightly by the spin.
The program can be commanded to simulate a nonprecessing constant attitude trajectory. This permits definition of desired reference trajectories, and in this mode the aerodynamic moments do not have to be known or assumed.
A truncated version of the nonprecessing trajectory simulation has also been used for special in-house preliminary studies on a teletype console time shared computer. The unpublished special program in the PACTOLUS
language was expected to be useful for remote operation from Hurricane Mesa, but the phone lines/party lines would not have permitted it. Its use was
inspired by the apparent negligible precession in the first series of Hurricane Mesa tests.
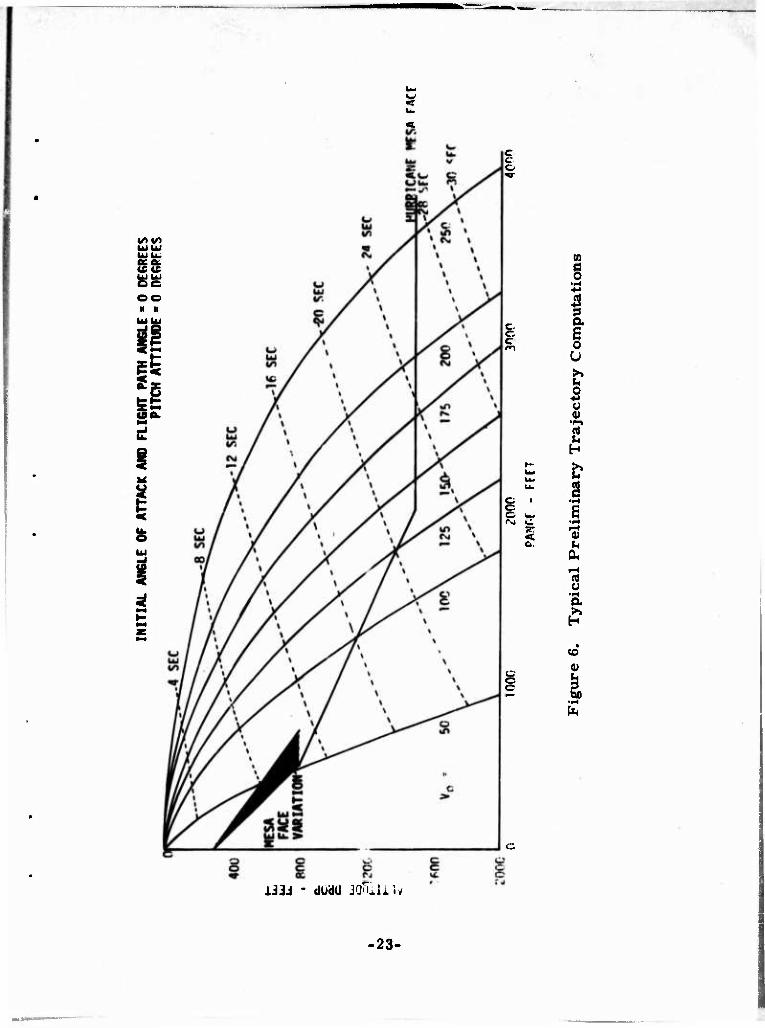
A sample of some early trajectories used in examining the initial Hurricane Mesa tests and planning later tests is shown in Figure 6. The shaded area indicates possible variability in the Hurricane Mesa face at impact. Agree- ment was considered reasonable at that stage of development for the 50 foot per second launcher. The figure indicated that it would require a 150 foot per
second launch velocity to utilize the maximum vertical drop available at Hurricane Mesa.
22-
«/>«/1
gg oo II II
UlUt
I too.
E!
I
I
c.
I
I a
Ü
I SI
H 1— b u. s
o 1 •a g w | »■vj C •-H
•zr. l-l
§ 0)
I
iJ3i - d0d(J JOniUlrf
23-
5. Preliminary Flight Dynamics Analyses
Trajectory simulations and analytical solutions were used to study the flight dynamics of the flare. These invest)gationG involved primarily planar tra- jectories for flares which were assumed not to precess, and which, therefore, required only lift and drag force predictions; and studies of precessing bodies with available aerodynamic moment data. The studies were initiated with estimated data, and measured data were used as they became available.
Some interesting and worthwhile effects were observed in these early planar analyses and exploited or observed physically in subsequent investigations. It was found that the orientation of the disk (held constant) was the dominant influence in determining the terminal flight behavior, rather than the initial flight path direction. There was little difference for a level disk whether tossed level, upward, or downward, but if tipped, there was a significant difference. If tipped edgedown, it would travel farther than the level, and, if tipped edgeup, it would go less far or even ccme back. This can be observed for frisbees and clay pigeons also. There appeared to be some optimum orientation for gliding rather than falling, and, in one case, it appeared capable of keeping up with the launch aircraft. Disks rolled to the right would eventually reach a straight glide path to the right.
The effect of the different actual angle of attack histories on a freely precess- ing disk is another problem. The response of disks permitted to precess was disappointing in these early studies,especially with preliminary aero- dynamic estimates which turned out to correspond to unrealistically thin disks. The disks would precess in roll, eventually reaching a vertical orien- tation which eliminated the angle of attack. While quite nonlinear, the rapidity of precession increased with launch speed and decreased with spin or inertia.
The most baffling results were those preliminary results obtained with pre- liminary clay pigeon data, since, although no one was sure that a disk would fly aside from the limited Hurricane ',; a tests, a clay pigeon does success- fully fly.
-24-

An attempt was made to match the significant parameters of a typical trap
range trajectory using photo data on velocity and spin, but the initial pre-
cession under the unsymmetrical moment and the precession and travel at
impact at first did not appear to be consistent with the clay pigeon's reputa-
tion of successful flight. Of course, the most experienced observers of clay
pigeon flight were the least likely to have observed a large number of com-
plete trajectories, and the launch dispersion, wind effects, and lack of quan-
titative historical data marie it impossible to define departure from the launch
plane at impact. As a matter of fact, calculated path departure was within
the realm of reasonable dispersion. Later results (in section IV. B. 1)
showed a reasonable precession history.
As a means of checking the simulation results, examining dynamic stability,
and possibly obtaining design criteria, the equations of motion were linearized
and a solution attempt was made for stability roots and/or dynamic response.
These early and limited analytical studies validated the assumption of motion
separation used in the trajectory analysis. They also appeared to validate
the predicted roll precession of right circular cylinders using estimated and wind tunnel data by identifying the primary forcing function of gravity but not
any compensating stabilizing terms. They did not correlate with the well-
known behavior of frisbees and clay pigeons and the apparent behavior of the
dummy flares at Hurricane Mesa. The latter, however, changed direction
and velocity far outside the bounds of the linear analysis and, of course, were
considerably thicker than the configurations for which data were available.
The preliminary analytical solutions indicated that the Magnus (rolling)
aerodynamic moment due to spin was a stabilizing influence so that perhaps
this was much greater than anticipated. They also indicated that the smaller
the pitching moment, the better, so that perhaps the pitching moment was
much lower than measured without spin. The preliminary analytical solutions also did not appear to properly account for the effects of the camber of the
clay pigeon and frisbee shapes.
These preliminary analytical solutions were later extended to obtain criteria
which did account for and explain these camber effects, which correlate
-25-
with observed behavior, and which serve as guidelines for future efforts
on the Self-Suspended Flare. These criteria are presented in section IV. B. 2.
6. Fuzing Investigations
As an aid to planning both aerodynamic and flare and fuze design activities/ requirements, a cursory examination was made of potential fuzing concepts. The goal was to provide ignition at the optimum altitude with a preset sealed
device that did not require setting at launch. The preferred approach at NAD/Crane at the outset was to calibrate spin decay with altitude loss from launch. However, because of indications that this might not be a valid fuzing
signature, other concepts were examined. Concepts examined and discussed
with the Project Engineer included the following:
Spin decay (settable) - arming by a combination of spin velocity and spin acceleration, and firing by spin decay.
Mechanical pyrotechnic delay (settable in six increments) - arming by a borerider pull pin and spin velocity, and firing by pyrotechnic delay.
i
Barometric pressure (settable or preset) - arming by spin and differ- ential dynamic pressures, and firing by barometric pressure.
These concepts were not carried beyond the conceptual stage, but helped to
focus mutual attention on requirements, constraints, possible approaches, and the aerodynamic contractor's capability for providing or developing what-
ever type of fuzing device might be required at any stage of Self-Suspended Flare development, from experimental to production.
7, Aerodynamic Investigations
Relatively unsuccessful literature searches were made to obtain aerodynamic
data on flying disks. The only one obtained from a DDC search, an Israeli
report,, concentrated on the purely rotational stability theory, with results
corresponding to those of the writer, but it neither included the translational trajectory/gravity effects nor offered aerodynamic data. A paper was
26-
discovered through word-of-mouth on the lift and drag of the discus which
included another application of the optimum initial orientation phenomenon.
As the Aerodynamic Analysis of the Self-Suspended Flare progressed, some
college professors indicated informally that their students had made un-
published wind tunnel tests on frisbees with conventional external balances.
The available data had varying amounts of correlation with that obtained in
this study. One case showed the only spin effect to occur at a very high spin
rate, with a sudden spike in the data which does not correspond to any of the
usual spin scaling parameters except apparently the critical Reynolds number
for that specific condition.
A few references were found on thin disks and/or cylinders. From the
available data base, surprisingly good estimates were made in order to
initiate the dynamic analyses and to make the wind tunnel tests, which would
be the prime source of quantitative data, more meaningful.
When completed, these wind tunnel data were scrutinized and estimates
updated to cover configurations of interest for which tests were not avail-
able. These scrutiny/estimates picked up the trends of the effects of thick-
ness and corner radius leading to synthesis of new candidate test configura-
tions expected to bracket the desired effects. While the effect of detailed
corner radius on basically cylindrical bodies was not yet isolated, there
seemed to be a definite effect of thickness and of gross corner radius.
A brief study was made of the effects of flare plume on the aerodynamics.
With the magnitudes of flame pressure and temperature supplied by NAD/
Crane, this analysis indicated that the flare plume would have a negligible effect on the aerodynamics. The aerodynamic characteristics would then
correspond to the equivalent hollow cool body. It was considered desirable
to conduct a more detailed study at some future date, but such a study was
beyond the scope of this project.
An example of the aerodynamic data obtained or extrapolated is shown in
Figure 7. More detailed results are presented and discussed in section
IV. B. 3.
-27-
+ OVER TURNING
.241-
THIN DISK FRISBEE/PIGEON
6" CYLINDER (4/1) -PROPOSED IDEAL
- TUCK UNDER
Figure 7. Pitching Moment Coefficient for Typical Self-Suspended Flare Configurations
• 28-
8. Preliminary Hurricane Mesa Tests
"tear the outset of the aerodynamics analysis, a preliminary investigation
cf the use of Hurricane Mesa for free-flight tests was conducted by NAD/
Crane and the Denver Research Institute. Although remote, this site offered,
in addition to sheer drops, the availability of electrical power, shops, dark
room, launch and camera stations, access to both top and impact areas, and
a sled track.
Dummy flares representing right circular cylinders 12 and 8 inches in
diameter and 2 inches thick and expected flare density were launched at
maximum velocity and spin and primarily in a level orientation. One was
launched with the launcher rolled abou* 15 degrees. The trajectories were
quite repeatable and, in general, correlated well with computer calculations
for nonrolling flares within the limits of the site survey data available.
One-half pound,4-inch disks were not correlated because the launches were
not repeatable. They were more subject to the winds and were not used
in later tests.
The dummy flares did not appear to roll any significant amount. Computer
predictions with estimated data based on thin disks and later with measured
data for an 8:1 diameter-to-thickness disk (section IV. B. 3. ) indication a
relatively severe amount of rotation, as did the available linear theory.
This apparent lack of correlation provided a strong incentive for the later
detailed free-flight and wind tunnel testing. With hindsight, the differences
could be largely attributed to the differences in thickness assumed in the
computer studies and that actually flown. The wind tunnel model was for
an 8:1 diameter-to-thickness ratio, the 8-inch dummy flares were 4:1, the
12-inch dummies were 6:1, and the first coefficient estimate was for essen-
tially infinite ratio.
-29-
9. Nonspinning Wind Tunnel Tests
During the early planning of the analysis, it was anticipated that the flare
could possibly be exhausting from both the top and bottom of the grain cavity, so that the aerodynamic configuration would be an annulus with increasing hole size (doughnut), rather than an inverted cup with increasing bottom
cavity diameter as was actually the preferred configuration.
Support of either a spinning annulus or a hollow cup on a wind tunnel sting was considered beyond the scope of the project. Best estimates were that
the spin-dependent aerodynamic terms were not large enough to justify the
expense involved in devising fixtures to measure them. Thus, the decision
was made to perform initial studies with nonspinning models in order to maximize the number of configuration variations examined.
The other consideration in wind tunnel fixture design was the necessity to place the "center" of the strain gage balance as close as possible to the
center of the model to maximize sensitivity to the forces and moments. This could not be done with an internal balance on hollow models. Therefore, a side mount was used to place the pitch measurement gages in line with the
pitch axis. This would also make it easier to cover the full range of 0-90 degrees in angle of attack.
A typical mount is shown in Figure 8. In this case the complex clay pigeon configuration was obtained by plastic molding. The other models, the right circular cylinder and the frisbee shape, were machined from aluminum.
The results of these tests correlated fairly well with each other and with
preliminary estimates and with some available discus data. The most
severe disagreement with preliminary estimates was in a favorable direction. The center of pressure of the thin disk was assumed relatively far forward so that the estimated pitching moments were considerably larger than those
measured. The more airfoil-like bodies had a more pronounced stall-peak
30-
\
r'igurc 8. 'I'ypicaJ In.-tallution (Sjdcwall Mount), Witrl Tunnel Tt'.st.s
31

on both normal force and pitching moment than did the cylinder, but all had similar trends before and after stall. As expected, from conventional airfoil practice and theory, the cambered (domed) clay pigeon and frisbee had a definite shift of the symmetry of the moment curves so that the aerodynamic pitching moment was zero at a finite angle of attack rather than at zero. The hollow counterparts had more pronounced reductions of moment and greater shift of the moment curve intercepts.
A spring restrained oscillatory side mount fixture was used to examine aerodynamic pitch damping. The damping coefficients were quite small and of questionable sign. Therefore, the results may have been masked by the nonlinear hysterisis type instability often displayed by thin disks in free oscillation in response to separation from the body itself or to flow turbulence.
While the side mount provided measurement sensitivity advantages, it also introduced the problem of flow interference, both external and internal (for hollow models). The internal interference could have caused the measured moments to be too high and therefore conservative. The interference also could have caused drag results to be too high, since the lift-to-drag ratio appears to be 15 - 20 percent too low to correspond with informal flight observations.
10. Interim Investigations
As a result of the apparent inconsistencies between preliminary free-flight tests, analytical solutions, and simulation results with available nonspinning wind tunnel data, it was concluded that either there was a greater spin dependence of the aerodynamics than anticipated, causing a drastic reduction in overturning moment, or there was a stabilizing aerodynamic mode ignored in the simulation.
A short exploration of this problem area and of approaches to the solution was undertaken. This included observation of a smoke tunnel flow, observation
-32-
of and consideration of instrumentation of three-degree-of-free dorn wind tunnel motion« investigations of fixture designs for wind tunnel measurements of spinning models, and consideration of free-flight approachei.'. These brief explorations were undertaken at Honeywell and through consultation at Notre Dame. Consideration was also given to magnetic suspension at MIT.
The Notre Dame smoke tunnel flow over a spinning clay pigeon (Figure 9) showed a considerable degree of three dimensional effect, and indicated some slight variation with spin, but not enough to represent a drastic reduction in pitching moment from that of a nonspinning body. Three-degree-of-freedom observations of symmetrical disks on Notre Dame's jewel bearing and Honeywell's gas bearing displayed unexpected levels of attitude stability with slow coning which do not agree with linear theory and could be attributed to mass unbalance or the sought for neutral overturning moment.
This three-degree-of-freedom behavior indicated that it might be feasible to support a model for 3 degree-of-freedom tests, but the computer program required to extract the aerodynamic coefficients was not available and would require time and expense to develop. The programs available at that time assumed solutions for quasi-symmetrical bodies such as projectiles and missiles with spin axes near the velocity vector and which have symmetrical differential equations. Because these symmetrical equations assume com- parable aerodynamic stiffness for both angular rotations of interest (pitch and yaw), they are not applicable to gliding disks (pitch and roll) or gliding flettners (yaw and roll) in which there is no aerodynamic moment due to roll. They would be applicable to flight with the flare broadside to the flow, how- ever.
Concurrent discussions with Notre Dame regarding free-flight techniques brought out some of the difficulties and possible approaches to motion simu- lation and data extraction. The value of light weight models for amplification of dynamic motions to assist in instrumentation was emphasized.
33-
Angle of \tta« k - 10 1 it-pn Spin liate = 200 rpm
\nel«' of \tta< k ■ 10 l)< _.•• "pin H.iU 0 rpi:
I icur pi. .t 1 N: ' K> I ;nri< 1 1 • ' ■ ■ ■• ■•.■.._ i I r. I 'IL'« i n
-:\-
The effect of the support on three-degree-of-freedom data is another area of concern. Discussion of magnetic wind tunnel support systems with Dr. Covert of MIT indicated that present systems would necessitate small (quarter/half dollar sizes) models, and additional development of teat data extraction techniques would be required to obtain six-component data from spinning models.
From these investigations, it appeared that the least additional time and cost would be required for a plan involving free-flight tests and aerodynamic data extraction at Hurricane Mesa, because a basic project and equipment were already well underway, and a six-component wind tunnel test of a spinning solid cylinder model, because, if successful, quantitative data would be directly measured to define the effect of spin on the overturning moment. The technique proposed would increase the sensitivity of pitching moment measurements.
Subsequent adoption of this interim plan resulted in project redirection to participate in the Hurricane Mesa tests, reduce the test data, build and test a spinning wind tunnel feasibility model, and incorporate the results in the dynamic analysis of the flare behavior.
11. Hurricane Mesa Tests
In conjunction with the NAD/Crane Project Engineer, it was concluded that the most expedient approach within the available time and funds would be to attempt to extract dynamic motion and/or aerodynamic data from the Hurri- cane Mesa free-flight tests which were already scheduled for live flare tests and formal recording of nominal trajectories. This approach would involve addition of special models and test conditions and additional instrumentation. The aerodynamics contractor contributed planning knowledge, data require- ments, equipment and personnel to these augmented experiments and instru- mentation.
•35-

The tracking station cameraman employed by the aerodynamics contractor had several years of experience as a cameraman at Hurricane Mesa. The aerodynamics principal investigator made on-site observations of all tests and provided selection and modifications of the special configurations. These on-site observations and experiment selections based on early behavior observations were more useful than the preplanned aerodynamic experiments and quantitative data, as often turns out to be the case.
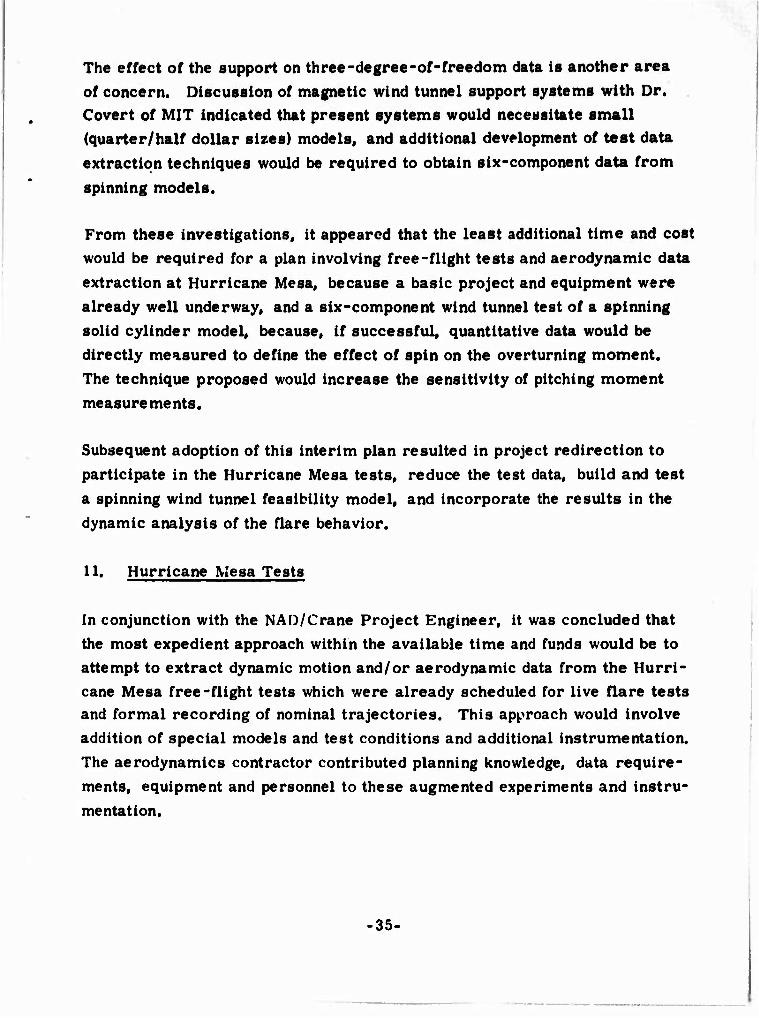
The tests were conducted in November 1969. The special models and test conditions devised by the contractor included removal of steel ballast and/or wood layers from some of the standard dummy flares prepared by the test contractor, removal of upper corners to simulate frisbee/clay pigeon con- tours, edge painting, and cross hairs, and tilting the launcher. Figure 10 presents typical dummy flare configurations (unpainted).
In addition to the launcher at the launch site, there was a tracking camera with zoom lens above the launcher on a forklift (not usable for live firings), a test number board visible to tracking cameras, a launch signal flash bulb, and camera synchronizing and timing electronics.
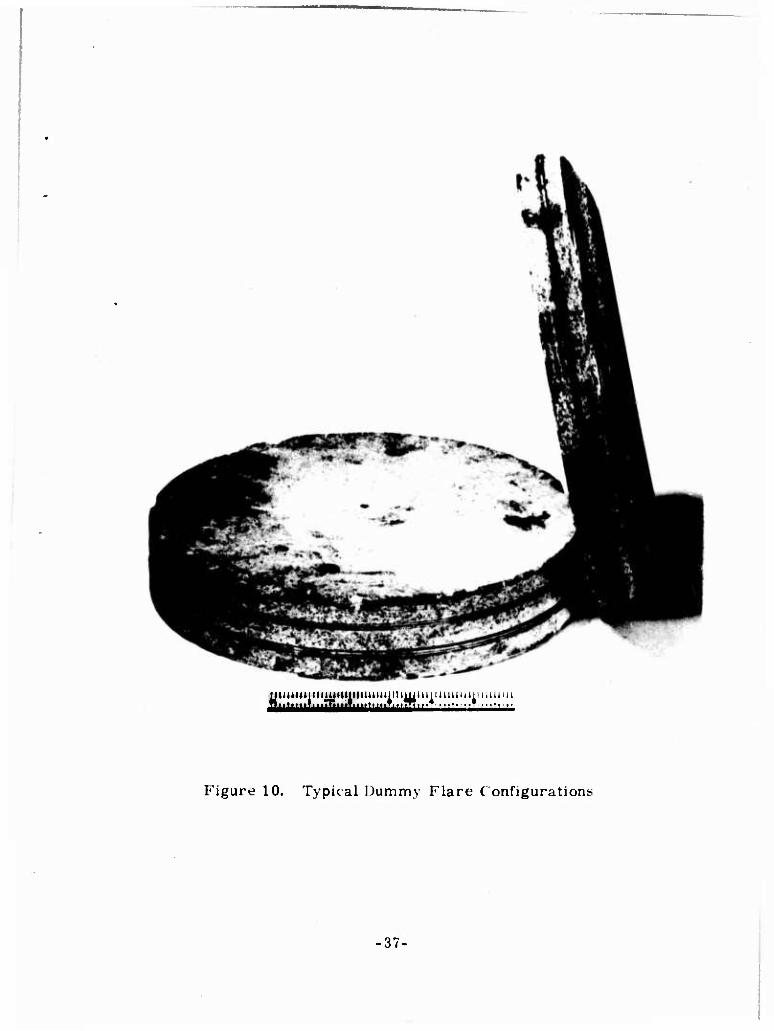
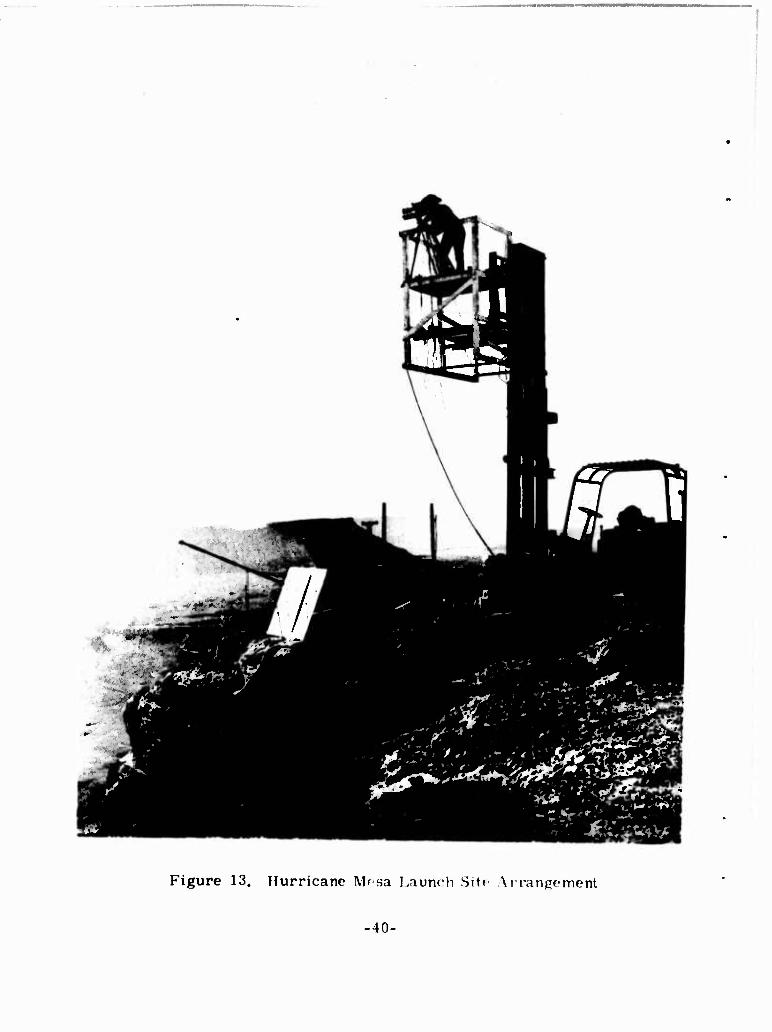
At the control site, a safe distance from bore site on the edge of the cliff, was located the launch control box which controlled launch and ignition event pulses to the synchronizing circuits and the flashbulb. At the tracking sight, there was a "tracking" camera with telephoto lens mounted on a panhead with pickoffs for aximuth and elevation, a data camera recording box, panoramic motion picture camera, and associated timing electronics. These were supplemented by a panoramic still camera for the live Mare tests.(See Fig- ures 11, 12, 13, 14 and 15).
Below the launch site on the sloping shoulder of Hurricane Mesa was placed a grid marking at 1 degree intervals of line-of-sight depression from the boresight station. The markers were 5 foot horizontal poles with alternating 1 foot red and white stripes.
-36-
awuiuniiniimiiiuumiiimuM.Mn...., ,..,... iJ_txLl.tLl-llxGxilXJ-tU.! *-Lll-lJ U-^M : T * ■ ' ; • • • • t .
Figure 10. Typical Dummy Flare Configurations
•37-
iiMin II ' n ■]■
Ml ; ' I
_£ 7, ,■
0) ÜC
tx
,■'
^*s«
^■siM ^HP^BP^ :' pfc^*»--»
i '■'■ ■ *■*
l*f^»--r !^.
; 1 .t-
.i^..:
;C^
Figure 13. Hurricane Mesa Laum-h Site Arrangement
■ 40-

i>. • •
Figure 14. Top View of Klare Launcher
41-
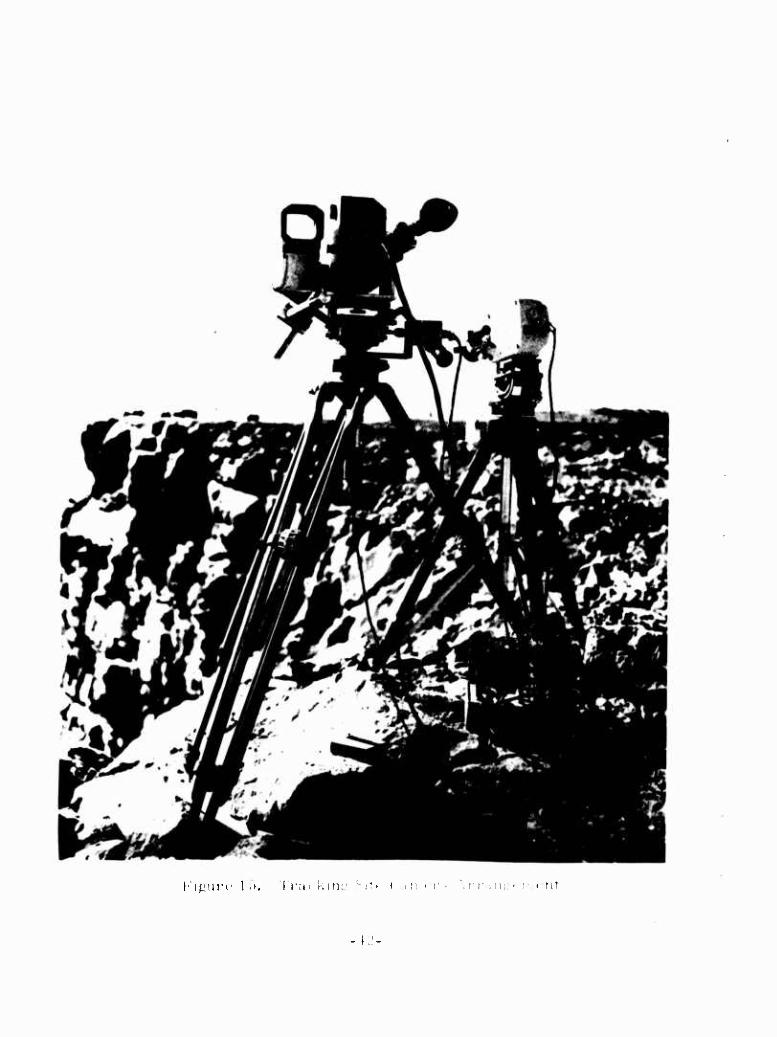
I'i^iicc 1 ■>. I fui k mu Siii ( ,1 II:CIM \ rT.i n
- i.'-
For the particular system evolved, the maximum possible data was obtained.
One feature contributing to maximizing data was the use of color film on all
the tracking cameras to provide contrast with the rugged terrain.
The results of the Hurricane Mesa tests were somewhat spectacular and
unexpected. Some of the modified dummy flares greatly amplified the pre-
cessional motions, which were not perceptible for the standard dummy flares
in these or earlier preliminary tests, instead of the hoped for stable coning
modes. The live flares developed sufficient thrust to climb above the mesa
instead of falling at the predicted rate along the basic parabolic path of the
dummy flares. Lighter, thinner dummy flares rolled to the left on the order of 10-30 degrees, thus curving the path significantly from the nominal plane.
When launched at a downward angle, they rolled to the left until edge-on
after even greater trajectory curvature. Even at full or greater weight,
dummies with rounded corners; that is solid frisbee/clay pigeon shapes,
peeled off quite significantly. In some cases, the initial rapid roll preces-
sion appeared to stop or slow down and the disks attempted to glide in a
manner corresponding to this new orientation, as predicted by nonprecessing
nonrolling theory in computer runs. As a matter of fact, one case was
"gliding" so well that it was airborne at least 10 seconds even though it
impacted near the base of the cliff instead of the usual 6-7 second drop to the
nominal impact area down the sloping shoulder. These manifestations of steady precession without visible wobble tended to validate the precessional
model used in the trajectory computer program, especially since closer
scrutiny and/or parametric analysis indicated that the scaled precession of
standard dummy flares might not be readily perceptible under the Hurricane
Mesa test conditions.
Continual strong updrafts made it impossible to conduct instrumented
experiments with standard toy or oversized toy frisbees. The updrafts also
tend to cloud the quantitative data reduction for the dummy flares.
-43-
Meaningful observations of clay pigeon flight which tend to validate the
criteria developed were obtained in spite of the high winds, however. It was relatively easy to find a stable nose-down orientation which would glide "wings level" at a stable equilibrium velocity. The straight line flight path would undergo changes in direction as wind direction shifted with altitude,
but few cases of precession or curving back into the mesa were observed. It was guessed that some had traveled 1/4 mile before impact far down on the base of the mesa. Unfortunately, no quantitative data were obtainable
on these flights.
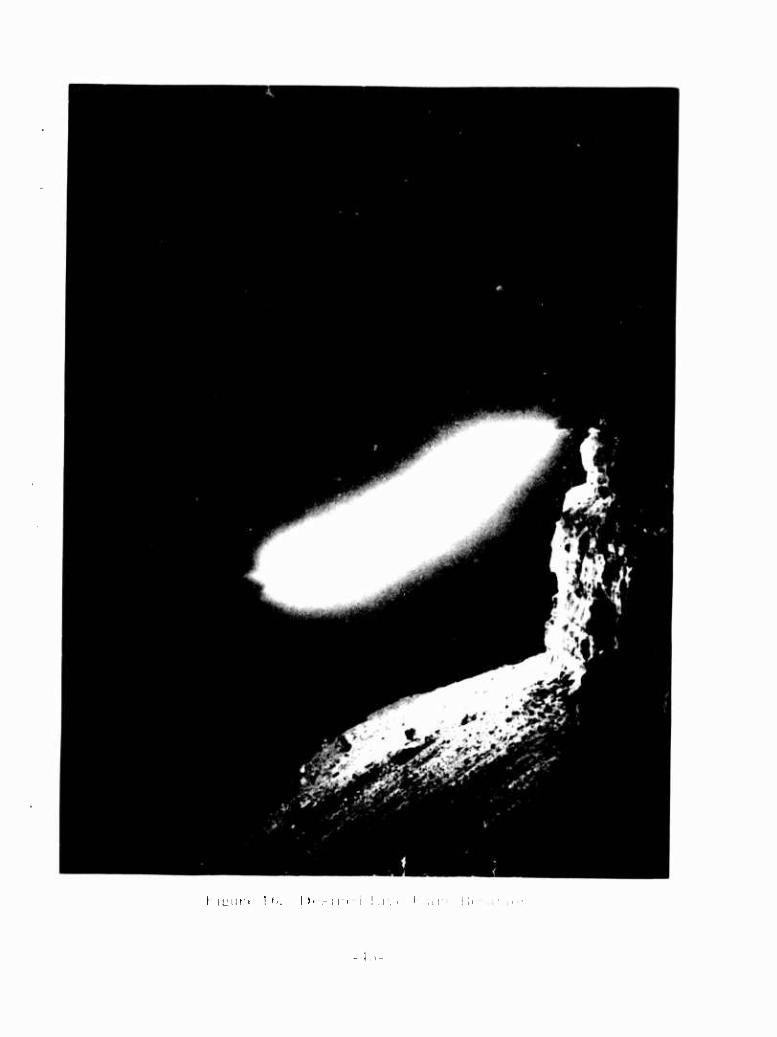
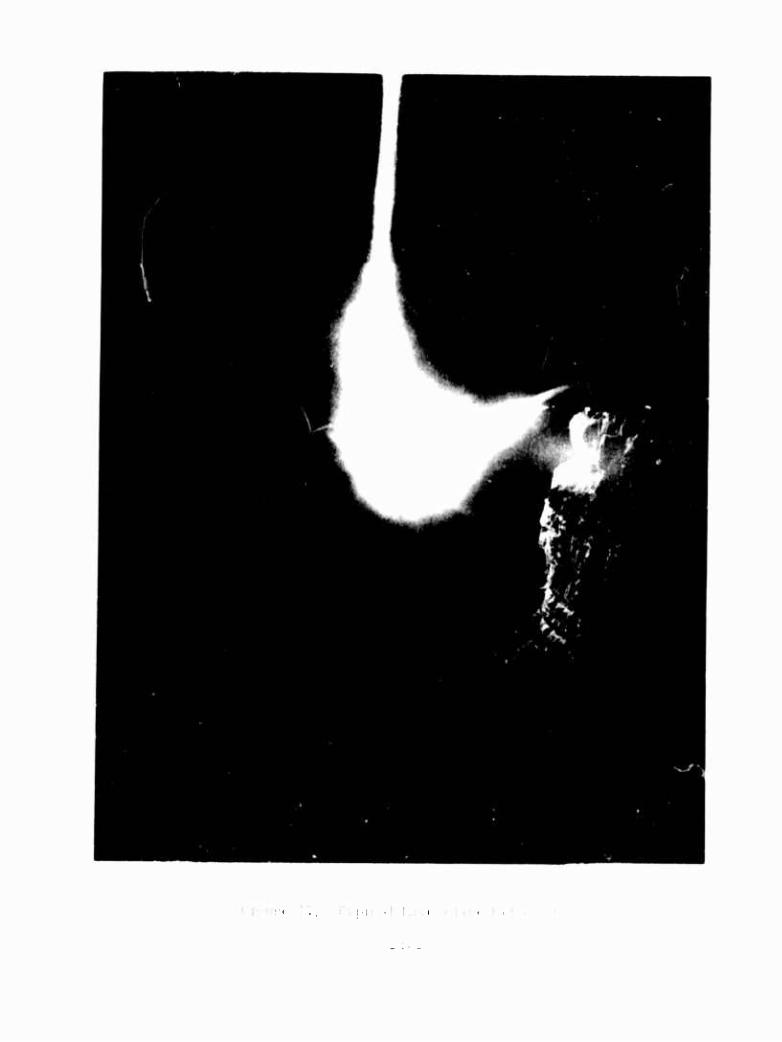
In all analyses, it has been assumed that the flare would generate negligible thrust on the basis of illumination requirements and preliminary pressure estimates at NAD/Crane. Due to a combination of factors, most of the live flares generated sufficient thrust to halt the fall of the flare and lift it above the top of the mesa. The one flare which did not rise, of course, provided
considerable illumination of the face of the mesa (Figure 16). The rising flares are typified by Figure 17. The flares were apparently quite stable
during both descending and ascending flights although there was an impression of tilting toward the tracking site that caused a lapse of tracking on one flight.
The launcher was developed by the flight test contractor as originally speci-
fied by NAD/Crane for carriage in a light aircraft so that its primary pur- pose was to impart a controllable pre-spin and sufficient velocity for safe separation. It uses a pneumatic cylinder to drive a carriage which mounts a turntable on which the flare is placed. The launcher, consisting of a rubber belt wrapped around the disk, a turntable, and an idler, imparts 1000 rpm to a 12 inch, 12 pound disk while the carriage imparts a 50 foot per second
velocity.
This velocity would seem to provide a safety margin for early air launches
and did provide a free-flight spinning environment for the live flares, but
it was not sufficient to provide a ground based simulation of air launch. It
did not use the range capability of the Hurricane Mesa, although greater range would have strained the instrumentation capability.
-44-
lUiin 1 (',. I >. ,-IM i l.i,. '. 11
; ■ i hl' .t I I . ,i
Almost a mile of movie film plus numerous still negatives were obtained from the test series (48 official launches).
The trajectories obtained for standard dummy flares agreed fairly well with predictions for the launch conditions, and the observed precessions tended to validate the precessional computer program. There was reasonable correlation with the analytical criteria solution, but the rapid change in angle of attack for the low speed launch and velocity variations makes it difficult to correlate such linearized analyses closely and makes it impossi- ble to use these solutions to extract the desired aerodynamic coefficients. A better simulation would have required much higher launch velocities (per- haps from a sled or aircraft).
While not successful in producing quantitative data, not too much had been expected, and these tests were valuable because they did provide qualitative validation of the math models and insight into the dynamic criteria, revealed problems in flare design, gave experience in field testing and data collection, and led to experience in data reduction.
12. Hurricane Mesa Data Reduction
Plans for reducing the Hurricane Mesa test films by the aerodynamics con- tractor were predicted on the availability of film reading equipment with an automatic computer input interface and personnel familiar with film data extraction, with Hurricane Mesa itself, and with the math models for which the data were intended and ..e availability of large and small computers and their associated programmers. The film-reader and interface could record crosshair position and angle or change therein and frame number or time.
It soon became apparent that it was not feasible to write a master program which would accept inputs from all cameras and print out position, attitude, and aerodynamic data, even though the maximum obtainable data and generally high quality photography were generated. Each test had to be examined
•47-
separately, and the most appropriate combination of film data correlation assumptions and computation applied. This often involved multiple readings of the same camera and/or use of data from another camera to interpret or compute a set of parameters.
It was recognized fairly early that no quantitative attitude data would be obtained because no operator^) could consistently locate and measure the axes of the elliptical image of the flare, which varied from a line to a near circle.
As could be expected in such a system, there were lapses in synchronization or timing signals, but conditions were repeatable enough to justify attempts to reconstruct or ignore these data in many cases.
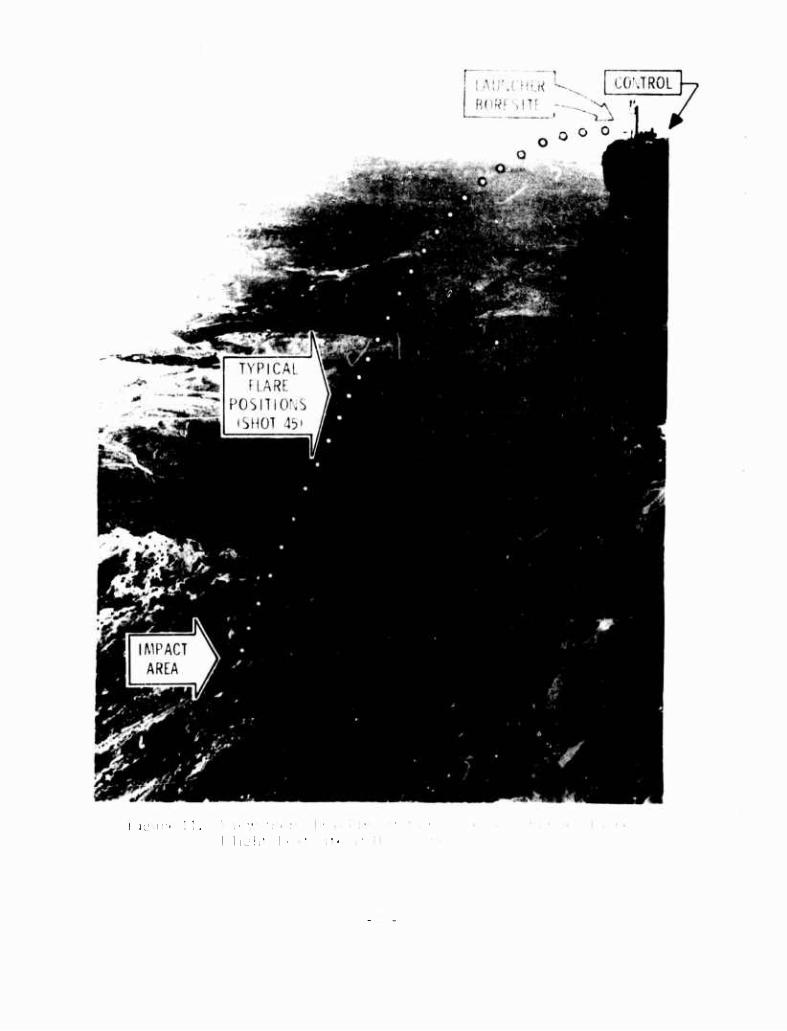
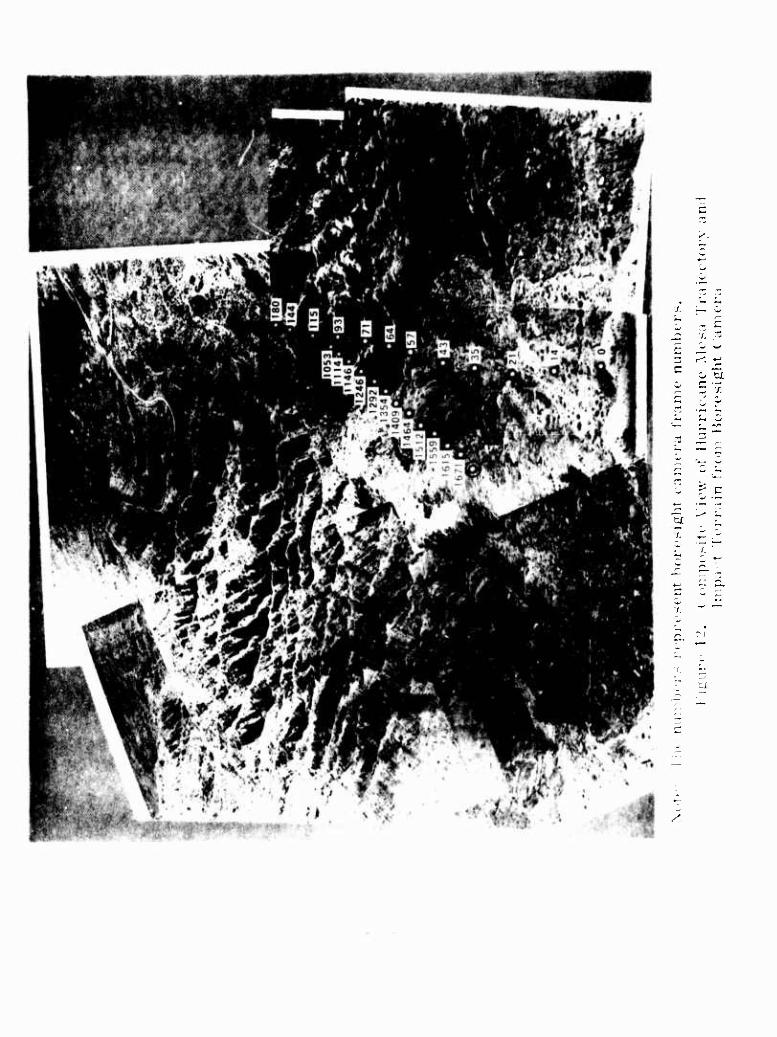
It was found that the most convenient approach to trajectory position data extraction was terrain matching. This was especially true for the boresight camera because the curving flight path and narrow fields of view caused drastic departure of the flare image from the test range grid, which itself was limited by terrain. It was relatively easy, however, to recognize the prominent terrain features in the motion picture films and to locate them on still pictures made of the terrain from both tracking and boresight stations. Coordinates of the images on these stills were corrected for camera orien- tation, itself extracted from image position of reference points.to obtain measures of line of sight "angles. " These angles for boresight and tracking were combined to determine three-dimensional flare position coordinates.
The boresight calculations required zoom lens calibration of focal length variation with time from event and image size measurement.
The planar trajectories obtained for standard inert flares agreed reasonably well with previous computer predictions, but attempts to extract detailed motion parameters from these, and especially from precessing special flares, were not particularly successful. This disappointing return on effort
•48-
expended reflected a combination of factors which included data scatter, intermittent gaps in data, poor resolution near the launch, strong updrafts, unknown atmospheric density, the difficulties in instrumentation and calibra- tion due to the terrain, impracticality of reading an adequate number of points for accurate data fitting, and the multiple differentiution required and the unavailability of standard software for these special cases. All parties were aware of the gamble involved.
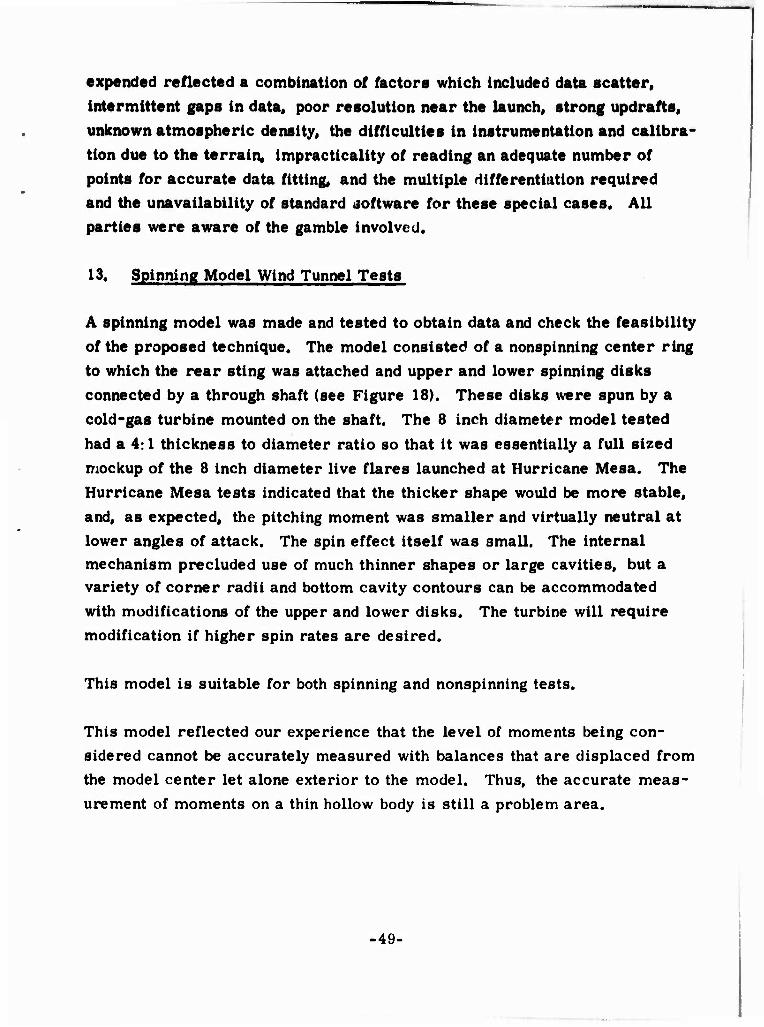
13. Spinning Model Wind Tunnel Tests
A spinning model was made and tested to obtain data and check the feasibility of the proposed technique. The model consisted of a nonspinning center ring to which the rear sting was attached and upper and lower spinning disks connected by a through shaft (see Figure 18). These disks were spun by a cold-gas turbine mounted on the shaft. The 8 inch diameter model tested had a 4:1 thickness to diameter ratio so that it was essentially a full sized mockup of the 8 inch diameter live flares launched at Hurricane Mesa. The Hurricane Mesa tests indicated that the thicker shape would be more stable, and, as expected, the pitching moment was smaller and virtually neutral at lower angles of attack. The spin effect Itself was small. The Internal mechanism precluded use of much thinner shapes or large cavities, but a variety of corner radii and bottom cavity contours can be accommodated with modifications of the upper and lower disks. The turbine will require modification if higher spin rates are desired.
This model is suitable for both spinning and nonspinning tests.
This model reflected our experience that the level of moments being con- sidered cannot be accurately measured with balances that are displaced from the model center let alone exterior to the model. Thus, the accurate meas- urement of moments on a thin hollow body is still a problem area.
-49-

I
I 1
I &
a»
I
•SO-
To maximize sensitivity in pitch in order to detect the anticipated spin effect on pitching moment, the strain gage balance was placed to the side of the bearing assembly so that its pitch center was aligned with the spin axis (see Figure 19). This meant that the roll center was displaced approximately 1 inch and pro- duced strong coupling of the normal force into the roll gage, making it extremely difficult to detect small Magnus moments. Since the balance could
not be placed at the cer.ter because of the bearing uad turbine, solution of this sensitivity conflict with standard six-component balances would require either two separate, partially redundant, balances or two passes with the
same balance relocated between passes.
Existing so called Magnus balances are designed for the stiffness/sensitivity/ geometry requirements of symmetrical projectiles. Consequently, it would require a specially designed and built yoke and gage assembly with the gages separated to provide the required sensitivity for this special configuration.
This delicate device could be relatively expensive.
Indications are that the Magnus moment must have been insignificant on the
shapes tested so far but that it could become more important for the thicker
shapes envisioned as a desirable direction for study. Consequently, con-
sideration should be given to construction of such a special device for future
investigations.
14. Stability/Precession Criteria
On the basis of the observations of Hurricane Mesa flight of the standard and special dummy flares and clay pigeons, the preliminary analytical
solutions were updated and re-examined. The test observations revealed no evidence of a dynamic mode stable about the vertical, but rather steady precession "proportional" to aerodynamics and gyroscopic stiffness. The
re-examination revealed the sought for effect of camber which both provided
nonprecessing flight for the actual clay pigeons and frisbees, but caused the
precession of the solid frisbee/clay pigeon shaped dummy flares, recon- firmed the forcing effect of gravity drop, and reinforced the validity of the
trajectory math model.
-51-
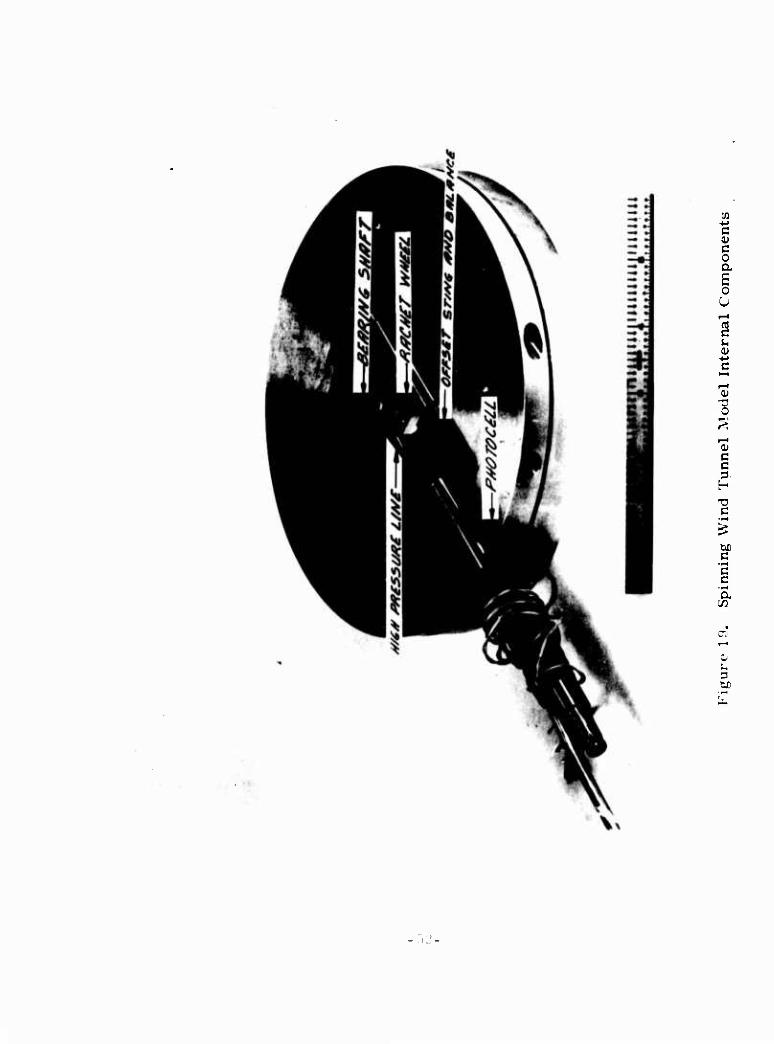
■r. *-> C « c o a
i U
i)
0)
3
e
^
«•
r.
S
These analysis provided an explanation of the flight of the toy frisbee and tentative criteria for application of the principle to ordnance delivery.
These preliminary criteria presented in section IV. B. 2. represent an inter- action of configuration spin and delivery conditions which are easily satisfied for the frisbee and the clay pigeons tossed from Hurricane Mesa. Satisfaction for dense flares or munitions may require a brute force approach if the frisbee analogy is not practical.
The criteria may be summarized as follows.
A spinning thin disk will precess (roll) about its velocity vector if there is an aerodynamic moment resulting from its inclination to the flow. A cupped or domed disk will have a neutral aerodynamic moment at a particular inclina- tion (angle of attack) at which angle it will also generate finite lift.
If the lift equals the weight at this angle of attack, the disk will stay at that angle of attack without precessing.
If the orientation and glide angle are such that the velocity stays constant, this condition could continue indefinitely.
15. Trajectory Computations
Subsequent to the wind tunnel tests, the trajectory program was exercised with data and launch conditions derived from the 4:1 cylinder wind tunnel tests, the Hurricane Mesa tests, the frisbee/pigeon tests, and the insights gained from scrutiny of the linearized precessional criteria. There were varying degrees of correlation with flight observations and criteria inter- pretations. See Section IV. B. 1. for typical results.
For the clay pigeon/frisbee, results were obtained for simulated trap range or downhill tosses that appear to be within the limits of visual observation under the normal terrain and wind conditions and the variations in measured lift and drag.
-53-
Closer examination of the roll precession for simulated standard Hurricane Mesa launches of standard flares led to the observation that the computed roll angles near impact could very well not be detectable at the distances involved even with a less angular background.
Attempts to find a launch angle/velocity/spin combination that would give negligible precession by gliding at a neutral point for the 4:1 cylinder were not completely successful because the aerodynamic moment was apparently still too large during the transient to the neutral point. It is hoped a thicker disk will give the desired level.
The effect of launch angle was not correlated with the Hurricane Mesa re- sults. However, the roll increase could be attributed to the fact that the level launch would cause the disk to pass through a stall point and reach the lower moments attendant to high angles of attack, while the inclined launches would stay at lower angles of attack and high moments longer.
16. Recent Efforts
Results were not yet conclusive concerning feasibility or required configura- tions. On the basis of the trends established by the wind tunnel data and the alternatives offered by the criteria, an outline of the next iterations in con- figuration was drawn up. These configurations included increases in thick- ness, variations in corner radii, variations in depth of a partial cavity which would still leave pyrotechnic volume, and combinations thereof. These studies would hopefully isolate the separate effects which were combined in the typical candidate configurations tested so far. Funds did not permit pursuit of this or of any other attacks on solution so that they must be reserved for future efforts.
Discussions were held with the NAD/Crane Project Engineer regarding air drops. It was concluded that the most expedient approach to simulation, feasibilit> evaluation, and test instrumentation development would be preliminary.
■ 54-
drops of inert flares at NAD/Crane with available aircraft and manual tracking photography. This would reveal the problems to be anticipated in more formal instrumented drops of inert and live flares.
These technical efforts have been suspended pending further authorization and flight test activity.
It should be noted that tracking photographs of recent gas gun tests using spinning circular sabots launched edge-on with the disk vertical showed a tendency to roll-out towards "wings level, " nose downhill flight in a manner analogous to that of a frisbee tossed on-edge. Exploitation of this prelimi- nary impression obtained from light-weight sabots to dense flares was not possible since it was obtained after suspension of technical activity. How- ever, it bears consideration in future studies as a possible means of auto- matically compensating for the launch transient that would otherwise have to be calibrated.
-55-
B. RESULTS
Typical results of the efforts described in section IV. A are presented in the
following subsections collected under the following categories:
Theoretical trajectories.
Stability/precession criteria.
Configuration aerodynamics characteristics.
Free-flight testing.
Math models.
These results are supplemented by the appendices to this final report.
1. Theoretical Trajectories
During the aerodynamic analysis, computer simulations were performed on
the flight trajectories of prototype flare concepts with a range of constraints on orientation and mass. Most of the prototype flare studies were made with
nonprecessing modes of the simulations to determine idealized reference planar trajectories while searching for a configuration which would fly
stably and/or for the criteria it must satisfy. Since there could be an in- definite altitude loss between launch and desired ignition altitudes, the trajectory behavior of inert flares was studied. Since it was initially
assumed that burning pressures would not produce thrust simulations were
run with mass loss corresponding to burning with and without thrust and
with and without effects of this volume loss on the aerodynamics. Because their supposedly well known behavior helped inspire the concept and their
contours represented easily identifiable candidate flare configuration variations, simulations of the flight of clay pigeons and toy frisbees were
utilized to check the computer math models and analytical criteria developed.
-56-
a. Typical Nonprecessing Inert Flare Trajectories - A typical paramet- ric analysis of the idealized flight of the flare prior to ignition is shown in
Figure 20 as a function of launch velocity for falls from launches at 10, 000 feet to ignition at 3000 feet or above. In this example, a 12 pound, 12-inch- diameter, 2-inch-thick flare was assumed to be launched in level flight in a
level orientation and held gyroscopically in that orientation throughout the
flight. Similar curves were obtained for other sizes.
b. Typical Trajectories for Clay Pigeons and Frisbees - In order to validate the precessional computer program and the precession criteria
of Section IV.B. 2 relating to both aerodynamic characteristics and delivery
conditions, the following runs were made using the measured aerodynamic
data.
Figure 21 shows the results of the simulation of a toy frisbee toss from a 50 foot elevation, with initial orientation as prescribed by the theory, including a slight droop to the left as one naturally tosses a frisbee. Its
path is relatively straight and level (Figure 21). The peeloff (Figure 22)
which does occur is well beyond the point at which a normal flight would
strike the ground.
It is felt that the computed glide path in Figure 21 was steeper than normally
expected for a frisbee for two reasons. The wind tunnel model mounting
may have given a lower than actual lift-to-drag ratio. Those shallow recreational tosses which do not appear to peeloff probably strike the ground first anyhow, and many do peeloff. This peeloff is explained by the analytical model as due to slowdown because the flight is at a shallower angle than that required for equilibrium glide.
Figures 23 and 24 illustrate the simulated behavior of the clay pigeon on a
trap range. Even through it never reaches a steady-state glide orientation nor satisfies the available steady-state precession criteria, it did maintain
a relatively straight path and relatively constant orientation in the time
-57-
H E u.
' . o . 7|-
a .«, a <? aai • • • acs* -» 5 • B« <au.
AM
ET
IGH
T
UN
CH
UN
CH
in
13^3351 «
te Ul u.
I
HI I <
CO 0)
s u 0)
2 H 0)
'S 'S a CO
i
a
'S I 2
s o CM
j.^?^ - doaa 3'j(uinv
-58-

20
i 8
-20
g -40 <
•60
20 40
^.
60
RANGE - FEET
-<
80 100
"^
120
CROSS RANGE
5 SECONDS
ALTjfÜDE
Figure 21. Typical Frisbee Trajectory Simulation Results - Position
59.
m
IS
10
/
/
V» tu
a
! i o
UJ
-5
10
ANGLE OF - AIIACK_
TINE - SECONDS
Figure 22. Typical Frisbee Trajectory Simulation Results - Orientation Angles
-60-

§ CO O
Ü
J3
I a
h
I
i33d - 30NVb ssovio QNV aanunv
61-

,—
60
50
<A w '♦o
i
Ul
/
/
/
/
/ ANGLE OF ATTACK
/
/
/
/
AZIMUTH
ROLL
I 2
TIME - SECONDS
Figure 24. Simulated Trap Range Flight of Clay Pigeon - Orientation Angles
• 62.

before impact. The launch velocity and angle, peak altitude, and impact point agree fairly well with preliminary motion picture data obtained at an actual range, and the roll angle and cross range departure are considered below the level of observation on a range subject to winds, gusts, erratic launchers, and informally instrumented tests. Again, the behavior may have been exaggerated slightly by interference effects on the measured aerodynamics, but the computed behavior is considered to validate the math model itself.
An even more dramatic validation of the math model and the precession criteria is shown in Figures 25 and 26 for the simulated toss from a cliff of a clay pigeon at the prescribed orientation for stable glide and near the prescribed glide velocity. In this simulation, quite straight and "wings level" flight was achieved for an indefinite period. This result correlates with informal trials during the Hurricane Mesa tests. Clay pigeons tossed downhill over the cliff flew stably in straight line segments which appeared to correspond to wind direction changes and reached the base of the mesa without turning into the cliff. Unfortunately, no photographic record of this is available, but several of the observing personnel watched these experiments while awaiting better weather for testing and/or photography.
c. Simulated Mesa Toss of Inert Flares - Figures 27 through 30 present the results of the application of the trajectory simulation and the estimated aerodynamics based on the available data to the Hurricane Mesa launches of the 12-inch, 12-pound and 8-inch, 5-pound dummy flares, respectively. As indicated by the impact point from flight test 35, there was reasonable validation of the model and the data for the 12 inch, 12 pound unit. The behavior of the 8-inch, 5-pound unit, similar to that of the live flares launched at Hurricane Mesa, corresponded to the simulation, and if any- thing, appeared slightly more stable at Hurricane Mesa.
The abrupt peeloff shown in the computed results occurred at times and falls beyond that required for impact at Hurricane Mesa. The computed
63-
300
200
Ui
100
M
8 o U
SÜ
c-ioo
-200
-300
-400
-500
W
CROSS RANGE
IKT 5ÜÜ
RANGE - FEET
W "5ÜÜ-
xvs ALTITUDE
"5ÜÜ"
Figure 25. Typical Simulation Results for Cliff Toss of Clay Pigeon - Position
-64-
o in
i l i I i i i i i l
I i i l l i i i i l I i r I i i i \
I < u. o
a CM
o z o o Hi 1A
I
!
G O 0) M
tn oa O H
9 0)
8 to
It Be
a.- HO
CO eg
0)
$33X030 - S319NV NOIIVINSIXO
-65-
r
/

100
RANGE - FEET
200 300 kOQ
100
i«:^^"""
^-v FLIGHT TEST '-'36
CROSS RANGE
\
200
E • 300
UJ o
vt
o <
g 500
600
700
IMPACT FLIGHT \ TEST m ®V- 6 SECONDS
\
DIAMETER: 12 INCHES \
THICKNESS: 2 INCHES
WEIGHT: 12 POUNDS
ATTITUDE: LEVEL
LAUNCH VELOCITY: 50 FEET/SECOND
SPIN RATE: 1000 RPH
7 SECONDS
FALL
Figure 27. Simulated Hurricane Mesa Trajectory for 12-Inch, 12-Pound Dummy Flare - Position
• 66.

60
40
20
x> ANGLE OF ATTACK
UJ u. at O
I
a i < z o -20
o
■1*0
-60
-80
100
2l
? 5 TIME - SECONDS
TT
\
\
Figure 28. Simulated Hurricane Mesa Trajectory for 12-Inch, 12-Pound Dummy Flare - Orientation Angles
67-
w

RANGE - FEET
■100
-200
I -300
100 200 '*%.
S ?
-400
-500
•600
-700
THICKNESS 2 INCHES DIAMETER 8 INCHES WEIGHT 5 POUNDS ATTITUDE LEVEL LAUNCH VELOCITY ... 60 FEET/SECOND SPIN RATE 1500 RPH
Figure 29. Simulated Hurricane Mesa Trajectory for 8-Inch, 5-Pound Dummy Flare - Position
• 68-

AZIMUTH
ANGLE OF ATTACK
Figure 30. Simulated Hurricane Mesa Trajectory for 8-Inch 5-Pound Dummy Flare - Orientation Angles
-69-
departure from a planar trajectory prior to this impact time was considered below the threshold of visual observation against the rugged Hurricane Mesa terrain. However, this prediction of extreme trajectory curvature for greater falls, even at this low speed, raises questions concerning per- formance at actual launch speeds and altitudes and/or the validity of the models and data which can apparently only be answered by more realistic flight simulation.
d. Simulated Air Drop of Inert Flare - Figures 31 and 32 illustrate the application of the trajectory program and the associated aerodynamic data for the 8-inch, 5-pound dummy flares to a higher launch speed (175 feet per second), corresponding to the very low end of the air launch spectrum. This shows a 200 foot cross range excursion of the flare in the first 10 seconds and a 30 degree excursion in roll, both of which would be percep- tible to an observer. It is interesting to note that in Figures 27 through 32, the roll angle has seemed to approach a steady-state value which would tend to result in a steadily turning flight until the angle of attack approaches equilibrium.
If this simulation result is valid, the flight performance would probably be unacceptable, but there are enough inconsistencies and missing aerodynamic data to indicate the need for more free-flight simulation.
e. Simulated Live Flare Trajectories - As displayed vividly in the live tests at Hurricane Mesa, generation of thrust by the flare could provide a truly self-suspended or over-suspended flare. Most of the trajectory analy- ses performed were based on the pyrotechnic design intent of negligible thrust however.
(1) Effect of Mass Loss on Trajectory - Figures 33 and 34 present some typical trajectories which were computed to show the effect of mass loss due to burning on the trajectory of a stable flare.
70-
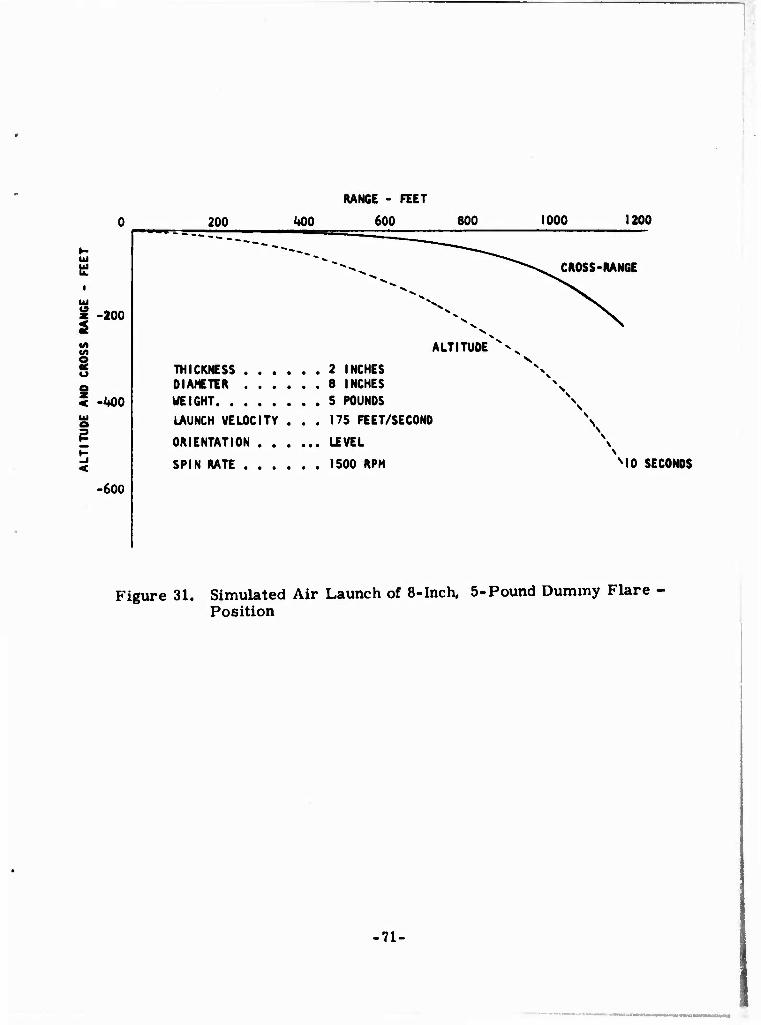
-200
-UO0
I
-600
RANGE - FEET
200 ^00 600 800
ALTITUDE^ v
THICKNESS 2 INCHES DIAMETER 8 INCHES WEIGHT 5 POUNDS
LAUNCH VELOCITY ... 175 FEET/SECOND
ORIENTATION LEVEL
SPIN RATE 1500 RPM
1000 1200
CROSS-RANGE
MO SECONDS
Figure 31. Simulated Air Launch of 8-Inch, 5-Pound Dummy Flare - Position
.71-
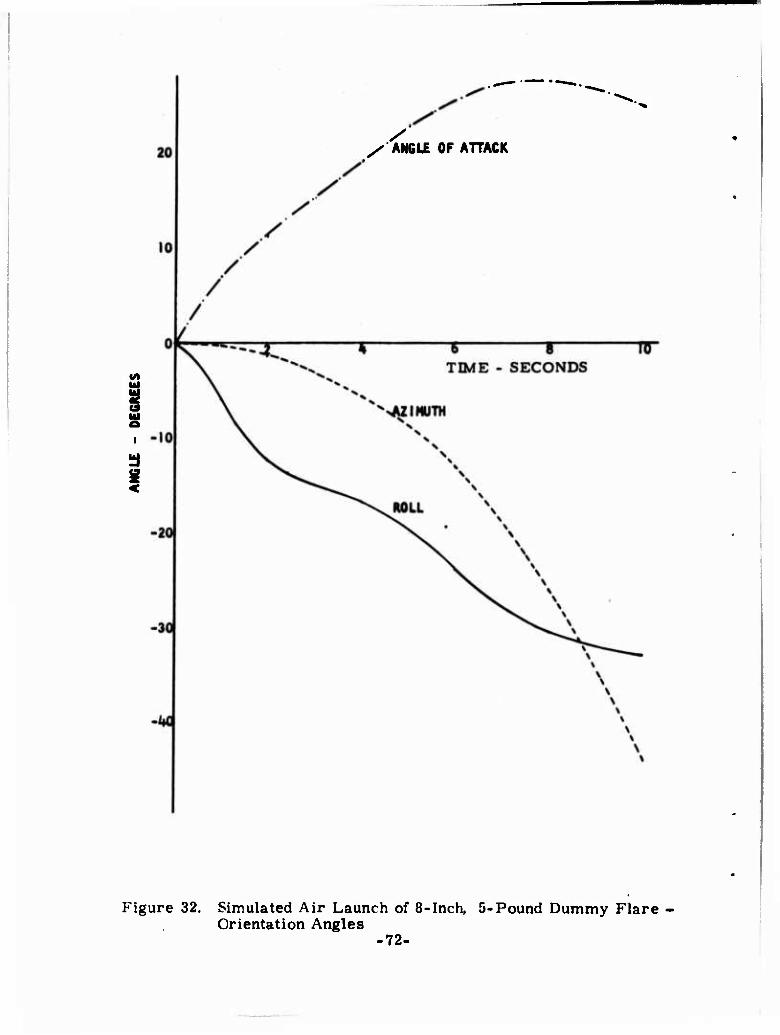
s /ANGLE OF ATTACK
«A
<
Figure 32. Simulated Air Launch of 8-Inch, 5-Pound Dummy Flare Orientation Angles
-72-
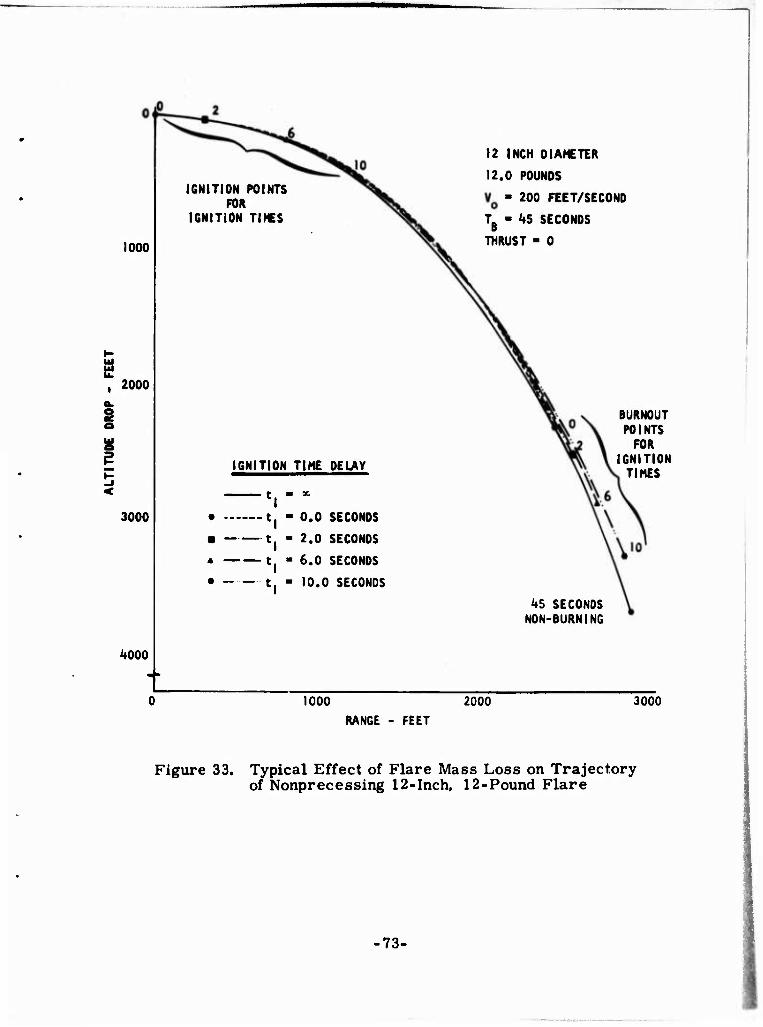
IGNITION POINTS FOR
IGNITION TIMES
1000
e , 2000
a. s ■
3000
IGNITION TIME DELAY
■ 3C
• 1 . - 0.0 SECONDS
■ 1 - 2.0 SECONDS
A — t - 6.0 SECONDS
• f . - 10.0 SECONDS
4000
12 INCH DIAMETER
12.0 POUNDS
• 200 FEET/SECOND
TB - 1*5 SECONDS
THRUST
BURNOUT POINTS
FOR IGNITION
TIMES
US SECONDS NON-BURNING
1000 2000 3000
RANGE - FEET
Figure 33. Typical Effect of Flare Mass Loss on Trajectory of Nonprecessing 12-Inch, 12-Pound Flare
-73-
1000
2000
i
3000
4000
■ ■
• t. - 0.0 SECONDS
■ t. - 2.0 SECONDS
4- t. - 6.0 SECONDS
* t. - 10.0 SECONDS
INCH DIAMETER
5.0 POUNDS • 200 FEET/SECOND
Tg • 30 SECONDS
BURNOUT POINTS FOR
IGNITION TIMES
30 SECOND NON-BURN ING-
1000 2000
RANGE - FEET
3000
Figure 34. Typical Effect of Flare Mass Loss on Trajectory of Nonprecessing 8-Inch, 5-Pound Flare
-74-

These figures are for an arbitrary launch velocity of 200 feet per second,
which is a likely speed for preliminary live air drops and for light recon-
naisance aircraft. They cover typical diameter, weight, and burning time
combinations. On the figures, overlapping curves are shown for ignition
delays of 0, 2, 4, 6 and 10 seconds, while infinite ignition time refers to the
nonburning case for comparison. The nonburning cases have end points
corresponding to burning time for the burning items.
In these idealized planar trajectory simulations, the thrust was assumed to
be negligible, precession was assumed to be negligible with respect to a
level orientation and launch, and the effect of burning and mass loss and
cavity on the aerodynamics was assumed to be negligible on the same- basis
as the assumption of negligible thrust. Because the aerodynamic s did not
change, the net effect displayed was a balanced effect on accelerations in both
lift and drag directions. Burning just reduced the arc length distance
traveled compared to the distance along the path of an equivalent nonburn-
ing flare for- a given amount of time.
This reduction was on the order of 1500 feet and 1000 feel of nv< lint1" '"••
the 12-inch, 12-pound and 8-inch, 5-pound flares, respectu «-h
In other calculations, the inclusion of cavity effect on lilt resulti-d m
some deviation above the nonburning path. This effect might then provide
an additional 20 percent reduction in altitude loss over and above that dm-
to mass loss. This effect is not available for the latest aerodynamu-
configurations, however.
An example of the combined effects of thrust, mass loss and cavity is
shown for the 8:1 cylinder for which cavity data are available (Figures 35,
36, and 37).
In Figure 35, the computed trajectory for a "live" thrusting 8:1 cylindrical
flare, assumed to have negligible precession for 15 seconds of burning time,
75-
500
i
1000
1500
RANGE - FEET
1000
DIAMETER: 8 INCHES
THICKNESS: 2 INCHES
CASE WEIGHT: 0.5 POUNDS
LAUNCH WEIGHT: 5.5 POUNDS
LAUNCH VELOCITY: 200 FEET/SECOND
BURNING/FLIGHT TIME: 15 SECONDS
LIVE THRUST: 0.5 POUNDS
Figure 35. Typical Effect of Thrust, Mass Loss, and Cavity Aerodynamics on Nonprecessing Flare Trajectory (8:1 Cylinder)
-76-
■
500
g
I 2 1000 «A
i I
1500
2000
500 ■err
RANGE - FEET
1000 1500 2000
DIAMETER: 8 INCHES
THICKNESS: 2 INCHES
CASE WEIGHT: .5 POUNDS
LAUNCH WEIGHT: 5.5 POUNDS
BURNING/FLIGHT TIME: 15 SECONDS
LAUNCH VELOCITY: 200 FEET/SECOND
LIVE THRUST: 0.5 POUNDS
"LIVE"
CROSS RANGE
FALL
V INERT
INERT
Figure 36. Typical Effect of Thrust, Mass Loss, and Cavity Aerodynamics on Precessing Flare Trajectory (8:1 Cylinder) - Position
■77-
\
\
Figure 37. Typical Effect of Thrust. Mass Loss, and Cavity Aerodynamics on Preccssing Flare Trajectory (8:1) Cylinder) - Orientation Angles .78-
is compared to the corresponding inert flare trajectory. The combined effect is an almost a two-thirds reduction in altitude loss with 0. 5 pound of thrust. A higher level of thrust would be required to produce a climb above the launch point, but the trajectory has almost leveled off at burnout for this particular case.
In Figures 36 and 37, the trajectory parameters for the same "live" and in- ert flares are compared when they are permitted to precess under the aerodynamic torques experienced. As may be inferred from the inert response, the 8:1 cylinder itself is considered too thin to provide the desired precessional characteristics from a level launch so that conclusions based on this simulated "live" response would be somewhat academic and premature.
In the absence of corresponding cavity effect data for thicker configurations and the significant pressures associated with thrusting, it is recommended that future studies with thrust assume that tha aerodynamics are the same as those for a solid flare of the desired dimensions. Typical coefficients for such a solid flare and other configurations studies are shown in Appendix D.
(2) Constant Altitude - While the ballistic coefficients, burning time, and launch and ignition conditions define the altitude lost for a flare delivered in a level orientation, a combination of these factors plus the proper orientation could be utilized to reduce the average altitude excursion. This is illustrated in Figure 38, where, with the same aerodynamic data and nonprecessing simulation as for the Figures 33 and 34, it was indicated that a stable 3 inch Uameter, 0. 5 pound - 10 second flare could be kept within ±100 feet of launch altitude at net flare launch forward speeds above about 250 feet per second. Net forward speed is the vector sum of aircraft and launcher velocities. Launcher velocity vector and aircraft were horizontal, but flare pitch attitude and, consequently, launch angle of attack were forward edge-up at the angles indicated. These cursory
-79-

a tu It! 3
ig
5 5 b. U.
>0«
«A «A U> V> O UJ ui o o z X X z z o O U 3 3 O
>. 25g2|}{ «A
^ -.0.^^ o o
X u o ui z < — ce (A «e — X >- < 3 o f- a. o at
5
1 4) a 00
I a eB 0)
5
§ u I-H
CO I o
I c I
09
09 3 8
\ o 00 CO
\ 0)
>0
•P4
o o o o h o CM
o s o 00
i33J - SanililV HDNflVI WOUd IlVd 3V)\nj
•80-

results indicate that some further exoToi ation might be worthwhile. They
certainly bring out the influence oi flare orientation.
(3) Effect of Mass Loss on Terminal Velocity - While the inter-
action at gliding flight conditions requires numerical simulation, consider- able insight into the boundaries can be obtained from examination of terminal vertical fall. This idealized case, approached for slow launch speeds or long ignition delays, has yielded closed form solutions which could permit analytical tradeoffs between flare ballistic and pyrotechnic
parameters. This analytical solution is presented in graphical examples
and general equation form in Figure 39.
The simple analytical solution is that the average terminal fall velocity for a disk of variable mass but constant drag coefficient and area is two-thirds
the terminal velocity at the start of burning; (V. = 2/3 V ). Thus, the
total fall for a given size and pyrotechnic weight varies directly with the burning times. A 16 inch disk with 15 pounds of pyrotechnic (0. 5 pound
case) is predicted to fall about 3100 feet in 60 seconds.
With regard to tradeoffs, these curves show that the thir ner disk is better for altitude loss of a level flare of a given weight, whereas precessional stability studies indicate that the thicker the better. Therefore, additional overriding tradeoffs would appear to be in order. A thin disk would pre- sumably fall faster if precessed on edge than a thick disk only partially tipped.
f. Typical Equilibrium Glide Conditions - In line with the observation that precession can be prevented only by gliding at an angle of attack at
which the overturning pitching moment is zero (a = ^ n) because of camber or thickness, the desired equilibrium conditions may easily be computed from the aerodynamic coefficients.
-81-
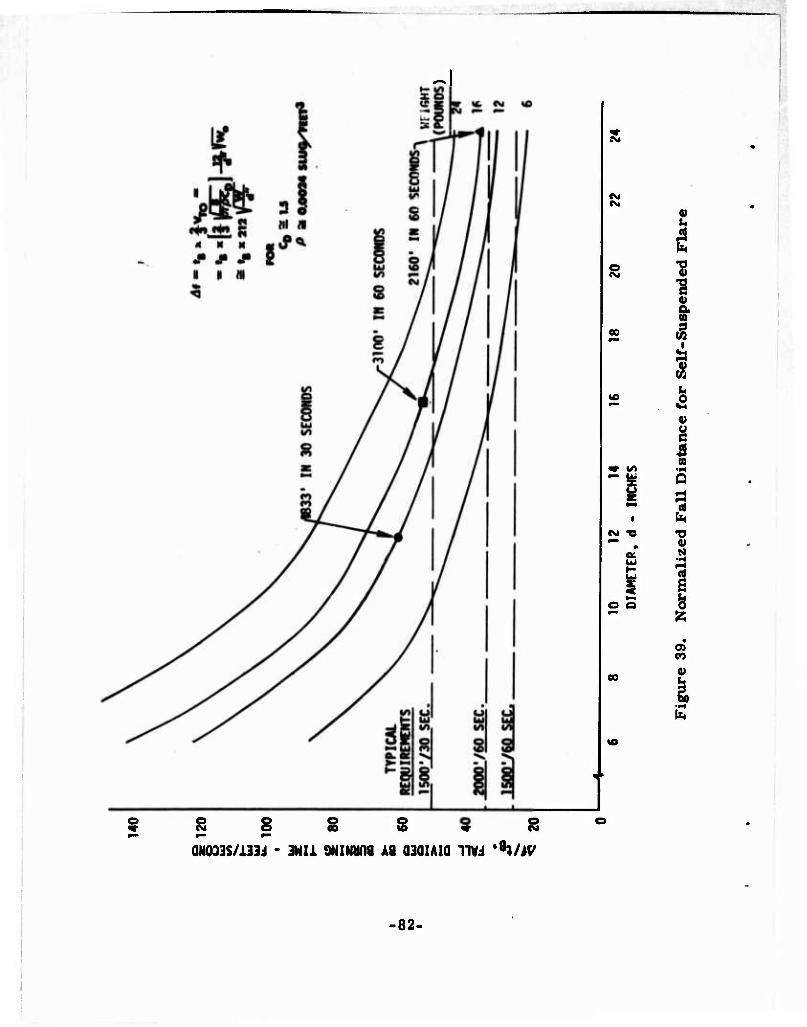
:vi
o
00 «r u> •rt s
^ a tm i
1 h CNJ T3 TJ •—
V M i
1 f-i
•-• o o ^
K •
CO
0)
CM d eo 8 # <M
aN033S/i33i - 3NIi 9NIN»fl8 Afl 0301 AN IIW *8WiV/
82-
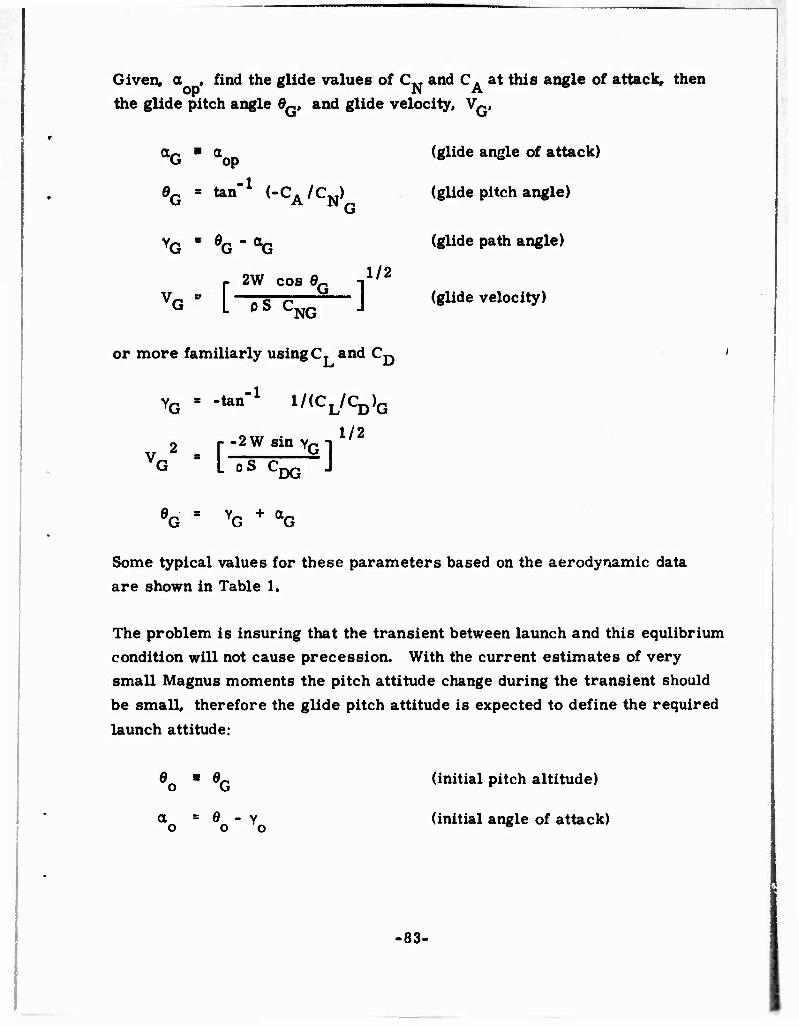
Given, a , find the glide values of C.T and C. at this angle of attack, then Op N A
the glide pitch angle OQ, and glide velocity, VQ.
aG " aop (glide angle of attack)
•O " ^n'1 <-CA/CN)G (glide pitch angle)
YQ s ÖG " aG (glide path angle)
r 2w cos eG -|1/2
VG^ L ps cNG J (glide velocity)
or more familiarly using C, and CD
YG = -tan"1 1/(CL/CD)G
2 . r-2WsinvGi1/2
G ' L t>S CDG J
0G S YG + aG
Some typical values for these parameters based on the aerodynamic data are shown in Table 1.
The problem is insuring that the transient between launch and this equlibrium condition will not cause precession. With the current estimates of very small Magnus moments the pitch attitude change during the transient should be small, therefore the glide pitch attitude is expected to define the required launch attitude:
9 ■ 0G (initial pitch altitude)
a~ = ö^ " Y (initial angle of attack) o o O
-83-
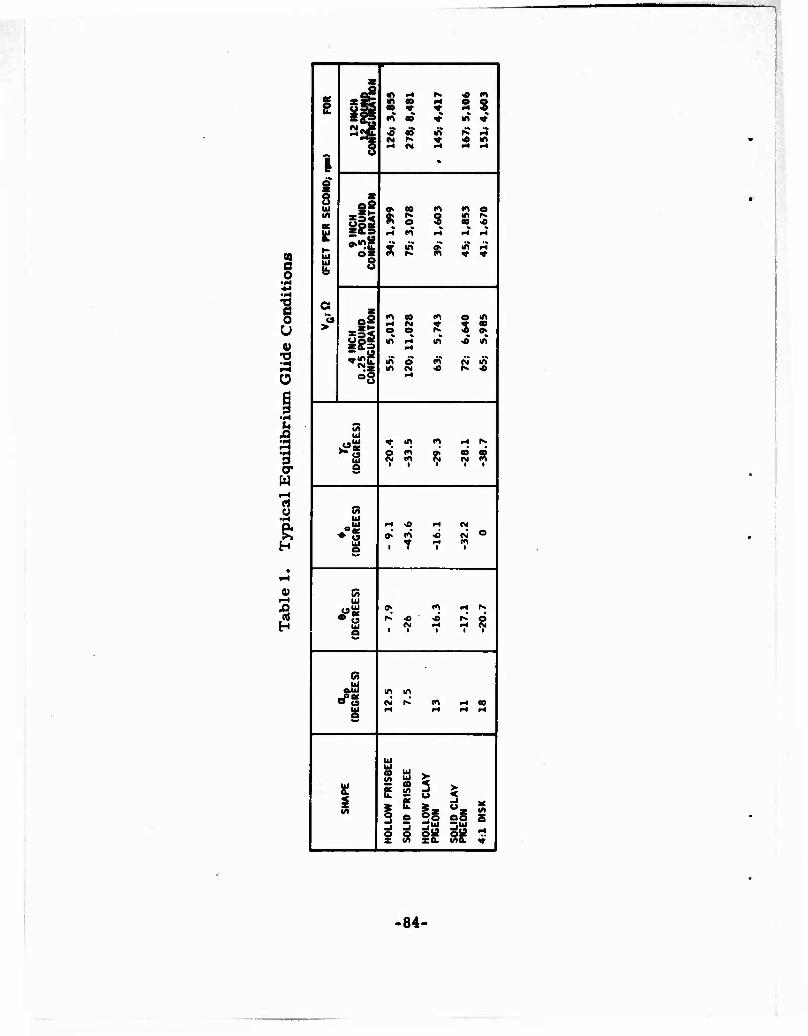
00 c o
I U
•o I-l
Ü
u Xi
•3 cr W
rt
0) 1—I
■ QS in ■-4 r«. « m
1 IP 1 00 S 8 K> 00 * »n v
fH jg , , •» •» J 00 m r« r*
S CM rv * « in
«■«
M CM M rl i-l
1 0
*
X 8 B ofi
ill i
0> 00 rt m e
E B E a
1 i
0
in
m r«. 00 «
i-l |H
£ M
■ 0 > o2 •H
O
00 CM O
0 0 m s 1
in H
in ■0 m
in O M a in z m CM •0 ^ « ^s i-l
M in H
•■B » in m N r» »^S s CO fi 00' co
CM « 1 ' 1 ' 1 i w
9 w «w iH •O rH M
♦ 1 o>' PO <« CM O i ? «-» 1
«M
M UJ ^i •>
1»' <0
(•I r>' d
a CM i-l f ** 5
1 t 1 1 1
a J m m «^g (Vi r»' M i-« 00
| |H ■H «-I FH
UJ UJ 00 1/) a >
it! 1 00 in 2 u ^
1 i 9 0 X
i a
9
-84-
a - <* r 4 CMa -i ^o " 0|Hd C—HTC (initial roll angle)
0 T% Ijl jecüa
Vo ■ VG (initial velocity)
where C^, CMa. C^« ^^. -j*-. -^ respectively.
g. Typical Trajectories for Other Applications - An obvious extension of the flying spinning disk is to stabilize delivery of high explosive ordnance. One form could be launch in a short range attack or defensive mode from the surface. Some samples have been computed using the disk aerodynamics in the nonprecessing time-share simulation. Typical results for a 4 inch, 1 pound disk are shown in Figures 40 and 41 as a function of launch angle and launch velocity. Spin rate was not specified since this trajectory program option assumes that constant attitude is obtainable. Figure 41 illustrates the effect observed throughout the study,and capitalized on in the steady glide analysis.that the disk attitude has a greater influence on the terminal flight conditions than the launch flight path direction. The tick marks on the curves are intended to denote the assumed constant orienta- tion of the disk at those points.
2. Stability and Precessional Criteria for Spinning Disks
a. Introduction - Simplified analytical solutions have been obtained for the linearized stability and precessional response equations of frisbee-like objects. Correlation with local and Hurricane Mesa observations is con- sidered quite good with respect to the following:
Hand-launched toy frisbees, which some persons can fly well for a while.
. Light-weight solid inert flares, which precessed inversely with weight.
Beveled edge solid inert flares, which precessed much worse at any weight.
-85-
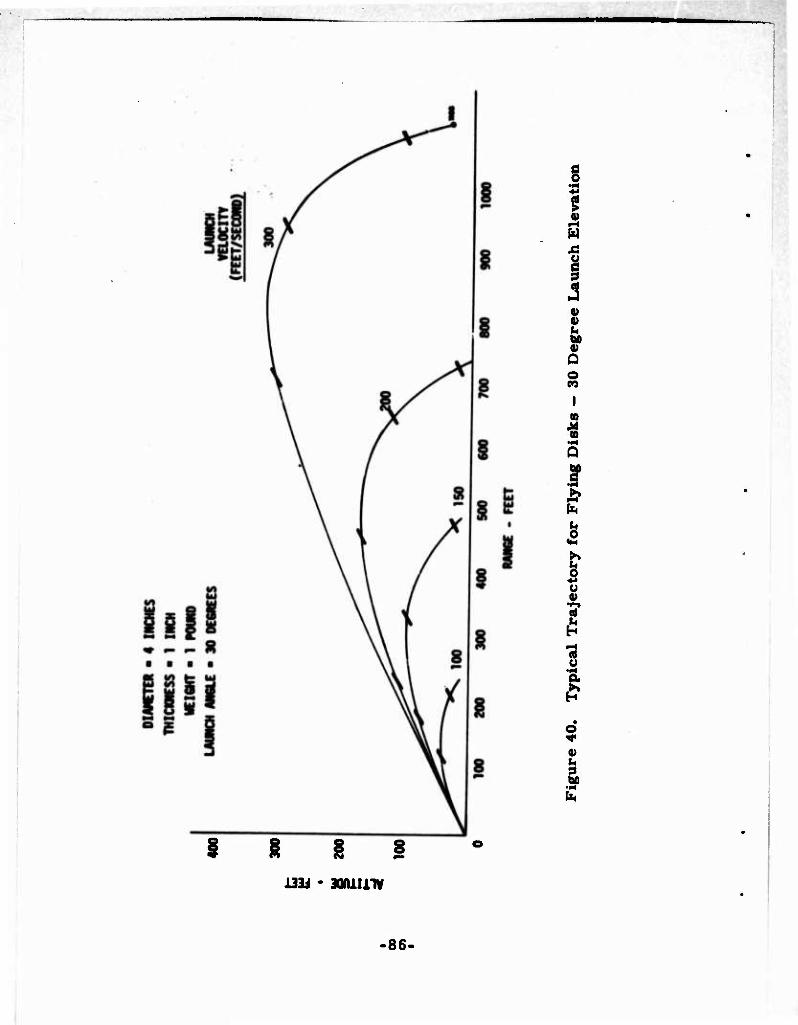
I 8 i
I u
I 0 I
o
v u
•IH
•
l l | | i33i - janiiiiw
-86-
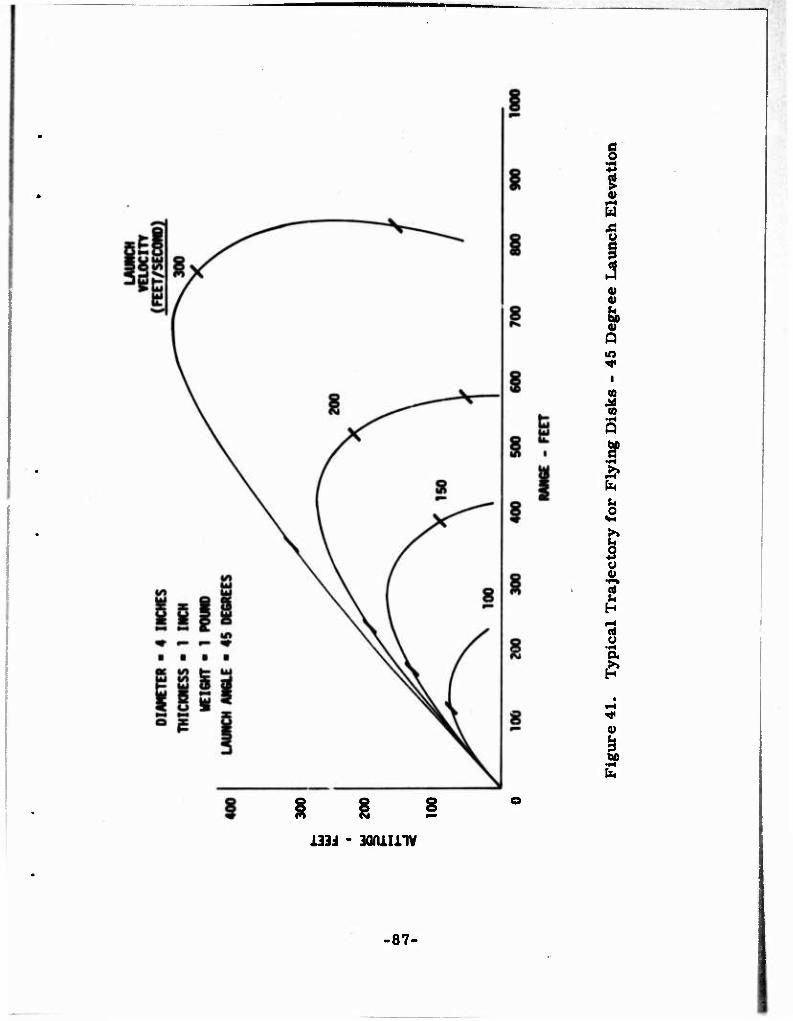
c o •»^ 4-»
l-H w s §
a» (4 tu a> Q \n ^ i
J2 a y
•IH
B
I u
h
H&
I l 8 PI M ^B
133J - janiinv
87-
Clay pigeons thrown from the cliff, which glided straight for long periods of time.
Correlation with downward launches at Hurricane Mesa and clay pigeons at the trap range appears to be dependent on the magnitudes for the non- linearities of the parameters. Qualitative correlation with the trajectory computer program is considered good with respect to the shape of the curves and the validity of the nutation (wobble) suppression assumption.
The preliminary conclusions that may be drawn regarding design criteria for negligible, or acceptable, precession of ordnance items utilizing the frisbee principle may be extremely difficult to meet.
The required configuration is not yet apparent. It will require additional aerodynamic data to define whether a desired or practical configuration for a given application will provide sufficient orientation stability.
The present equations and available data indicate, however, that the configuration should be a thick disk (or short cylinder) with relatively blunt symmetrical corners for arbitrary launch conditions, or a domed/ cupped configuration on the order of a solid or half-solid clay pigeon.
b. Stability and Precessional Criteria Defined - As usually defined, dynamic stability requires that angular rates and linear velocities will return to equilibrium when disturbed, with some exponential envelope. This does not necessarily (or even usually) mean that attitude or position will return to their original values. This definition of dynamic stability is that used in this study. The precessional criteria referred to in this present report are especially defined to represent constraints to prevent changes in attitude and rates under forcing functions which act to change the equilib- rium conditions for a dynamically stable body. As indicated in section IV. A. 1, a precession is herein defined to be the steady gyroscopic rotation of a spinning body under the applied torques.
•88-

It must be noted that both the stability criteria and the precession criteria must be satisfied to obtain straight flight. Satisfaction of the stability criteria is the necessary, but not wholly sufficient, condition that small disturbances will not grow. However, the problem is that the response of a disk that is dynamically stable, as usually defined, to an initial angle of attack (produced by pitch from horizontal or by the trajectory slope, to an overturning moment due to asymmetry (camber), or to trajectory curvature under gravity) is to steadily precess its spin axis and lift vector out of the vertical plane and, thus, to turn the trajectory.
Thus, one must strive to minimize the response to these forcing-functions in addition to providing stability in the usual sense. The most obvious trivial solution for arbitrary forcing functions is to have the center of pressure on the center of gravity, the next, to provide overwhelming gyroscopic momentum, but they may or may not be obtainable.
c. Stability and Precessional Criteria for Level Launch - The flare equations of motion in Appendix B, transformed to velocity axes which are parallel or perpendicular to the velocity vector, were linearized with respect to a steady-state planar trajectory. They were solved for stability roots of the characteristic equation and for response of the roll angle of the lift vector and of the angle of attack to initial conditions, trajectory curvature, and aerodynamic asymmetries by use of the La Place transform technique.
The stability roots may be easily separated into two modes, the high frequency nutation and the low-frequency undulation modes. The high frequency nutation mode, corresponding to the nutation of projectiles and Magnus rotors is always oscillatory if gyroscopic stabilization has been satisfied. The undulation mode, however, usually degenerates into two aperioidc submodes, one of which could still be called the undulation mode and the other the precession mode. Undulation is dominant in magnitude of the root, while the precessional root approaches zero, or pure precession.
■89-
I
The dynamic stability criteria for these modes represent the inequality con- straints that must be met to insure that the stability roots are at least neutral (i. e.. zero), or preferably damped (i. e.. negative). The nutation damping criterion, the nutation frequency, and the undulation damping criterion obtained turn out to be identical to those for a Magnus rotor in a steady glide with spin axis horizontal. The criterion for gyroscopic stability is identical to that for a spinning projectile.
The amplitude of the nutational mode response of a stable prespun disk to the forcing functions of concern was negligible and, therefore, was suppressed in the results and in the computer program. The damping exponent of the undulation submode dominates the response.
For arbitrary elevation of the initial velocity vector the linearized equations yielded undulation-precession roots which appeared to be quite slow convergences or divergences depending on the magnitudes and signs of the trajectory parameters. This variation makes general analytical solutions difficult to obtain and interpret, let alone to describe and/or to present criteria.
The troublesome terms are zero or negligible for level launch flight paths, however, so that quite simple expressions were obtained for the roll rate in a region near enough to a level launch flight path for linearity to apply.
These level launch equations were simplified into the combined precession constraint equations for initial roll and pitch and steady-state angle of attack and velocity of Table 2. If these constraints are satisfied simultane- ously, steady-state roll rate will be zero and the roll attitude will be less than some arbitrary maximum value.
Basicaliy, the simultaneous satisfaction, which could constitute a juggling act, requires that the velocity be such after a short transient, the lift will equal the weight at the angle of attack for neutral overturning moment and the initial pitch and roll attitude be such that after the transient, residual roll is some acceptable low value and the velocity will be constant.
-f'O-
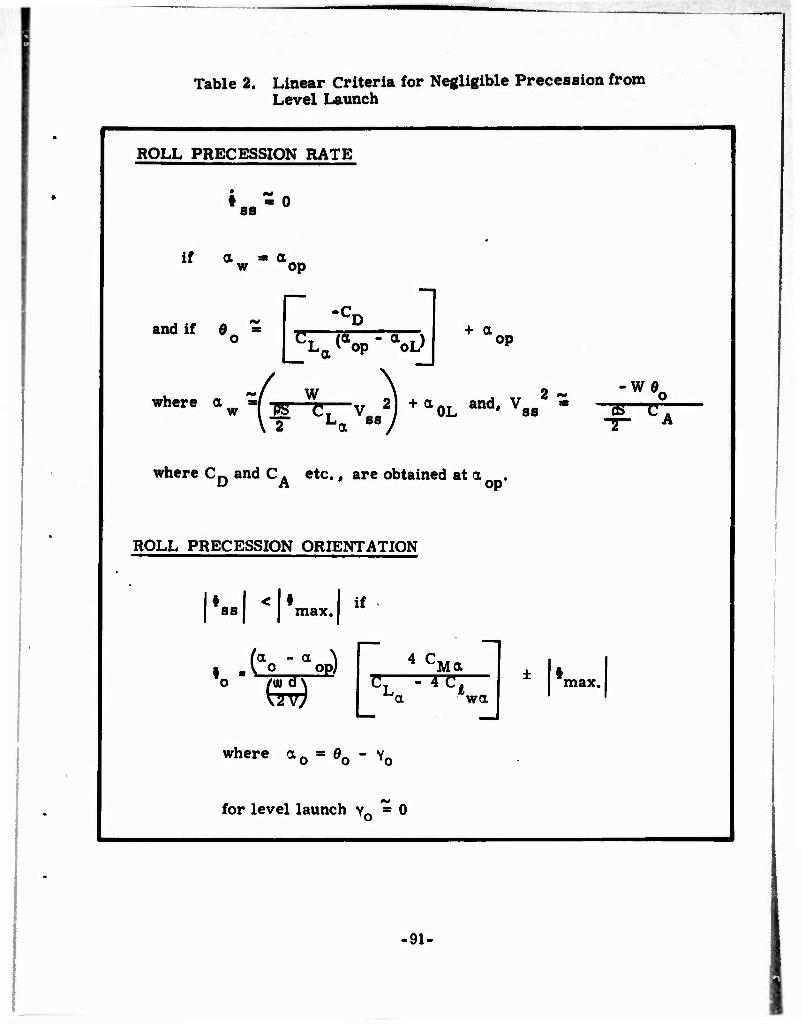
I
Table 2. Linear Criteria for Negligible Precession from Level Launch
ROLL PRECESSION RATE
•„-• if a « a w op
and if $ -CT
^ <% * aoL) + a op
where a W \ ?
w Ig CT Vfla2 +a0L and' Vss
^T La 88 / "as—rr T" A
where CD and CA etc., are obtained at a op*
ROLL PRECESSION ORIENTATION
#ss < #max.! if
(a - a \ 0 (*a) \T77
4 Cwn Ma Tr ="TCT
a wa ± I max.
where a0 = 0O - Y0
for level launch Y0 = 0
01.
These criteria were derived from the more general steady-state roll-pitch
equations in Table 3 which are, in turn, based on the undulation/precession
response equations and lumped coefficient definitions of Table 4. The
glossary for these tables is presented in Table 5.
Table C shows the dynamic stability criteria applicable to the level launch
case. These criteria for undulation and nutation mode dynamic stability and
the necessary gyroscopic stability also apply to other trajectory conditions
but would in those cases be supplemented by additional trajectory-dependent
criteria which are not available for presentation. The stability an! response
equations should be extender o these other conditions at the earliest
opportunity.
Some numerical examples of equilbrium glide trajectory parameters based
on the exact equations and the nonlinear aerodynamic data have been shown
in Table 1 for typical configurations. The corresponding initial roll orienta-
tions required by the linear criteria of Table 2 are also shown in Table 1
under the simplifying assumptions that launch occurred near the equilibrium
glide velocity and that the peripheral speed ratio was approximately 0. 8 for
all cases. Naturally, where the roll angle predicted by linear theory and the
velocity change exceeds the usual bounds of linear theory, the required
launch conditions in both roll and pitch would require an iterative numerical
solution of the nonlinear equations.
d. Application of the Criteria to Fridbees and Clay Pigeons - Satisfaction
of the precessional criteria represents simultaneous satisfaction of a
relatively precarious simultaneous conditional equilibrium condition or
coming close enough that the error from equilibrium causes an acceptably
slow divergence from a straight flight. This is apparently where athletic
skill comes into the picture for frisbees. However, the aerodynamic and
inertia characteristics of the frisbee make it relatively easy to satisfy
these simultaneous requirements for a frisbee or clay pigeon and difficult
for a heavy disk.
■92-
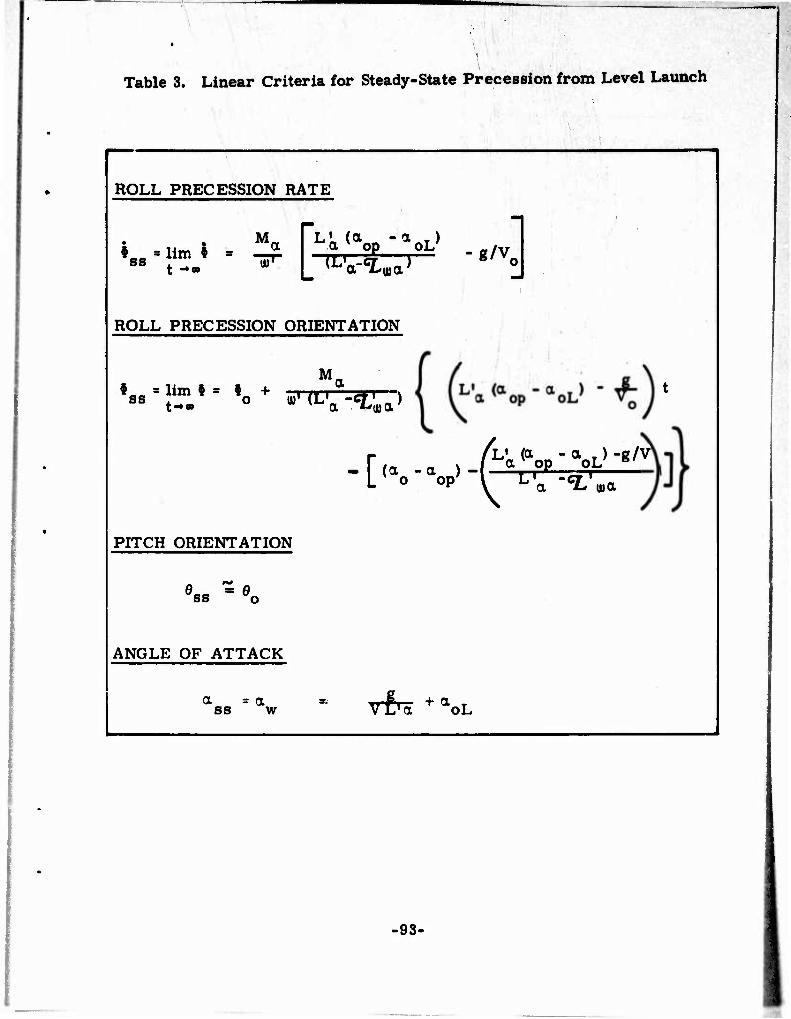
.
\ Table 3. Linear Criteria for Steady-State Precession from Level Launch
ROLL PRECESSION RATE
I „ = lim I ss . t -*0B
Ma ^a (a0P •W L IL'a-<i -g/v.
ROLL PRECESSION ORIENTATION
♦ = lim * = *_ + M.
ss t-*0D o T u)'(L1 -ct'—)
-[
PITCH ORIENTATION
ss o
ANGLE OF ATTACK
a = a ss w
(a -a )-( aTi0p °i
vfrä +a oL
-93-

Table 4. Qua si-Steady Response Equations for Level Launch
INSTANTANEOUS ROLL RATE 1 1 Ma ^ . . I", . *•« (1 -e l---iT<ao-v L1 + cv^^
ROLL ORIENTATION
vQ
• ■ »0 + j « dt
ANGLE OF ATTACK
L a-^ «a
PITCH ORIENTATION
(1 -eNl*) [n-6!.'«^
• - »o Where the lumped coefficients:
H ■ Ä vcLo <L'ma - f- VC/M
♦ 0.|^ VCLa(ao.aoL, .,/V0
-94-

—
Table 5. Glossary for Stability/Precession Criteria
-L VJ fil'
t
1-2 »Sv'i
M
1/2 psv'a
«OLLmC MOMINI COtmClENI, POSPIIV! TO «ICHT.
piicmiic uoMui cotrnciKT.
SLOPE Or LIFT COCFFICIEMT CIMVE (tIADIAItt'.
«« •«.
SLO« OF PITCWW MOMENT CUIIVES,
PITCH AND ROLLING DAMPING COEFFICIENTS.
c _ C/ OUF TO SPIN MAGNUS MOMENT COEFFICIENT
». INITIAL ANCLE OF ATTACK FOR LINE API/. 0 ANALYSIS AT ANV POINT OF TRAJECTORY (RADIANS .
^ ANGLE OF ATTACK FOR ZERO PITCHING MOMENT «ADIANSi.
•a ANCLE OF ATTACK FO« ZERO LIFT.
', 'S\*'K-hL' w INITIAL RATE OF CHAN« OF FLICHT PAT« ANCLE 7 «A01ANS PER SECOND
s ■ ±'2
* REFERENCE AREA, THE DISK PLAN FORM AREA SQUARE FCETi.
i DISK DIAMETER. THE REFERENCl LENGTH TEtT
C,, ■ 0/ 1/2 piV? DRAG COEFFICIENT, PARALLEL TO VELOCITY VECTOR
C, = A/ 1/2 pSv' AXIAL IORCI COLFFICIENT, PARALLEL TO DISK
1 | MOMENTS OF WENTIA ABOUT SPIN AND TRANSVEISC AMES • ' 1 «ESPfCTIVEL» RLDC r OOT SOUAKEOl.
VV MOMENTS RATIO DF ABOVE ■ 2
M SPIN RATE RADIANS PER SECOND:
I4AI/2V PERIPHERAL SPEED RATIO
P ATM05PHCRIC DENSITY SLUGS PER CUBIC FOOT).
v VLLOCIIY IFEET PER SECOND'
«EIGHT (POUNDS
•« * t*. ANCLE Or ATTACK AT WWCH LIFT WOULD EOUAl MIGHT COMPONENT «AOIANS »»v't 0l
h«.«l ABSOLUTE VALUE OF MAKIMUM ROLL OdllNTATIO«
• ROIL ANCLE OF LIFT ytCOR «AOUNS.
( , STEADY-STATE VALUE Of 1 1
' l( INITIAL VAIOE Cf 1 1,
»„ DAMPING EKPONENI uF UNDULATION MODE
• PITCH ANCLE »AOIANS
«•»♦ »n DRAC COEFtlCIENT imH ANUI OF ATTACR 0 ' «,,
95-
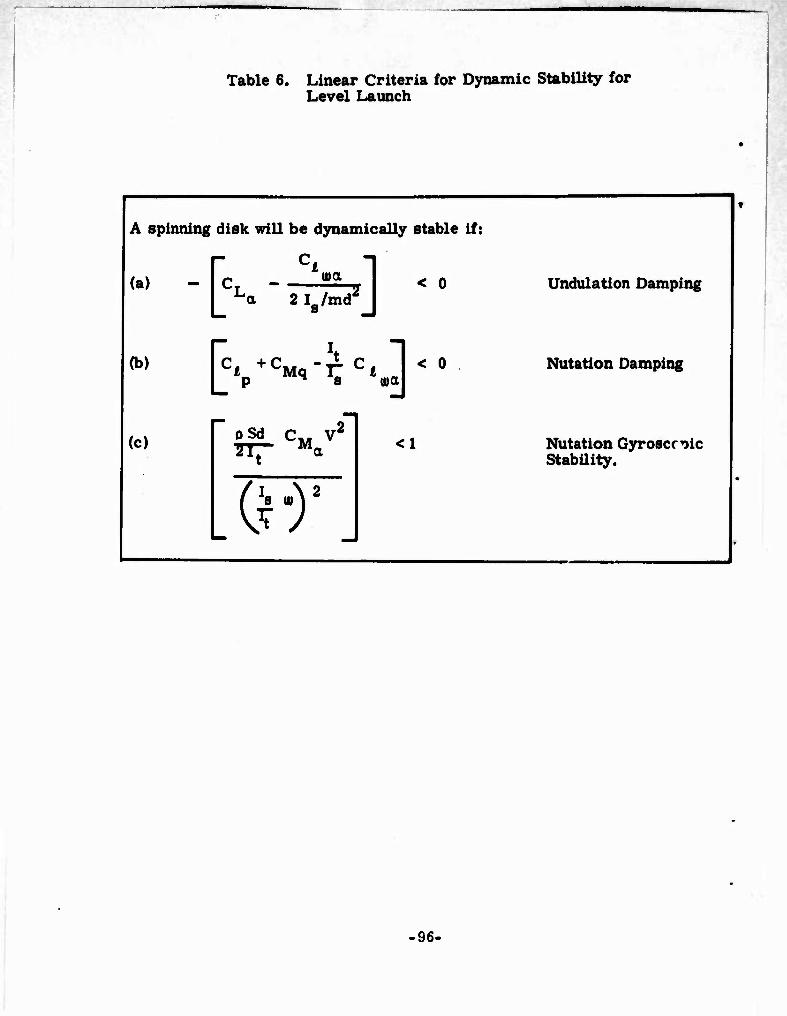
._
Table 6. Linear Criteria for Dynamic StabiUty for Level Launch
A spinning disk will be dynamically stable if:
(a) - | r - £ma gI < 0 I ^a 2 Ig/nuT J
^ [Ci+Cm-T:ci ] < 0 j p n S UDOl
(c) oSd C V^ 't a
¥) <1
Undulation Damping
Nutation Damping
Nutation Gyroscrnic Stabüity.
-96-

A key feature, as could be expected, is the curvature or camber of the thin disk. Thin flat disks are aerodynamically unstable edge-on and the natural tendency is to overturn to the broadside orientation. The curvature causes the moment to be a tuck-under pitching moment at low angles of attack and overturning at higher angle of attack, with equilibrium at a finite angle of attack. This equilibrium angle for zero pitching moment (a in the equations) is on the order of 10 degrees.
The disk is still aerodynamically unstable about this shifted equilibrium point so that gyroscopic momentum due to spin is needed for stability. Available data do not show significant effect of the spin on the aerodynamics themselves. Under the right-hand rule, the gyroscopic reaction at low angles of attack would be a roll to the right. This helps explain the rollout of a frisbee tossed on-edge. At higher angles, the gyroscopic reaction would be a roll to the left. This shift helps permit out-smarting the gyroscopic right hand rule.
For the available data, this roll is ±1 degree if the initial angle of attack were ±4 degrees from the neutral value. Because of the light weigh* of the frisbee. it is possible to make the lift equal the weight at the angle of attack for zero pitching moment. If the lift equals the weight, the trajectory curvature will be zero and the angle of attack will not change from this equilibrium. If launched at a lower angle of attack, the frisbee will drop until the lift equals the weight. If the proper initial tilt to the left is used, some of which occurs naturally from the weight, the roll to the right during the transient will bring it up level. If thrown at a higher angle of attack, the flight path will climb until satisfied and it would roll to the left. If the angle of attack when lift equals weight is the rotational equilibrium angle, the transition right or left roll will stop.
The velocity at which the lift equals the weight at the equilibrium angle of attack is between 20 - 25 feet per second for the available wind tunnel data and cor!*"">onds to noninstrumented observations of actual flights. After
•97-
.
the initial transient to this steady-state condition as the velocity decays due to air drag, the path will curve downward, the angle of attack will depart from the equilibrium point and peeloff occurs. It should be apparent that if the toss is such that the precession criteria are met on a downward glide- * path which will also maintain constant velocity (the tangential gravity component equals drag) the peeloff will be delayed until spin decay or other f
disturbances (such as hitting the ground or a wall) intervene.
For long term straight flight, the combination of initial orientation and velocity has to be such that when the lift/weight force equilibrium is reached (as quickly as possible) the angle of attack is that for rotational equilibrium, the roll orientation is negligible, and the velocity is in equilibrium.
For the '"risbee on level ground, the velocity equilibrium is not too critical because ihe decay is slow relative to the desired flight time. For a clay pigeon on a trap range, the time is also apparently too short for significant observable peeloff to occur since there is definite trajectory curvature. The principle was validated with clay pigeons tossed with edges slightly downward off the cliff at Hurricane Mesa. They quickly reached stable equilibrium in both attitude and velocity and flew straight with wings level for significant times, changing direction primarily with wind shifts.
e. Application of Criteria to Self-Suspended Flares - It is relatively easy to meet the precessional criteria with a frishee because the light weight makes it easy to rapidly obtain equilibrium between lift and weight and the flight time prevents visible buildup of near misses on orientation. For an air-launched heavy disk with finite flight time, achievement of the equilibrium is more difficult because of the possible wider difference between launch and equilibrium and a possible discrepancy between lift equilibrium and moment equilibrium. The transition phase could also cause excessive roll excursion even if a satisfactory equilibrium condition exists.
98-
The more solid and/or symmetrical, the smaller the angle for rotational equilibrium« but the heavier, the larger the angle required for lift equilibrium.
As may be shown, the precessional criteria involve a combination of: pitching moment characteristics, gyroscopic stabilization through spin, and flight conditions. Thus, alternate approaches could be pursued.
(1) Brute Force Mode - If gyroscopics can be used to overwhelm aerodynamic characteristics, then flight conditions would not be critical. This brute force approach would involve development of a shape whose aerodynamic moments are negligible over the angle of attack region anticipated with arbitrary launch attitude compared to the gyroscopic momentum achievable with practical spin rates and mass distributions. Thicker cylinders approaching 2:1 or 1:1 diameter-to-thickness ratios appear to be a possible means for achieving neutral pitching moments, at least at small angles of attack. Our measurements of the 4:1 cylinder showed a trend in this direction. There would have to be careful juggling to insure that the Magnus moments that are apt to be generated by the edges of the thicker disks would not be detrimental.
(2) Frisbee Mode - The other alternate would, of course, be to provide a configuration and delivery scheme compl stely analogous to frisbee delivery. Thus, the configuration would be domed and preferably cupped and the launch orientation would be near that nose down attitude required for equilibrium glide at the rotational equilibrium condition, rolled to compensate for the transition from launch (see Table 1).
Another interesting approach represents a combination of the preceding approaches to the aerodynamic and launch to glide transition problem. Rather than a shift of otherwise linear moments through camber (doming/ cupping), a symmetrical cylinder which has a neutral pitching moment over a significant ± range sufficient to provide lift equilibrium might be launched
99-

in the glide orientation with negligible precession during transition and the angle would not be critical as long as it was within the neutral zone.
The 4:1 cylinder data approaches this, but the deviations from neutrality appear to still be too great and the angular region of near neutrality is not quite great enough for expected launch condition.
3. Configuration Aerodynamic Characteristics
The configuration synthesis aerodynamic definition process constituted an iterative procedure which is not yet complete. These studies started with identification of the three basic configurations based on inputs from the customer and the origins of the concept. The tools used included literature searches for available data, estimates based on available data, nonspinning and spinning wind tunnel tests, flow theory, observation of flight tests, computer simulation of trajectories and all the other "tricks" of the aerodynamicists trade, including omphaloskepsis and engineering judgment. From this evolved prediction of aerodynamic characteristics for configura- tions tested and new generations to be tested.
The basic configurations used were an 8:1 diameter-to-thickness ratio right circular cylinder with a small radius on the top corner, representing a 16-inch-diameter. 2-inch-thick. 60-second burning flare that was an inter- im design goal, with four levels of flare cavity, and called the baseline flare; a frisbee-ike configuration with two cavity levels, hollow and solid; and a solid and hollow clay pigeon. To this was later added a solid 4:1 cylinder, with a small radius on the top corner, which corresponds to the 8 inch diameter, 2-inch-thick live flare launched at Hurricane Mesa The data obtained on theso slopes were interpolated for 8:1, 6:1, and 4:1 symmetrical and beveled inert flares and extrapolated for thicker bodies.
a. Configuration Aerodynamic Data - The results of the wind tunnel tests of the hollow models of the three basic configurations are typified
-100-
by the pitching moment coefficient plot of Figure 42. These domed clay pigeon and frisbee configurations display similar linear increases until a stall point or flow separation is reached and display a similar shift of the point of neutral aerodynamic moment to 12 - 13 degrees of angle of attack due the asymmetry. This effect could be expected from the theory of cambered thin airfoils. A similar rise to a stall point is displayed by the normal force coefficients, CN, in Figure 43. The baseline cylindrical flare virtually eliminates the linear region and sharp stall at finite angle of attack in both these figures because the bluff contours undoubtedly cause earlier flow separation and early stall. The corresponding axial force coefficient, C., parallel to the disk is shown in Figure 44. These coeffi- cients were defined previously in section IV. A. 3.
Similar trends are shown in the results for solid shapes with varying degrees of contouring or thickness corresponding to launch configurations of the flare prior to ignition. The pitching moment coefficient is shown in Figure 45, the normal force coefficient in Figure 46, and the axial Torce coefficient in Figure 47.
These data show both the original 8:1 diameter-to-thickness ratio baseline cylinder and the 4:1 cylinder tested on the spin fixture. In both cases, the cylinders had an approximately 0.1 inch (full-scale) upper corner radius and square lower corner similar to the prototype live flares. This introduces a slight asymmetry into the data at small angles of attack, which was suppressed for computer simulation of the symmetrical dummy flares launched at Hurricane Mesa.
Figure 45 gives a combined indication of the effects of thickness and corner radius on the pitching moment coefficient which appear to dominate in the region below 45 degrees angle of attack. Aside from the aforementioned suppression of stall, there is a much less pronounced effect on normal force (Figure 46). As a matter of fact, there is not much departure from the often used crude sine wave first approximation corresponding to the normal component of drag due to uniform pressure on an inclined plate.
-101-
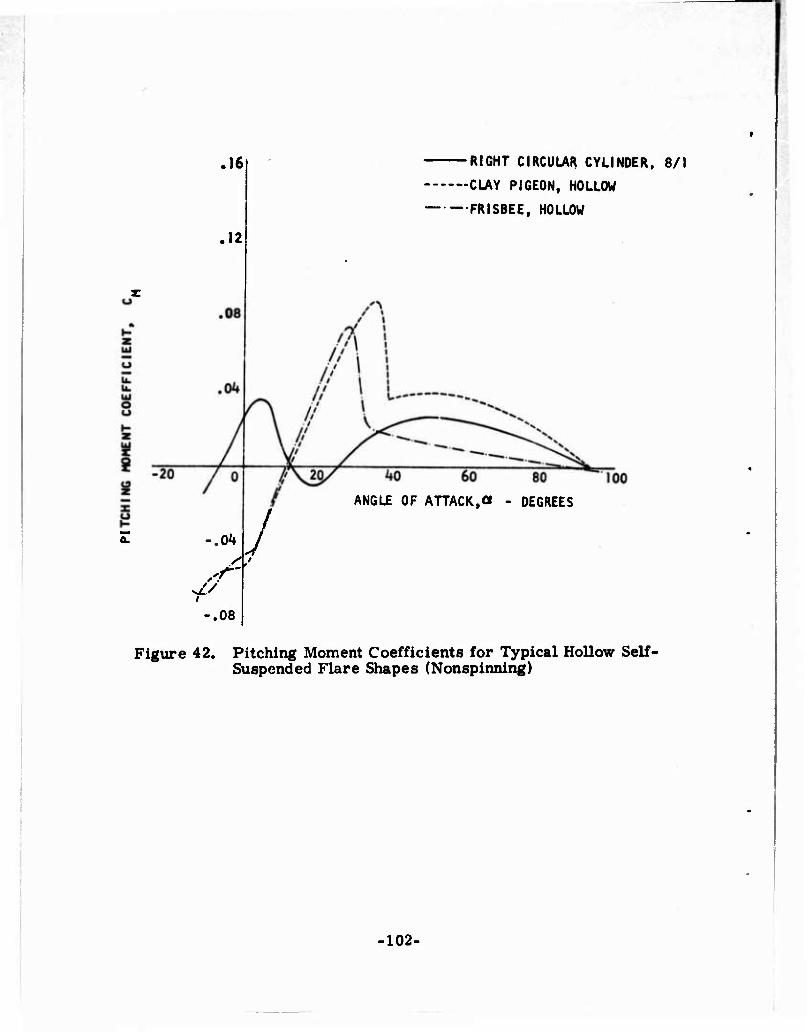
.16
.12
+
•.Ok
.08
RIGHT CIRCULAR CYLINDER, 8/1
- CLAY PIGEON, HOLLOW
FRISBEE, HOLLOW
J kO 60 80
ANGLE OF ATTACK,« - DEGREES
Figure 42. Pitching Moment Coefficients for Typical Hollow Self- Suspended Flare Shapes (Nonspinning)
102-
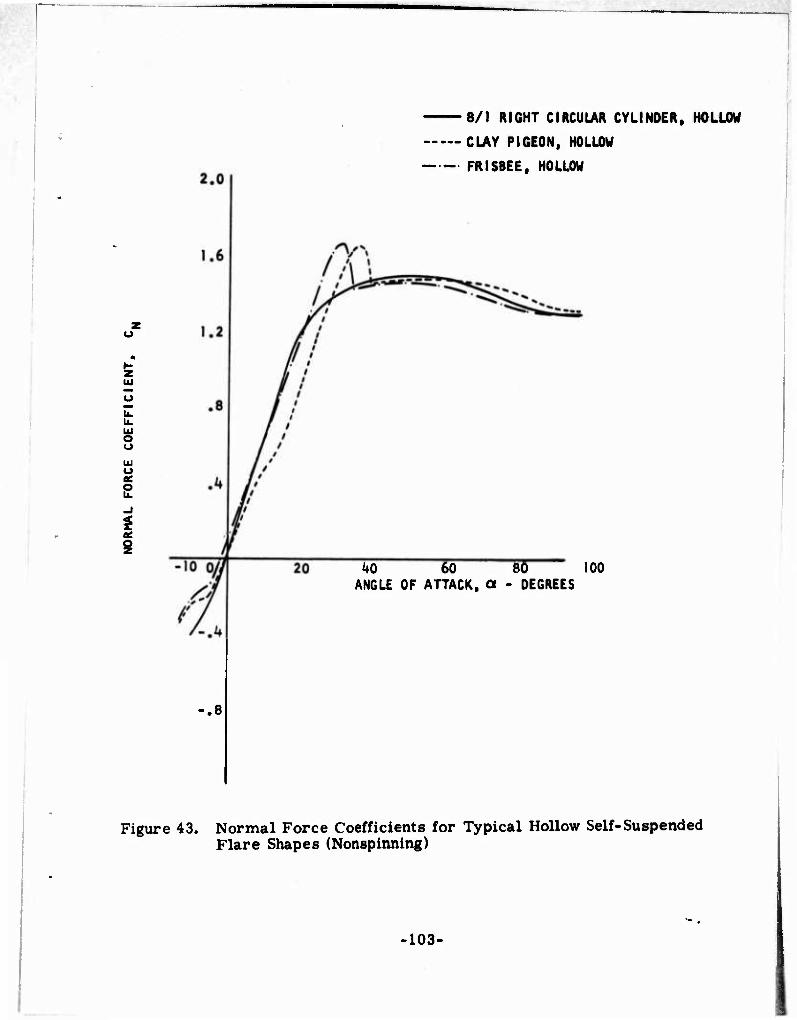
o ü o o
o o Ü.
8/1 RIGHT CIRCULAR CYLINDER» HOLLOW
CLAY PIGEON, HOLLOW
FRISBEE, HOLLOW
.8
^0 60 80 100 ANGLE OF ATTACK, a - DEGREES
Figure 43. Normal Force Coefficients for Typical Hollow Self-Suspended Flare Shapes (Nonspinning)
103-
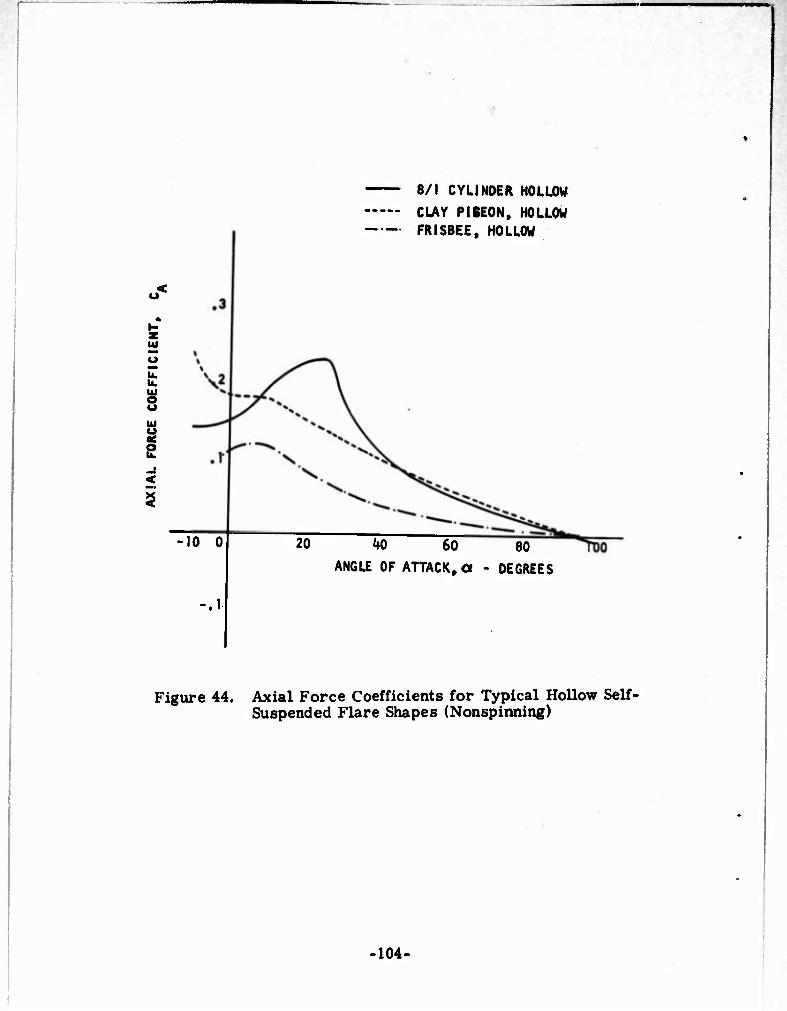
. —
«<
o o
o
<
— 8/1 CYLINDER HOLLOW
— CLAY PIBEON, HOLLOW - FRISBEE, HOLLOW
10 0
•J
20 kO 60 80
ANGLE OF ATTACK.a - DEGREES
Figure 44. Axial Force Coefficients for Typical Hollow Self- Suspended Flare Shapes (Nonspinning)
104-
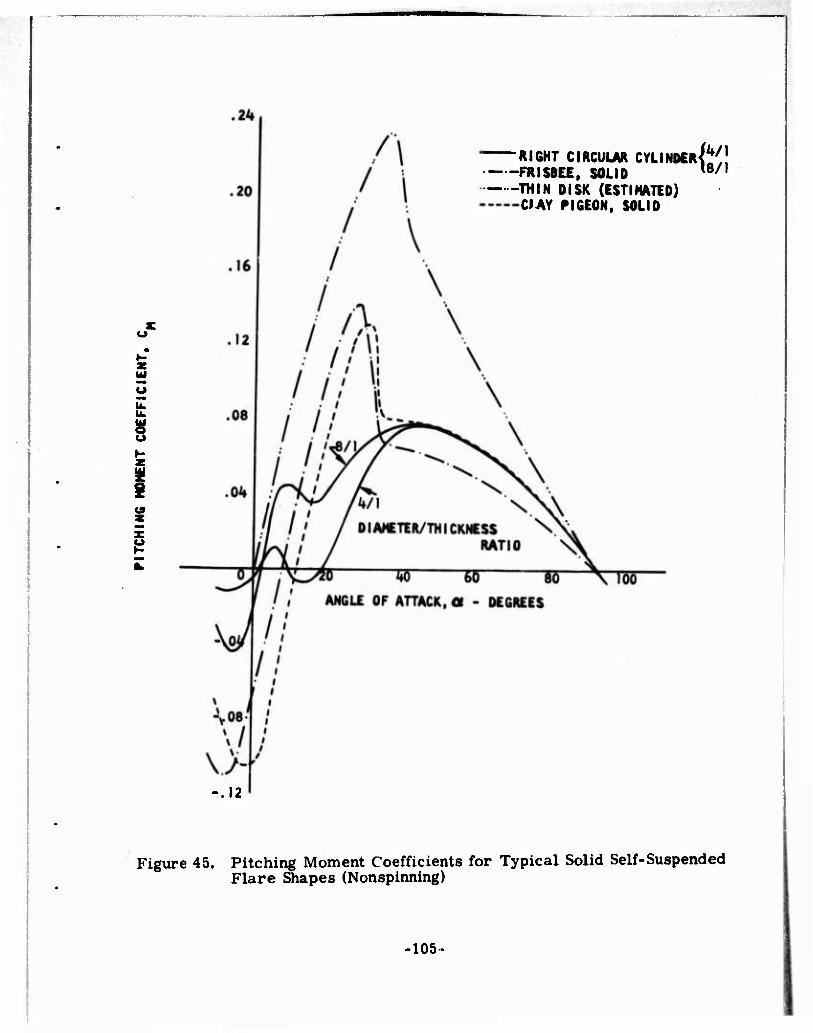
u. u.
i
RIGHT CIRCULAR CYLINOERJ^ FRISBEE, SOLID t8/,
THIN DISK (ESTIHATED) CIAY PIGEON, SOLID
-.12
Figure 45. Pitching Moment Coefficients for Typical Solid Self-Suspended Flare Shapes (Nonspinning)
-105
I
RIGHT CIRCULAR CYLINDER Z^1
CLAY PIGEON. SOLID ^ «ISBEE. SOLID
CYLINDER DIAMETER/THICKNESS
VI
8/1
60 "80 loo" ANGLE OF ATTACK, a - DEGREES
-.8
-.12 I
Figure 46. Normal Force Coefficients for Typical Solid Self-SusiKü^-sd Flare Shapes (Nonspinning)
-106-
10 0
•JO
RIGHT CIRCULAR CYLINDER/VI 18/1
CLAY PIGEON, SOLID
20 kO 60 80
ANGLE OF ATTACK,« - DEGREES
Figure 47. Axial Force Coefficients for Typical Solid Self-Suspended Flare Shapes (Nonspinning)
-107-
b. Thickness Effects - Examination of the solid configuration data and the available literature leads to the impression of a trend towards reduction of the overturning moment at small angles of attack as the effective leading edge thickness increases. We know from Magnus rotor work that longer cylinders, with a diameter-to-thickness ratio of approximately 1:2, have relatively strong restoring moments. The crossover between overturning and restoring is near 1:1. In our case, not only is the slope at small angles of concern but the average level over a ± 30-40 degree region.
In order to obtain gliding flight, if that mode is deuired, the drag should not be much higher than the lift. None of the thicknesses considered seem to be neutral enough over a large enough angle of attack range to permit brute-force delivery in a horizontal orientation. The thicker the disk, the more neutral the pitching moment with angle of attack, but the thicker the disk, the steeper the trajectory and the higher the angle of attack. Thus, it would appear that a 3:1 or possibly 2:1 diameter-to-thickness ratio is likely to provide a desirable combination of stability and trajectory charac- teristics for delivery as a disk when coupled with the ideal delivery orientation, leading edge down.
c. Corner Radius Effects - The detailed effect of small corner radii on basically cylindrical disks has not yet been completely isolated because the radius used on only the top corner of the bodies tested introduced a slight asymmetry into the data. This was arbitrarily faired through re^o for the symmetrical dummy flares which had a bevel radius top and bottom.
The effect ofa gross corner radius depends on whether it is symmetrical or on the top surface only. On the basis of the frisbee, clay pigeon, discus, (and lentricular body data obtained since completion of the work and analysis, ) it would appear to provide a region where the normal force and pitching moment are linear with angle of attack. The extent of this region, or the stall point where flow separates from the top surface, thus appears to be a function of this radius and the effective leading edge thickness.
- J8-
The frisbee and clay pigeon had similar stall points but different basic thicknesses and different apparent corner radii, but similar leading edge thicknesses. Both of these were approximately half that of the 8:1 cylinder. While the slopes of the curves were all similar, and the stall point and depth of drop after the stall, if any, varied with corner radius, the dominant effect observed was the shift of the point of zero moment for the non- symmetrical bodies. An increase in effective camber, by imposing an ever increasing nose-down couple on the linearly increasing overturning moment due to the lift force, increases the angle of attack at which the moments balance. This could be true only up to a point since the clay pigeon has more camber than the frisbee and a higher equilibrium angle, but the cylinder's abrupt change in camber gives a different, nonlinear effect from this idealized airfoil model.
The optimum corner radius has yet to be identified, and as this discussion should have implied, would depend on whether one wants to obtain a maximum nonlinear region of neutral moment with a symmetrical body or desires to exploit the more precarious discrete neutral moment point with its associated finite moment at zero angle of attack, of the unsymmetrical configurations.
A proposed future wind tunnel study to explore the effects of corner radii and their interaction with thickness is described in section IV. B. 3. j.
d. Spin Effects - The spinning model wind tunnel tests tended to confirm the initial impression that the pitching moment and lift would not themselves be affected by the spin, but that the predominant effect would be the pro- vision of gyroscopic stiffness, with small or insignificant Magnus rolling moment.
The test data are cross plotted in Figure 48 for the pitching moment coeffi- cient and rolling moment versus the dimensionless spin rate scaling param- eter, uud/2V, (the peripheral speed ratio Vr/V) at typical values of angle of
-109-
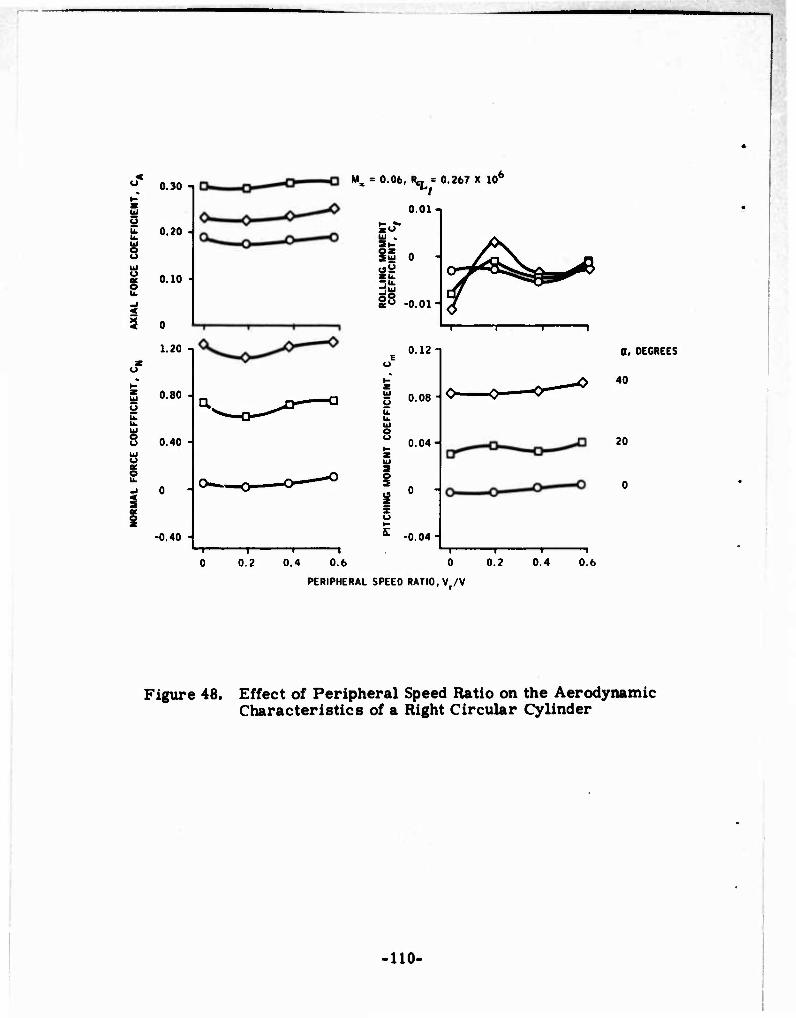
-•" ■ - — -.—.
0 0.30 i
F 0.20 -|
I i oi0 -j
5 o
1.20 -i
S 0.80 5
u 8 o.40 H w
i < s ■ i
-0.40 - —r~ 0.2
Mx = 0.06, R- = 0.267 X 10°
—i l 0.4 0.6
O.Ol-i
iS o
§u -o.oH
^^p^e
o.i2n
n o.o8 i
s
s o S
0.04-
0
s o t- £ -0.04
I i— 0 0.2
PERIPHERAL SPEED RATIO, Vf/V
T 1
—i—
0.4
0, DEGREES
40
20
—i 0.6
Figure 48. Effect of Peripheral Speed Ratio on the Aerodynamic Characteristics of a Right Circular Cylinder
110-
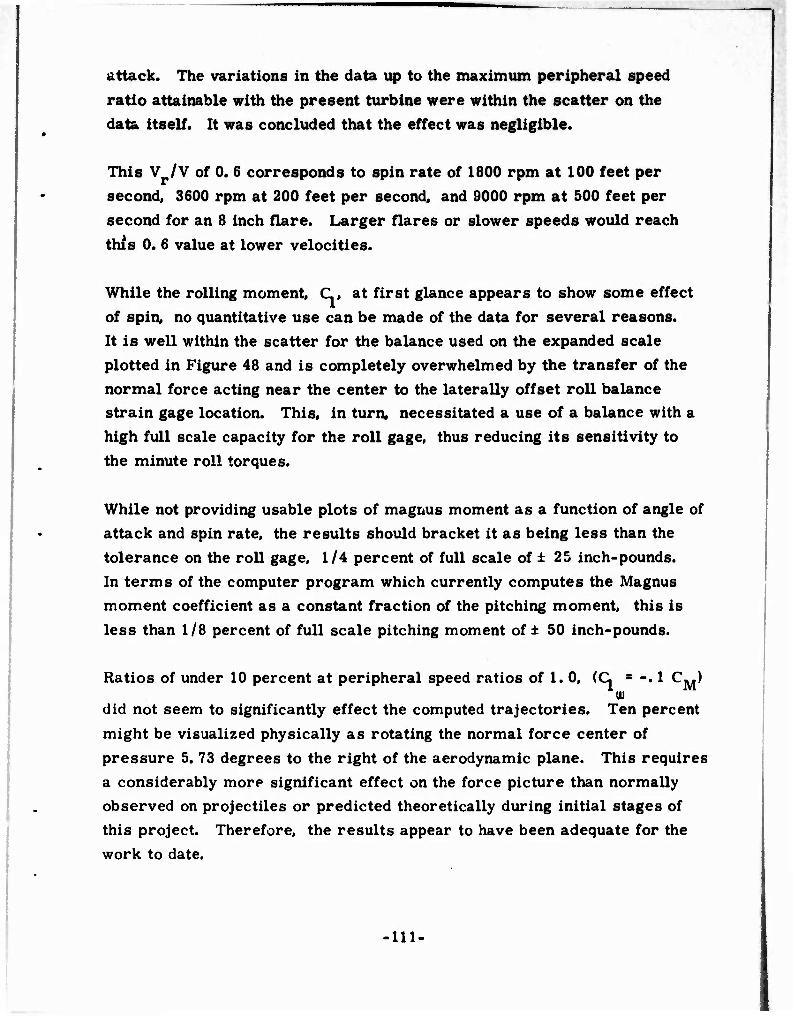
attack. The variations in the data up to the maximum peripheral speed ratio attainable with the present turbine were within the scatter on the data itself. It was concluded that the effect was negligible.
This V /V of 0. 6 corresponds to spin rate of 1800 rpm at 100 feet per second, 3600 rpm at 200 feet per second, and 9000 rpm at 500 feet per second for an 8 inch flare. Larger flares or slower speeds would reach this 0. 6 value at lower velocities.
While the rolling moment, C, at first glance appears to show some effect of spin, no quantitative use can be made of the data for several reasons. It is well within the scatter for the balance used on the expanded scale plotted in Figure 48 and is completely overwhelmed by the transfer of the normal force acting near the center to the laterally offset roll balance strain gage location. This, in turn« necessitated a use of a balance with a high full scale capacity for the roll gage, thus reducing its sensitivity to the minute roll torques.
While not providing usable plots of magnus moment as a function of angle of attack and spin rate, the results should bracket it as being less than the tolerance on the roll gage, 1/4 percent of full scale of ± 25 inch-pounds. In terms of the computer program which currently computes the Magnus moment coefficient as a constant fraction of the pitching moment, this is less than 1/8 percent of full scale pitching moment of ± 50 inch-pounds.
Ratios of under 10 percent at peripheral speed ratios of 1. 0, (C, = -. 1 C,.)
did not seem to significantly effect the computed trajectories. Ten percent might be visualized physically as rotating the normal force center of pressure 5. 73 degrees to the right of the aerodynamic plane. This requires a considerably more significant effect on the force picture than normally observed on projectiles or predicted theoretically during initial stages of this project. Therefore, the results appear to have been adequate for the work to date.
-Ill-
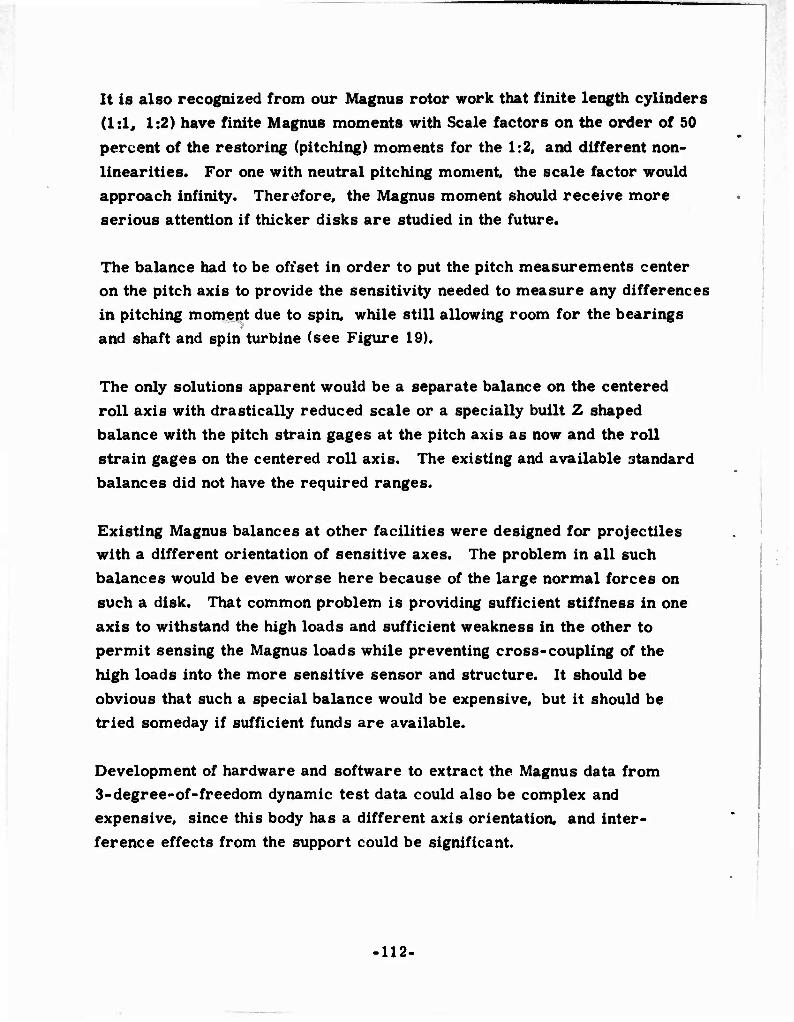
It is also recognized from our Magnus rotor work that finite length cylinders (1:1, 1:2) have finite Magnus moments with Scale factors on the order of 50 percent of the restoring (pitching) moments for the 1:2, and different non- linearities. For one with neutral pitching moment, the scale factor would approach infinity. Therefore, the Magnus moment should receive more serious attention if thicker disks are studied in the future.
The balance had to be offset in order to put the pitch measurements center on the pitch axis to provide the sensitivity needed to measure any differences in pitching moment due to spin, while still allowing room for the bearings and shaft and spin turbine (see Figure 19).
The only solutions apparent would be a separate balance on the centered roll axis with drastically reduced scale or a specially built Z shaped balance with the pitch strain gages at the pitch axis as now and the roll strain gages on the centered roll axis. The existing and available standard balances did not have the required ranges.
Existing Magnus balances at other facilities were designed for projectiles with a different orientation of sensitive axes. The problem in all such balances would be even worse here because of the large normal forces on such a disk. That common problem is providing sufficient stiffness in one axis to withstand the high loads and sufficient weakness in the other to permit sensing the Magnus loads while preventing cross-coupling of the high loads into the more sensitive sensor and structure. It should be obvious that such a special balance would be expensive, but it should be tried someday if sufficient funds are available.
Development of hardware and software to extract the Magnus data from 3-degree-of-freedom dynamic test data could also be complex and expensive, since this body has a different axis orientation, and inter- ference effects from the support could be significant.
-112-

e. Combustion Effects - A preliminary analysis of the effect of the combustion wake on the aerodynamic characteristics was performed, based on preliminary estimates of burning pressures and temperatures obtained from NAD/Crane prior to the manifestation of sufficient pressure to generate finite thrust
This simplified analysis is presented in Appendix A.
The conclusion was reached that the effect of the flare plume on the aero- dynamic characteristics will be negligible if thrust is negligible. Extension of this cursory analysis to more adequately account for the actual combus- tion behavior would in itself appear to be a major research task for a combustion research laboratory, and outside the scope of anticipated near- term developmental efforts.
If the actual combustion effects do place the pressures/forces outside the state of the art of analytical prediction, then the only recourse is to relatively arbitrary assumptions for analytical flight mechanics studies and to free-flight testing for definition or verification of the required assumptions. As indicated in the next subsection on cavity effects, a recommended interim arbitrary assumption would be that the aerodynamic forces and moments are the same as the corresponding solid body, with thrust added as indicated by the burning characteristics or laboratory measurements.
f. Cavity Effects - The measured effects of the variable cavity in the 8:1 baseline cylindrical flare wind tunnel model are shown in Figure 49 for the pitching moment. The variation here is very erratic and did not lend itself to a specific or generalized model for interpolation. It was noted, of course, that very little change occurred until the cavity radius exceeded 65 percent of the body radius. Then the most significant variation occurred between this condition and the hollow condition. This apparent insensitivity to cavity until virtually hollow was even more pro-
nounced on the normal force and axial force coefficients (Figures 50 and 51).
-113-

CAVITY RADIUS RATIO
0. .25 .63 .95
V
-.8
ANGLE OF ATTACK,« - DEGREES
Figure 49. Effect of Cavity on Pitching Moment Coefficient of Baseline Self-Suspended Flare Shape (Nonspinning)
•114-
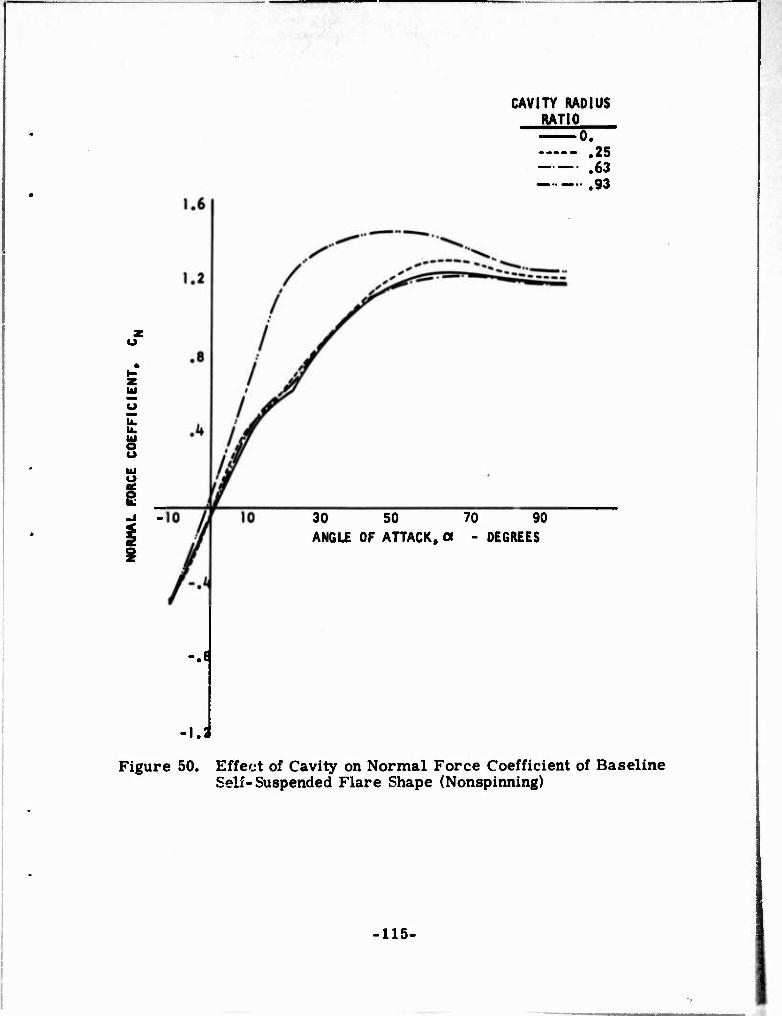
CAVITY RADIUS RATIO
!25 .63 .93
o o u AC
30 50 70 90 ANGLE OF ATTACK,a - DEGREES
J
-I.
Figure 50. Effect of Cavity on Normal Force Coefficient of Baseline Self-Suspended Flare Shape (Nonspinning)
-115-
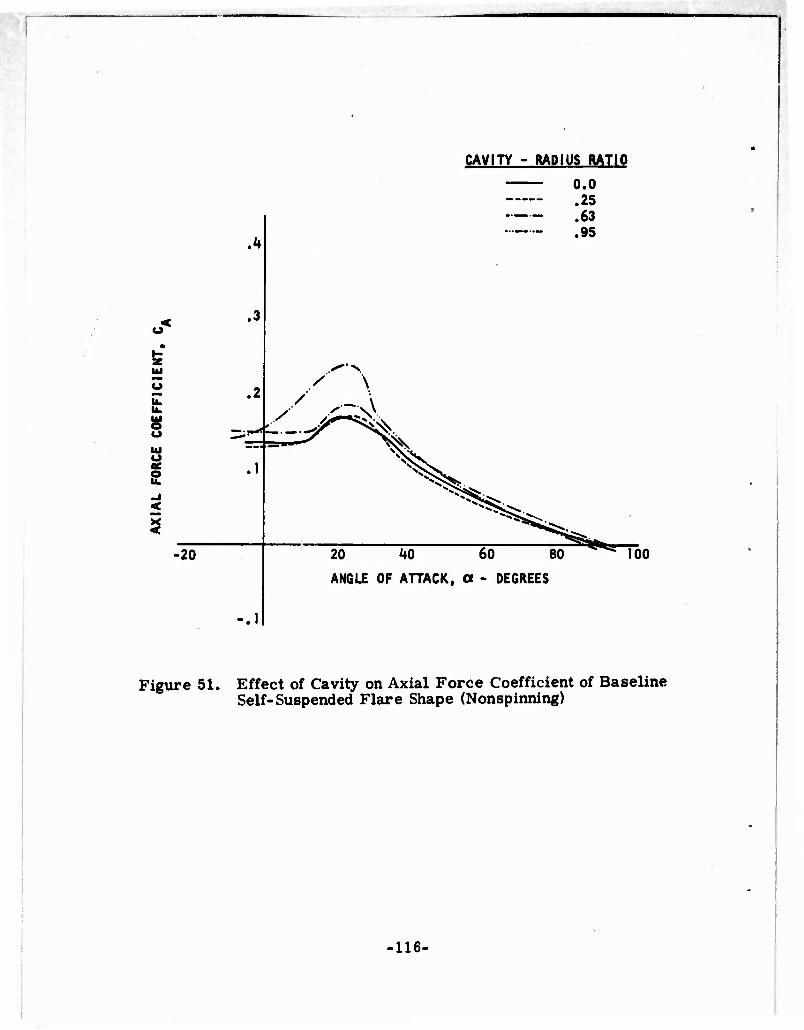
CAVITY - RADIUS RATIO
u. b.
U o
0.0 .25
.63
A .95
.3
A^'^\
.2
J ^x^^ -20
"J
20 ^0 60 80
ANGLE OF ATTACK, a - DEGREES
100
Figure 51. Effect of Cavity on Axial Force Coefficient of Baseline Self-Suspended Flare Shape (Nonspinning)
-116-

Even though the overturning moment for this 8:1 cylinder, and the anticipated precession, was reduced compared to the clay pigeon and frisbee it still appeared to be excessive in computer simulations.
The testing and study has more recently concentrated on thicker solid configurations in a search for a configuration which would be stable during the indefinite period between launch and ignition, before extending the study of cavity burning effects. There is not yet verification that such a con- figuration and associated delivery technique has been achieved, and the burn- ing pressures are presently higher than anticipated and desired. Therefore, no attempt has been made to estimate the effects of the burning cavity on the 4:1 cylinder data or on the 6:1 ds.ta interpolated between the solid 8:1 and 4:1 data nor to extrapolate for thicker configurations.
The available data on cavity effecta did not reveal discernible trends upon which to base a standardized interpoUtion/prediction model. Therefore, the computer program is configured to accept the primary aero coefficients as measured or estimated curves for four different cavity radii or to ignore the cavity change completely by accepting only one curve. In view of the present and anticipated state of knowledge of the high pressure plume effects and the fact that the 8:1 cylindrical configuration for which cavity data are available is not presently recommended for tactical application, the recommended interim approach would be to use one curve and ignore the changes during burning.
As could be observed by comparing Figures 42 through 44 and 45 through 47, the basic form of the coefficients for the clay pigeon and frisbee is similar whether in the normal hollow or the flare/ordnance oriented solid condition. In both cases, filling in the bottom raises the level and slope of the overturning moment and reduces the angles for neutral overturning moment. It slightly increases the normal force level of the clay pigeon while decreasing that of the frisbee. While no data were obtained for inter- mediate cavities, the implication is that a partially hollow base may be
117-

—
beneficial in tailoring the pitching moment asymmetry. Such a lip. if shallow enough, could be designed for nesting so as to maximize the packing density while filling the center dome with payload material. A plan for exploring partially cupped configurations in the wind tunnel is discussed in section IV. B. 3. j.
g. Aerodynamic Damping - The aerodynamic pitch damping measured
in the wind tunnel for the solid and hollow frisbee and 8:1 cylinder con- figuration is shown in Figure 52. The tests were conducted with non- spinning models on a spring restrained side-mount. The interpretation
made by the wind tunnel personnel was that the damping coefficients were very small based on their experience with conventional and unconventional bodies. The presence of some positive values which were also observed visually as amplitude buildups may be attributed to hysterisis-like flow
separation, which has been observed for thin and/or sharp edged disks
and is the cause of autorotation of thin nonspinning disks and plates. This effect [which would have undamped the high frequency nutations (wobble)] was not preceptible on any of the flight tests conducted to date. As a
matter of fact, the small wobble induced by the launches appeared to damp
out fairly rapidly even though quantitative data on decay were not obtained.
Thus, the spin either prevents this phenomenon from occurring aero- dynamically or resists it gyroscopically.
The results of the trajectory program were insensitive to the magnitude of the aerodynamic damping.
h. Idealized Aerodynamic Requirements/Alternate Configurations - The computer simulations and linearized analysis indicate that delivery in a manner somewhat analogous to that of the frisbee could require launching
at a spin stabilized orientation corresponding to that which it would have in
steady glide, front edge 15-20 degrees downward. The glide angle of attack
would be on the order of 20-30 degrees positive required to support the
weight. At this glide angle, the pitching moment would have to be zero to
-118-
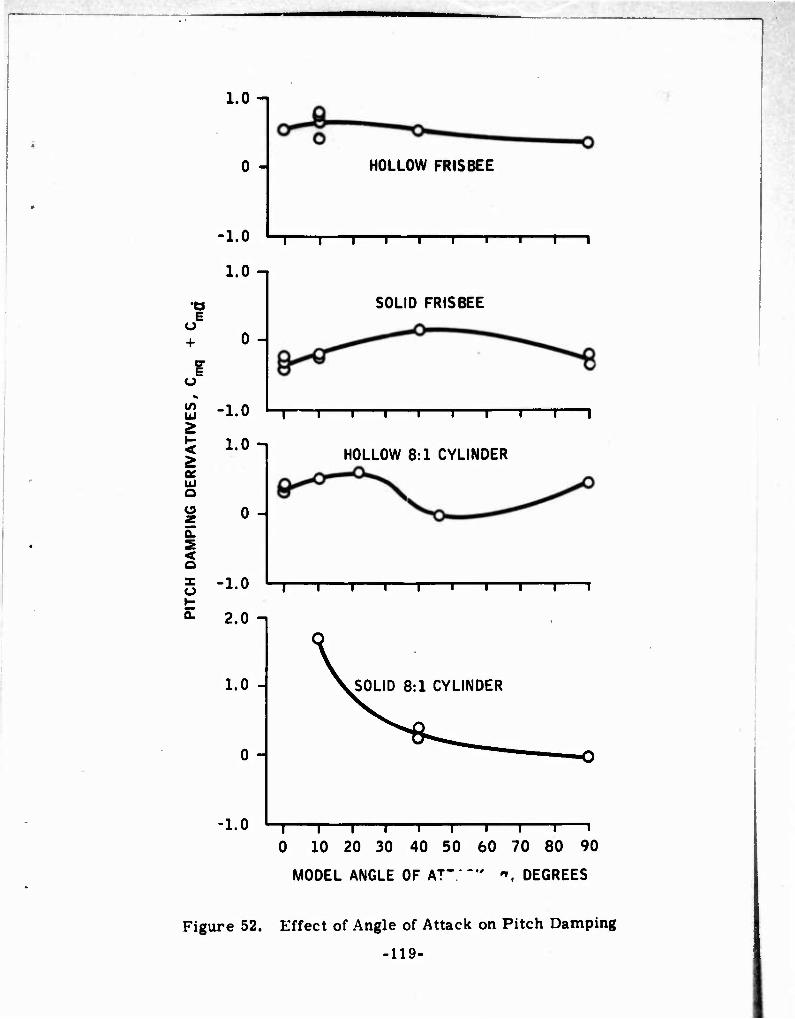
1.0 -i
0 -
-1.0
1.0 -,
+ 0-1
12 -i.o
^ 1.0 -i
i o-
H0LL0W FRISBEE
T 1 1 r T r
1.0 -
0 -
■1.0
SOLID FRISBEE
SOLID 8:1 CYLINDER
I 1
T 1 1 1 1 1 1 1 1
HOLLOW 8:1 CYLINDER
5 -1-0 L-T 1 1 1 1 1 1 1 1 1
^ 2.0 n
1 1 1 1 1 1 1 1 1 1 0 10 20 30 40 50 60 70 80 90
MODEL ANGLE OF A?" "*' *, DEGREES
Figure 52. Effect of Angle of Attack on Pitch Damping
-119-
prevent precession. As previously discussed, the frisboe possesses a point of neutral moment at an angle sufficient to support the weight.
But if launched from an airplane in level flight this edge downward orientation of the disk would correspond to a large negative initial angle of attack. With a displaced linear moment characteristic or the finite nonlinear curves observed so far, the area under the curve between launch and glide angle of attack would seem to provide an excessive precession transient. One brute- force approach to this would be to specify that the pitching moment be negligible for all ± angles of attack encompassing steady glide and launch. Naturally, it would seem to be desirable to have it negligible at all angles of attack. Such an idealized moment curve with a large neutral zone is sketched in Figure 53.
The observed effects of thickness indicated in Figure 45a trend in this direc- tion for the cylindrical flare as the diameter-to-thickness ratio decreased from 8:1 to 4:1. Some published data have indicated that the slope of the pitching moment versus angle of attack may be zero, at least at zero angle of attack, for ratio of 1:1, but such a shape would not stay near zero long, and the Magnus rolling moment and side force would undoubtedly become significant.
It is hopeful that an acceptable combination of pitching and magnus charac- teristics will be obtainable in the 3:1 to 2:1 category.
If not, and thicker disks (becoming cylinders) are indicated, one might as well deliberately design it as a Magnus ("flettner") rotor with the spin axis horizontal and flame out both ends. The glide descent angle would be quite steep for a 1:1 rotor. The glide velocity would be less than 150 feet per second for a 5 pound flare with the same volume as the 8 inch diameter. 2 inch thick prototype tested at Hurricane Mesa, decreasing as mass was lost in a manner similar to that described for the disks. A 1:2 Magnus rotor would have a glide velocity less than 160 feet per second and a possibly
120-

s
s
s I
§
u
0)
I
M 0)
0
ß 0)
2
2
T3 4) N i-i
T3
in a»
.121-
shallower glide. Prespin would help insure the desired orientation, while unspun cylinders with spinup ribs would have a random direction and orienta-
tion transient. Prespin with the bottom edge retreating would tend to make it fly rearward and the opposite, forward, depending on the tactical mission.
Another approach to generation of the desired neutral overturning moment characteristics was inspired by another frisbee variation toy which has appeared since the start of the project and since it was indicated that the
flare would be a bottom-burning cup instead of a top and bottom burning annulus. This ring-shaped toy appears to be more stable when thrown in the frisbee mode than the more conventional frisbee-like devices. This couli be attributed to a more neutral overturning moment for this "tandem
airfoil" arrangement. The rear surface would be generating a lift counter-
acting the overturning moment of the lift of the forward surface, whereas on a disk or conventional frisbee-type the net lift force acts forward of the center. Such an effect might be possible if the burning pressures permit airflow through the cavity to reach the rear portion of the annulus.
As a matter of fact, the measured slope of the frisbee moment with angle of attack corresponds to a center of pressure location about 40 percent of the diameter aft of the leading edge or 20 percent of the radius forward of the
center of gravity, while the standard figure for a thin two-dimensional air- foil is 25 percent aft of the leading edge and was reflected in our early
estimates of this disk.
If the rollup to glide that can be obtained for a frisbee tossed on edge, tilted to the left in a near vertical plane, and tentatively observed for light sabots in another project can be extrapolated to this dense body, then the desired configuration would appear to be a domed and possibly cupped body. It would resemble a smooth, almost solid clay pigeon or a thick, almost
solid frisbee. This is because the observed frisbee roll up is attributed
to the nose down pitching moment at the small initial angle of attack, below
the equilibrium angle, which gyroscopically induces a right hand tilt pre-
cession toward wings level.
-122-
i. Wind Tunnel Model Configurations - Drawings of the wind tunnel models used are shown in Figures 54 - 57. The frisbee and clay pigeon models were tested either hollow at normal wall-thickness or solid by the use of plugs. The 8:1 cylinder used nesting plugs to provide the cavity radii, covering the range fj-om solid, r /r = 0, intermediate stages, r /r = 0. 25 and r /r = 0. 65, to hollow, r /r = 0. 95. In the interest of simulating the averaging of the star shaped grain which would come in spinning flight, the cavities were circular and assumed to represent the average annulus corresponding to the star shaped grain.
The 4:1 model tested on the spinning rig was tested only in the solid condition. The model design support system does lend itself to moderate cupping of the bottom face and to moderate radiusing of the upper and lower corners. A proposed series of such tests to explore parametrically the effects of cor- ner radii and cavities within the bounds permitted by the model is shown in the following subsection.
A scheme for accurate measurements on a spinning hollow model has not yet been devised. As a matter of fact, the presence of the side-sting
• mounting block could very likely have introduced interference effects into the nonspinning hollow model data obtained.
j. Recommended Extension of Present Wind Tunnel Test Data - While it is recognized that Magnus effects due to spin could become more sig- nificant for the thicker shapes under consideration, their measurement would require development of special equipment and/or data reduction techniques. It was therefore concluded that the most expeditious approach to both screening gross configuration modifications for further study and isolating some of the finer interacting effects of present configurations would be to use the present 4:1 spinning model in a predominantly non- spinning mode to explore these effects systematically.
A preliminary plan for such an exploration is presented in Table 7, cate- gorized by purpose and priority.
-123-
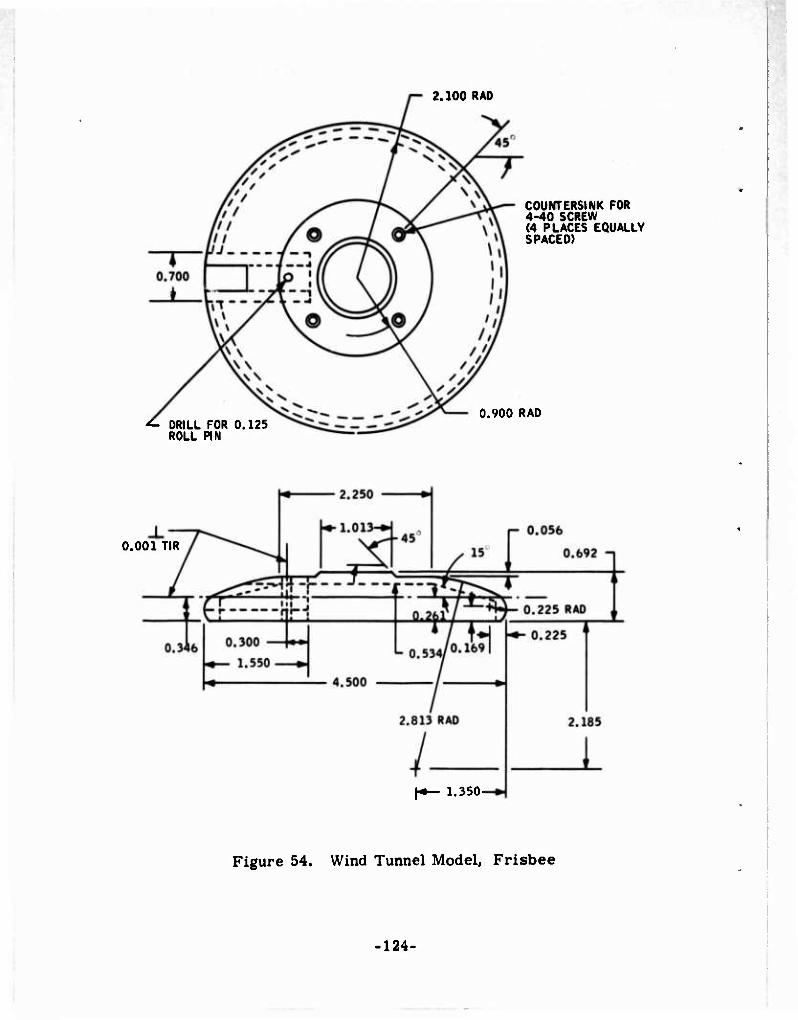
2.100 RAD
COUOTERSINK FOR 4-40 SCREW (4 PLACES EQUALLY SPACED)
DRILL FOR 0.125 ROLL PIN
0.900 RAD
0.001 TIR
1.350-
Figure 54. Wind Tunnel Model. Frisbee
■ 124-
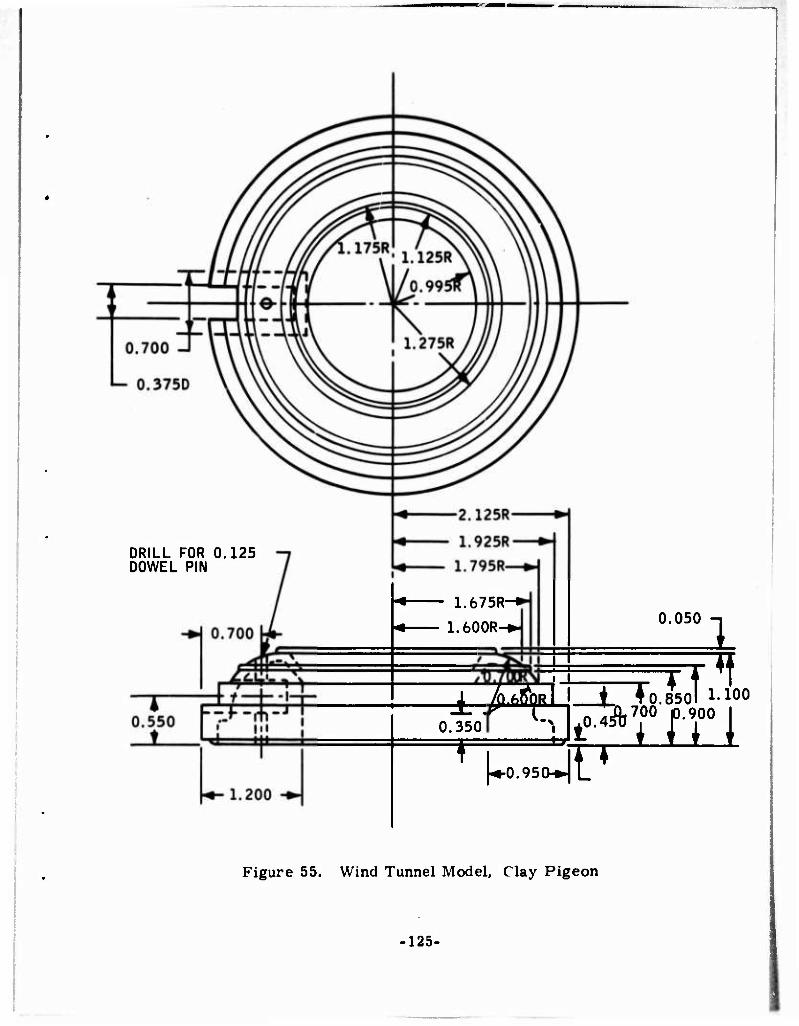
DRILL FOR 0.125 DOWEL PIN
1.675R
1.600R-
0.350
0.050 1
. _ . i ^««
t ♦0.850l 1-100 ^700 p.900
[♦0.950-^| L
r00 p.900 i
Figure 55. Wind Tunnel Model, Clay Pigeon
125-
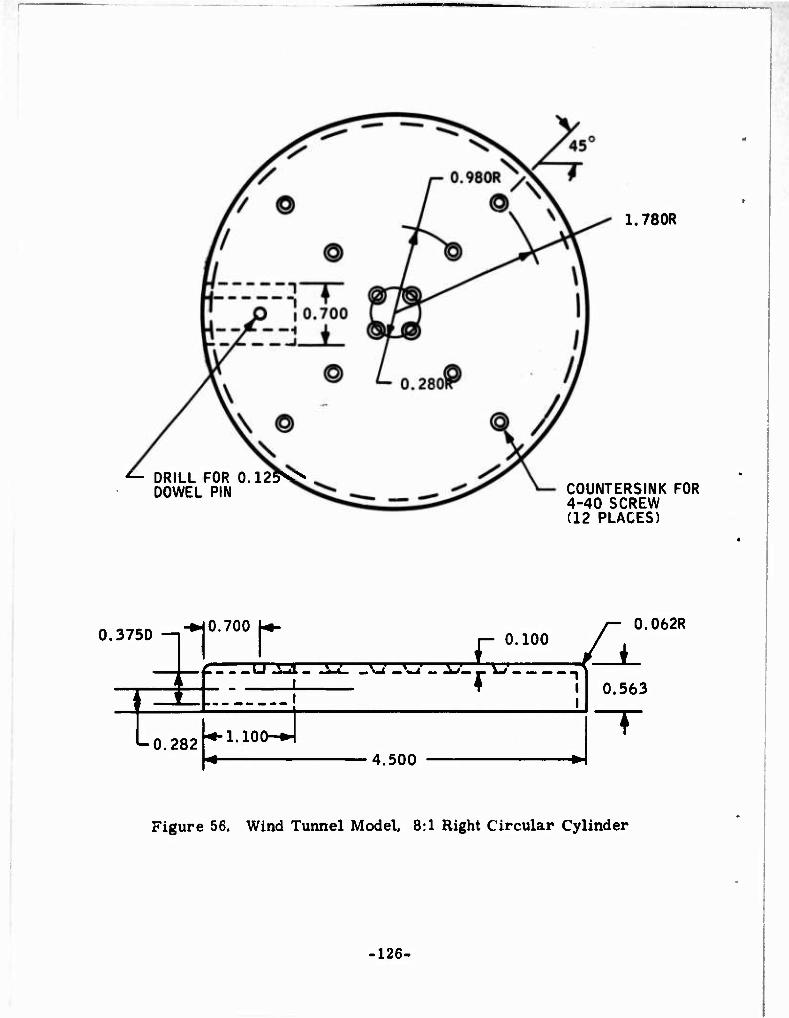
DRILL FOR 0.12*^ DOWEL PIN
1.780R
COUNTERSINK FOR 4-40 SCREW (12 PLACES)
0.375D —i -•»jO.700 U-
C U AJ _ A-L SJ -^ _ A^L " W 1 t .»
0.100 L 0.062R
>-0.282 h^l.lOO-H 4 4.500 •^
t 0.563
"T
Figure 56. Wind Tunnel Model, 8:1 Right Circular Cylinder
126-
K\\\\V\\\Wa
^ o o o
V
SSSSSB
^ 0 0 0
^ ri^4v^s\\.\\\' .\\
1
S
1
m
127-
Table 7. Interim Wind Tunnel Test Plan for Follow-On Studies
A. CORNER RADIUS AND BOTTOM LIP VARIATION (BASIC 4:1 MODEL)
1. TOP CORNER
a. PRESENT
b. SAME R AS 8:1 IF > PRESENT
c. 1/2 INCH RADIUS
2. TOP AND BOTTOM
a. SAME AS PRESENT
b. SAME R AS 8:1 IF > PRESENT
c. 1/2 INCH RADIUS
3. LIP ON BOTTOM
a. REMOVE BOTTOM SECTION AND ADD LIP SO THAT 41 THICKNESS RKTIO IS MAINTAINED.
b. LEAVE BOTTOM SECTION ON BASIC MODEL AND ADD LIP SO THAT THE ASSEMBLY HAS A 2:1 THICKNESS RATIO.
B. THICKNESS RATIO VARIATION (TWO CORNER RADII DETERMINED BY A)
1. 6:1
2. 4:1 (FROM A)
3. 2:1
C. VARIABLE CAVITY MODELS - ARBITRARY SHAPES AND SI2ES.
Vs 75 ■ THREE TOPS
TWO BOTTOM DEPTHS WITH PLUGS
1. TOP CORNER RADIUS AND THICKNESS
a. TWO BEST DETERMINED BY A AND B.
b. LARGER RADIUS ON TOP (APPROACHING CLAY PIGEON SHAPE).
2. CAVITY DEPTH AND RADII TWO CAVITY DEPTHS (TWO DIFFERENT hg) WITH ONE PLUG FOR EACH BOTTOM.
TEST AT M = 0.2 «
0 RANGE
A. -10 TO 40 DEGREES
B. -10 TO 40 DEGREES
C. -10 TO 90 DECREES
NUMBER OF CONFIGURATIONS
7
4
12
-128-
4, Free-Flight Testing
Formal free-flight testing as such was not the direct responsibility of the
aerodynamics contractor in the Self-Suspended Flare project« but the contractor participated in planning, instrumenting, observing and inter- preting the tests at Hurricane Mesa in November 1969, with respect to
flight behavior and aerodynamic characteristics, and was made responsible
for data reduction. This participation was expanded with respect to original
plans in an attempt to maximize the aerodynamic data obtained from the test series. The tests were originally planned for inert flare trajectory and live
flare trajectory and illumination tests.
In addition to these formal instrumented tests at Hurricane Mesa, limited
informal flight testing of clay pigeons and frisbees was also conducted in
conjunction with the Hurricane Mesa tests.
Free-flight testing for a completly unrelated project at the site at Hurricane
Mesa and in Minnesota also gave some interesting insight into the problem
because of the observed apparent gliding flight of some of the light weight
disks used for sabots in that project.
The Hurricane Mesa tests tended to validate the math models developed and gave valuable insight into problem areas, but in themselves neither estab- lished feasibility of the concept nor yielded quantitative aerodynamic data.
a. Hurricane Mesa Tests - A log of the configurations tested at Hurricane
Mesa in November 1969 for the 48 official launches is shown in Table 8. Almost 5000 feet of film plus numerous still negatives were obtained. This table indicates the purpose of each test number and gives brief remarks
on the observed flight behavior. The remark "OK" means that the orienta- tion appeared to be level and the trajectory as expected.
129-

Table 8. Self-Suspended Flare Test Configuration Log
THT FLAKE msf WEICHT (POUNDS)
THICKNESS (INCHES 1
LAUNCH PNESSURE
(PS 11
PITCH DOWN
IDECREESI PURPOSE REMARKS
1-5 «/» 12 12 2 200 0 86W CHECKS
6 N/* 12 12 ? 200 0 STANDARD INERTS FELL SHORT
7 w* 12 12 2 200 0 STANDARD INERTS FELL SHORT
« N/» 12 12 2 200 0 STANDARD INERTS OK
9 N/« 12 12 2 200 0 STANDARD INERTS OK
10 H,H 8 1 2 200 0 STANDARD INERTS OK
11 */• 8 5 2 200 0 STANDARO INERTS OK
12 N/« 8 5 2 200 0 STANDARD INERTS OK
1J «/* 8 5 2 200 0 STANDARD INERTS OK
14 N-l 12 3.5 1.312 160 0 SOCIAL - TWO LAVERS WOOD PEELED OFF TO LEFT.
19 H-4 12 7.25 1.39 180 0 SPECIAL - TWO LAVERS WOOD SLOWER PEEL OFF-STOPPED ROLL AND GLIDED.
16 H-3 12 3.5 1.2 160 16.5 SPECIAL - TILT DOWN ROLLED ON EDCE.
17 H-2 12 3.5 1.187 160 16 5 SPECIAL - REPEAT OF TEST 16 ROLLED ON EDCE
1« STANDARO 12 12 2 200 17 5 COMPARE STANDARD WITH TESTS 16 AND 17
STRAIGHT
1» LIVE 1 5 2 200 17.5 LIVE LEVELED OFF.
20 LIVE 8 i 2 200 0 LIVE WENT STRAIGHT UP.
21 M-17 8 2.25 1.75 200 0 LICHT 8-INCH SPECIAL ROLLED OFF NEAR END
22 H-1S 8 3.7 1-15/16 200 0 MID 8-INCH SPECIAL CLOSE TO 8-INCH STANDARD
2J LIVE S 5 2 200 0 LIVE DOWN AND STRAIGHT UP.
24 LIVE 8 5 2 200 0 LIVE DUO.
2»-33 LIVE 8 5 2 200 0 LIVE DUD OR CLIMBED.
» ■ it «/A 12 12 2 200 0 REPEATS OF 12-INCH STANDARD INERTS
TEST 35 IS SHORT OF OTHER.
37 H-10 12
11-1/4®
4-1/2®
1-14/32 200 0 FRISBEE SPECIAL PELLED OFF.
3« H-19 12 2 200 0 FRISBEE SPECIAL SOME ROLL.
39 H-19 12 2 180 0 FRISBEE SPECIAL ROLLED ON EDGE.
40 H-ll 12 9-5/8 2 180 0 FRIS8EE SPECIAL CONTINUOUS PRECESS AND GLIDE
41 H-21 8 4-1/2 2 180 0 FRISBEE SPECIAL CONTINUOUS PRECESS - SOME PAUSE.
42 H-7 8 3-1/2 1.9 160 0 FRISBEE SPECIAL CONTINUOUS PRECESS.
43 H-t 8 2 1.8 160 0 FRISBEE SPECIAL CONTINUOUS PRECESS
44 H-22 8 5 2 160 16 STANDARD FLARE PITCHtD DOWN
NIL PRECESS
43 H-24 8 2-1/4 2 140 16 LICHT CVLINDER SPECIAL SLOW PRECESS AND GLIDE.
4t i H-9 8 2 1-3/4 140 16 FRISBEE SPECIAL PRECESS AND CONSIDERABLE TRAVEL TO LEFT.
47 H-23 8 2-1/4 140 0 LICHT CVLINDER SPE( IAL SOME PRECESS
48 K/A 8 5 2 200 0>16 DECREE ROLL
EFFECT OF ROLL ON STANDARD FLARE
NIL PRECESS, 100 FEET TRAVEL TO RlOHt
Q HONEVWELL AND ORI RECORDS ARE REVERSED ON THE WEICHT OF TESTS 38 AND 39.
130-
b. Hurricane Mesa Test Instrumentation - The photographic instrumenta-
tion arrangement at Hurricane Mesa is illustrated in Figure 58. The equip-
ment was divided between the launch site, the nearby control site, and the tracking site which was placed on another point of the mena which gave full view of the launch and impact area. The tracking site was 730 feet from the launcher and the launcher was aimed perpendicular to the line joining
the launcher and tracking camera. The tracking camera and launcher were within inches of a level plane. The separate sites were illustrated in Figures 11 through 15.
In addition to the launcher at the launch site, (also called boresight) there
was the boresight LoCam tracking camera with a 12-240 mm power zoom lens above the launcher on a forklift, a test number board visible to the
tracking site cameras, and a launch signal flash bulb, plus camera synchro- nization and timing electronics. The power zoom motor was preprogrammed and was synchronized with the launch signal.
Launch velocity was controlled by the pressurization level which had been
previously calibrated for the standard flares (50 feet per second and 1000 rpm for a 12 inch diameter, 12 pound inert flare and 75 feet per second
and 1500 rpm for an 8 inch, 5 pound inert flare at 200 psi). The launch
condition had been found to be quite repeatable. Calibration data were not
available for the field modified special units, but it was hoped to obtain
velocity from the tracking data. The launcher was released by a solenoid
on electrical signal from the launch control box, or could be fired manually.
Below the launch site on the sloping shoulder of the mesa was placed a grid of 10 5-foot long poles with alternating 1-foot red and white stripes laid
horizontally at 1 degree intervals of line of sight depression from the bore-
sight station. These are barely discernible in the still photos, but were visible to the color tracking cameras when they were in the field of view. This grid was expected to provide adequate definition of flare position rela- tive to the boresight camera, and the rugged terrain discouraged more extensive arrangements. All earlier flights had shown virtually planar trajectories (see Figure 59).
-131-
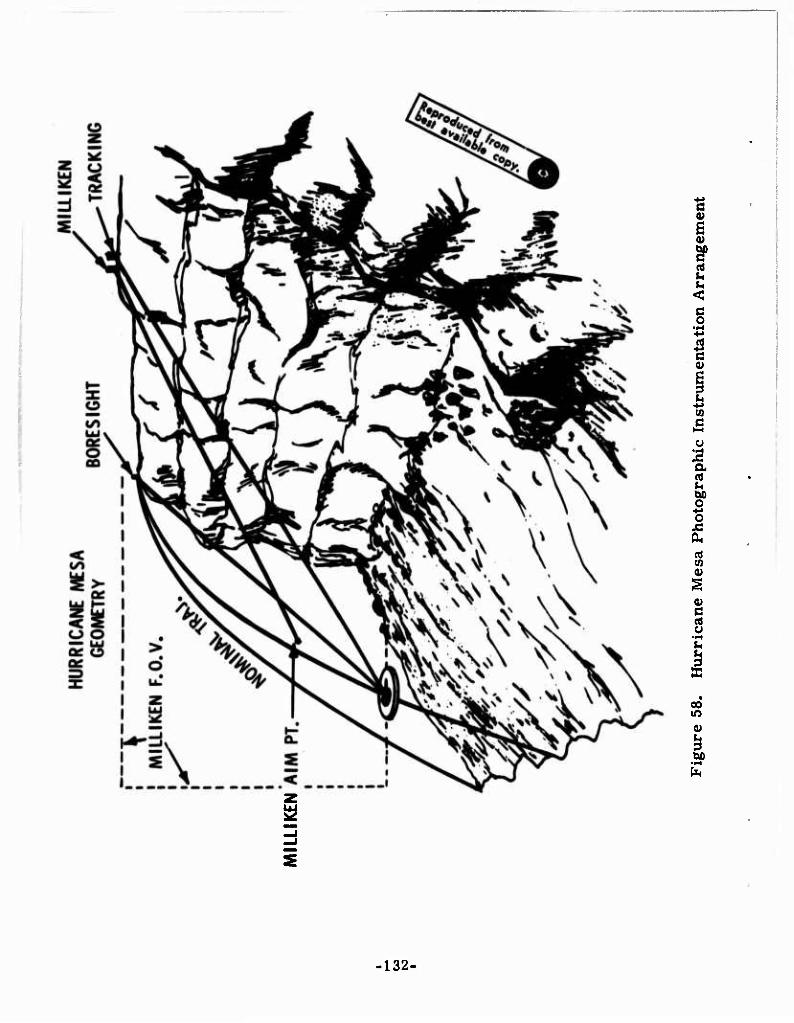
I
I I
I
I 0)
I 00 m
^ d
•132.

I-lUurc .>!'. Impai 1 Xrca and I f.u kitiu < ■ i'i ;
The impact grid survey conducted from the boresight forklift was supplanted by Hasselblad still photos of the impact area and surrounding terrain traversed by the flare.
At the control site, a safe distance from boresite on the edge of the cliff, was located the launch control box which electronically controlled launch of all flares and ignition of the live flares with programmed delays and provided event pulses to the camera synchronization circuit and the flashbulb. The launch countdown was transmitted by radio.
At the tracking site there was a LoCam tracking camera with a 300 mm telephoto lens mounted on a panhead with synchro pickoffs for azimuth and elevation, a recording box which contained the azimuth and elevation read- outs and the recording camera, a fixed aim Milliken panoramic motion picture camera, and associated timing electronics. These were supple- mented by a Hasselblad panoramic still camera for the live flare tests and the terrain mapping. The focal length of the Milliken camera was changed from 17 mm for the day shots to 10 mm for the night shots.
Figure 58 indicates the relationship of the respective camera lines of sight and of the fixed field of view of the Milliken camera. On this figure, nominal trajectory refers to the projection of the apparent trajectory as seen from the tracking site onto the nominal ballistic vertical plane through the launcher aim axis. If there were no lateral deviation, the actual and nominal ti'ajectoriee would coincide. Because the cameras were aimed down- ward and consequently inclined to this nominal plane, there was some slight distortion of the trajectory images that was corrected for in the data reduc- tion.
In addition to transit surveys of the site locations and the trajectory grid, calibration procedures included checking the operation of the boresight power zoom lens against dummy flares at measured distances. This was found to be sufficiently repeatable such that one standard zoom lens
-134-
calibration curve against time was used. This lens calibration curve of focal length versus time which was used in conjunction with boresight
image size versus time (Figure 60) to determine slant range from bore-
sight to the flare, which, in turn, was required to convert image apparent
position to crose range position.
The flashbulb at the launcher was intended to provide a launch signal in the
field of view of the cameras to backup the synch signals on the film margin
transmitted by cable. It was not always in the field of view of the zoom lens, however. The repeatability of the framing rate of the tracking cameras,
which were allowed to build up to speed during the countdown, not only pro- vided a backup to the timing light signals on the film margin but greatly simplified the subsequent data reduction. The semi-automatic film reading
equipment to be used could both count frames traversed and advance a
predetermined frame interval.
c. Typical Hurricane Mesa Results for Standard Inert Flares — The
planar trajectories obtained agreed fairly well with predictions for the
launch conditions, and the observed precessions tended to validate the precessional computer programs. There was reasonable correlation with
the analytical criteria solutions, but the unrealistically rapid change in angle of attack plus the velocity variations makes it difficult to correlate such linearized analyses closely and makes it impossible to use these linear solutions to extract the desired aerodynamic coefficients. A better
flight simulation would have required much higher launch velocities from a sled or aircraft to keep the angles small.
While not successful in producing quantitative data, not too much was expected, and these tests were quite valuable because they did provide
qualitative validation of the math models and insight into the dynamic
criteria, revealed problems in flare design, gave experience in field test- ing and data collection, and led to experience in data reduction.
-135-
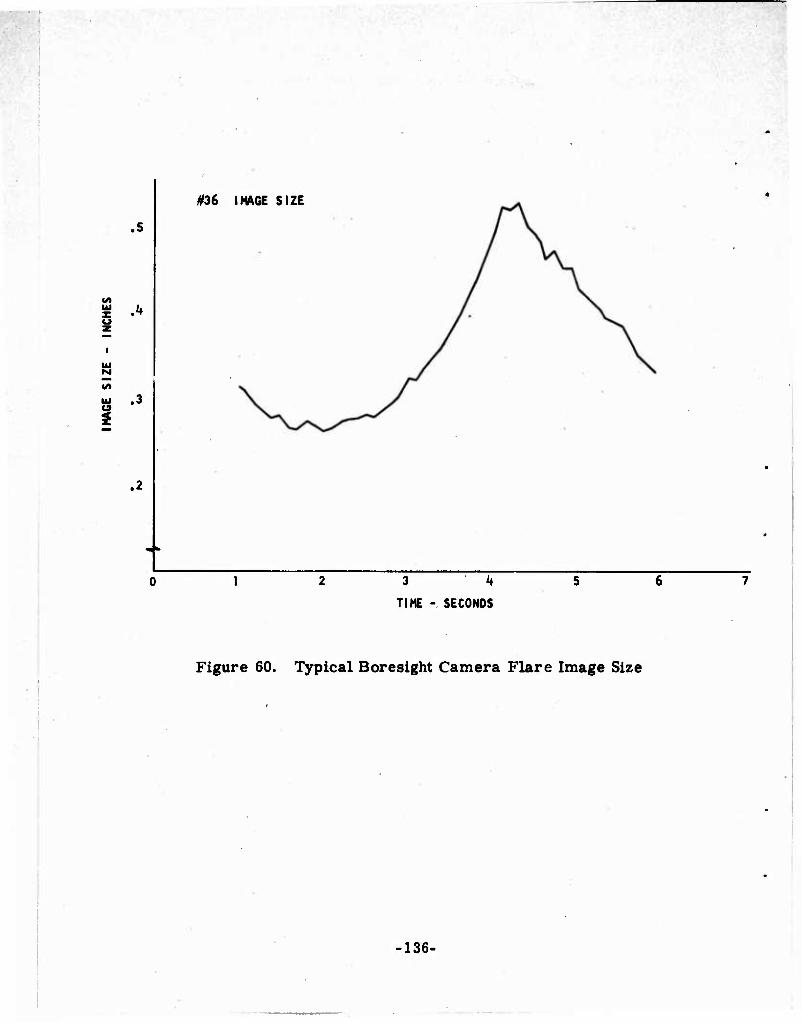
#36 IMAGE SIZE
.5
CO
A
I/»
ui ,3 B
.2
3 k
TIME - SECONDS
Figure 60. Typical Boresight Camera Flare Image Size
-136-
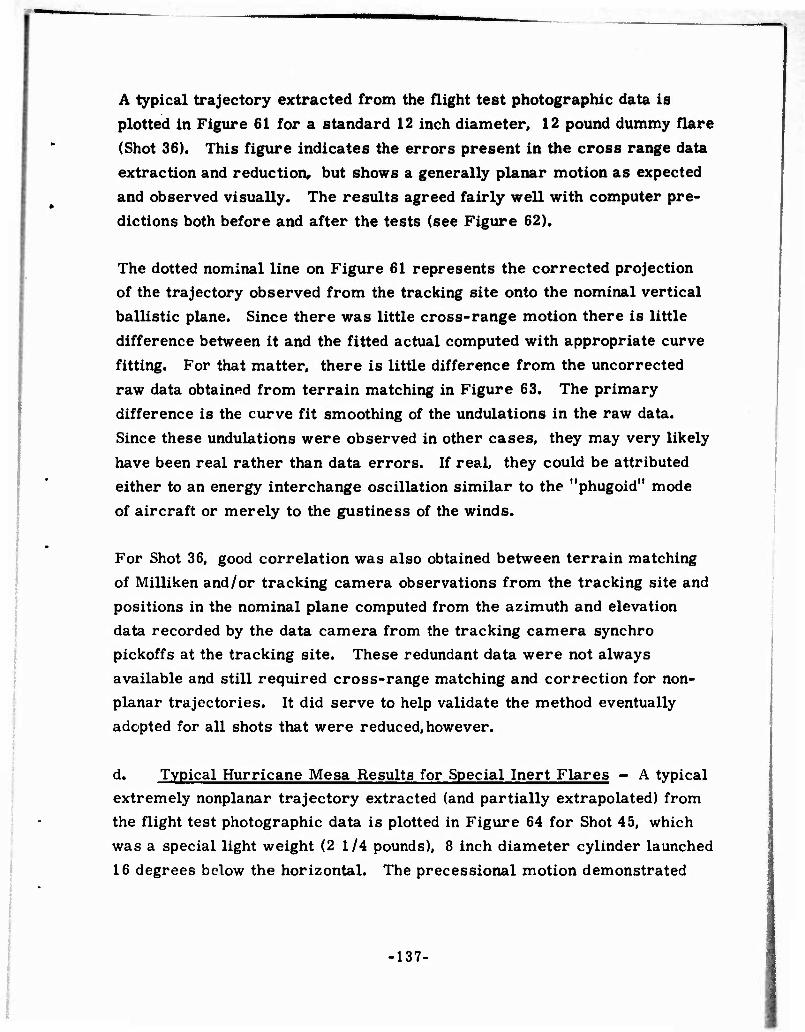
A typical trajectory extracted from the flight test photographic data is
plotted in Figure 61 for a standard 12 inch diameter, 12 pound dummy flare
(Shot 36). This figure indicates the errors present in the cross range data
extraction and reduction, but shows a generally planar motion as expected
and observed visually. The results agreed fairly well with computer pre-
dictions both before and after the tests (see Figure 62).
The dotted nominal line on Figure 61 represents the corrected projection of the trajectory observed from the tracking site onto the nominal vertical
ballistic plane. Since there was little cross-range motion there is little
difference between it and the fitted actual computed with appropriate curve
fitting. For that matter, there is little difference from the uncorrected
raw data obtained from terrain matching in Figure 63. The primary
difference is the curve fit smoothing of the undulations in the raw data.
Since these undulations were observed in other cases, they may very likely
have been real rather than data errors. If real, they could be attributed either to an energy interchange oscillation similar to the "phugoid" mode
of aircraft or merely to the gustiness of the winds.
For Shot 36, good correlation was also obtained between terrain matching of Milliken and/or tracking camera observations from the tracking site and
positions in the nominal plane computed from the azimuth and elevation data recorded by the data camera from the tracking camera synchro pickoffs at the tracking site. These redundant data were not always available and still required cross-range matching and correction for non- planar trajectories. It did serve to help validate the method eventually adopted for all shots that were reduced,however.
d. Typical Hurricane Mesa Results for Special Inert Flares - A typical extremely nonplanar trajectory extracted (and partially extrapolated) from the flight test photographic data is plotted in Figure 64 for Shot 45, which was a special light weight (2 1/4 pounds), 8 inch diameter cylinder launched
16 degrees below the horizontal. The precessional motion demonstrated
■137-

RANGE (FEET)
-100 A
LÜ UJ
LÜ O
< OS
to CO o on o
if
FITTED ACTUAL
"NOMINAL" PLANE 200 ■{
300 H
CROSS RANGE
Figure 61. Typical Flight Test Trajectories for a Standard Inert Flare
•138-
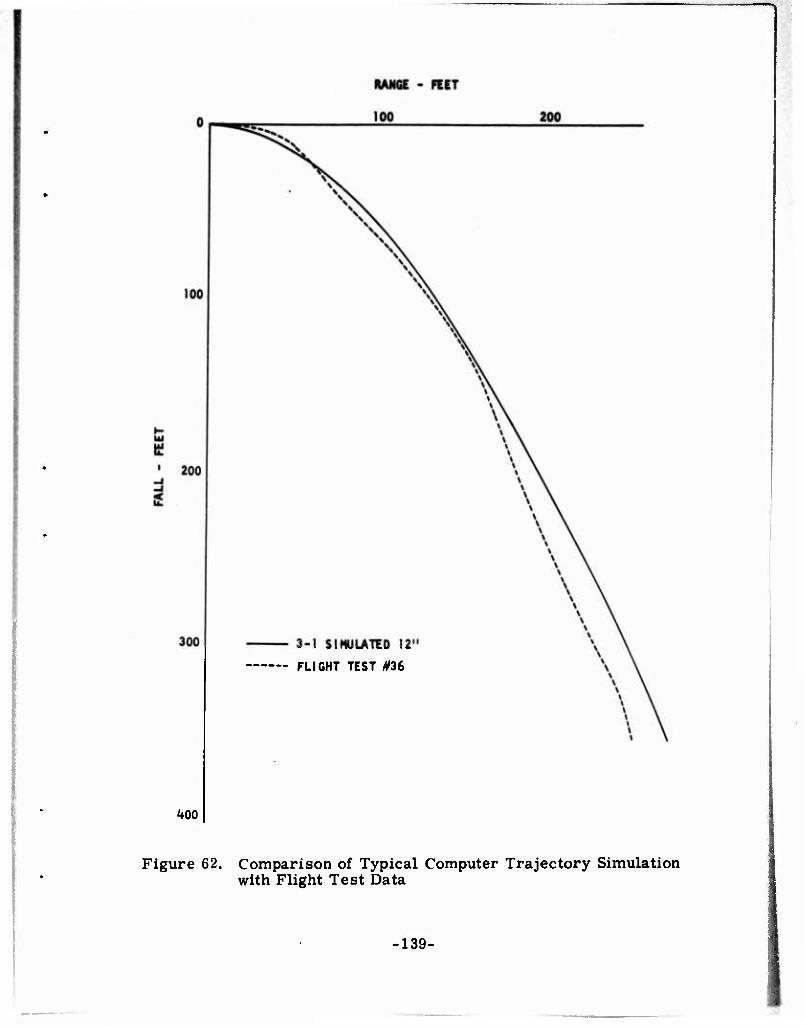
400
3-1 SIMULATED 12"
FLIGHT TEST #36
Figure 62. Comparison of Typical Computer Trajectory Simulation with Flight Test Data
-139-
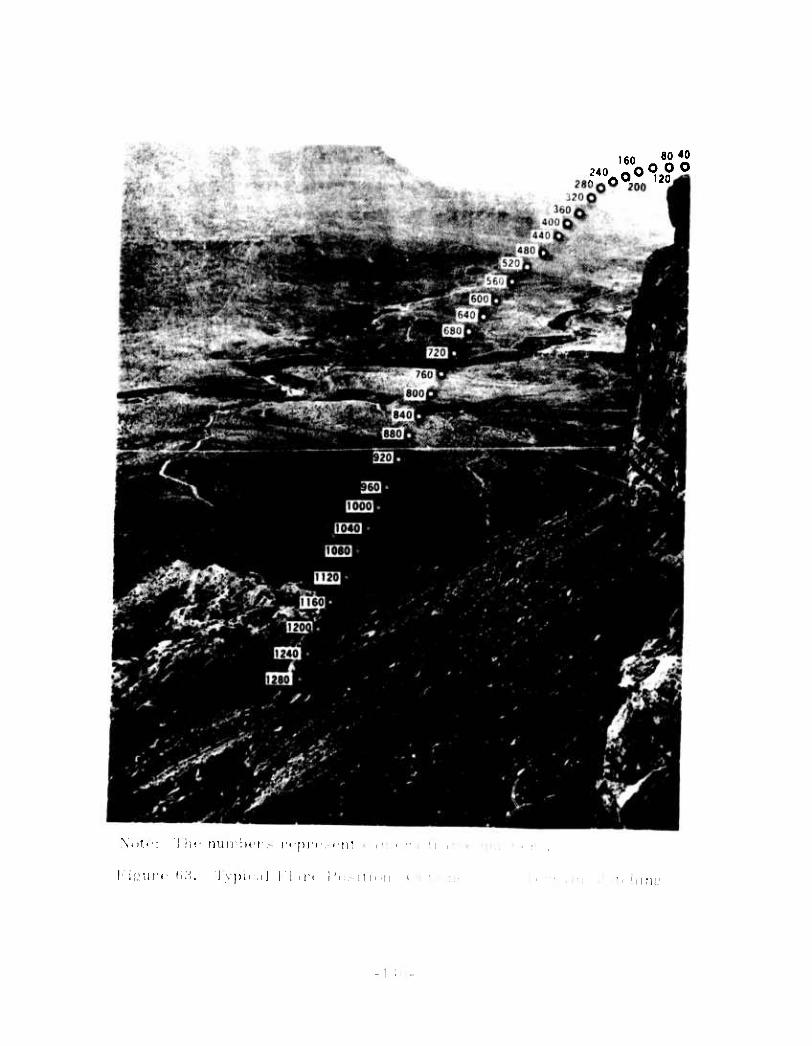
240 «00 0 0 nlOP." 120^1
NDtf: I hi' numbers rcprc.-cnl i itM !• . !r •
i iLMirc d.'-l. I \ |)1( I I I I , ft l'o.-ltidll l : hirijj
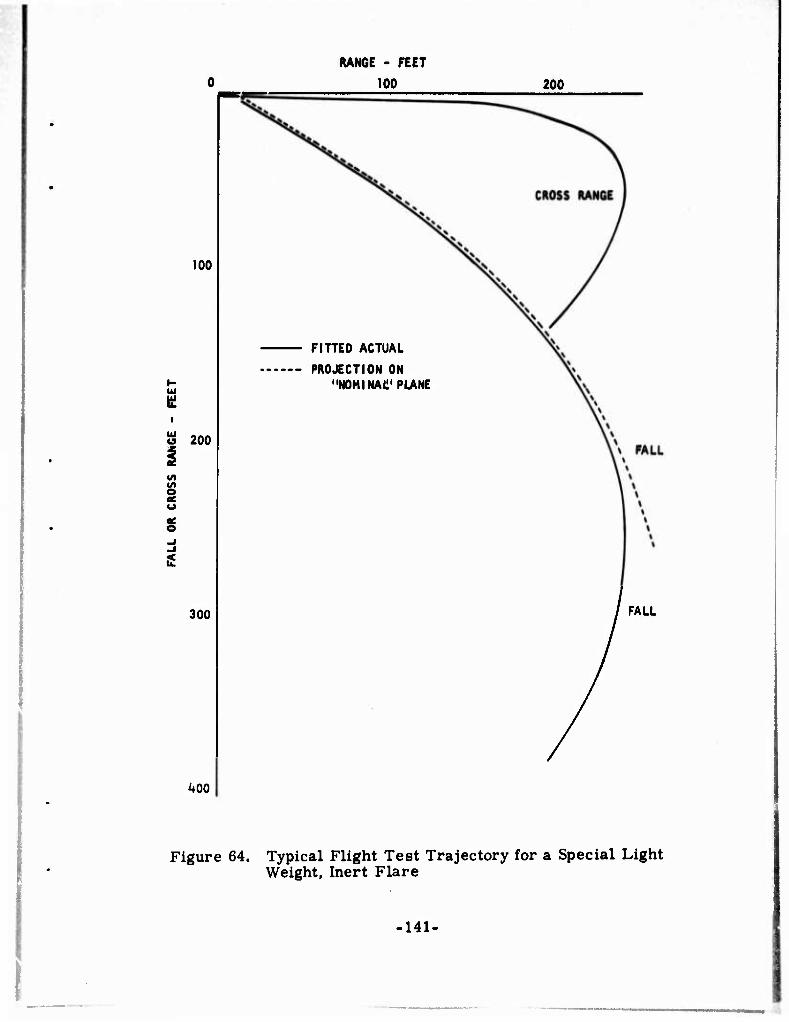
100
g
Sä 200
i
300
400
RANGE - FEET
100 200
FITTED ACTUAL
PROJECTION ON "NOMINAÜ'PLANE
FALL
Figure 64. Typical Flight Test Trajectory for a Special Light Weight, Inert Flare
141-

quickly took the boresight field of view out of view of the range grid, and actually took the flare out of view of the tracking camera before impact.
The terrain matching profile from the tracking site was similar to that for the standard flare. The fitted actual trajectories required some extrapolation of the nominal plane trajectory to match the time to impact of the cross
range trajectory. Thus, the solid line actual in the figure departs from the dotted line projection on the nominal plane. The plotted cross range trajectory corresponds roughly to the qualitative observation of Table 8 for Shot 45-that the flare first precessed considerably to the left then appeared to adopt a relatively steady glide in that new direction.
Attempts to extract meaningful values for the other trajectory parameters for this case or to find a corresponding computer simulation were fruitless within the time and data constraints.
e. Typical Flight Test Results for Live Flares - The trajectory of a typical thrusting live flare is shown in Figure 65. This corresponds to the still picture Figure 17. This trajectory was calculated from the data
camera readouts of the tracking camera line of sight from the tracking site,
assuming that the flare stayed in the nominal vertical plane, since obviously there were no boresight data available. The trajectory of Figure 65 shows a rise higher than the photo of Figure 17 because the still camera field of view cutoff at about 350 feet above the mesa, while the Milliken
motion pictures cutoff just slightly over 150 feet above the Mesa. The fields of view had been selected to cover the intended downward trajectories.
Unfortunately for some reason, no quantative data were retrievable on the tests of Figure 16, the only one for which the illumination data would have
been meaningful.
Figure 66 illustrates the available data on similar live shots (27 and 29)
obtained from the Milliken camera data, and compared to the corresponding portion of Shot 32.
-142-
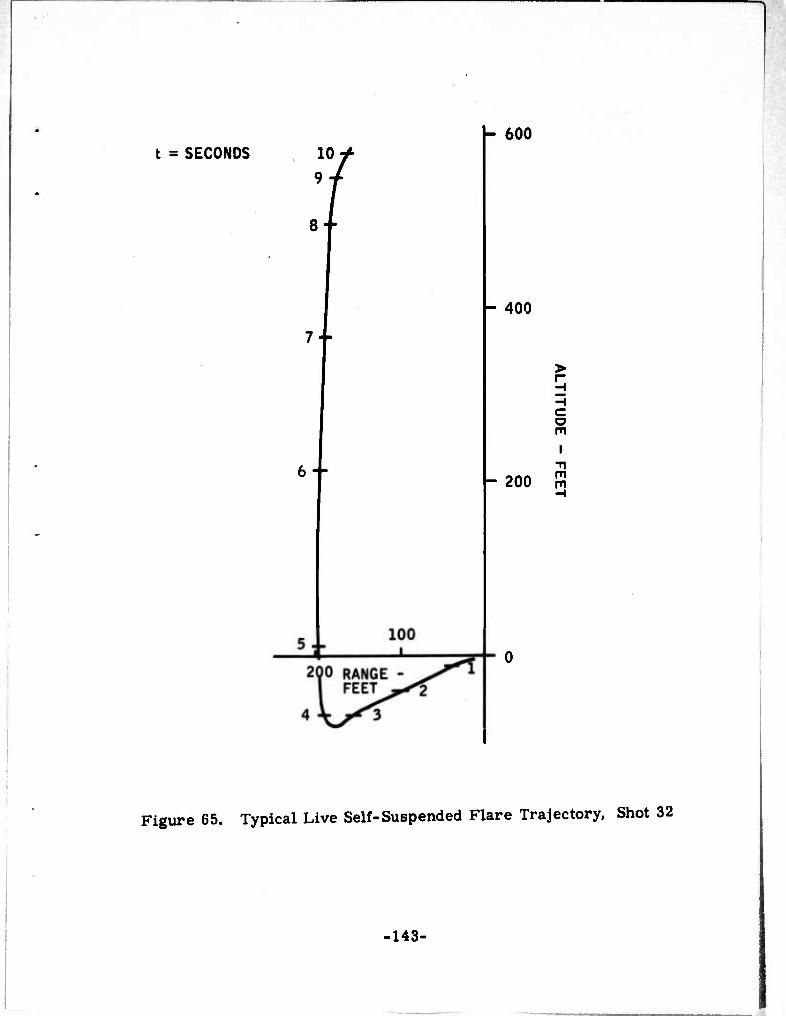
t = SECONDS
7 +
6 +
h 600
h 400
h 200
o m
m m
Figure 65. Typical Live Self-Suspended Flare Trajectory. Shot 32
-143-
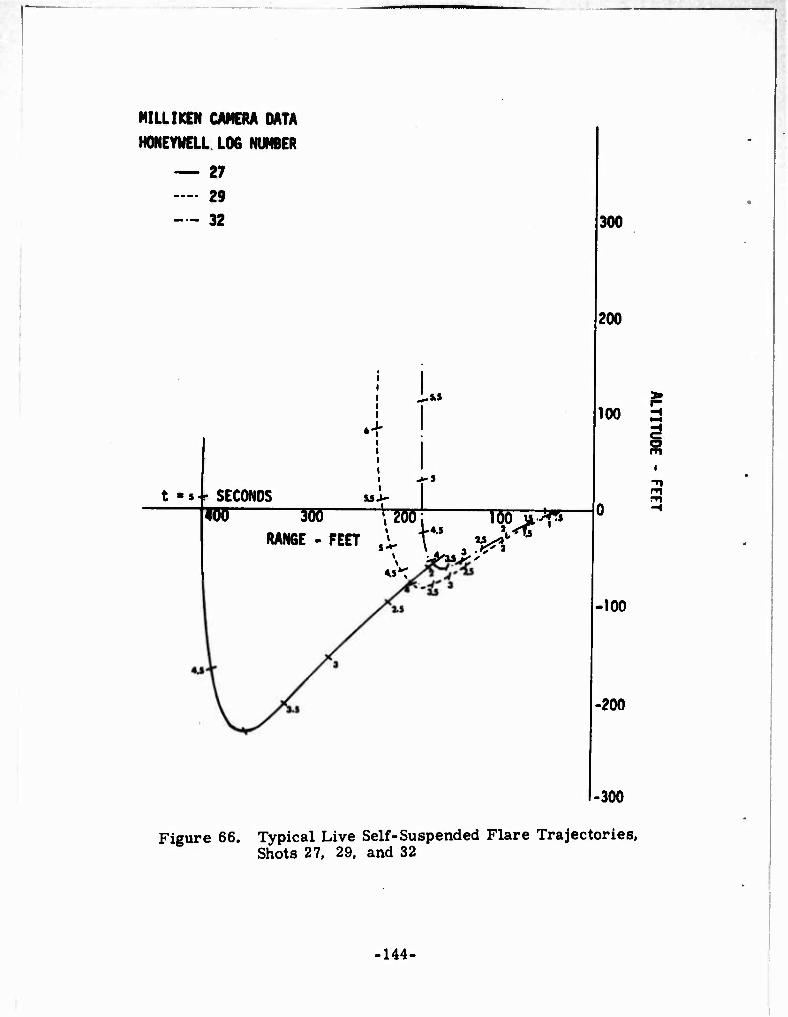
.
MILLIKEN CAMERA DATA
HONEYWELL LOG NUMBER
— 27 .... 29
— 32
t -sr SECONDS 1ÖÖ W
u>-
--"
>-s
RANGE-FEET t\, Y V^<s
300
200
100 ^
-too
•200
-300
Figure 66. Typical Live Self-Suspended Flare Trajectories, Shots 27, 29, and 32
-144-

The data extraction program being used was even less successful in extract- ing valid trajectory parameters from these data because of the sharp corner, the limited number of points, and the unknown weight and thrust. The shapes do qualitatively match the results of constant thrust simulations performed independently at the University of Denver and on the trajectory simulation described in this report in section IV. B. 1.
f. Flight Test Results on Spin Decay - The spin rate of the flare was monitored in the inert flare tests by the boresite camera, and extracted by counting revolutions. For the standard case (Shot 36), the spin rate was very close to the calibrated value of 1000 rpm with scatter between 923 and 1000 rpm. During the available flight time at low velocity and high angle of attack, there was no noticable decay upon which to base an estimate of spin damping coefficient to use in predicting decay at full-scale velocities. This lack of decay under these conditions does provide an indication that actual spin decay will probably not be sufficient for a reliable SAF signature.
While the swirling plumes could very likely have provided spin rate data on the live flares, which appeared to stay high, the generation of such high thrust and the observed burned through spots most likely also con- tribute spin torques which would have distorted the interpretation. Mass flow from an effective thrust nozzle would contribute to damping if dis- placed from the centerline.
g. Correlation of Flight Test and Predicted Results - Attempts to extract aerodynamic coefficients from the photographic data were singularly unsuccessful since it was difficult to obtain even position data for those flares which departed significantly from the nominal ballistic plane. For the planar case example (Shot 36) with a 12 pound, 12 inch dummy flare, some approximate extraction was performed and compared to the most representative computer simulation of the same flight condition.
-145-
In Figure 27 the position correlation appears to be quite good at the 6. 4
second impact point. It is somewhat disconcerting to note, however, that the computed trajectory departs considerably from the planar for flight
times much greater than that attainable at Hurricane Mesa.
As the number of numerical differentiations required to obtain the parameters increased, the errors increased. Position resolution errors against the sky background or launcher pressurization errors could have contributed to discrepancies in velocity near launch.
h. Auxiliary Observations from Other Flight Tests - Some preliminary indications of a possible approach solution to the flare configuration/delivery problem was revealed by other tests at Hurricane Mesa (horizontal barrel) and in Minnesota (elevated barrel) for an unrelated project. The tracking camera was beside the gun. Sabots, each consisting of two 6 inch diameter, 2 inch thick disks (3:1 cylinders) of lightweight foam, were used in rectan- gular barreled gas guns to impart a controlled forward velocity and angular rate to a munition held between them. The axis of the angular rate was horizontal and perpendicular to the disks.
In some tracking photos from the Hurricane Mesa, where maximum velocities were 600-800 feet per second with level barrels, there were some observa-
tions that the sabots appeared to roll out and glide with the forward edge
downhill in a relatively stable orientation. For the Minnesota tests at
velocities up to 1300 feet per second with elevated barrels, there were visual impressions that the sabots rolled out into a stable orientation, stopped, and then glided back toward the gun. The tracking cameraman
was the same individual who operated the tracking camera for the November 1969 Self-Suspended Flare tests at Hurricane Mesa.
It has also been noted that toy frisbees tossed on edge will, in some cases, roll out to the desired glide orientation. It is speculated that this
phenomenon could be exploited to eliminate the necessity for complex
146-

tilting of the launcher and or brute-force neutralization of the aerodynamic
moments, by letting the flare seek its own preferred glide orientation.
5. Math Model/Computer Program
a. Basic - The equations used to develop the trajectory computer pro-
gram are presented in Appendix B. These equations are based on the aerodynamic force and moment model of Figure 5. They used an inter-
mediate set of nonspinning aeroballistic axes for the flare to perform the
basic calculations with appropriate transformations between these flare
axes and the aerodynamic axes. The flare axes were arbitrarily chosen
to simplify the inertial/gyroscopic and kinematic calculations and to minimize the possiblity of singularities in the differential equations.
While a standard conventional sequence of Euler angles in the yaw, pitch, and roll sequence was used to describe the instantaneous orientation of any arbitrary set of axes in the flare, the axis transformation matrices were
computed using the Euler symmetrical parameter (sometimes called quaternion) approach which uses four parameters instead of three, but
avoids the singularities and is actually simpler to program than other
methods.
The fundamental assumption made in these equations, in order to suppress
the high frequency nutational oscillations but allow quasisteady rotational precession and full translational freedom, was that the derivatives of the
pitch and roll angular rates were negligible. Inverting the resulting
equations yielded the equations for gyroscopic precession under the applied aerodynamic moments resulting from angle of attack, spin, configuration shape, and angular rates.
Once the orientation of the arbitrary flare axes were all obtained in terms of its transformation matrix, the orientations of several other arbitrary axes were readily obtainable and were output by the program by making the
appropriate auxiliary axis transformation required and extracting the
•147-

orientation Euler angles by manipulation of the matrix elements. No one set of axes or angles seerns to best describe the orientat£bn of such a disk type body, which, if and '"hen gliding could be described by either aero- dynamic or velocity axes but unlike an airplane the wing tips are not visible. Consequently, several choices of output axes are availaMe.
b. Linearized Analysis - The equations used for the stability/precession criteria analytical solutions were essentially those of the computer program but linearized with respect to the velocity axis description of the flare orientation and forces (see the equations of Appendix C). In this axis system, the roll orientation of the lift vector determines the rate of turn of the trajectory in gliding flight. This system eliminated the effect of linear acceleration and lent itself to varying levels of degrees of freedom for study of the precession, with and without translation and with and without wobble.
The linearization was performed with respect to an ideal planar trajectory, which would assume no precession, and the equations presented were solved for the simplest case of level launch, as presented in section IV. B. 2. The solution should be extended for the more general and more proper steady- state glide angle condition, if identifiable, for arbitrary launch conditions.
c. Typical Aerodynamic Coefficieats and Inertial Data for the Computer Simulation - Typical values of the geometric parameters used to define the flares in the computer runs are tabulated in Appendix D.
Static aerodynamic coefficients CN, CA, and CM used for computation with the trajectory program, are tabulated in Appendix D as functions of the angle of attack for several typical configurations. All runs used the same set of damping coefficients and also assumed that the Magnus moment was negligible (K., ■ 0) since the results were insensitive to these parameters at the anticipated levels. The configuration numbers as tabulated in Appendix D were arbitrarily assigned. For the 8:1 cylinder with variable cavity the
•148-
static coefficients are tabulated as functions of angle of attack for four values
of the cavity radius ratio to outside radius (identified as Configuration 8C).
d. Sample Simulation Results - Samples of computer inputs and outputs
are shown in Tables 9 and 10 for a case with cavity dependent aerodynamics
input as four sets of curves and with constant thrust, and in Tables 11 and
12 for an inert case with only one set of aerodynamic curves.
e. Possible Math Model/Computer Program Modifications - The math
model presently assumes that the side force due to spin (Magnus force)
is negligible and that the pyrotechnic burning rate and thrust are constant.
As the disk thickness increases, this Magnus force could become significant
and actually provide a lifting force for units whose spin axis is nearer
horizontal than vertical. This term could easily be added in the same
form as the Magnus moment in the math model.
The equations for mass loss and thrust would merely have to be changed to
integrals of the desired arbitrary burning rate and the equation relating
thrust to this burning rate supplied.
Associated computer program modifications would be to introduce the
Magnus moment, the Magnus force coefficients (if added), and the spin
damping (when available) as functions of angle of attack and, if possible,
cavity radius, and to introduce the burning rate functional inputs and
add them to the differential equation solution.
To provide finer resolution of some of the more nonlinear curves, primarily
for cases where large thrust values may drive the angle of attack to -90
degrees in vertical flight, the data input should be modified to provide
either a larger number of data points per variable than the present 10 or,
preferably, a selectable number for each coefficient which can be tailored
to the available data.
149-
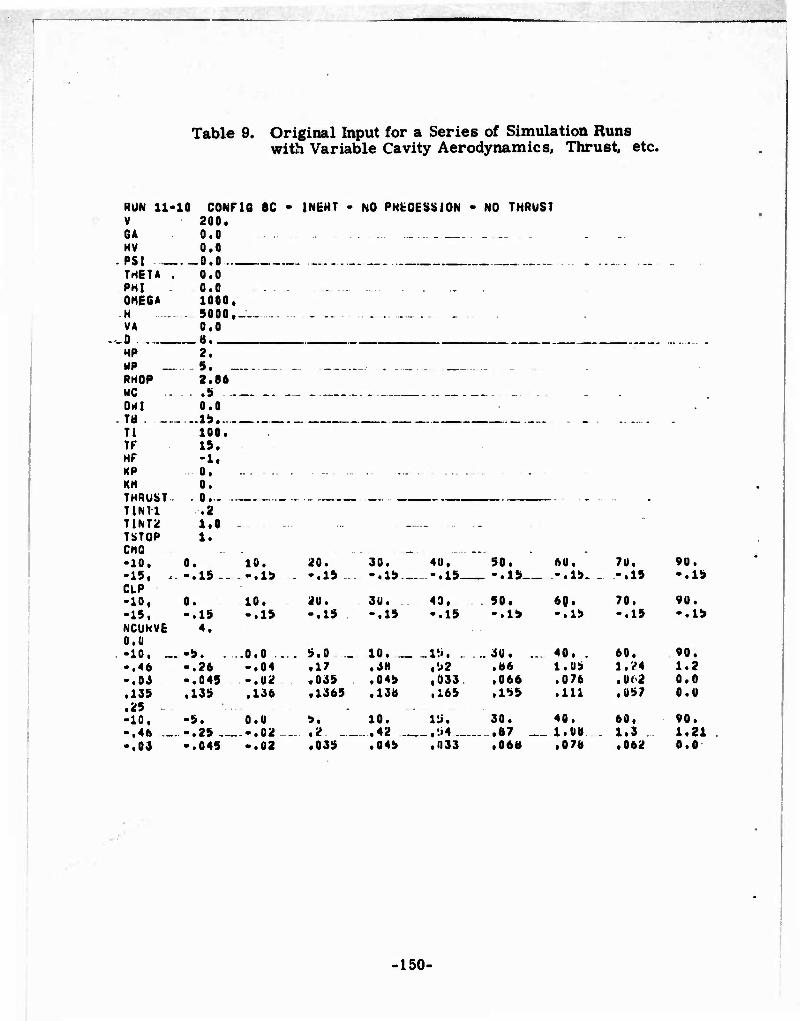
Table 9. Original Input for a Series of Simulation Runs with Variable Cavity Aerodynamics, Thrust, etc.
HUN 11-10 CONFIG 8C • INKHT • NO PKtCESSION • NO THRUST V 200. GA 0.0 - - - HV 0.0
THETA . 0.0 PHI 0.0 . .... OMEGA 1000. H 5000. _._ _ . _ , ..... ... ... ... . VA o
0.0 - 6.
HP MP RHOP UC Oril TB
2. 5. - 2.86
- .5 - 0.0
.—1*.-.- 100.
■ - ■
TI TF 15. HF -1. KP 0. ... .. . . _ .._ - . . KM 0. THRUST - 0.- - TINU .2 TIMT2 1.0 _ .. m
TSTOP 1. CMC . _ . . „_ , •10, 0. 10. 20. 30. 40. 50. 6Ü. 7U. 90. -15, . -.15-- -.IS . -.15 .. -.15 -.IS. . -.15 -.15. . -.15 -.15 CLP •10, 0. 10. 2U. 3U. 49. . . 50. 60. 70. 90. -15, -.15 -.15 -.15 -.15 -.15 -.15 -.15 -.15 -.15 NCUKVE 4. 0.Ü •10. ... -S. . .0.0 ... 5.0 _ 10. ._ .1!.. . . 30. ... 40. . 60, 90. -.46 -.26 -.04 .17 .3H ,t>2 .06 1.U5 l.i'4 1.2 -.Hi -.045 -.02 «035 .045 ,033 .066 .0 76 .062 0.0 .135 .135 .136 ,1365 .130 .165 .1^5 .111 .057 O.U .25 . -10. -5. O.U %* 10. VJ, 30. 40. 60, 90. ',4b -.. -.25 .-.02 • 2 ._ ..42 ,'..4...... .,87 „ 1.08 . 1,3 1.21 -.03 -.045 -.02 • 035 .045 ,033 .06(1 .07« ,062 0.0
•150-
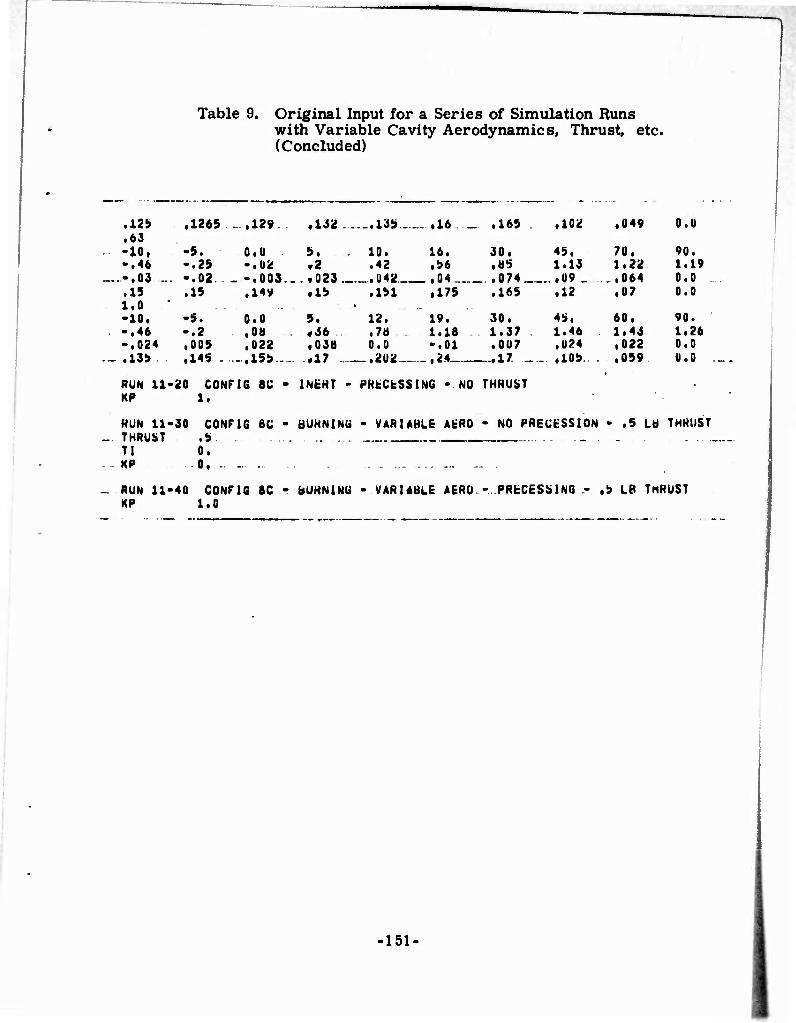
Table 9. Original Input for a Series of Simulation Runs with Variable Cavity Aerodynamics, Thrust, etc. (Concluded)
0.0 .125 ,1265 .. .129 ,132 ,13b ,16 _ .165 .102 .049 .63 •10, -5. 0.0 5, - 10. 16. 30. 45. 70. 90. •.46 -.25 -.02 ,2 .42 ,56 .85 1.13 1.22 1.19 •,03 ..- -.02. _ -.003.. ..»023. -.042. ,04 . .074 .09 _ ...064 0.0 ... .15 .15 ,149 i.o • •10. •S. 0.0
«15 .151 ,175 .165 .12 .07 0.0
9. 12. 19. 30. 45. 60. 90. •,46 -.2 ,oa «36 .7a 1.18 1.37 1.46 1.43 1.26 •,024 .005 ,022 .038 0.0 -.01 .007 .0?4 ,022 0.0 .135 ,145 - .,155-- ,17 .202 ,24 _..17. ... ,105. . .059 0.0 ._.
RUN 11-20 CONFIG 8C - INtHT - PHbCbSSING • NO THRUST , KP 1,
HUN 11-30 CONFIG t»C • BUHNlNli - VARIABLE AtRO - NO PRECESSION - .5 Lb THRUST THRUST .5 Tl 0, KP 0, - ........ ... - •
RUN 11-40 CONFIG BC • bUKNlNU - VARIABLE AERO - PRECESSING - .5 LB THRUST KP 1.0
•151.
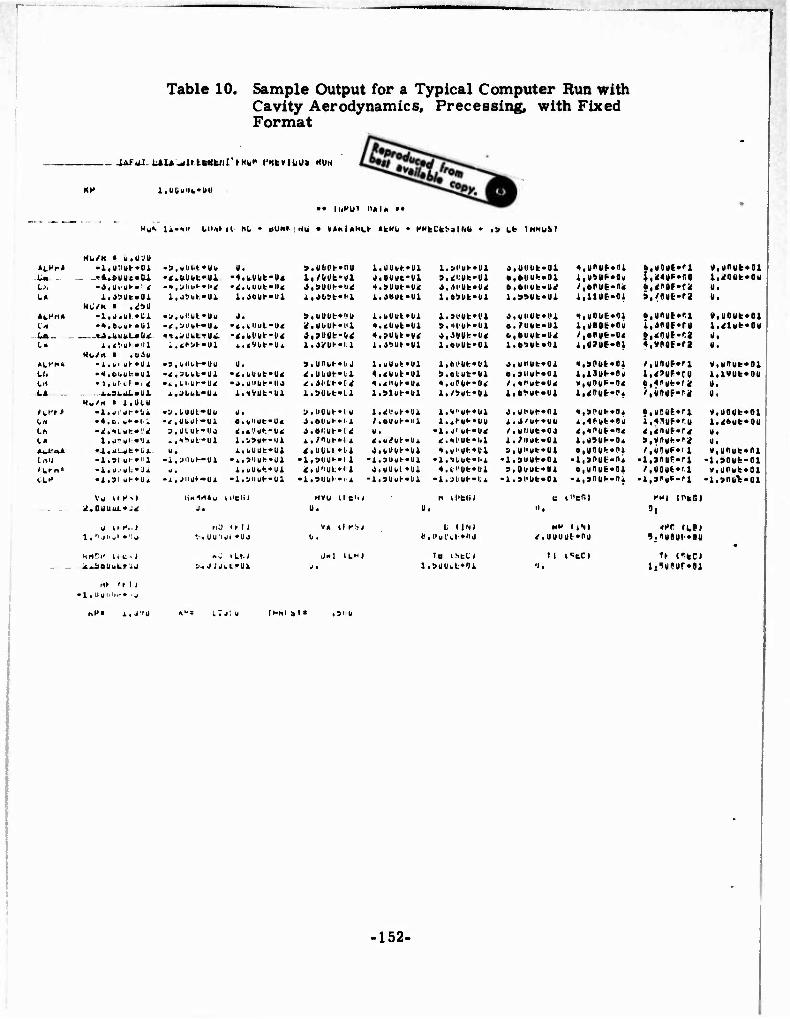
—
Table 10. Sample Output for a Typical Computer Run with Cavity Aerodynamics, Precessing, with Fixed Format
"u" li-t" Ul*> it ML
•• luHUI 11*1* ••
■U Lt IMHUSI
AtHr* Li» . t,'. t»
I'M
L«
Lr, L« AU'tli»
Nk,/N • u.U'JU
«t/N • ,J!>U •l.d jul *IIX
-J.ULllL»U^ i><t<ut »Ml
Kb/n • .oJu .4,l,i,gh»Ui • •t.buukvul •>n,( il •. t
- J..3x.üLmljl. Hw/n « i.ülU
•l.>IL'tlt-*Li -4.C. y>->l'i
«A«illiit>«lt* -1.91 »»■♦HI •1« u. uL*ü.i -1,91 ut-»Üi
vo lie-.) ^.OUUui.» J^
u iir1,.! I , " Jl'u' ♦'ij
it..>tUll>i»aj
1» 'Mi
r\P« l.JlJ
• 9,wUl.t*Uti U. -«.ilUüt-Ui -4.ulllit-Üt
l,J^liK«Ui l.JClit--l/l
■«.»VIIMIIA -t.vliut-IK ■ i.wiii>t-u<L •<lül>bk'-l>< i.tMie-ui ^.c^iie-Ui.
• S.ullbl—UU 0.
i,JLuL-Ui l.lVut-Üi
•r.UOUl-Ul 9,ÜLUh-llJ ..s'tut-Ul u.
• i, jnjf-ui
l.bUUfc-Ul •»,9iluh-Ul l.l<Ubh*Ul
•l,ailuh-Ul
HU I'll .'. UU'lill »UJ
-^ J JJt.t*Ul
9.UllCt-*IIU i.UUth.Ul l,9l'Uh*Ul l./uot-oi *.ebut-H a.^Mik-ui J.SUlih-Hi •l.9UUt-«U< J,.li'llfU< l.dd^e^l'l l.^Bllk-Ul l.O'JUt-Ui
9,UUllt*l>U l.bUl/t»01 1.90llt*lll ^,uuiJ»--ca «.«bub^Ul 9.ii'ul-»bl i,9Uttt-lii 4,;U|(t«V< 4,JVUh-U< liMlll!*«! l..>*Ut-Ul l.OfUt-Ul
9,Unut-*l>J l.bUufe'Ul i,M'Uh-0i <:.üüüt--ii 4.iUbt-ui s.otut-ui *,i¥l)*»t4 ••«•»*•»• «.uPUh-Oi i.subt-Li i,9iiie-ui i./tiuh-Ui
a.llOl/h«! U J.ftl'ut-I 1 J.OI:D»-I <:
i.UULI*ll ■ i,»nut--i 1 i.lt'HIL»! 1
■1.9IJl)t «i 1
Mvu He1'!
l.^Uyt«Ul l,VI'Ul-»lll /■BUUK-HI
Ui
■».bl'l/h-bi -1.9Uutr*Ul
J.UUbt»Ui
l.ihU)-*Uu
<.<ll'Ut-lil
'l.tiilk'l'i <t.lMUt»01
•l.adUI-'lli
n tllkUJ
.l») ILHi
I (IN) ».UutCl »'M
To iScCi
l.SüU.L^'U
(Hni sli
6(lUtr.Ul l,U^Ur-*Dy 6i>ub>u4 /,oruE*n< 9SUt-Ul l.HUE-Oi
uUUt:*IU ■..ulUE-m /uut-Ul l,UII0e*Du
o-'ut-'ii i,üüU§-(il
unut-Ul i^OUt'Ol 9liUt-«Ul l,13U)-*(lü <><ut-«(l< y^QU^-O«
ui'ue*oi
Ul'Ut-OJ 7IJüI-»ü1
gilue*Ul 9UUt»01 U0Ut»Ul 9l'Ub>01
"t,9l,Ut-«l)4
i,u*üi--u* •■unu^*ni
o.uiut-ni -i,9nut--ni
c i«cR>
«MJUUUi*«!!
Tl i^eC) Mi
fi.UOue-ri
/,un«f:»( 1 -l,»nuR-rl 'tUOUt*'!
-l.jfuf-'-l
i,jnoE*rv 1
4,vnoE-r2 y
/,üfluF*ri v. l,^'üF*rü 1. 6,«ngt-(it 11. '.ünoF't* ü.
6lu(<üE*rl
iinuk*01 ^0Ufc*0U
uout»oi
UftUfc*01 lVUfe*0U
Ü0Ub»0l
unut»ni »oufc-m U0ut*0l
ffi (neO»
'1
■S.1U9UI-BU
n («fco
-152-
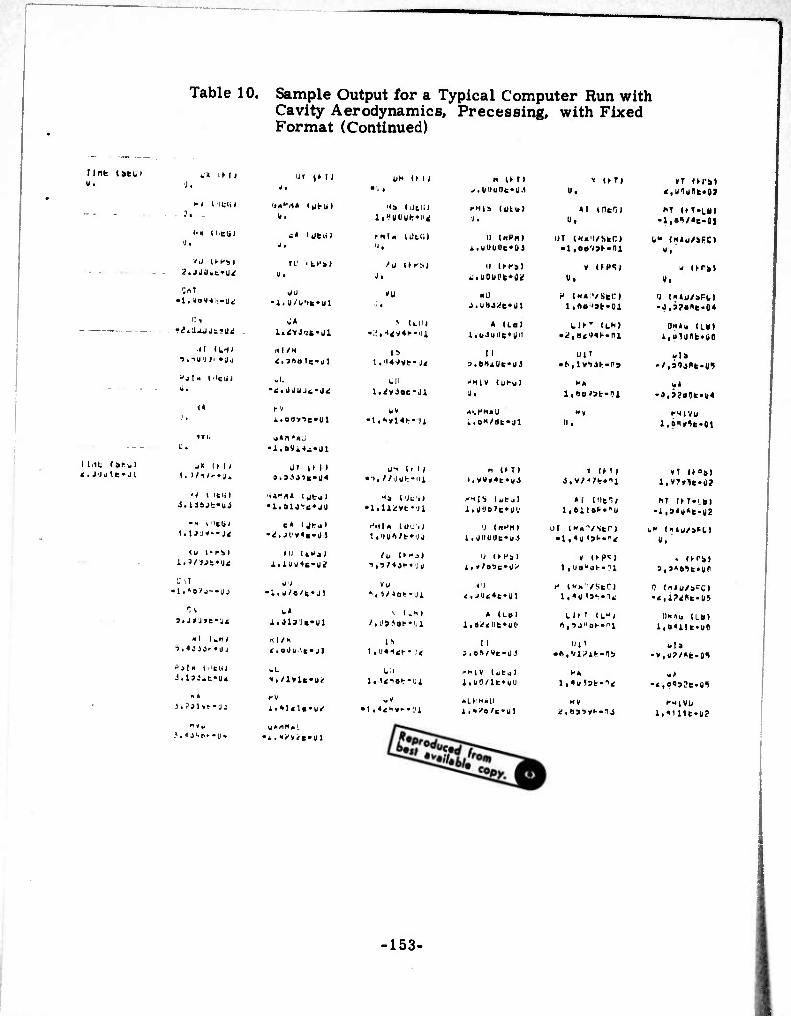
Table 10. Sample Output for a Typical Computer Run with Cavity Aerodynamics, Precessing, with Fixed Format (Continued)
rmt (abb) u.
ll.it (an.) < . J j j 11 • j l
>•» II.BU)
i. '<>J 1
.JJU.
':■■
• i,
iT i:"lU
•^. üU^
I. 41
•ig'jj,
1* (l Iciil
J« If IJ 1. )/1/l-»J.
<< > It'll
•1 .»3/J--Uj
3t jyj»fJt
<rl (»Ml
iJl« |l>(Ui i.lJ.'-t-U*
i. '51 yfa j
- (
It»»*» cyH,) U.
<< lijtul
ri' itf»)
JÜ •i. ll/u'>t»ul
nl/n <, 3«oie"Jl
-i. JUUJi.-J^
•Ul
-Ul
ur iM i
•.AX.1» (Jtal •l.sij're'JJ
-«1 •ul
»U Ufa)
•I.J^O/S«JI
•ul
^ • 0 ü Ü ' fe • •Ul
UC
i.*)<lc 0^
'i. •"•itt' ul
UK CM I
na died I lt(!|IO«k*li4
rhl« tüfclii "•
•' J Iff:.) Ji
• ;f
v Ulli .••<v4l--ili
I ■Ji
1 Jl
•1 , i«»t4fe> U
JH 1 1 U • ■i , / / J U h ■ ■HI
«3 (Ucil •1 .luvt- •n
•JMl« (Ut : .) 1 ,ilU'i/fc»'Jj
/« (►' ^1 9 ;u
^ i W40lr- li
i i . i)
/, '-i
1. U41ih- 14
(,11 1. 1<10I-- Ul
>UU**—<U
n (Ml ^<Vlttl0t*(4
« (► T) 1. '■UlnDfetO?
cHia (ULu) ■;.
*I iHell u.
>i IxPn) i.u'Juilt'Ui
UT (K«ii/strj • i.»o'<9i--ni
ii (►»-ai ^.uoui'fiii;
V IfHSI (1.
u (fra)
i,l)ll4»t*»t r1 |N«ll/8kCI
1 ,00 'St-Ul 'J ("»j/aFU -J,J?d"t-04
« (LOl lib^uiiE'gn
tUT (Lh) i.,«'jnt.uO
I 1 ».«NlUt-Oi
-•MIV (Ut-Ul *-« »1 u. l.fto'st-ni •A.9?0Ct.U4
«i.ftmU i.OH/BfJl II • l.C^t-Ul
M (Ml 4,yV«4e*u4
< (Ml vT lfak)
t^yrntk*«}
1. JUO^t'UU •1 IDkQj
Jl6it0t-.''U HT (M.I.B»
■1,340*6.^2
rJ Infn)
1 . JllUllfU» ol (fn^/strj L" (ii»u/at(,)
u u H a I 1,»/05E»Ü/' 1,uo"ae-1l
< (fPa> 3,3*öSt»i)n
.< 1 «. J|lt4e»ül
H (««i/StO l,4u »a^-it
0 (««u/a-CI •<,l?4St-ü5
« (Lei i,0^<llt*U(i
tlr' (Lu( DHAII (Lb) i,o<ilt.u»
11 ll« 1 • ft,,>l»'il--'lt)
»la •V,u7/»k-0^
■«"IV (utul f » • « l,UI)/lt*l,U l^uSat-l* •«.OlSjfÜ^
»LfM.IJ
i,4111t-U?
-153-
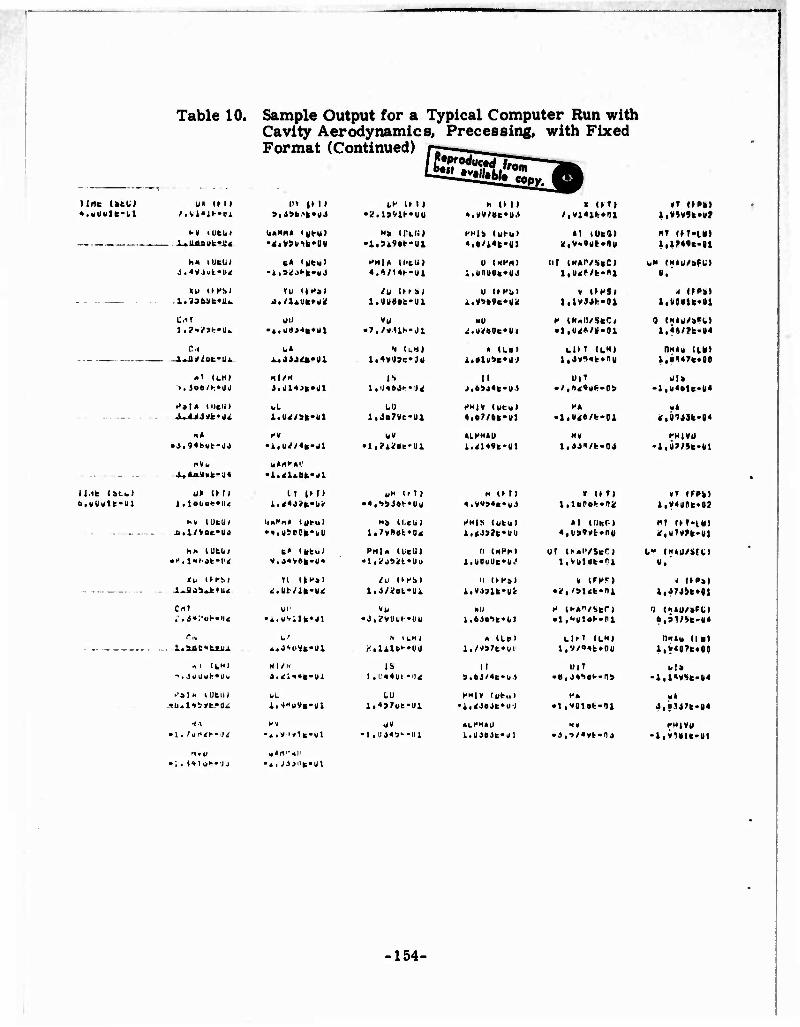
Table 10. Sample Output for a Typical Computer Run with Cavity Aerodynamics, Precessing, with Fixed Format (Continued) rr ___
llrtc (ftfeU «.uuule-ul
I Lit iati,i
u* im in p i)
U*Mn« lutul
■A 'utul
«U OK!)! 1. Jaii/t'iik
ÜII
•1 ILH) nl/i«
bL l.U^/Sk'Ul
-i,U^/4k-l*l
ü)> IM) IT |M) It«««!»««»
hv (UBUJ
• •iiii»elIk*iiU
he IUtb< k« iMkUl v,o*v»k>ii«
a-sij'3*t»ut Tl IkHkl
^.u»/lk*u^
cm Ul •iiWiik*!»
i.UAe-'tsjji,
rt 1 / N <itfl«4||*lll
bL i.l"U«k-Ul
•4tUi*ilB*VI
w III» •S;.I»VII-»Uü
"S ll'Lli) •l^SiVkt-Ul
►■Ml* ll'tli) 4.*/1«l--Ul
• 7,/vU^-Jl
li4yu>E*jii
is
to l.Jo7yc-Ul
uH Ir T ) • 4,l>4j6t«Ul)
HJ (LkU) l,7yNot*U<
PHI« lUBli) »tii(«kjik*ttu
til HI'S»
IS
CD l,4»7gC-Ul
JV ■1 .UJ4»,--IJ1
k (III «.yy/kt'u^
» UT) /,Vi41fc»01
»t HPkl i,»»y»k»u?
»"'IS lutui 4,«/i4k.gj
«1 lUkOI «T (M-tkl i.l»4»t.Ul
U iHHrt! ;.u'iugt»u.t
uT »»Ar/SkCJ WM (NtU/kftt II.
U UHiil i.VS»9k*üV
V 1»HSJ l,lyJ4fe>01
4 unit i.i<om*i)i
■U f iHMii/Ski:»
• (Lkl UM (LM)
ir J,6»44k-U«
tfti •1,U4»1C>I|4
HHIV lutu) 4.07/tk-U] .l.U<»/t:-01
■i
•LHHtU ►•HIVÜ -i,Ü»«k-H
n OT) «••«»«■•kj
» t»T) LlBOftHVlif
»T (FPi)
(•MIX lubul «I (l)lsP) 4,u39yfc*nu
"T {fT»lkl
') iHPri l.tdJuUCu."
ur «►«I'/seo i,vui»t-ri
t- (H«I)/«I;>
II l»fkl l«»01t*ilt
< up»)
all f «K«"/Str) • Lbuid^-nx
'J (HIU/kFCI »,91/St.g4
» ami i.^S't'UI
Uft (LH) i,v/o«t.nu
BNtk 11») l,V4||7t«00
il ».eJ/4t-u,»
UlT •B, j«sdi--n>
bl» -l,l^V,>ft4
HMIV tukul ftf.149t«»4
«tPN«U .J,-)/4yfc.Di
fMJVU -i.VliU-Ul
-154-
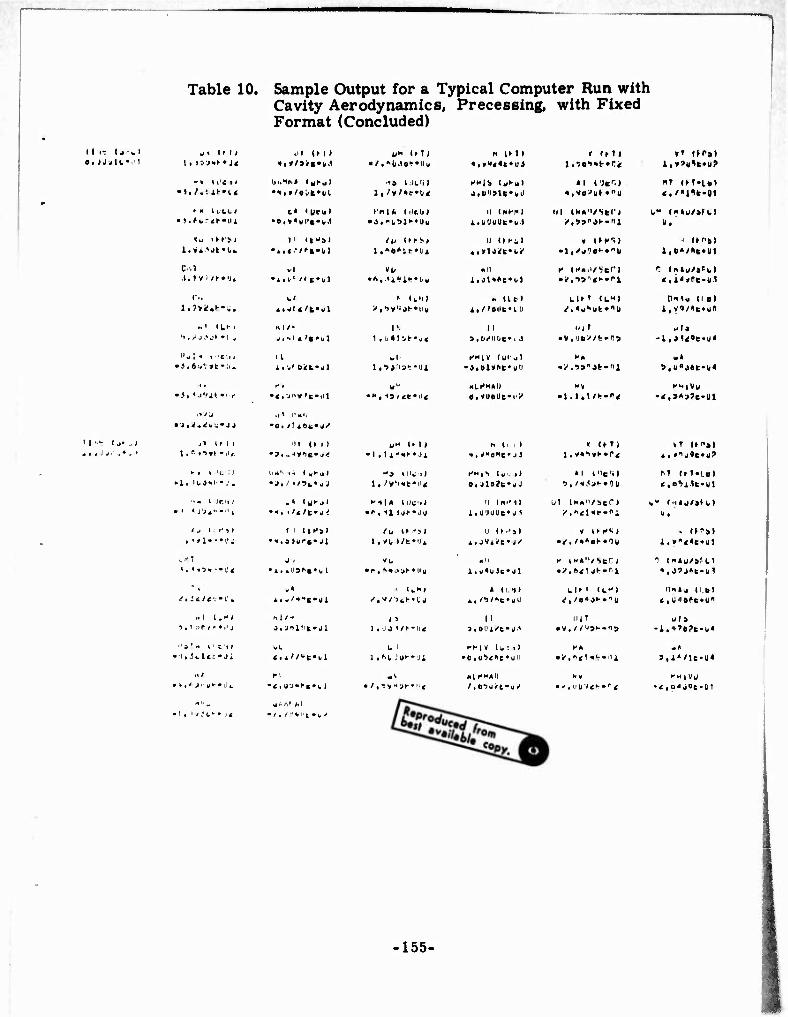
Table 10. Sample Output for a Typical Computer Run with Cavity Aerodynamics, Precessing, with Fixed Format (Concluded)
« . J J J 1 L • .■ 1 1 . IJ'.»»> * It
-• it'ttl
► - i in I • i.fbrtt'i'i
«.> >» r» < 1 ,<n. Jt»l,k
c .1
.1 IV / »• • u «
1 fll
*!!•«. .. 1 IL» '
•> /•" J4" jt •! .
Mj| 4 i CM < i »ut »flu,
•.'.*•>" i * • I
*ei»*ui|k*i"1
11 Ik»»! •4.« '/f i«(,i
■i.i.L/' »♦ul
n I/»
l^^l üit" jl
•«•i"* 't"lll
It I.JC'l)
Hn|A I'lebi
•A, «it-it-^Lu
1,u41Vt-j<
vl 1 .•»iis':-')!
•>•, -iiitftU
«tu««««*«!
< (Mi 1 ,-yo'><>h»r<
»T rn"»»
j.uii>le»u0
• 1 t')Cr') MT OT-l«)
II INHKI
ittiSgllk'vJ
III (Hoi'/StCJ
II (H-i) < IMi»)
Kll H (««.I/Vt'") Q (fi»u/»«i,)
« Uc)
l,/7oiH«Hi
H»T CL") Hi«« 1 0)
i,y«/iit«un
11
»«»yiibk*! i
11,1
• v,ijov/t-n» wit
HHIV ( ul d )
j.olyne'uu • ^.■»»"Jt-i'l 5,uoJ6t-0<
•LCHAU
o.yucuc-^ •t.l*t/fe*ft4
»« >'M1.
- 1 j> U 1 1 ■II (> 1 )
•3t --»y^E« j^
UH (Ml
•1,1 l-<l>-»Jl
hi.,)
1,yxoHe»ji
«IM»
► » 1 '1. : J
-1. I^JM—.•. bill» Ijt-al
1 , /»'l<lt«.l* 0.JloZt^xU
«1 I'lcM
», /t^^t-»iHi ht frT«I.B)
■•« 1 Ir.'i.' • • («t-ol »-ll* IDuil 11 (n.'D
i.ljijüllc» J *
ul (Kn'i/beO w" <.Hj/»ft)
< j 1 . •'If
. 1 » 1 ' • » ■.■ i
(1 1 tf»)
• ■• . » 1U l"» • J 1
/ U I ► ■' > 1
I , ^tJ l/t»ll4
U (».'al
• «i. '«'■Ot-*1U
. If»t)
i.*"<<B*ll1
<. < t» • r • U < J 1 K ixn'i/Serj B ("»ll/»'rtl
/<i(/(%«l'4
-• • UKI « (Li)
A , /i>/*iC»glJ Ll" IL-I n»«* do)
..1 l.-l nl/- 1 ■>
1 ■ J J 1 /1- -1/ < M nit wr»
• 1,Jtltc'Ji
UL
«.l//«t»»,l t 1
1 .»■(, ,'oi--Ji • e.uiJt'ie^u"
Kll
• «••►«liS-iU
• t , ' J<- y u • (; fc
1". .1
•/,"'»-3fll<
«Lr'Hiii
•<,0<jOt-llt
• / , *' N *' ■ c • ^ *
-155-
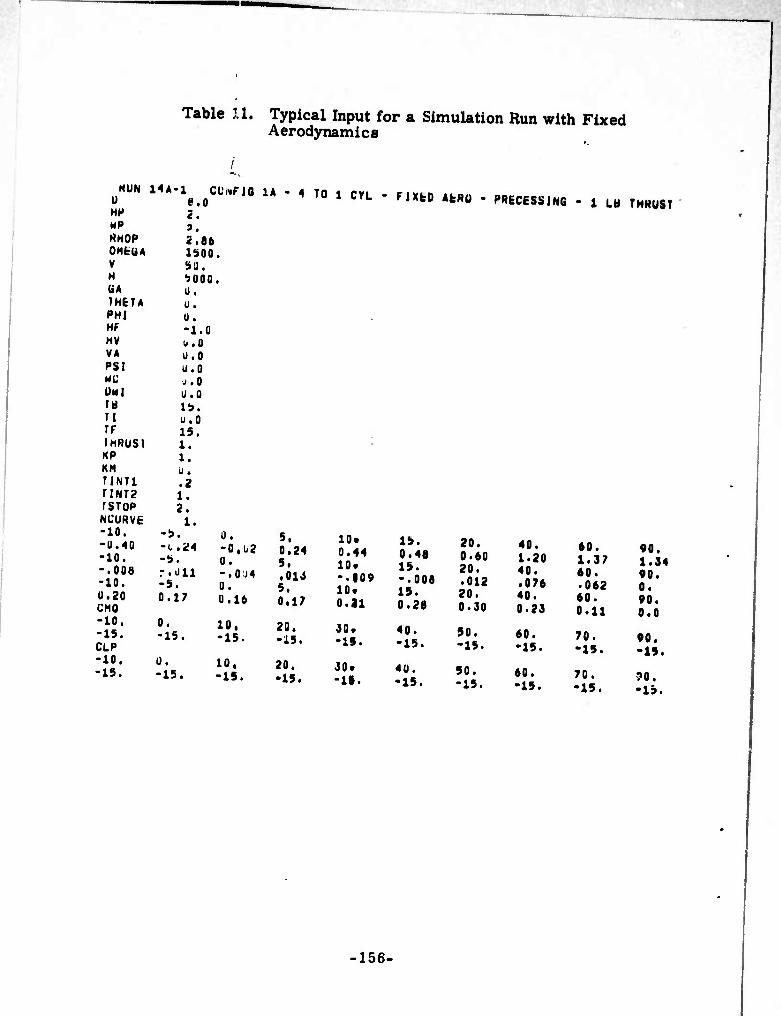
Table 11. Typical Input for a Simulation Run with Fixed Aerodynamics
HUN 1)
/
14A-X CCrtFIO 1A - 4 TO i crt • FIXbD AbRü • PRECESSINQ - 1 LB THHUS: HH 2. MP 3. «HOP 2.06 OMfcUA 1500. V 51). H •»ooo. UA U. 1HETA u. PHI u. HF -1.0 HV U.I VA U.O PSI u.O NC J.O ÜMI u.o TM 15. Tl u.O If 15. IMRUSI 1. KP 1. KM u. riNTi .2 riNT2 1. rsrop 2. NCURVE 1. -10. -Ü.40 -10. -.OOS -10. U.20 CHO
-5. 0. -t.ü4 -0,ü2 -5. o. r.oil .,OJ4 -5. o. 0.17 Ü.16
5, 0.24 5. .014 5. 0.17
10* 0.44 10« -.109 10« o.ai
15. 0.40 15. -.008 15. 0.2«
20. 0.60 20. .012 20. 0.30
40. 1.20 40. .076 40. 0.23
60. 1.37 60. .062 60. 0.11
90. 1.34 90. 0. 90. 0.0
-10. -15. CLP
"• 10. -IS. -15.
20. -15.
30. -15.
40. -15.
50. -15.
60. •15.
70. -15.
90. -15.
-10. -15.
0. 10, -15. -15.
20. •15.
30« -IS.
40. -15.
50. -15.
60. -15.
70. -15.
90. •15.
156-

Table 12. Sample Output for a Simulation Run with Fixed Aerodynamics
•• INPUT OAT* ••
MUM 14«*1 CONMU 1* • 4 10 1 CU - fUfcO AfcBU • PRECtSi 1*0 i in THRUST
»LPM* CD
CH «LHh« C« *LfH« CNb
CtP
J00E«U1
JUOE-UI jUOE-ul IOOE-IJ
JUOE'ul oUOE-vl uOOC'ul
1.9U0E»ul l.uOOE*.! 1.3U0E*.!
vo irpsi .00uot»01
0 (RPH) l.$OUuE*OJ
«MOP IDEM <.86UUE*0J
H» (fT) -l.OOUUf-.O I
•S.OOOfc'üO -V.400E-U1 •».BOSE^UO ■1.100E-U2 •».OOOE*UO 1.700E-U1 0.
•i.uoof oi 0.
•1,»00E*U1
-^.000E-ll2 v.
■4.U00E-0J J. 1.600E-01 1.000£»U1
-i.souf ui l.OOOE'Ol
■1.900E*U1
G*HM*U lOfcül 0.
MO (fT) i.uom'Dj
KG (L8) 0.
S.II00E*00 2.400E-01 ».U00E*00 l.iOOE-02 i.OOOE*00 1,700E-01 2.000E*01
■l.iOOB'Ol 2.000E*01
-l.SODE*01
HVO <UtG)
1.000E*01 4.400E-01 l.OOOfOl
-».000E-0J l.OOOE'Ol 2.100E-01 I.OOOE'01
-1.50ÜE-01 J.OOOE'Ol
-1.900E*01
l.»0UE*01 «.»OOE-01 l.»00E«01
-•.OOOE'OJ l.SOOE*01 2.aOUE-01 4.000E*01
-1.50UE*01 4.000E*01
-1.500E*01
M (DEO)
V* (FPS)
DMl (LB)
D (IN) fl.OOOOE'OO
Td (SEC) l.SOOOE'Ol
2.000E*01 6.011(16-01 2.000t»01 1.200E-02 Z.000E.01 J.000E-01 ».000E*0t
•1.>OOE*01 4.000E»01
-1.500E«01
4.00ÜE-01 1.200E*00 4.000E*01 /.60UE-n2 4.U0I)E*01 2.300E-01 *,U00E*01
-l,»0OE*01 6.000E»01
-l.S00E*01
k (DEO)
HP (IN) 2.0000E*00
• OOOETl .37UE*D0 .aooE*ri .200F-r2 .ODOE'Dl •lOUE-rl .OOOfOl ,900F*nt .OOOE'Ol .900E*P1
PHI (PEG)
9.üOOE'O;
1.340E-or ».OOOE-Ol I. 9.onoE<oi 0. s».000fc-01
-1.500E.01 9.000E>01
-I.ÜOOE.OJ
Tl (SEC) 0.
WPO (LB> 9.0UOOF*00
U (SEC) 1.9O0(IE»01
1. o.ouo IHRUSTi 1.000
-157-
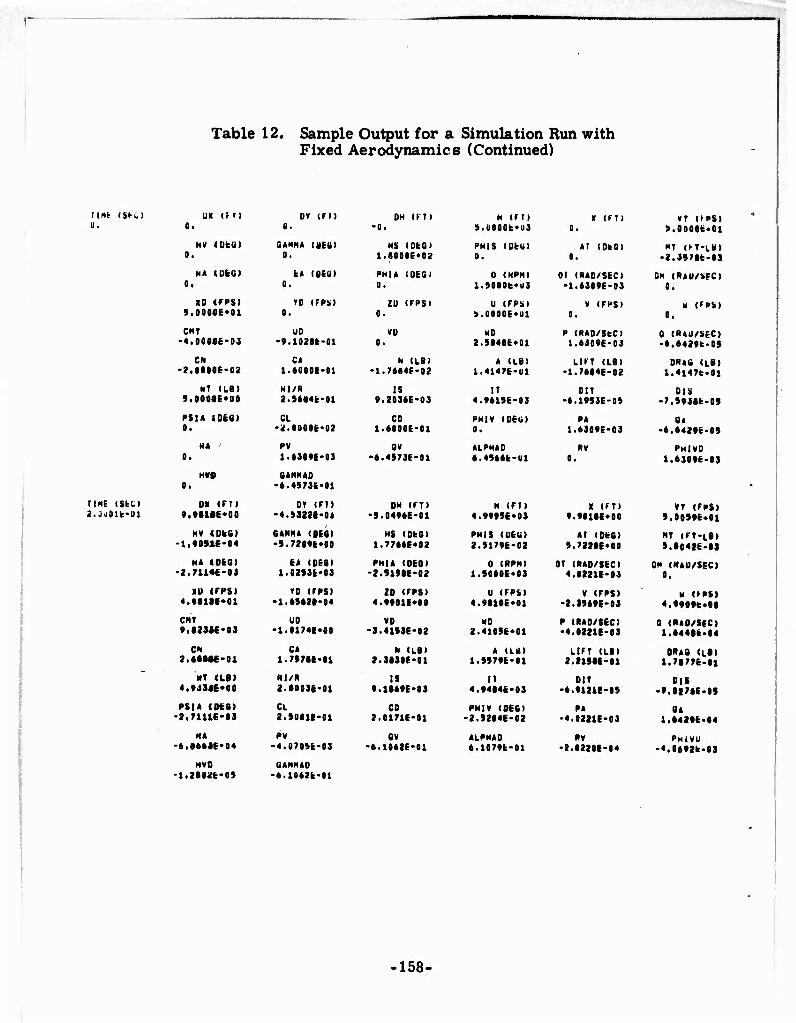
r
Table 12. Sample Output for a Simulation Run with Fixed Aerodynamics (Continued)
tint (SK) U» (M) 0.
DY (Fl) 0.
OM «FT) -0.
H «FT) ».OOOOf (13
X (FT) 0.
VT OPS) 5.00006*01
hV (DfeU) 0.
CAHHA (UEU) 0.
HS (OfcG) 1.80006*02
PHIS (Utli) 0.
AT «ObG) 0.
HT (>T-LB) -2.39786-03
M« tUiQ) 0.
fe» (86li> 0.
PHIA (D6G) 0.
0 «MPH) 1.5000k*ü3
01 (PAD/S6C) -1.63096-03
OH (RAU/ÜFC) 0.
XD (FPS) 5.00086*01
TO (FPU) 0.
ZO (FPS) 0.
U «FPS) ».OOOOE*U1
V (FPS) 0.
W «FPS) 0.
CHT -4.00006-03
UO -9.102St-01
VO 0.
HO 2.58486*01
P (RAD/SkC) 1.6309E-03
0 (R4Ü/SEC) -6.64296-09
CN -2.00006-02
C« 1.60001-01
N (LB) -1.76646-02
A (LB) 1.41476-Ul
LIFT (LB) -1.76I4E-02
DRAG «uB) 1.4l47t-01
*T (LB) 5.0000E»00
Hl/R 2.96646-01
IS 9.20366-03
IT 4.9619E-03
OIT -6.19936-0»
Oil -7.59386-05
P5I* tDfcO) 0.
CL -2.00006-02
CO 1.60006-01
PHIV (OEUI 0.
PA t.63096-03
at -6.64296-05
0. PV 1.6J09I-03
BV •6.49736-01
ALPHAO 6.49666-01
PV 0.
PHlVO 1,630*6-03
0. 64HMA0
-6.457J6-01
TIME (Sbt) 01 (FT) 9,9il«E*00
OT «FT) -4.»3221-04
OH (FT) -5.04966-01
H (FT) 4.99956*03
X (FT) 9.98166*00
VT (FPS) 9,009*6*01
HV (DkC) -1.90516-04
OANN« (QES) •».72096*00
Hg (OkO) 1.77666*02
PHIS «OEU) 2.51796-02
AT (OkO) 5.72206*00
HT «FT-LB» 9,80426-83
N* lOkO) -2.71t4€'03
EA (060) 1.02SJ6-0J
PHIA (OEO) -2.51566-02
0 (PPM) 1.90006*03
OT (RAD/SEC) 4.02216-03
OH (HAU/SEC) 0.
xu <rps) 4.9B106*01
TO (FPS) -1.65621-04
ZO (FPS) 4.99016*00
U (FPS) 4.98106*01
V (FPS) -2.35696-03
w (»PSi 4.99096.00
CNT 9.a2SM-09
UO •1.01742*00
VO -3.41536-02
MO 2.41056*01
P «RAD/SEO -4.82211-03
0 (RAO/SEC) 1,64486-84
CN 2.«••«•01
CA 1.7S76E-«1
N «1.8) 2.36306-01
A «L«) 1.9979E-01
LIFT «LB) 2.21586-01
DRAB «L») i,7877E-81
MT (LB> 4.t4S4E*00
Rl/R 2.80036-01
IS 9.16696-03
IT 4.94646-03
OIT -6.fl21i-89
•ts -9.02766-05
PSJ* «DfcG» -2.71116-03
CL 2.»0011-01
CO 2.01716-01
PHIV «PEG) -2.92(46-02
PA -4.0221E-03
BA 1.64296-04
M« -6.J66J6-04
PV -4.07056-03
BV •6.10626-01
ALPHAO 6.10796-01
RV -2.62206-04
PHiVU -4,06*26-83
HVD -1,26026-05
UANMA0 -6.10626-01
-158-

"~1
Table 12. Sample Output for a Simulation Run with Fixed Aerodynamics (Continued)
UK IM 1 l.992dh*ltl
UT irn -1.24k7f04
UN (TT) •1.97»6fc«00
H irn 4.»9«0fu3
II (M) 1.99226*01
VT (t^S) »,0S126*0l
MV (DfcUl -1.2U616-UJ
UAMH« (UfeGI -l.lU43f01
HS (UkUl l.776»fc»02
HN1S (U6U) 1.92416-02
Al (OfeG) 1.10446*01
MT (M-LB) -».2A91e-03
N« iDfcü) i« lUkb) 7./7»ek-04
HHU I0t6) •l.ftUf!ll
O (NPH) l.>O00fL(J
OT (HAn/StCl -3.67296-03
0" iHij/ifc; 0.
»U (fH!,) «.»37/6«Ul
TD «fPSil -l.U4J6t-03 «.67666*00
U (>PS» 4.99776*01
v irpsi -4.29146-03 9,67636*00
CHT -(1,7*1*6-03
UD -1.3390fc*00 ?.4eS7b-02
MD 2.28796*01
P (RAD/S6C) 3.6/296-03
U (NAJ/SFC) 'l.>?U2t-04
CN 4.4«3»E-U1 2.24626-01
N <LH) 4.04616-01
* (Lb) 2.02706-01
LIM (LB) 3.>e?9E-01
DHt>i (LB) 2,78466-01
■T (LHt 4,866/^*00
rtl/H 3.014bi-01
IS 9.16746-03
IT 4.93J96-U3
BIT -7.629ÜF-0!)
01* -1,04616-04
^i»|A (DtU) •4.9396i:-ü3
CL 3.970it-01
CD 3.06346-ül
HH1V (U6G) -1.95956-J2
PA 3.6/296-03
JA
-l.»l/oe-04
4,9VU>fc-ü4 fV 3./ü05k-ü3
UV -i.7024^-01
ALPHAD t.78096-ul
RV -2.137*6-04
PHIVO
3.71386-03
NVU -1.6J3Vf-U9
ijANMAI.
-i».;824t-üi
o. gib- l U« (M)
?,9((07b*Ul L» (Ml
-3.4962t-lM DH (Ml
•4.36!>46*U0 H (Fi )
4.v9»6fc*Ll3 »on
2.98C/F*01 VT (tPS)
5.1?69c.01
HV (DkU) -I.ls70fc-U3
BANN« (Ubb) -1.6U04k*Ol
Hü (DtGI -2.452»6*0U
PHIS (U6U) 1.76276-02
Al (OtG) 1.60836*01
HT (M-Lb) -2,272»e-03
H* Idtti) 3,9*U6t:-03
k« lufiui -/.>5b0t-U4
HH|* (UtG» 1.76116-02
0 (HPMI I.»a006*u3
OT INAD/S6CI -1.»8196-03
LM (H«J/,H.l 0,
4,926it»ül rD IH»liI
-v.y4bot-04 iU ireii
1.42U46*01 U (»P»)
4.92626*01 V (FfSI
3.3/0V6-03 ■4 (»PM
I,4?ü36.ül
CHT -J.666it-U3
on -l./70!>t»UÜ
vu 3.?236fc-U2
«0 2.23136*U1
P IHAD/StCI i.^Bi^e-Oi
1 (RAÜ/bFC) -6.6169e-09
Civ S.06ÜÜt-Ul
L'4 2.»4J3fc-01
N (LSI 4.70466-U1
A (Lb) 2.64366-ul
LDT (LH) 3.78«Uf-ni
0"Au db) 3.84316-01
If (LH) 4,RUOOE*U0
Hl/N 4.2l44t-01
IS ».14S16-03
11 4.V179t-ü3
lilT Bit -1,189^-04
Pt>14 (DfcOl 3.«<!ü7fc-UJ
CL 4.0743t-Ul
CO 4.133V6-U1
PH1V (b6(i) 1.832S6-02
PA l.Ml»f*03 -e.64/7e-01
6,5684t-04 f V l./U20fc-U3
ÜV -5.*344fc-0l
ALPHAO S.»3376-01 1.9^886-04
PMIVLI
l.M/4k-aS HVU
l.«4((;(--ü'> UANMAU
-».!>344k-l)l
159-
Table 12. Sample Output for a Simulation Run with Fixed Aerodynamics (Concluded)
ilie (Se^) a. -oit-a
1. voOOt'OÜ
UX (F t) 3.9622E»01
0* (FT) •4.9a»7k-04
DM (FT) •7.64»9F-»00
HV (DkG) -7,4ȟ/E-04
GAMH« (QkU) •2.079«k*01
MS (DkG) 1.77S6E»02
M» (DkG) -S.262VE-U3
k« (UEG) ».0S»3k-04
PMIA (DkG) -l.l»96E-02
«U (FPS) 4.aaa;E*ui
TD OPS) -6.3»72k-04
2D (FPS/ l.»»66E»Ul
CNT 1,4*4/6-02
UU •1.9»9ek*00
vu -1.2eiOE-01
CN 6.23a«E-01
c* 2.9721k-01
N (LB) 6.039St'-ül
«T (LB) 4.7333E*00
HI/R 3.4027k-01
IS 9.1199E-03
PSt* (DkG) -S.2628E-UJ
CL 4./771f01
CD 4.9936E-01
M4 •2.6240E-03
PV -7.0S42t-03
UV -*.l»0HE-0l
HVO -1,4270E-0»
(jAMMO -».itoak-oi
U» (FT) 4,93*(E*D1
0» (FT) •7.a930t-04
DM (FT) -1.1776E»01
MV (DkG) -3.9329E-D3
G4MH* (Bfctt) -2.boaoi*ai
MS (DkG) 1.774a£«02
H« (DkG) -6.2944E-02
1« (UEG) S.412»k-03
PMU (DkG) -1.26»6E-0l
xü (FPS) 4.a494E*01
YD (FPS) -2.9902k-03
2D (FPSI 2.2»9tt*01
CUT 2.827St-02 -1.9902k*00
VD -3.72S2E-01
CN 7,S297E-01
C* 2.8220k-gi
N (LB) 7.63S4E-01
«T (LB) 4.«66/E«00
HUH 3.59106-01
IS 9.09taE-03
Put« (DkG) ■6,2»3»E-U2
CL ».6194E-01
CO ».746»E-0l
H4 •7,72»9fü3
PV -l.»401k-02
av -4.70e3E-0l
MVU 1.9»a4k-04
U4MH4D •4. ;u83t-01
M (Fl ) 4.y924k*a3
« (FT) 3.9ft?2F«01
VT (fDS) S.2»94t.01
PMIS (Dkl.) 1.1906E-U2
*l IDkG) 2.0/9»F»01
NT (FT-LB)
9.3a22k-03
0 (KPH) I.b000fu3
01 (RAD/SkC« 6.5493E-03
OH (»«J/SFO 0.
U (FPS) 4.aaa7k*oi
V (FFS) -4.4904F-03
w (fPS) l.a<67k.0l
MD 2.12a7k*Ul
P (M4D/SfcCI -6.»493E-03
C (MAÜ/SFC) Ü.B?ilt-04
* (LB) 2.a7S3k-ai
LIFT (LB) 4.6214E-01
DFl4li (lb) 4.a3m-oi
II 4.9005t-U3
DIT •9.O627E-0»
OIS -l.3329t:-0«
PMIV (OtO) I.2725t-U2
P* -6.S493E-03
04 2.ai!>0k-04
4LHH4D S.1536t-Ul
PV -1.2773E-04
PMtVU • 7.0492l:-03
M (Fl) 4.»aa2E*03
X (FT) 4.9360E-01
VT (»PS) »,394Sfc«0l
F>NIS IMfii 1.2618E-I)1
«T (D6G) 2.9oatE«01
NT (FT-LB)
1.9u9e-02
0 (NPH) l.5000t»03
OT (R«D/$kC) 1.3388E-02
OH (HAU/SFC) 0.
U (FPS) 4.8492E»01
V (FPS) -9.2929E-02
H (FPS) 2.2701t.0l
MD 2.08446*1)1
P INAD/SkCI -1.33876-02
0 (NAÜ/SEO
6.05646-04
* (LB) 2.86246-01
LIFT (L9) ».699«E-01
DN«U (LB) »,82876-01
IT 4.88l7fc-u3
DIT -9.779»E-(I»
OIS •1.47626-04
PMIV IDE«) 1.39186-01
P* -1.33886-02
U4 »,91036-04
ALPM4D 4.71426-01
NV •1.322I1E-03
PHIVU
-1.93176-02
160-
.
Another useful modification of the program to permit simplification of the input data for nonburning applications (inert or ordnance items) would be to permit input of total weight and inertias and bypass the separate case, pyrotechnic parameters, ignitioa and burning times which have to be care- fully "faked out" to simulate a solid body and avoid singularities in the automatic calculations of inertias. If it is intended to alternate between inert and burning configurations, this could be handled by input logic which demand only the inputs needed at the time.
If it is intended to use the program for nonburning ordnance items then it would be preferable to create a separate deck with the unneeded variable mass and aerodynamic terms deleted. This latter form would be directly applicable to flettner rotor munitions for which presently available pro- grams are either nonprecessing 3 degrees of freedom, using planar aerodynamics, or full 6 degrees of freedom requiring the full set of six- component static and six-component dynamic aerodynamics.
-Ifil- (The reverse of this page is blank)

V. BIBLIOGRAPHY
The following documents were used directly or indirectly in support of the publication of this report. The history of the project.personnel availability, and the modus operandi of aerodynamicists made it difficult to cite specific references. Some of these documents have come to light since the efforts were completed and could thus contribute only to the subsequent interpretations presented herein, or to future extensions/applications.
-163-

Pfaff, L. J., Wind Tunnel Test for Static and Dynamic Stability Characteristics of Nonspinning Self-Suspended Flare Models (Subject, No Title), Honeywell Inc. Government and Aeronautical Products Division (GAPD), Evaluation Department, Report OEXM 20521, 12 December 1969.
Pfaff, L. J., Wind Tunnel Test of Spinning Self-Suspended Flare Model (Subject, No Title), Honeywell Inc. GAPD, Evaluation Department, Report OEXM 227777, 30 September 1970.
Katz, P., "The Free Flight of a Rotating Disc", Israel Journal of Technology Volumes, January-March 1968, pp. 150-155. NASA Report A68-28849.
The following papers, with p similar treatment of Magnus rotor
stability, were published in the Proceedings of the Conference on Dynamics
and Aerodynamics of Bomblets, Air Force Armament Laboratory, Technical
Report AFATL-TR-67-195, Volumes I and II, October 1967:
Stilley, G. D., "Unified Stability Criteria for Autorotating Glide Bomblets, " Honeywell Inc. GAPD.
Zipfel, P. H., "On Stability of Vortex Gliders as Applied to BLU-26 and Other Autorotating Self-Dispersing Shapes", US Army, Ft. Detrick.
Brunk, D. E., "Aerodynamics and Flight Mechanics of High Performance Autorotating Glide-Type Bomblets", Alpha Research, Inc.
The following report is representative of a large series of similar tests conducted in both 1963-65 and in 1971:
Stockman, R., Wind Tunnel Test of Typical XM-41 Cylindrical Magnus Rotor Models (Subject, No Title), Honeywell Inc. GAPD Evaluation Department, Report OEXM 11176, 3 November 1964.
Ganslen, Richard V., "Aerodynamic Factors Which Influence Discuss Flight", Research Report, University of Arkansas, 1958.
-164-
Etkin, B., Dynamics of Flight-Stability and Control, John Wiley & Sons, 1959.
Hirushow, W. K., "Euler's Rotational Equations for Bodies with the Inertia Varying due to Mass Distribution and Mass Loss, " AIAA Journal, Volume 7,
Number 2, February 1969, pp. 337-339.
Bird, J. D. and C. P. Llewellyn, "An Analysis of the Stability of Spinning
Disks During Atmospheric Reentry, " NASA Report TM X-248, March 1960.
Mugler, J. P., Jr., and W. B. Olstad, "Static Longitudinal Aerodynamic
Characteristics at Transonic Speeds of a Lenticular-Shaped Reentry Vehicle, "
NASA Report TM-X-423, December 1960.
Demele, F. A. and J. J. Brownson, "Subsonic Aerodynamic Characteristics
of Disk Reentry Configurations with Elliptic Cross Sections and Thickness-
Diameter Ratios of 0. 225 and 0. 325, NASA Report TM-X-566, May 1961.
Brunk, J. E., Aerodynamic Dispersion Techniques, Contract Status Report
Number 2 for Air Force Armament Laboratory, Contract F08635-70-C-0012, Alpha Research, Inc., Report 69-0012-2, 15 December 1969.
Willmarth, W. E. and N. E. Hawk, University of Michigan, "Investigations of the Steady and Unsteady Motion of Freely Falling Disks, "DDC Report AD420913, October 1963.
Willmarth, W. W. and N. E. Hawk, University of Michigan, "Aerodynamics of the Free and Forced Oscillation of a Disk at Subsonic Speeds, " DDC Report AD431186, January 1964.
Willmarth, W. W., Hawk, N. E., Galloway, A. J., and F. W. Roos, "Aero- dynamics of Oscillating Disks and a Right-Circular Cylinder", J. Fluid M?ch., Volume 27, Part 1, pp. r 77-207, 1967.
•165-

Bustamante, A.C. and G.W. Stone, Jr., "Autorotational Characteristics of Flat Plates and Right Circular Cylinders at Subsonic Speeds, " Sandia Laboratory, November 1967.
Goldstein, S., "Modern Developments in Fluid Dynamics, " Dover, New York, 1965.
Rosenhead, L., "Laminar Boundary Layers, " Oxford, London, 1963.
Schlichting, H., "Boundard Layer Theory, " McGraw-Hill, New York, 1960.
Tagirou, R. K., "Influence of the Initial Boundary Layer on Base Pressure, " Mechanika Shidkosti i Gaza, Volume 1, Number 2, pp. 145-148, 1966.
Dale, J. R. andR.A. Holler, "Secondary Vortex Generation in the Near Wake of Circular Cylinders" presented as Paper 69-755 at the CASI/AIAA Subsonic Aero and Hydro-Dynamic Meetings, Ottawa, Canada, 2-3 July 1969.
Takenatsu, M., "Stability of Laminar Flow Along a Flexible Boundary, " Reports of Research Institute for Applied Mechanics, Volume XVI, Number 53, 1968.
Pantor, R. L. and S. A. Bugu, "Analysis of the Boundard Layer Preceeding an Accelerating Flame, " Astronautica Acta, Volume 14, pp. 469-474, Pergamon Press Ltd., Great Britain, 1969.
Eckert, E. R.G. and J. R. Harnett, University of Minnesota, "Mass- Transfer tooling in a Laminar Boundary Layer with Constant Fluid Properties" presented at ASMC Annual Meeting, Chicago, Illinois, 13-18 November 1955.
Eckert, E. R.G. and R. M. Dreke, Jr., "Heat and Mass Transfer, " McGraw- Hill, New York, 1959.
-166-
Jain, V. K. and R.N. Kuman, "Theory of Laminar Flame Propogation with
Non-Normal Diffusion."
Mahuchi, I. ( Tanaka, T.( Kumada, N., and Y. Sakakibara, "Studies on the Connective Heat Transfer from a Rotating Disc, " Bulletin of JSME, Volume II, Number 47, 1968.
Chervinsky, A., "Turbulent Swirling Jet Diffusion Flames, " AIAA Journal, Volume 7, Number 10, October 1969.
France, D. M. and G. J. Trezek, "Effect of Heat Addition in the Gas Dynamics of a Gas-Solid Suspension, " Astronautica Acta, Volume 13, pp. 517-529, Pergamon Press Ltd, Great Britain, 1968.
-167-
(The reverse of this page is blank)
APPENDIX A
PRELIMINARY COMBUSTION WAKE EFFECT ANALYSIS
The following analysis of the aerodynamics of the combustion w tke was a
preliminary study, based on preliminary estimates at NAD/Crane of com-
bustion pressures and temperatures. The predicted pressures were not
sufficient to produce thrust so that the results of this analysis are not
applicable to thrust producing flares.
1. INTRODUCTION
The effect of the combustion wake on the aerodynamic characteristics of a
spinning disk-shaped flare will be determined by examining the combination
product-air mixture in the flare plume. The flare considered in this
analysis is assumed to burn only on cavity surfaces (see Figure 67). Then
by symmetry arguments and also since a flare is usually designed so that
the pyrotechnic burns at atmospheric pressure (i. e., no pressure jump in
the flare's aerodynamic behavior is caused by a change in density of the
medium near the flare), any finite combination product expulsion velocity
will not produce a thrust force. Thi' change in density results from the
introduction of combustion products into the airstream and from the increase
in temperature of the air surrounding the flare. Using this change in density
approach, upper bounds will be obtained which give the maximum possible
change in the flare's aerodynamic coefficients. Then the effect of the flare
wake will be negligible throughout the flare's flight.
2. THEORETICAL
The mass flux of combustion products into the flare field is constant if a
grain configuration of constant burning area is used and if the pyrotechnic's
burning rate is insensitive to the flare's orientation and velocity. Therefore,
mIN = "VV (1)
-169-
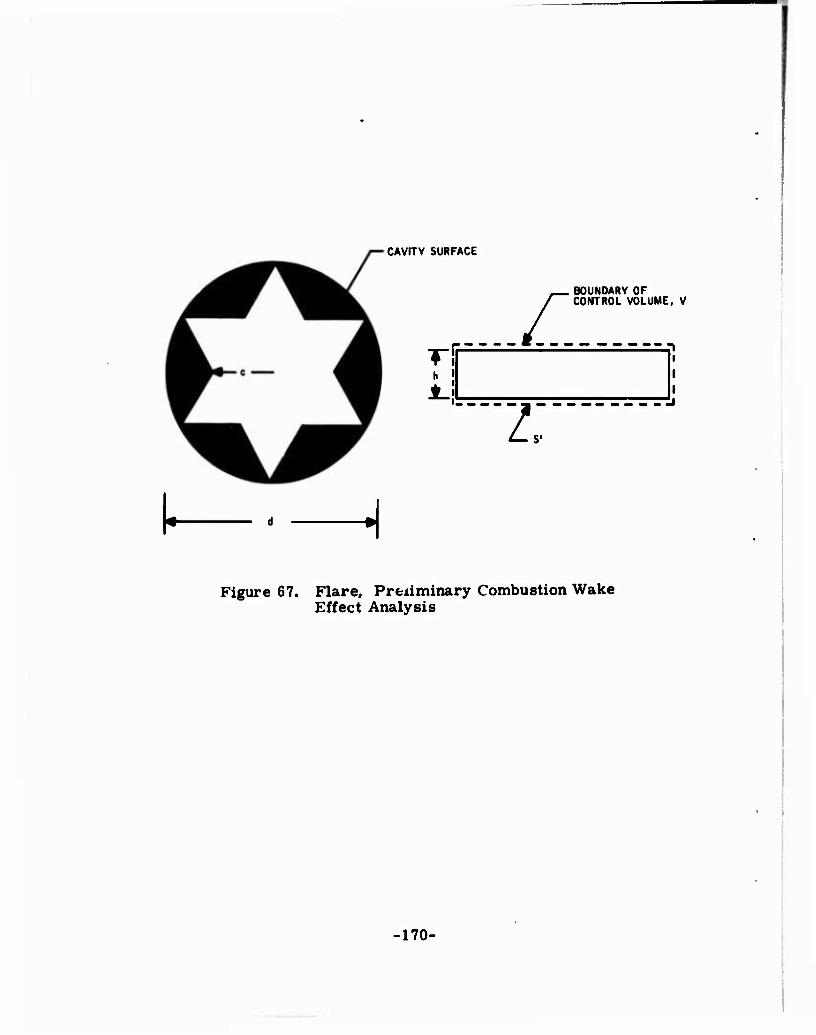
CAVITY SURFACE
L BOUNDARY OF CONTROL VOLUME, V
z:
Figure 67. Flare, Preäminary Combustion Wake Effect Analysis
170-
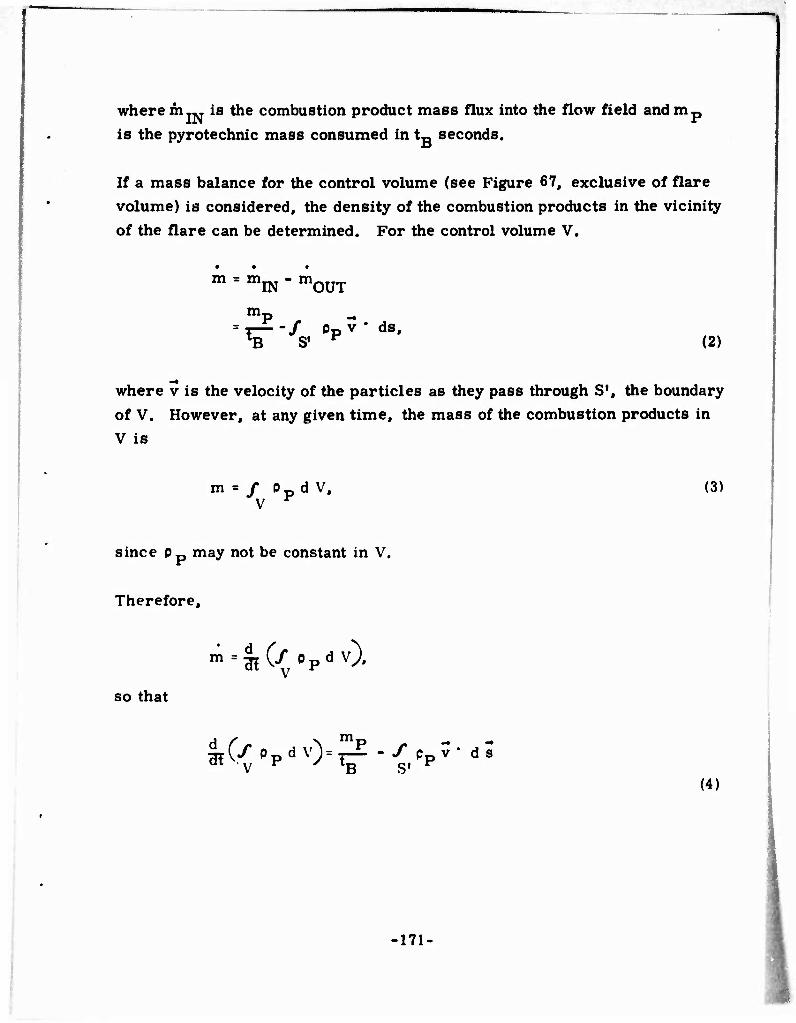
where mIN is the combustion product mass flux into the flow field and nip is the pyrotechnic mass consumed in tB seconds.
If a mass balance for the control volume (see Figure 67, exclusive of flare volume) is considered, the density of the combustion products in the vicinity of the flare can be determined. For the control volume V.
m = mIN ' mOUT m.
"B / Dp v * ds,
S1 F (2)
where v is the velocity of the particles as they pass through S1, the boundary of V. However, at any given time, the mass of the combustion products in V is
m = / Dpd V, V r
(3)
since pp may not be constant in V.
Therefore,
so that
m=^(/0pdv).
m, ^(y ppd v)=^ - f c^v- dS
'V lB S ,VP
(4)
-171.

As a first approximation to the density of air in V, the ideal gas law will be used. Therefore,
PA " THT^ ' (5)
where P., Mc, and Tp may be functions of position in V and time. Explicit determination of the density distribution in V is beyond the scope of this report. However, upper and lower bounds can be placed on p. since T-, and Mc are bounded.
3. NUMERICAL SOLUTION
The maximum change in the normal force coefficient will occur when the flare is at 90 degree angle of attack, while the axial force coefficient and center of pressure location will change most when the flare \R at 0 degrees. Therefore, combining these maximum changes will give the greatest effect of the combination product wake on the aerodynamic behavior of the flare.
If pp and p . are to be obtained from equations 4 and 5, an appropriate control volume must be determined.
The pyrotechnic considered in this problem burns at atmospheric pressure so that the change in pressure force is small compared to the buoyancy force or change in skin friction coefficient. Then, for maximizing purposes, the control volume of equation 4 can be taken as the flare cavity at burnout so that S1 = S where S is the flare's projected area.
Then, with V corresponding to the flare cavity, v will be the velocity of the combustion products leaving the cavity with component v normal to S. Although p p is a function of position in V, it will be assumed for simplicity that Pp is a function of time only. Then equation 4, which reduces to
-172-
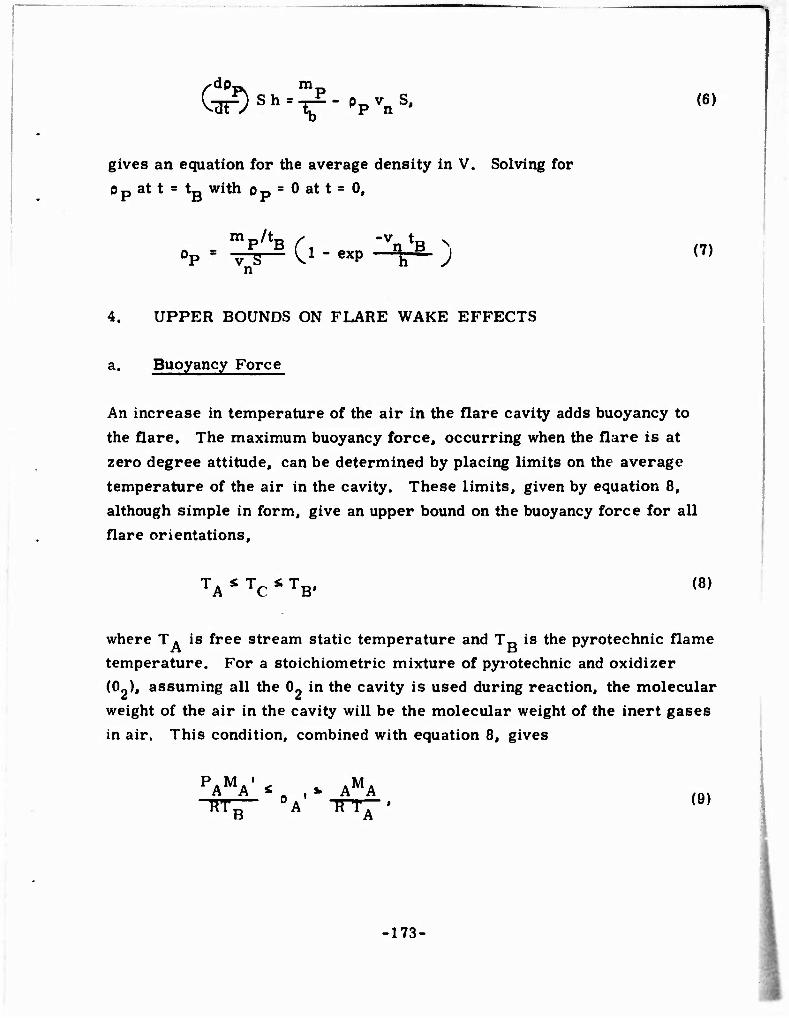
C-ar^) s h =-E - pp vn s, (6)
gives an equation for the average density in V. Solving for
0 p at t = tB with o p = 0 at t = 0,
4. UPPER BOUNDS ON FLARE WAKE EFFECTS
a. Buoyancy Force
An increase in temperature of the air in the flare cavity adds buoyancy to
the flare. The maximum buoyancy force, occurring when the flare is at
zero degree attitude, can be determined by placing limits on the average
temperature of the air in the cavity. These limits, given by equation 8,
although simple in form, give an upper bound on the buoyancy force for all
flare orientations,
TA S TC ^ TB' (8)
where T. is free stream static temperature and TR is the pyrotechnic flame
temperature. For a stoichiometric mixture of pyrotechnic and oxidizer
(CL), assuming all the 0, in the cavity is used during reaction, the molecular
weight of the air in the cavity will be the molecular weight of the inert gases
in air. This condition, combined with equation 8, gives
PAMA' *0 ,* AMA (a) RTB 0A TTTJ-' (9)
-173-

where M. = Molecular weight of air M.' ■ Molecular weight of N« 0 A ~ ^en8^y 0^ a^r in ^e cavity.
Therefore, the maximum buoyancy force on the flare will be
PA rMA MAin
which assumes that the thermal conductivity of the flare case is zero, i. e., the flare case is a perfect insulator.
rpA MA PA MA' 1
(2.38 x 10"3 - .17x 10"3)Shg
S-TTd2=4
g = 32 } S h g = 4. 19
h = 2/12
2.21 x 10"3 (4.19)
BF = 9. 25 x 10"3 pounds « Weight
.". BF < < weight of flare.
•174-
b. Skin Friction Coefficient
The skin friction force for a nonburning flare is defined by
For a burning flare, the effective density will not be the same as free stream. Therefore,
'B • c, pB a/» v«) a
=cM^](1/2^v2)S' since C « CFNB - CF and defining Cp- = ^[-5^] • CF [-L ]
B - • • -t ^NBJ F L ^B J
NB CF['^] MW. *CF' *CF[-^] MAX.
However, 0 B = 0p + P^* '
where Pp is the pyrotechnic combustion product in the control volume considered in 0 ' is atmospheric density in this volume. If 6p = 0 in the cavity, then
IN OUT,
where nip ^IN =-Tf = /S0PVndS
= 0p'vnS.
•175-

where Op' is the density in this volume when pp is zero (equilibrium density in V1). Let the time equal t ', then
'P M^/t
Substituting pp» = P (v s
"p -n«
1 = 1- e- n
p/tB fl e "V I
which is only true when t* = •. Therefore, when Pp = 0,
p 'B i sl= Conat.
Now, since
PAMA t
pÄMA
H1B »A* RTA •
we have
. mP , PAMA B D an KTA
-176-
So that
P. M MA/TB SCF , f.. mP , PAMA1
For this problem.
M^ = 22.1
MA = 28. 9
TA - 273 A TB = 2973.
Therefore, for v «* 10 feet per second.
C ' 0.070 s _iL i 1.67.
However, the skin friction coefficient is CF <0. 005> which is substantially less than the axial or normal force coefficients.
5. CONCLUSIONS
If thrust is not generated by the burning pyrotechnic, the effect of the flare plume on the aerodynamic characteristics will be negligible.
-177-
(The reverse of this page is blank)
APPENDIX B
EQUATIONS FOR TRAJECTORY SIMULATION
The following equations for quasisteady precession and translation of the flare under the assumed aerodynamic torques and forces were programmed in FORTRAN IV for the CDC 6600 computer and used to compute most of the trajectories presented in this report. This program permits selection of either free precession or suppression of precession. Some of the non- precessing trajectories shown in the report were computed with a truncated fixed orientation version of the program on a teletype computer in a special language and are not presented here.
The order of presentation is as follows:
Axes
Translation equations. *
Aerodynamic angles. *
Aerodynamic forces and moments. *
Inertial and thrust terms. *
Angular rates. *
Axis transformations using euler parameters. *
Auxiliary parameter transformations. *
Initial conditions / input constants.
Nomenclature. *
* Reprinted from original Honeywell Inc. Scientific Programming Department report.
179-
1. AXES
The axes may be defined as follows - all orthogonal triads vith origin at the flare center of gravity except for inertial axes which would have an arbitrary initial position, (see Figures 68-71).
a. Inertial Axes
The X. axis is horizontal parallel to the arbitrary reference trajectory plane (possibly aircraft direction at launch, etc.), the Z. axis is vertical down- ward, and the Y. axis is horizontal, forming the other axis of a right hand triad. These are all with respect to a flat nonrotating earth.
b. Flare Axes
The ZF axis is coincident with the positive spin axis, Xp and YF completing the right hand triad in the disk plane. The component of angular rate of the axes themselves along the spin axis, is constrained to be zero (yaw
rate, R=0). The component of the angular rate of the body along the spin axis is then the spin rate u). For zero orientation Euler angles, the flare axes would be parallel to the inertial axes.
c. Aerodynamic Axes
The Z. axis is coincident with the positive spin axis, X. and Y. are in the disk
plane, with the X. axis at the intersection of the disk plane and the aero- dynamic plane, which is through the spin axis and the velocity vector per-
pendicular to the disk plane. The normal force N is thus by definition parallel to and opposite the Z. axis, and the axial force A is parallel to but opposite the X. axis. The aerodynamic axes are related to the flare axes by a yaw rotation (♦ .) about the ZF, Z axis.
-180-
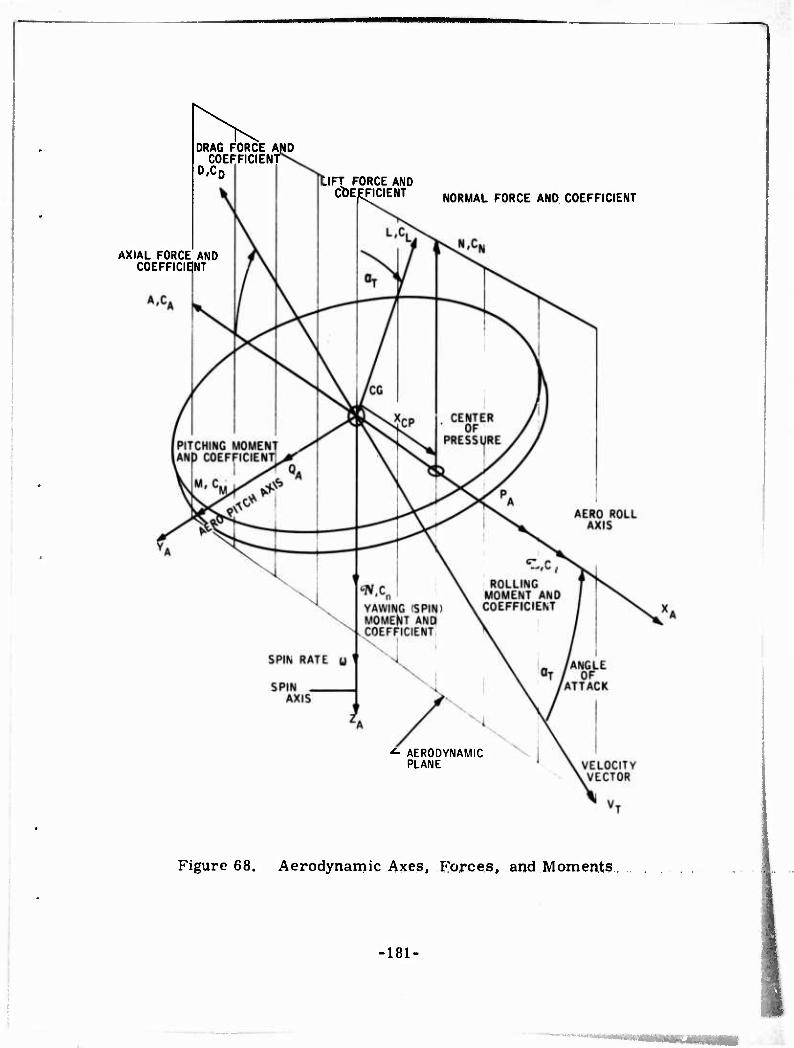
DRAG FORCE AND COEFFICIENf
D/C0 LIFT FORCE AND
COEFFICIENT NORMAL FORCE AND COEFFICIENT
AXIAL FORCE AND COEFFICIßNT
AERODYNAMIC PLANE
Figure 68. Aerodynamic Axes, Forces, and Moments
-181- ■5
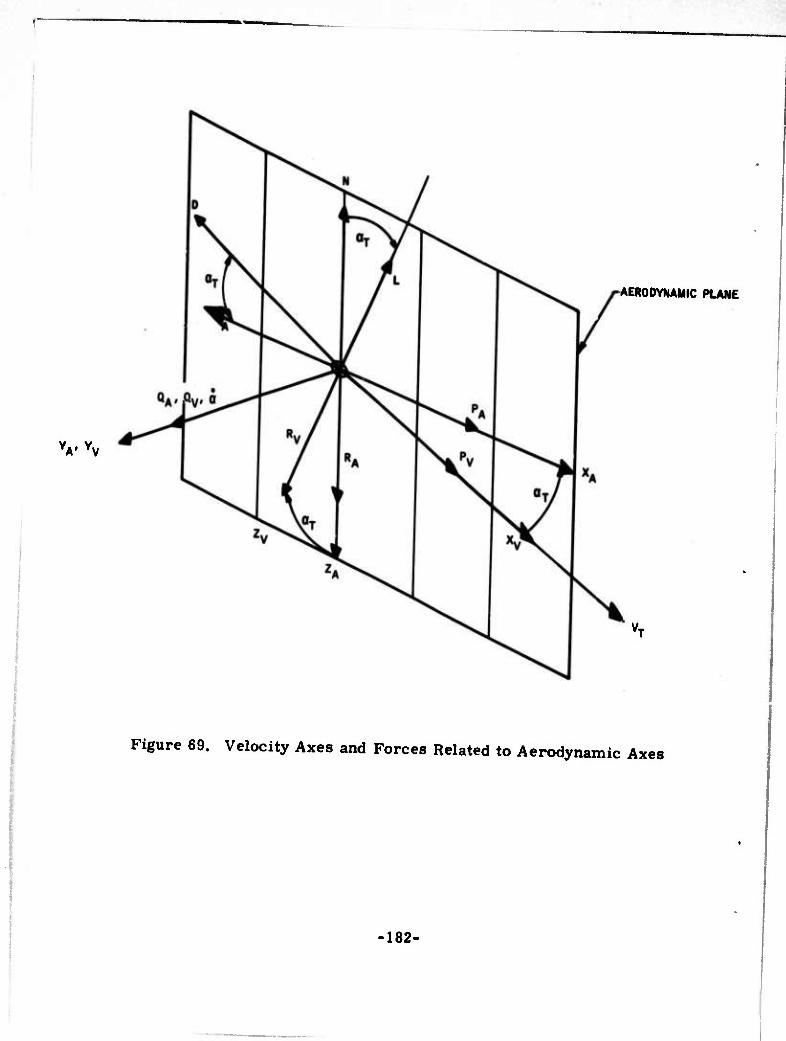
VYv
AERODYNAMIC PLANE
Figure 69. Velocity Axes and Forces Related to Aerodynamic Axes
-182-
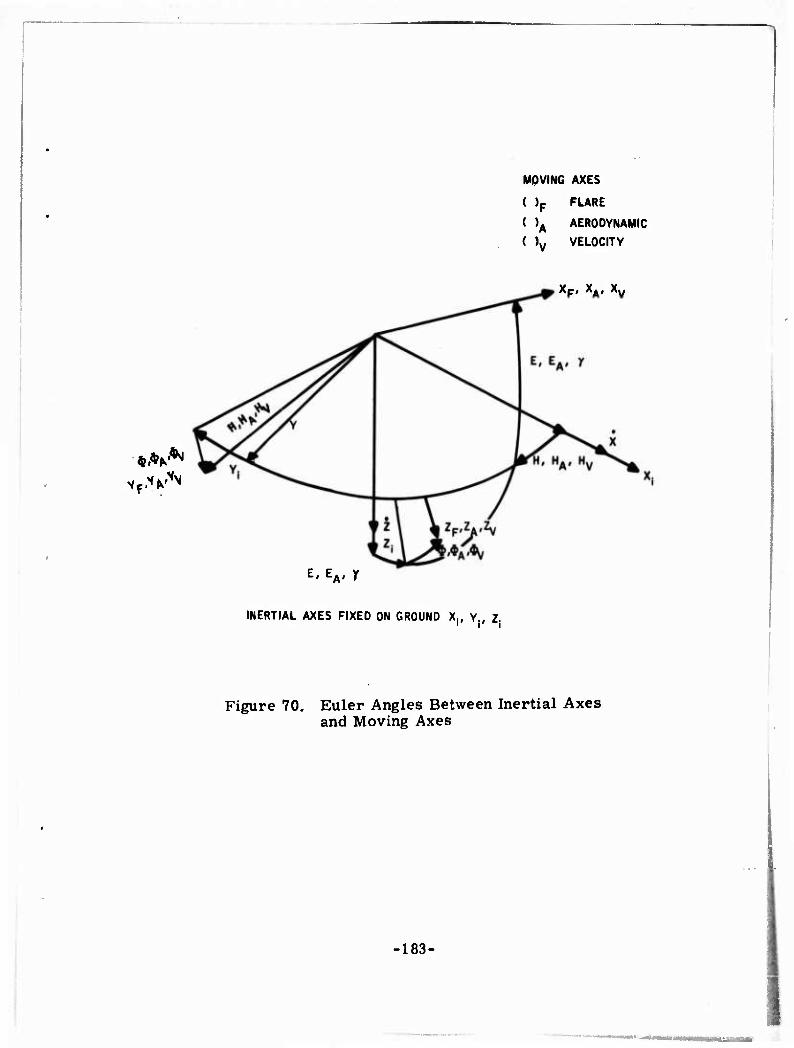
MOVING AXES
( )F FLARE
( )A AERODYNAMIC
( )v VELOCITY
Xp/ XA( X.
'f
.<JM
i.H**
E' EA' r
INERTIAL AXES FIXED ON GROUND X, Y . 2 i' |» *|
Figure 70. Euler Angles Between Inertial Axes and Moving Axes
•183-
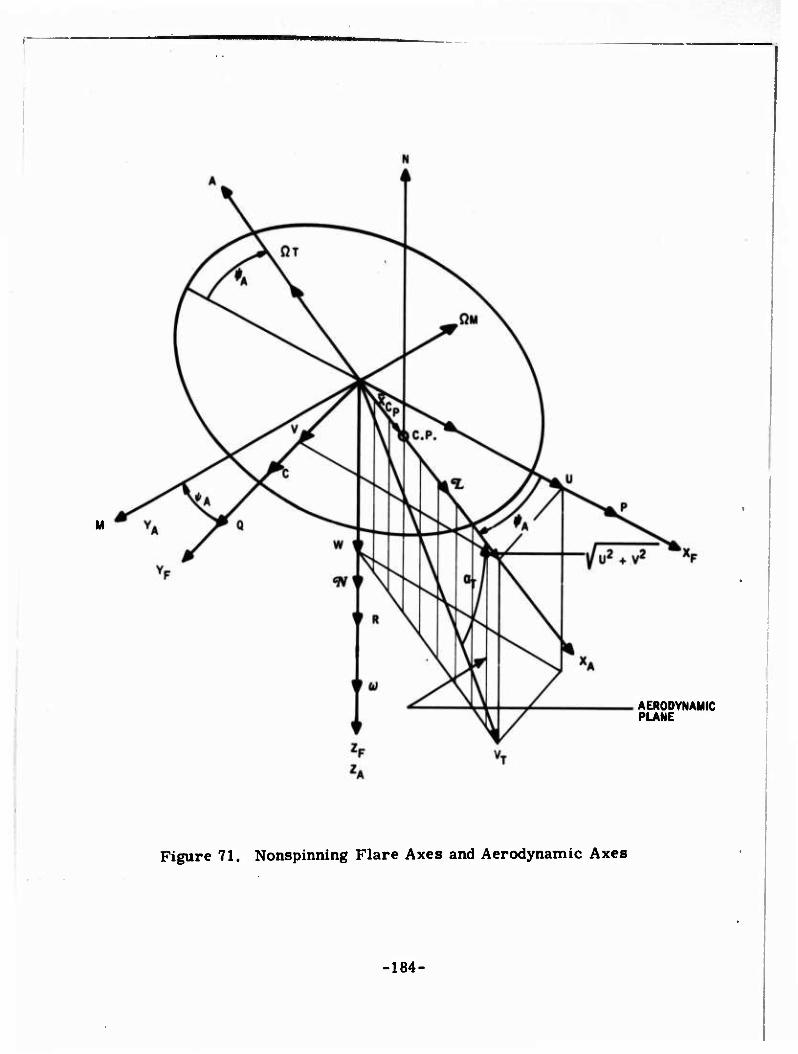
M
AERODYNAMIC PLANE
Figure 71. Nonspinning Flare Axes and Aerodynamic Axes
-184-
d. Velocity Axes
Y is coincident with the aerodynamic Y axis, Y^* or pitch axis, K , Z rf, in the aerodynamic plane, with X aligned with the velocity vector and Zv
forming the third axis of the orthogoral triad. The lift force, L, is thus by definition parallel to but opposite the Z axis, and the drag, D, is parallel to but opposite the X axis. The velocity axes are related to the aerodynamic
axes by a pitch rotation through the angle of attack, a about the Y , Y axis.
Each of the axes moving with the flare is related to the inertial axes by the Euler angles H, E, 0, for heading (azimuth of X axis), elevation (of X axis) and roll (about the X axis). For flare axes, ( ). denotes aerodynamic axes and ( ) denotes velocity axes. 0C and H are used to denote the tilt
of the spin axis from the vertical and the azimuth of the axis about which it
is tilted, respectively.
•i85-
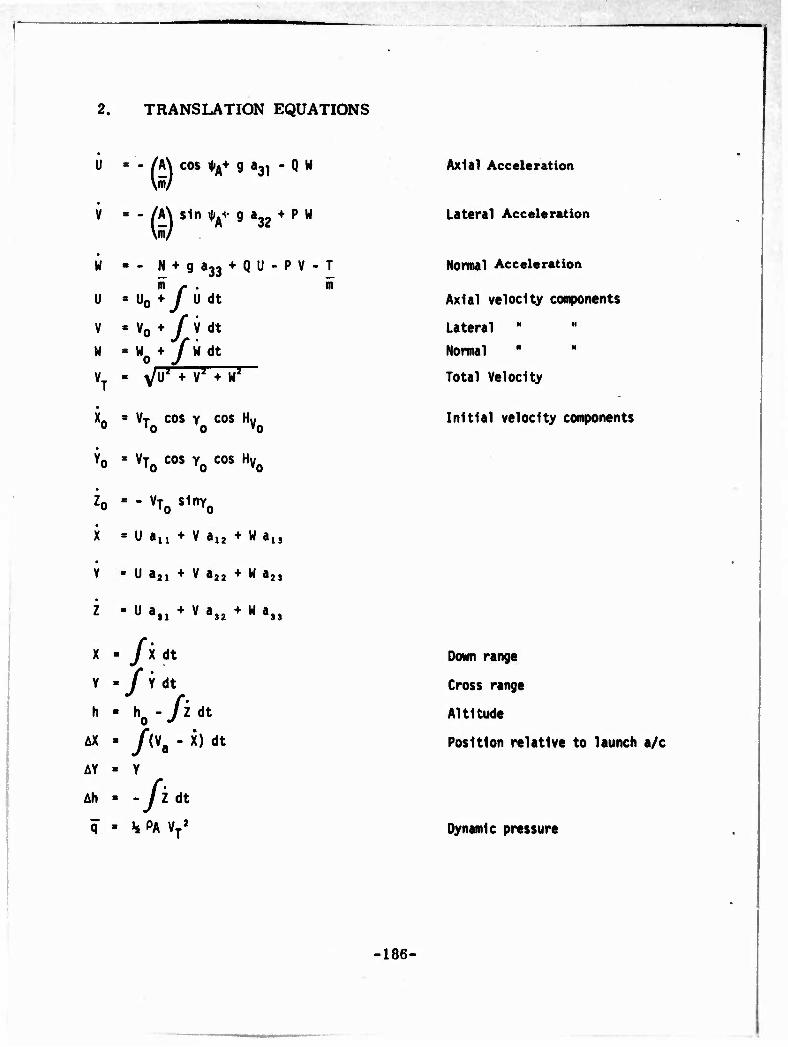
2. TRANSLATION EQUATIONS
A\ cos i|(A+ g a31 - Q W
- (A\ sin tf g a32 + P W
w
u
V
w
V,
N + gajj + QU-PV-T
U, + /Udt
v0 + y y dt W0 + /" li dt
^Uz + V2 + Wz
VT cos Y cos Hw 'o o vo
VT COS Y COS HU 'o 'o v0
Axial Acceleration
Lateral Acceleration
Normal Acceleration
Axial velocity components
Lateral "
Normal
Total Velocity
Initial velocity components
Zo - - VT0 s1nY0
X = U a,, + V a12 + W als
• Y » U a2i + V a22 + W a2j
• Z . üi,, + VaS2+Wa„
X
Y
h
" /* dt
»y* Y dt
AX • ß\ - x)dt
AY
Ah
- Y
• -Ji dt q - »i PA VT
2
Down range
Cross range
Altitude
Position relative to launch a/c
Dynamic pressure
-186-
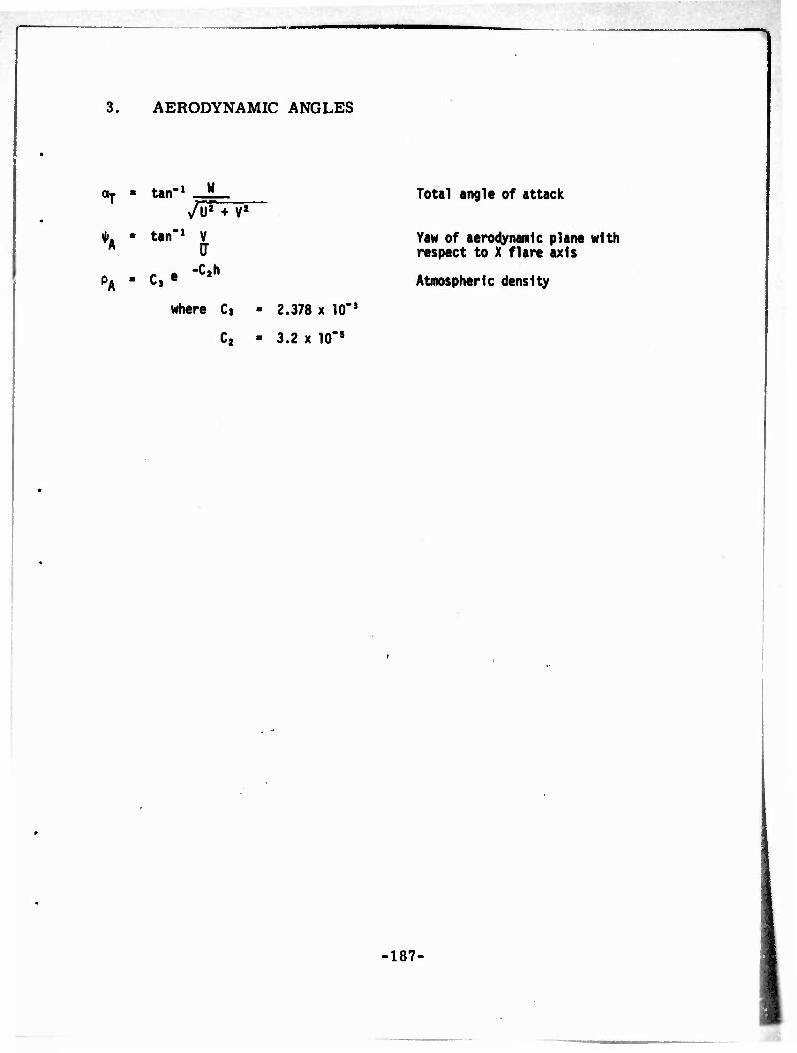
3. AERODYNAMIC ANGLES
,-i
yu2 +va
». • tan"1 V A 0"
,. a -C2h PA • C,«
where Cs - 2.378 x 10"»
c2 ■ 3.2 x 10'5
Total angle of attack
Yaw of aerodynamic plane with respect to X flare axis
Atmospheric density
-187-
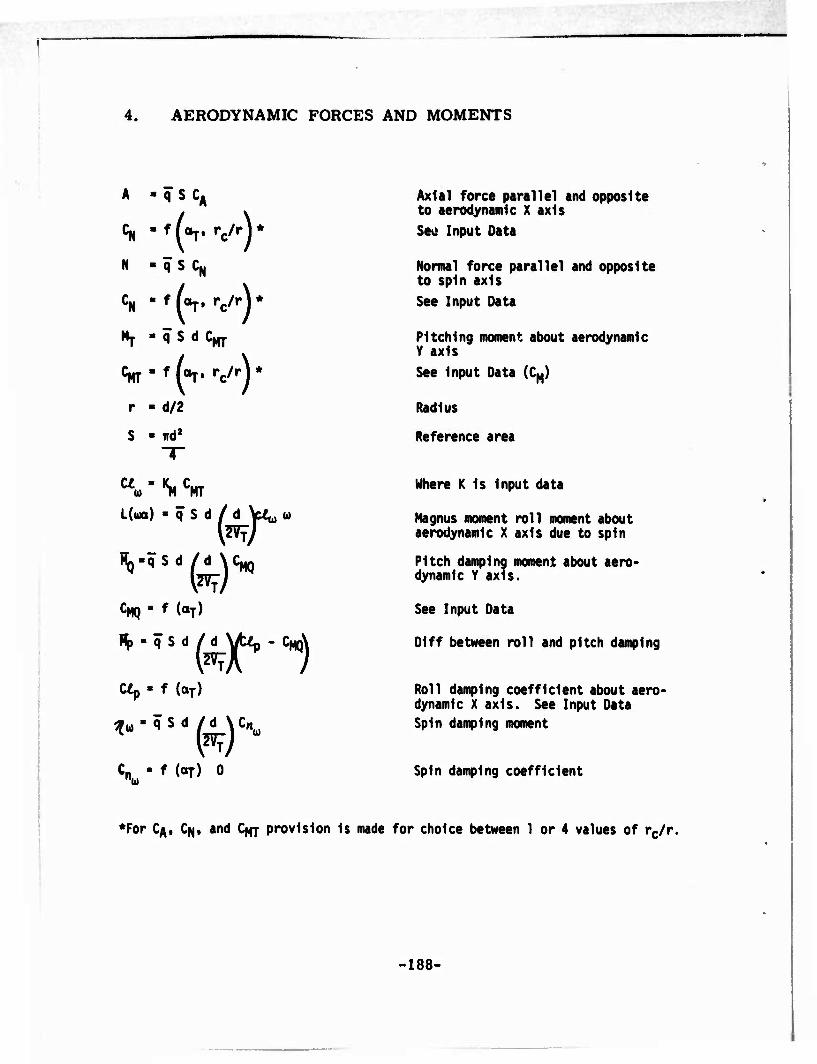
4. AERODYNAMIC FORCES AND MOMENTS
A -qSCA
CN "f(v rc/r)*
N -qSCN
CN
-f^. rc/r) *
"T - q S d C MT
CMT • tL, rc/rj * r - d/2
S •ird2
U Hi
L(ua
■Si Sir ) -q Sd
fSd /d 127
(^
;)*"
M
CMQ • f (aT) '/
Op
q S d / d \/fc/.p -
(2VTA • f (aT)
CMQ\
*." q Sd /
i1 9C"" Cnw'
• f («T) 0
Axial force parallel and opposite to aerodynamic X axis
See Input Data
Normal force parallel and opposite to spin axis
See Input Data
Pitching moment about aerodynamic Y axis See Input Data (CM)
Radius
Reference area
Where K Is Input data
Magnus moment roll moment about aerodynamic X axis due to spin
Pitch damping moment about aero- dynamic Y axis.
See Input Data
01 ff between roll and pitch damping
Roll damping coefficient about aero- dynamic X axis. See Input Data Spin damping moment
Spin damping coefficient
*For C/\, C|i|, and C^ provision Is made for choice between 1 or 4 values of rc/r.
-188-
5. INERTIAL AND THRUST TERMS
WT - Wp + Wc + AWj
0) Before Ignition t < tj
Total Weight
m « 0
rc/r - 0
AWj - AWj. AISI - AISI, AltI - AItI T - 0
(2) After Ignition tj > t
1 "t m - i üßo
rc/r ■ n/r
AWj - AISI ■ AItI - 0
T ■ Thrust ■ Constant
m
(?)■
Is
It
Up
I tp
'sc
Wp0 - g m (t - t,)
Wp/g
w/g
V9 nv
* Pn K r2 P P
Isp + he * AIs1
Itp + Itc + Alt1
1 + (^1
m, r 1 + 2 (V')
Spin inertia
Transverse Inertia
Spin Inertia of Pyrotechnic
Transverse Inertia of Pyrotechnic
Spin Inertia of cup
-189-
(
Uc ■ "c^ 1 + 4 M iMiiM!
1 ♦ 2 (SA) AI Si
AI ti V1 1' * C1^)'!
Transverse Inertia of cup
Inertia loss at Ignition
Rate of change of Inertia
•190-

6. ANGULAR RATES
(1) Axes Rates
R - 0
- »]• I cos ^A + sin *A
- flf, | sin i|<A - cos
'It - MQ'
Is U ^ \I Oii
Q1 - -Of I sin \|)A - cos i|»A
+ ^ |cos *A + sin i|/A ([t_Q
'/it-MQ\./ffp y
%
P - P, KP
Q • Q1 KP
MT'
Yaw Rate
Roll to •>
Pitch rate
Is U)
(2) Spin Rate
co ■ a)0 + /u dt
I, u Nu, u
».-
where KP Is Input data. 1 for free-precess 0 for non-precess
Aerodynamic precession rate
Magnus precession rate
Spin acceleration
Spin rate
■191-
7. AXIS TRANSFORMATIONS USING EULER PARAMETERS
EP (1)
EP (2)
EP (3)
EP (4)
EP(1)
(1) Initialize
EP(1)0
EP(2)o
EP(3)0
EP(4)ft
H (-P EP(2) - Q EP(3) - R EP(4)1
H I P EP(1) - Q EP(4) + R EP(3)J
H [ P EP(4) + Q EP(1) - R EP(3)]
H I'P EP(3) + Q EP(2) + R EP(1)]
1. ...4
(c(Ho/2) C(Eo/2) C(*0/2) + S(Ho/2) S(Eo/2) S(*o/2)
C(Ho/2) C(Eo/2) S(V2) - S(Ho/2) S(Eo/2) C(*o/2)
C(Ho/2) S(Eo/2) C(*o/2) + S(Ho/2) C(Eo/2) S(*o/2)
• [-C(Ho/2) S(Eo/2) S(*o/2) + S(Ho/2) C(Eo/2) C(*o/2)|
where C » cos, S » sin
'tj
(2) Normalize
EP(1) - EW) 1 - 1, ... 4
J-1 (EP(j)) 2
(3) Transformation ■
A2 + B2 - C2 - D2 2(BC - DA) 2(B0 ♦ CA)
■ 2(BC + DA)
2(BD - CA)
A2 - B2 + C2 - D2 2(C0 - BA)
2(CD + BA) A2 - B2 - C2 + D2
where A B C 0
■ ■ z
s
EP(1) EP(2 EP 3 EP4)
1 ■ 1,2,3 denotes Inertlal X, Y, Z axes respectively.
j 1,2,3 denotes moving flare X, Y, Z axes respectively.
Similarly ayA denotes transformation for Aero axes,
•192-
8. AUXILIARY PARAMETER TRANSFORMATIONS
N cos^r - A sin1*]- A cosof + N sin*,-
CN cos0^ - CA sinol-
og coso^. + CN slnoi
tan '(^)
where Uv » ^ X2 - Y2
tan
tan
tan'
■(f)
'23 \cosH, "33
•1
*A =
tan- ( a21A / a11A )
tan' ( a32A / a33A )
tan"1 f-tj^ / cos *K L V a33A )
where i^^ « a2] cos^ + ago sln^.
a11A » a11 cosij;A + a12 s1n^A
a32A s a32 C0Sh ' a31 ^^A a33A = a33
a31A = a31 co% + a32 ^^A
Lift Drag
Lift and Drag Coefficients
Flight path angle
Flight path heading
Azimuth of plane containing spin axis
Tilt of spin axis
Azimuth of Aero axes
Roll of Aero axes
Elevation of Aero axes
-193-
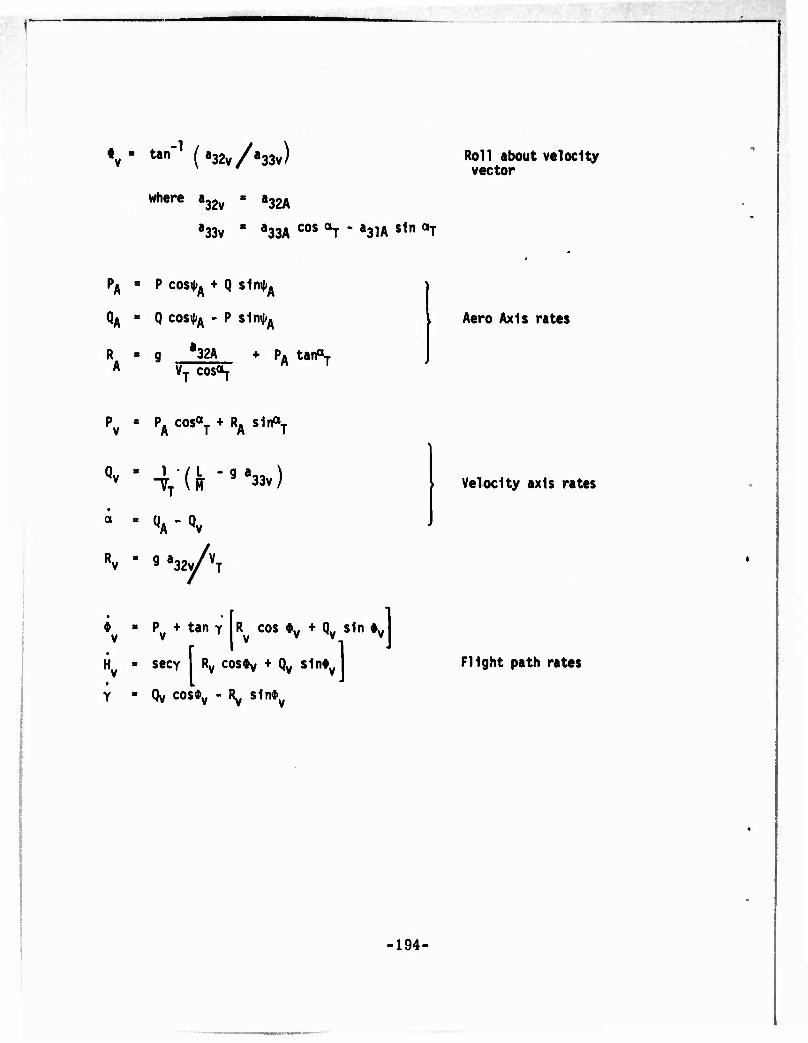
V tan-1 (a32v/a33V)
where a 32v ,32A
a33v " a33A cos aT ■ a3lA stn »T
Roll about velocity vector
PA - P cos*A + Q s1r«|/A
QA - Q cos*A - P s1n^A
R - g 32A + PA tar^y VT COSÄy
Aero Axis rates
Pv « PA cos«T + RA s1n«T
TT Iff 33v
VA vv
9 a /V
32v/ T
Velocity axis rates
Pv + tan Y R cos ly + Qv sin ^
H - secy Rv cos*v + Qv s1n#v
Y = Qv cos#v - Ry s1n»v
Flight path rates
-194-
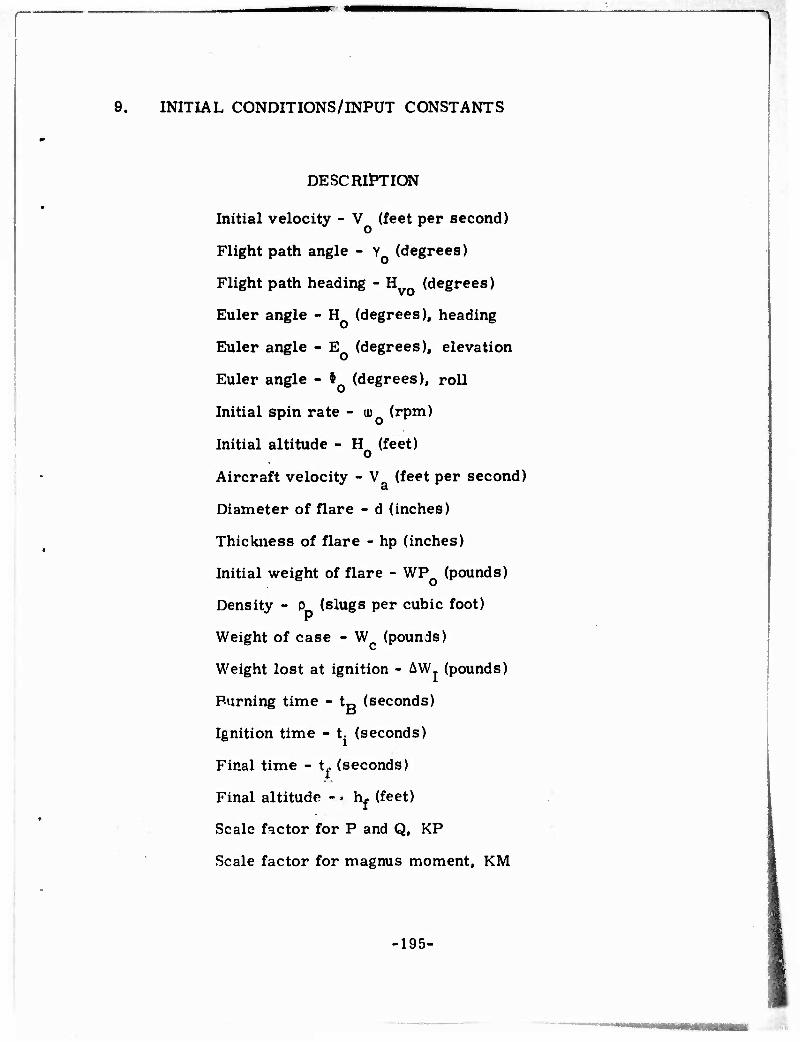
9. INITIAL CONDITIONS/INPUT CONSTANTS
DESCRIPTION
Initial velocity - V (feet per second)
Flight path angle - Y (degrees)
Flight path heading - H (degrees)
Euler angle - H (degrees), heading
Euler angle - E (degrees), elevation
Euler angle - • (degrees), roll
Initial spin rate - uu (rpm)
Initial altitude - H (feet) o Aircraft velocity - V, (feet per second)
ci
Diameter of flare - d (inches)
Thickness of flare - hp (inches)
Initial weight of flare - WPo (pounds)
Density - P (slugs per cubic foot)
Weight of case - W (pounds)
Weight lost at ignition - AW, (pounds)
Fuming time - tR (seconds)
Ignition time - t. (seconds)
Final time - tf (seconds)
Final altitude -^ hf (feet)
Scale factor for P and Q, KP
Scale factor for magnus moment, KM
•195-

10. NOMENCLATURE
MATH SYMBOL FORTRAN SYMBOL DEFINITION
A AXIAL Axial force parallel and opposite to aerodynamic
'u X axis, (lb.)
A(3, 3) Euler angle matrix.
C> CA Axial force coefficients.
Cj-. CMT Pitching moment coefficients
Cty CN Normal force coefficient. d 01 Diameter cf flare (ft.) D DRAG Drag (lb.) g G Gravity (ft/sec.) h HA Altitude of flare above
sea level, (ft) h» HP Thickness of propellant (ft.) H.E,* H.E.PHI Euler angles of flare axes
azimuth, elevation and roll attitude taken In that order of rotation, (deg.)
HA,EA'fA Euler angles of aerodynamic axes azimuth elevation and roll attitude taken In that order of rotation (deg.)
HV,Y ♦,, Euler angles of velocity axes azimuth elevation and roll attitude taken In that order of rotation (deg.)
Ic AIS Moment of Inertia about spin Z axis, (slug ft2)
It AIT Moment of Inertia about trans- 1 verse X, Y axes, (slug ft2)
• Is OIS Rate of change Is (slug ft2/sec). • It DIT Rate of change of It (slug ft
2/sec). L ÄLIFT Lift (lb.) M AMASS Total mass (slugs)
N DM Mass flow rate )s1ugs) Mc CMASS Mass of the cup (slugs)
Mp BARMP Cross damping, pitching moment per unit roll rate, (ft.lb/rad/sec)
-196-
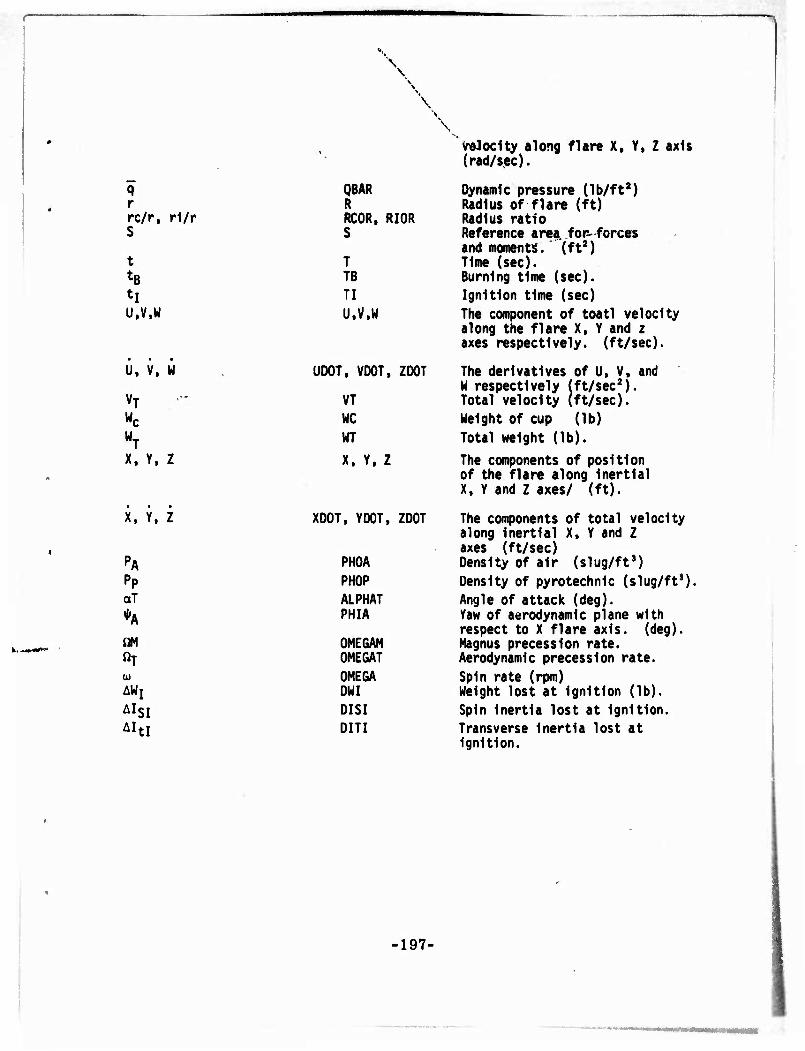
\ V
\
\
q r rc/r, rl/r S
t H ti u.v.w
U, V, w
VT
Wc WT X, Y, Z
X, Y. Z
PA
Pp aT
*A
ON "T to AWj
&ItI
QBAR R RCOR. RIOR S
T TB TI U.V.W
UDOT, VDOT, ZDOT
VT WC WT
X, Y, Z
XDOT, YDOT, ZDOT
PHOA PHOP ALPHAT PHI A
OMEGAM OMEGAT OMEGA DWI OISI DITI
Velocity along flare X, Y, Z axis (rad/sec).
Dynamic pressure (lb/ft2) Radius of flare (ft) Radius ratio Reference area for-forces and moments, (ft2) Time (sec). Burning time (sec). Ignition time (sec) The component of toatl velocity along the flare X, Y and z axes respectively, (ft/sec).
The derivatives of U, V, and W respectively (ft/sec2). Total velocity (ft/sec). Weight of cup (lb) Total weight (lb).
The components of position of the flare along Inertlal X, Y and Z axes/ (ft).
The components of total velocity along Inertlal X, Y and Z axes (ft/sec) Density of air (slug/ft3) Density of pyrotechnic (slug/ft3). Angle of attack (deg). Yaw of aerodynamic plane with respect to X flare axis. (deg). Magnus precession rate. Aerodynamic precession rate. Spin rate (rpm) Weight lost at Ignition (lb). Spin Inertia lost at Ignition. Transverse Inertia lost at Ignition.
-197-
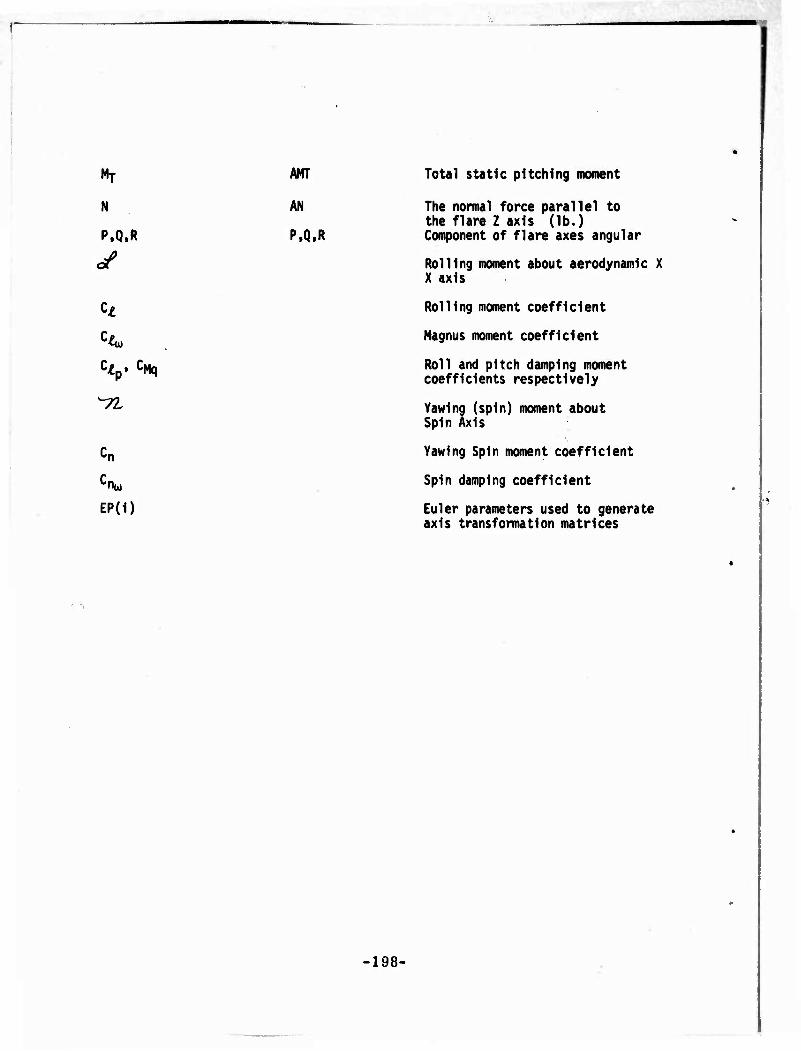
wmm
Mj ANT Total static pitching moment
N AN The normal force parallel to the flare Z axis (lb.)
P.Q.R P.Q.R Component of flare axes angular
oT Rolling moment about aerodynamic X X axis
C^ Rolling moment coefficient
C^ Magnus moment coefficient
Cg , C^q Roll and pitch damping moment P coefficients respectively
^2. Yawing (spin) moment about Spin Axis
Cn Yawing Spin moment coefficient
CnüJ Spin damping coefficient
EP(1) Euler parameters used to generate axis transformation matrices
-198-
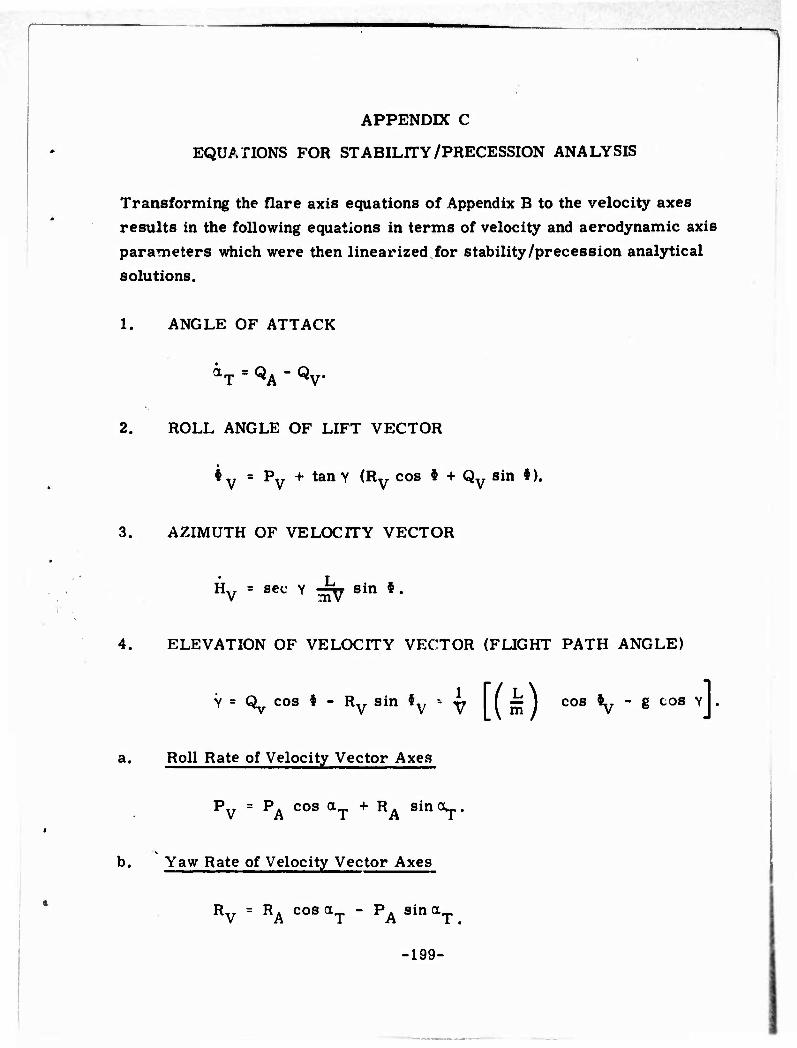
APPENDIX C
EQUATIONS FOR STABILITY/PRECESSION ANALYSIS
Transforming the flare axis equations of Appendix B to the velocity axes results in the following equations in terms of velocity and aerodynamic axis
parameters which were then linearized for stability/precession analytical
solutions.
1. ANGLE OF ATTACK
aT = QA - Qv.
2. ROLL ANGLE OF LIFT VECTOR
♦ v = Pv + tan Y (Ry cos * + Qv sin *).
3. AZIMUTH OF VELOCITY VECTOR
T
H., = sec Y =W sin * V mV
4. ELEVATION OF VELOCITY VECTOR (FLIGHT PATH ANGLE)
Y = Qv cos * - Rv sin *v v [(k) co8 V -g^v]. a. Roll Rate of Velocity Vector Axes
Pv = PA cos aT + RA sina^j.
b. Yaw Rate of Velocity Vector Axes
Rv = RA cos aT - PA sin aT
-199-
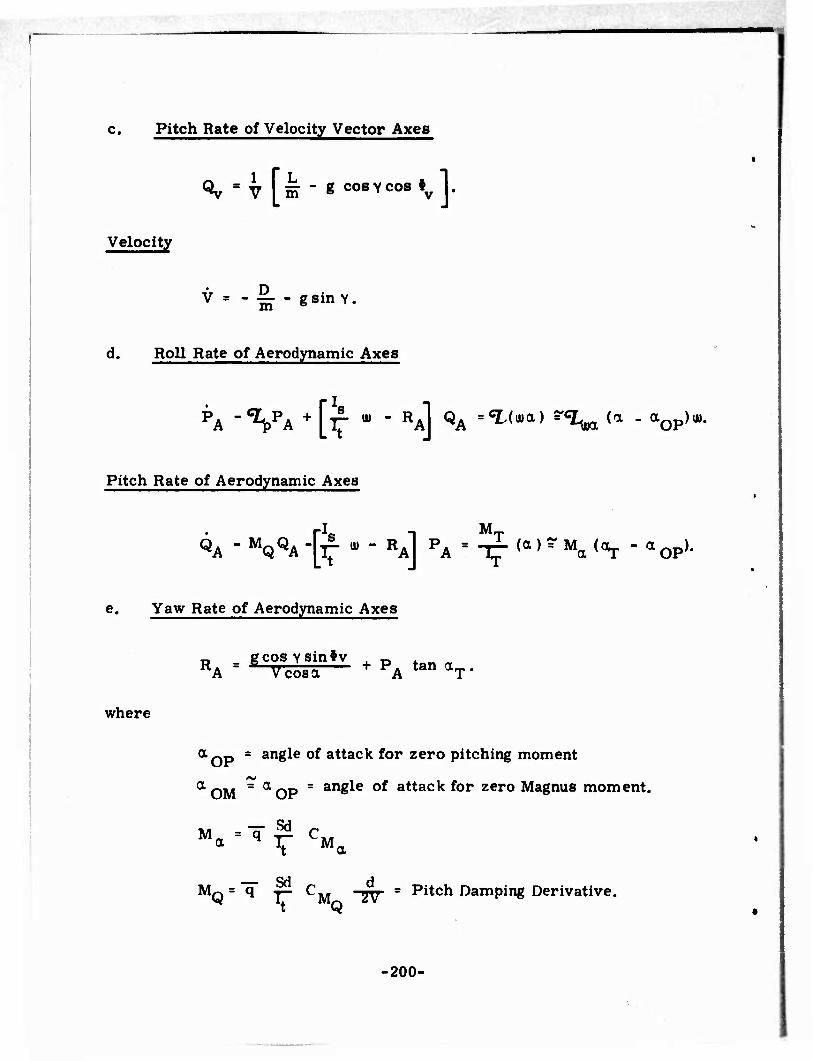
c. Pitch Rate of Velocity Vector Axes
Qv = V [HT _ ß COSYCOS »v 1.
Velocity
v ■ - |r - ßsinY-
d. Roll Rate of Aerodynamic Axes
^A " VA + [if '" ' R
A] «A =^
<U"1) ?%« <a - »OP'«-
Pitch Rate of Aerodynamic Axes
«A - MQQA "[^ » " «A] PA = ^ <a ' ? Ma <»r - "OP'"
e. Yaw Rate of Aerodynamic Axes
gcos YSin*v n RA = S Vcosa + PA tan aT
where
aOP = an^e 0^ attack ^or zero pitching moment
aOM * aOP = anSle 0^ attack ^or zero Magnus moment.
a V Ma
MQ = q -— CM -jy = Pitch Damping Derivative, t Q
-200-
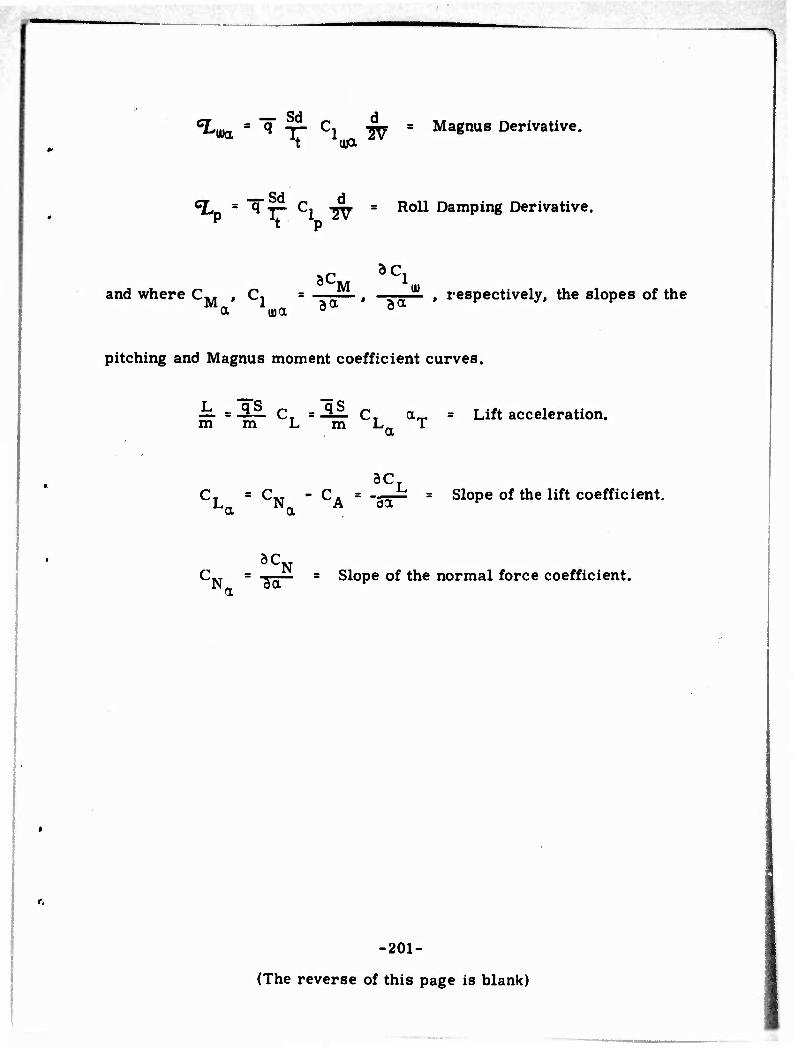
GLm = ^ 7- ci "gy = Magnus Derivative.
^ = q T~ Cl W = Ro11 DamPing Derivative, t p
and where C,, , C, —— ac 3ci
aa , respectively, the slopes of the
pitching and Magnus moment coefficient curves.
L =3$. c m m L
= ^1 C a m CLa aT Lift acceleration.
9C]
ex a Slope of the lift coefficient.
CN = ^ = Slope of the normal force coefficient. 1
-201-
(The reverse of this page is blank)
APPENDIX D
TYPICAL CONFIGURATION DATA INPUT FOR
TRAJECTORY SIMULATION
203-

1. TYPICAL GEOMETRIC AND INERTIA DATA
Diameter, d: As applicable
Thickness, hp: Flares, 2 in, others as applicable
Pyrotechnic Density, Op'. 2.86 slugs per cubic feet
Case Weight, W : Live, 0. 5 pound; inert, 0.
hiitial Pyrotechnic Weight, Wp^: Live, Actual/intended; Inert, Total Weight (used 5 pounds förnB inch flare, 12 pounds for 12 iach flare, etc. ).
Burning Time, t: Live, as desired; Inert, any finite constant >0.
Ignition Delay Time, t,: Live, as desired; Inert, any arbitrary number > flight time.
Weight Dropped at Ignition, AW.: As required, usually used 0.
Thrust, T: As desired.
204-
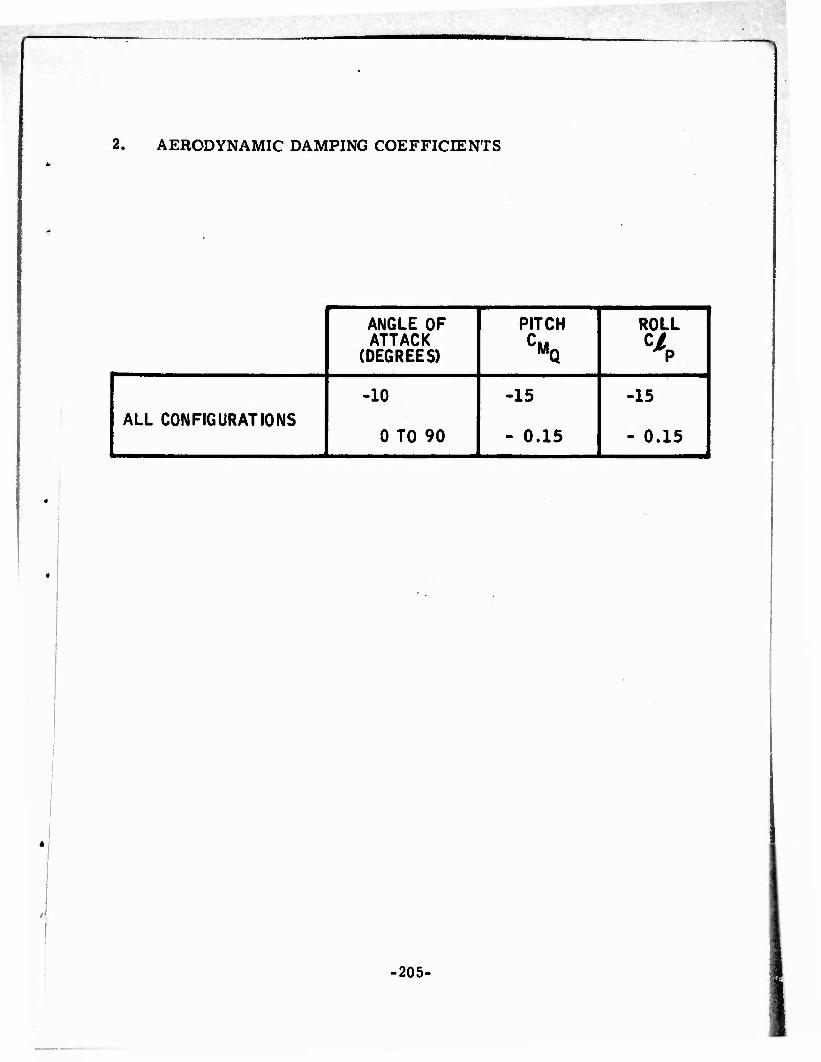
2. AERODYNAMIC DAMPING COEFFICIENTS
ANGLE OF ATTACK
(DEGREES)
PITCH CMQ
ROLL
ALL CONFIGURATIONS -10
0 TO 90
-15
- 0.15
-15
- 0.15
205-
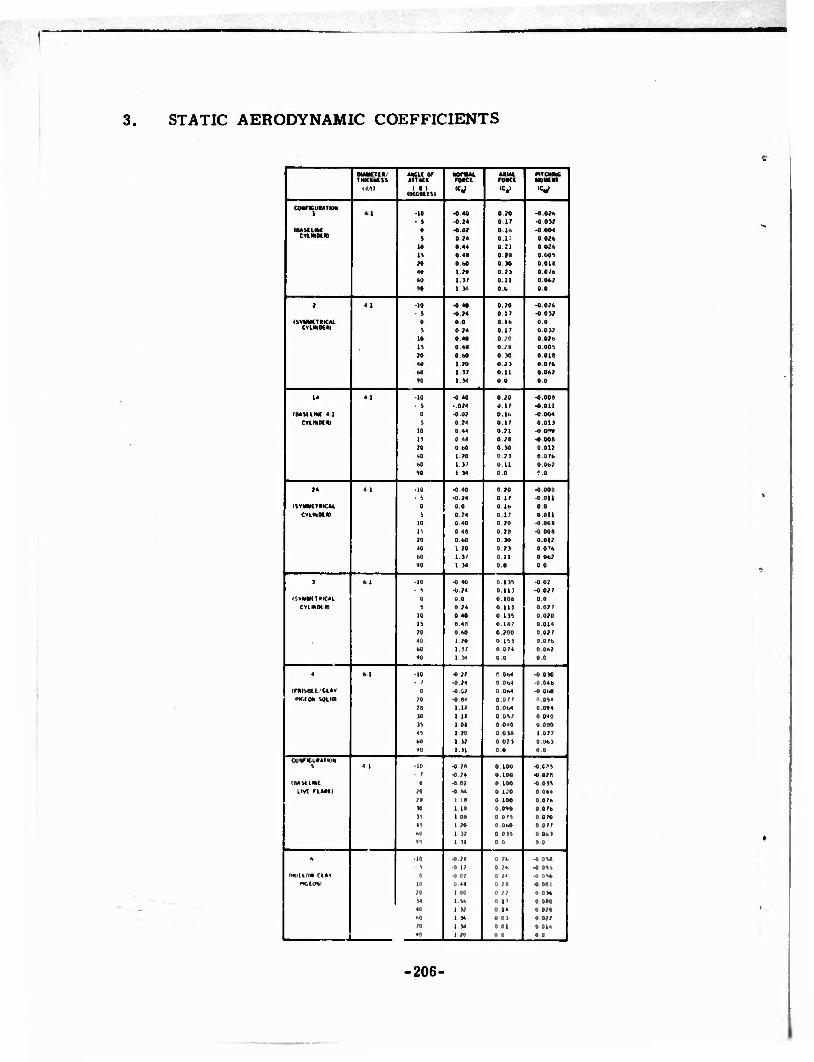
3. STATIC AERODYNAMIC COEFFICIENTS
MMCtM/ THKMCSS
«*CU OF ATTACK
MonM. FMCt x& nrcMMC
MOW NT (Ml 1 • 1
(PLCMESt «rf **' 'V
CMFICuRATim 41 •10 •«M 0.» -0.026
- 4 •0.24 0 17 -0 037
IVULMC cvtmocm
0 •O 02
024
0 I«
•.tl -0 004
0.026
10 0 44 «.21 0 026
1% 0-4« oia 0.004
M 0.60 0.» 0.016
40 1.20 0.7) 0.076
60 1.37 0.11 0 062
n 1 34 M 0.0
1 4 1 -10 -0 40 0.20 -0.026
- 5 -0.24 0 17 •0 0 32
(4VIII«T)IICAl Wamm
0
5
0.0
o M 0 16
Ml 0.0
0.032
10 0 40 0.20 0 026
U 0.4B o.;e 0.004
20 Ml 0 30 0 018
40 1.20 0.2) 0.076
M 13' 0 11 0.06?
H 1.34 0.0 0.0
u 4 1 ■10 -0 40 0.20 -0,008 i
■ 5 -.024 9.11 -0.011
(BASlLMt 4 1 0 -0.02 o.to -0.004
CVIMH» 4 0.24 0.17 0.013
10 0.44 0.21 -0 on* IS 0.48 0.21 -0 008
?0 O.bO 0 w 0.012
*0 1 ?0 0.25 0 0 76
II 1.3' U.tl 0 067
N 1 34 0 0 r.o
7* 4 1 -10 -0 40 0.20 -0 008 - 5 -0.24 0 17 -o on
(SvMMlTBiCn 0 0.0 O.lt 0 0
cvtwot» i 0.24 0 17 0.011
10 0.40 0,20 -0.008
is 0 48 0.28 -0 008
H 0 60 t.M 0.017
40 1 70 0.2) 0.076
M 1.37 0 11 0 067
H 1 34 0.0 0 0
3 h 1 -10 -0 40 0.1» •002 - •» -0 24 0.11) -0 027
rSvMWITRtCAl 0 t.l 0.106 o.o Cvl»«« s 0 ?4 0 11) 0.027
10 0 40 0.1» 0 020
14 0.48 0 107 0.014
?0 0 60 0 200 0.027
40 1 20 O.D) 0 0 76
M 1 37 0 074 0.062
vo 1 W 0 0 0 0
4 t 1 ■10 ■0 ?f .0« -0 0 30 - ; -0 24 0 064 -0.046
MMU/CUV 0 -0.C2 O.OM -0 060 PKIOM S(tiiP /o -0 84 0.077 n 044
N I.U O.OM 0.044
N 1.18 0.047 0 OVO
)% 1 OB 0 040 0 OBO I AS 1 20 0 0 3« 1 077
M 1 37 0 073 0 063
«0 1.31 0.0 0 0
CrWK.i ■Mi,.«, 4 1 >M -0 7« 0 100 -o m
. f ■0 74 0.100 -0 028
IMSUNil 0 -0 07 0 100 -0 0 34
Kvf n*ti} ^0 ■0 M 0 170 0 044
n 1 IB 0 100 0 076 ■ 1 11 O.OVD 0 076 is 1 OB 0 074 0 070 4S 1 70 0 060 0 077
*.Ü 1 17 0 014 0 063
H 1 11 0 0 0 0
„ ■10 -O.Jfl -0 048
0 |f 0 N -0 OSS
■KIWI Cl«* 0 -0 07 0 7». 0 0M> PXilO») 10 0 44 0 78 * OOR
n 1 00 0 77 0 OH H 1 M 0 17 0 080
40 1 17 0 14 0 02B
M 1 36 0 03 0 022 70 1 M 0 01 0 016
1 i 1 H> 0 D 0 0
-206-
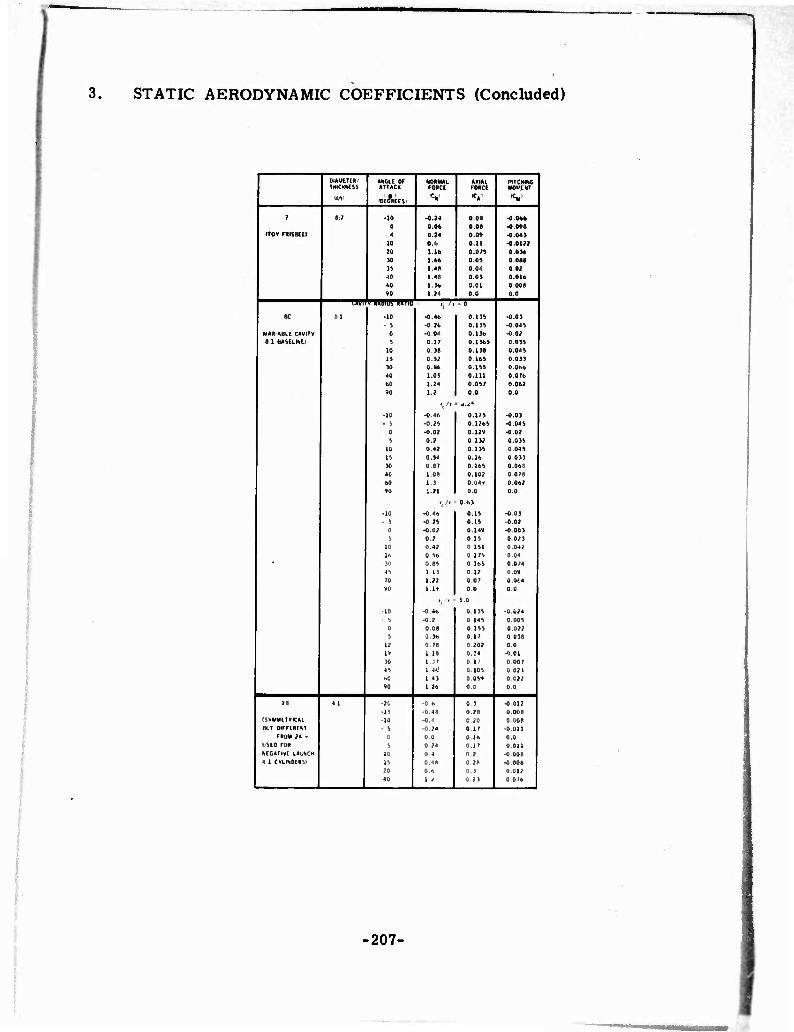
1 3. STATIC AERODYNAMIC COEFFICIENTS (Concluded)
1 DIAMETER 1 AMCU or NORMAl \ AXIAl mcMiNc THICKHESS ATTACK FORCE FORCE MOMENT
IM) OEAEES ! v ,C* I 'CM: j
| 7 B;7 •10 -0.24 0 08 -0.066
0 0.06 0.08 -0,098 1 (TOY miSBU) 4 0.24 j 0.09 •0.043
i 10 O.t, | 0.11 I -0.0122
?0 Lib 0.075 0.036
30 1.6*. 0.05 | 0.088
55 1.4* 0.04 0.02 1
40 1.48 0.03 0.01b
M 1.3«, 0.01 0.008
«0 | 1.24 0.0 0.0 j
rWTO^rrni '. ^ - o ■"
! 8C 8 1 -10 -0.46 0.135 -0.03
- 5 -0.26 0.135 -0.045
1 WAR ABLE. CAVITY 0 -0.04 0.136 -0,02 8 1 KAULIM , 5 ■ 0.17 0.1365 0.035
10 0.38 0.138 0.045
1^ 0.52 0 165 0.033
30 0.66 0.155 0.066
40 1.05 0.111 0.076
fcO 1.24 0.057 0.062
90 I.I 0.0 0.0
-10 -0.46 0.125 -0.03
- 5 -0.25 0.1265 -0.045
0 -0.02 0.129 -0.02
5 0.2 0 132 0.035
10 0.42 0.135 0.045
15 0.54 U.16 0.033
30 0.87 0.165 0.068
40 1.08 0.102 0.078
60 1.3 0.049 0.062
vo :.?i 0.0
0.63
o.o !
-10 -0.46 0.15 -0.03 j! - 5 -0 25 0.15 -0.02 |
0 •0.02 0149 -0.003
5 0.2 0 15 0.023
10 0.42 0 151 0.042
lh 0 56 0175 0.04
30 0.85 0 165 0.074 j
4') 1 13 | 0.12 0,09
70 1-22 0 07 1 0.064 {I
90 1 19 0.0
1.0
0.135
0-0 1
-10 -0 46 ■0.024
■ b -0.2 i 0 145 0.005
0 O.OB 0.155 0.022 1 b B.M 0.17 0.038 |
1? 0.78 0 202 0.0
19 1 18 O.M -O.01
30 l.JI 0.17 ' 0.00 7
4S 1 4*} 0105 0.024
M 1 43 0 059 0.022
90 1 26 0 0 o.o ij
?e 1 • 1 1 -?t -O.h 0 1 -0 012 i.
-IS •0.48 0.28 0.008 (SVHH(TIIICAL -10 -0.4 0.20 0 008 BLT HKf (H^T • •> -0.24 0.17 -0.011
moH .'« - 0 0.0 0 16 0.0
usio FOR s ! 0.24 ' 0.17 j 0.011 NECATItfl IAUIICH 10 0 4 0.2 1 -0 008 [ 4 1 CVKfiDfRSI ll 0.48 0.28 -0 008 |
?0 ' 0 h 0.3 0.012 , .. , 1 i 0.23 0.0 76
-207-