suspended education suspended education - southern poverty
TRANSCRIPT
Suspended EducationUrban Middle Schools in CrisisBy Daniel J. Losen and Russell J. Skiba
Suspended EducationUrban Middle Schools in CrisisBy Daniel J. Losen and Russell J. Skiba
Suspended EducationUrban Middle Schools in CrisisDaniel J. Losen, J.D.Senior Education Law and Policy AssociateThe Civil Rights Project at UCLA
Russell Skiba, Ph.D.DirectorThe Equity Project, Center for Evaluation and Education Policy, Indiana University
AcknowledgementsThe authors express their gratitude to the Southern Poverty Law Center for editing, designing, and publishing this report, particularly SPLC attorney Marion Chartoff for her valuable editorial assistance and Russell Estes and Crystal Jeffers for designing the report. Former SPLC attorney Matthew Cregor also provided vital assistance during the editorial process. The authors are deeply grateful to the Poverty and Race Research Action Council and the Annie E. Casey Foundation for funding this research. The Civil Rights Project at UCLA, the Center for Evaluation and Education Policy at Indiana University, and the Charles Hamilton Houston Institute for Race and Justice at Harvard Law School also provided valuable support and administration of the project. Last but not least, the authors extend their thanks to Tami Wilson and Anthony Crowe for their tireless research assistance, and to Dr. Robin Hughes, Department of Higher Education and Student Affairs at Indiana University-Indianapolis, and Rebecca Fitch, U.S. Department of Education Office for Civil Rights, for providing technical assistance.
INTRODUCTION
2 /// SUSPENDED EDUCATION
IntroductionSince the early 1970s, out-of-school suspension rates have escalated dramatically. In part, the higher use of out-of-school suspension reflects the growth of policies such as “zero tolerance,” an approach to school discipline that imposes removal from school for a broad array of school code violations - from violent behavior to truancy and dress code violations.
There is no question that teachers and principals must use all effective means at their disposal to maintain safety and to provide the most effective learning environments practicable. There is controversy, however, about the means to this end. The advent of harsher approaches has resulted in a deeply divided national debate on school discipline. Supporters of zero tolerance offer a host of reasons why frequent resort to out-of-school suspension is critical for maintaining order and discipline in our schools.1 While the philosophy and practice of zero tolerance has led to increases in the use of suspension and expulsion, recent examinations (e.g., APA, 2008; Skiba & Rausch, 2006) have raised serious questions about both the effectiveness and fairness of such strategies.
Some have argued that suspensions remove disorderly students and deter other students from misbehaving, thereby improving the school environment so that well-behaving students can learn without distractions (Ewing, 2000). Yet, despite nearly two decades of implementation of zero tolerance disciplinary policies and their application to mundane and non-violent misbehavior, there is no evidence that frequent reliance on removing misbehaving students improves school safety or student behavior (APA, 2008). Because suspended students miss instructional time, frequent use of out-of-school suspension also reduces students’ opportunity to learn.
In order to better understand the issues of efficacy and fairness in the use of out-of-school suspension, we first must answer two questions: How frequently is suspension being used in our schools? Are there significant differences in the frequency of suspension when we look at subgroups of children by race/ethnicity and gender? This report is designed to help answer these questions.
The INCRease IN sUspeNsIONs aND The RaCIal DIsCIplINe Gap Concerns about lost instructional time, as well as other possible harmful side effects from suspension, are amplified by consistent findings that African-American and Latino youth are over-represented in school suspensions and that the increased use of suspension has been largest for poor and minority children.A review of national suspension rates since the early 70’s for K-12 public schools reveals a substantial increase in the use of suspension for students of all races, as well as a concomitant increase in the racial discipline gap.
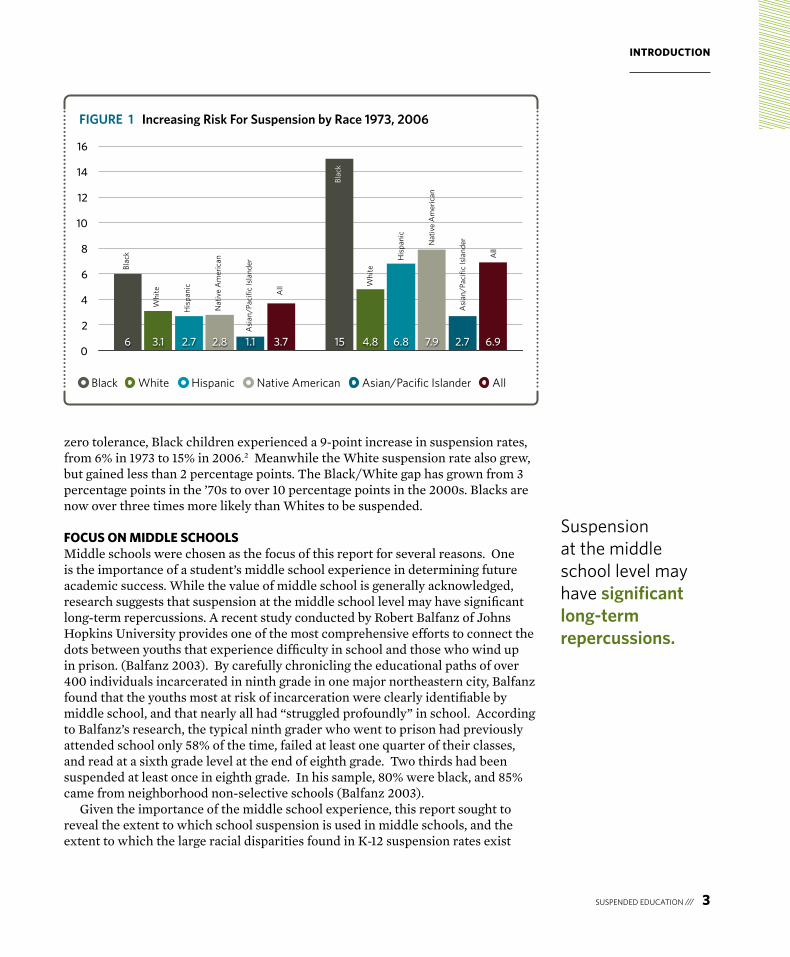
Figure 1 demonstrates that K-12 suspension rates have at least doubled since the early ’70s for all non-Whites. Equally noteworthy are the substantially different suspension rate increases experienced by racial/ethnic groups. The racial gap in suspension has grown considerably since 1973, especially for African-American students. In the 1970s Black students had a suspension rate of about 6% - twice the likelihood of suspension as White students (about 3%). With the advent of
There is no evidence that frequent reliance on removing misbehaving students improves school safety or student behavior.
INTRODUCTION
SUSPENDED EDUCATION /// 3
Suspension at the middle school level may have significant long-term repercussions.
zero tolerance, Black children experienced a 9-point increase in suspension rates, from 6% in 1973 to 15% in 2006.2 Meanwhile the White suspension rate also grew, but gained less than 2 percentage points. The Black/White gap has grown from 3 percentage points in the ’70s to over 10 percentage points in the 2000s. Blacks are now over three times more likely than Whites to be suspended.
FOCUs ON MIDDle sChOOls Middle schools were chosen as the focus of this report for several reasons. One is the importance of a student’s middle school experience in determining future academic success. While the value of middle school is generally acknowledged, research suggests that suspension at the middle school level may have significant long-term repercussions. A recent study conducted by Robert Balfanz of Johns Hopkins University provides one of the most comprehensive efforts to connect the dots between youths that experience difficulty in school and those who wind up in prison. (Balfanz 2003). By carefully chronicling the educational paths of over 400 individuals incarcerated in ninth grade in one major northeastern city, Balfanz found that the youths most at risk of incarceration were clearly identifiable by middle school, and that nearly all had “struggled profoundly” in school. According to Balfanz’s research, the typical ninth grader who went to prison had previously attended school only 58% of the time, failed at least one quarter of their classes, and read at a sixth grade level at the end of eighth grade. Two thirds had been suspended at least once in eighth grade. In his sample, 80% were black, and 85% came from neighborhood non-selective schools (Balfanz 2003).
Given the importance of the middle school experience, this report sought to reveal the extent to which school suspension is used in middle schools, and the extent to which the large racial disparities found in K-12 suspension rates exist
Black White Hispanic AllNative American Asian/Pacific Islander
Figure 1 increasing risk For Suspension by race 1973, 2006Figure 1 increasing risk For Suspension by race 1973, 2006
0
2
4
6
8
10
12
14
16
1973 2006
6.93.7 2.71.1 7.92.8 6.82.7 4.83.1 156
Blac
k
Blac
k
Whi
te
Whi
te
His
pani
c
His
pani
c
Nat
ive
Am
eric
an
Nat
ive
Am
eric
an
Asi
an/P
acifi
c Is
land
er
Asi
an/P
acifi
c Is
land
er
All
All
DaTa sOURCes aND MeThODOlOGY
4 /// SUSPENDED EDUCATION
at the middle school level. Unfortunately, although some middle school data are collected or reported by school, there are no aggregate public reports on discipline (covering all states) that break down the data by elementary, middle and high school levels. Nor is the federally collected discipline data publicly reported by grade level. Instead, when the U.S. Department of Education reports school disciplinary data, the only report it publishes on its website combines elementary school suspensions together with those of middle and high schools. Our analysis suggests this reporting practice has unintentionally masked consistently higher rates of suspension at both the middle and high school level. Earlier analysis of sets of individually reported high school and middle school data in Florida suggested that middle school suspension rates tended to be higher than high school rates (Florida State Department of Education, 1995; Raffaele Mendez & Knoff, 2003). Therefore, our decision to focus this report on middle schools grew out of our realization that many educators and policymakers were unaware of the high rates of out-of-school suspension at the secondary level - especially for students of color attending middle schools.3
Data sources and MethodologyThis report analyzes school- and district-level suspension data from the Elementary and Secondary Education Civil Rights Compliance Survey from the U.S. Department of Education Office for Civil Rights (OCR). The survey is more commonly referred to as the Civil Rights Data Collection (CRDC). The CRDC is conducted biennially in every state, and includes school-level data on out-of-school suspensions from approximately one-third of the nation’s school districts. The survey instrument also collects racial and gender enrollment data.
The civil rights compliance survey explicitly requires that schools do not report the number of suspensions (incidents), but instead report the number of students suspended at least one time during the surveyed school year. Therefore, the data represent how many students were suspended, but do not represent how many suspensions were meted out. Because many students are suspended more than once in a given year, the data should be regarded as a conservative estimate of the frequency of the use of suspension by a given school or district, or experienced by a given racial/ethnic group.
Analytical Tools. The central statistic used in this report is the risk index, which represents the percentage of a given group suspended in a single school year. To calculate the risk index, one divides the number of students in a given group (e.g., Hispanic) suspended at least once by the total enrollment for that group. The result is an estimate of the risk for suspension.
Levels of Analysis. Unlike most data reported by state educational agencies, OCR’s data can be disaggregated by race and gender, not only for states and school districts, but for individual schools as well. Using the school-level data set, estimates were made of the risk of suspension in approximately 9,220 middle schools from every state in the nation. This large sample was not “weighted” and is therefore not presented as a projected estimate of a national middle school suspension rate. Using the CRDC, this report also provides a more detailed analysis of patterns and trends
FINDINGs
SUSPENDED EDUCATION /// 5
in middle school suspension risk for 18 of the nation’s largest school districts. (For more information on the OCR data, see Appendix 3: Issues in Using U.S. Department of Education Office for Civil Rights Compliance Survey Data on page 19).
District Selection. This report highlights the use of suspension by middle schools in 18 of the nation’s largest school districts to provide a clear picture of middle school disciplinary practices in large urban districts. The districts were selected in an attempt to capture both diverse regional representation and trends in suspension use over time - only districts that had data for two CRDC surveys (2002 and 2006) were included.
Specifically, this report analyzes suspension rates derived from the CRDC in middle schools within each of the following 18 urban school districts: Los Angeles, CA; Denver, CO; Hartford, CT; Miami-Dade, FL; Palm Beach, FL; Atlanta, GA; Indianapolis, IN; Des Moines, IA; Springfield, MA; Baltimore, MD; Jackson, MS; Charlotte, NC; Providence, RI; Dallas, TX; Houston, TX; San Antonio, TX; Seattle, WA; and Milwaukee, WI.
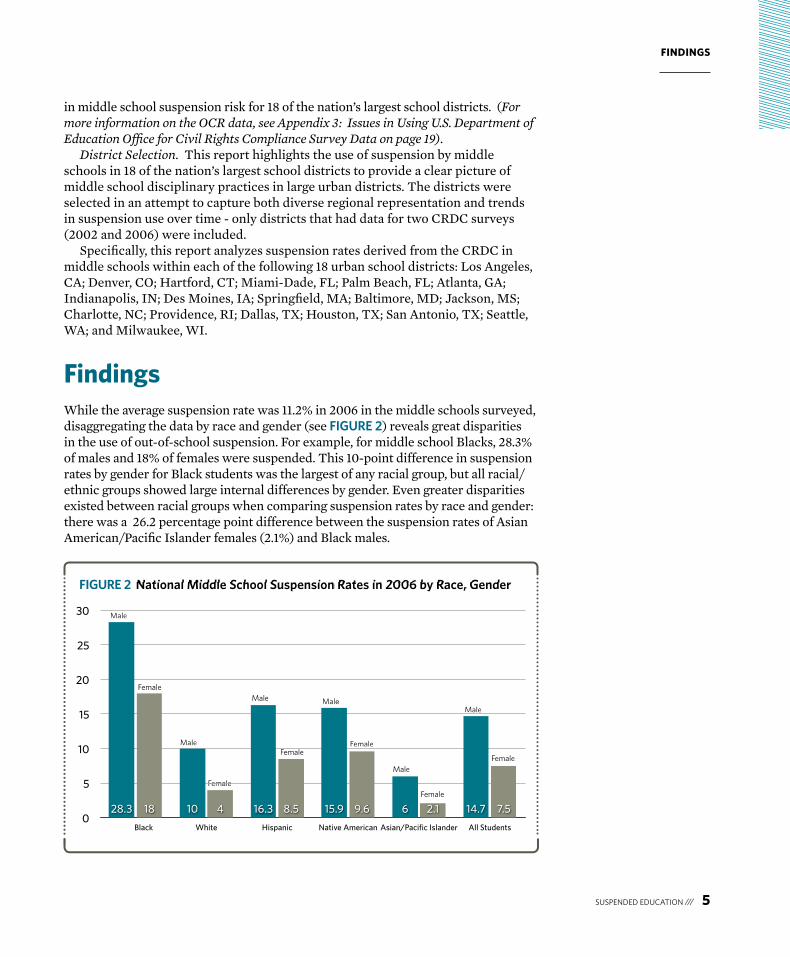
FindingsWhile the average suspension rate was 11.2% in 2006 in the middle schools surveyed, disaggregating the data by race and gender (see Figure 2) reveals great disparities in the use of out-of-school suspension. For example, for middle school Blacks, 28.3% of males and 18% of females were suspended. This 10-point difference in suspension rates by gender for Black students was the largest of any racial group, but all racial/ethnic groups showed large internal differences by gender. Even greater disparities existed between racial groups when comparing suspension rates by race and gender: there was a 26.2 percentage point difference between the suspension rates of Asian American/Pacific Islander females (2.1%) and Black males.
Figure 2 National Middle School Suspension rates in 2006 by race, gender
Male
Male
Male Male
Male
Male
Female
Female
FemaleFemale
Female
Female
Figure 2 National Middle School Suspension rates in 2006 by race, gender
Male
Male
Male Male
Male
Male
Female
Female
FemaleFemale
Female
Female
0
5
10
15
20
25
30
Black White Hispanic Native American Asian/Pacific Islander All Students
7.52.19.68.5418 14.7615.916.31028.3
FINDINGs
6 /// SUSPENDED EDUCATION
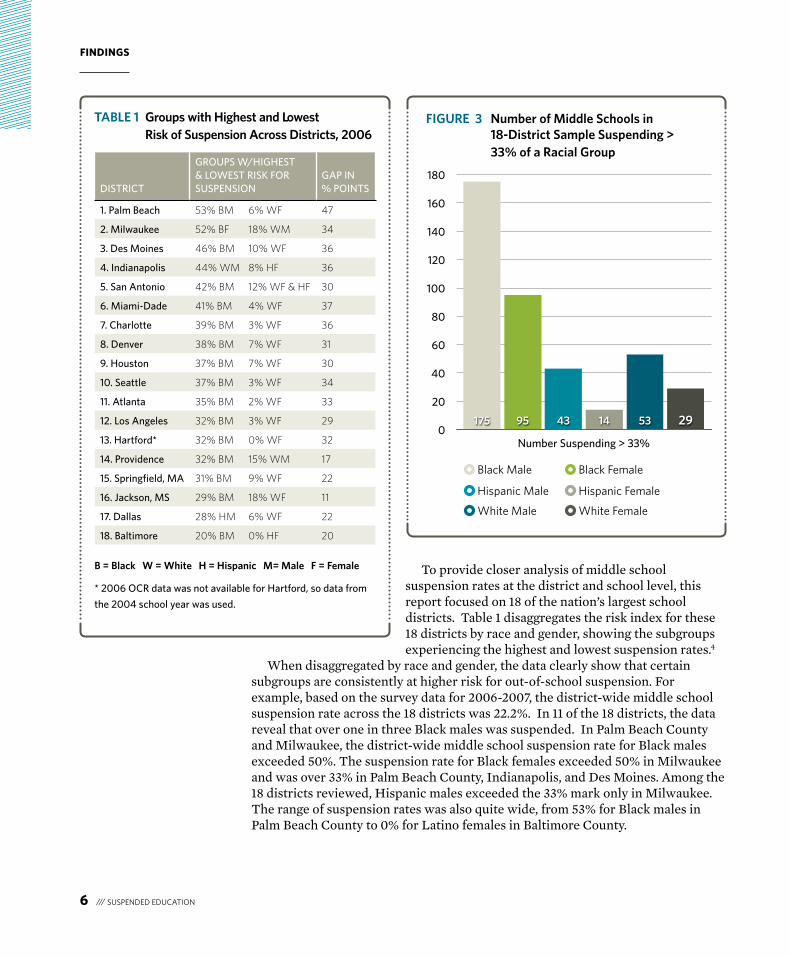
To provide closer analysis of middle school suspension rates at the district and school level, this report focused on 18 of the nation’s largest school districts. Table 1 disaggregates the risk index for these 18 districts by race and gender, showing the subgroups experiencing the highest and lowest suspension rates.4
When disaggregated by race and gender, the data clearly show that certain subgroups are consistently at higher risk for out-of-school suspension. For example, based on the survey data for 2006-2007, the district-wide middle school suspension rate across the 18 districts was 22.2%. In 11 of the 18 districts, the data reveal that over one in three Black males was suspended. In Palm Beach County and Milwaukee, the district-wide middle school suspension rate for Black males exceeded 50%. The suspension rate for Black females exceeded 50% in Milwaukee and was over 33% in Palm Beach County, Indianapolis, and Des Moines. Among the 18 districts reviewed, Hispanic males exceeded the 33% mark only in Milwaukee. The range of suspension rates was also quite wide, from 53% for Black males in Palm Beach County to 0% for Latino females in Baltimore County.
TAble 1 groups with Highest and lowest risk of Suspension Across Districts, 2006
b = black W = White H = Hispanic M= Male F = Female
* 2006 OCR data was not available for Hartford, so data from
the 2004 school year was used.
Black Male Black Female
Hispanic Male Hispanic Female
White Male White Female
Figure 3 Number of Middle Schools in 18-District Sample Suspending > 33% of a racial group
distRiCt
GROUPs W/HiGHEst & LOWEst RisK FOR sUsPENsiON
GAP iN % POiNts
1. Palm Beach 53% BM 6% WF 47
2. Milwaukee 52% BF 18% WM 34
3. des Moines 46% BM 10% WF 36
4. indianapolis 44% WM 8% HF 36
5. san Antonio 42% BM 12% WF & HF 30
6. Miami-dade 41% BM 4% WF 37
7. Charlotte 39% BM 3% WF 36
8. denver 38% BM 7% WF 31
9. Houston 37% BM 7% WF 30
10. seattle 37% BM 3% WF 34
11. Atlanta 35% BM 2% WF 33
12. Los Angeles 32% BM 3% WF 29
13. Hartford* 32% BM 0% WF 32
14. Providence 32% BM 15% WM 17
15. springfield, MA 31% BM 9% WF 22
16. Jackson, Ms 29% BM 18% WF 11
17. dallas 28% HM 6% WF 22
18. Baltimore 20% BM 0% HF 20
33% of a racial group
0
20
40
60
80
100
120
140
160
180
Number Suspending > 33%
2953144395175
FINDINGs
SUSPENDED EDUCATION /// 7
sChOOl level ResUlTsWhen the data from the 18 districts was analyzed at the individual school level, we found that rates of suspension were far higher in some schools than in others. Most of the districts had several schools that suspended more than 50% of a given racial/gender group. While high suspension rates for Black males and females were common across these districts, we also found instances of schools that suspended more than 50% of White and Hispanic females.
The school-level data (see Figure 3) shows that middle schools with extraordinarily high suspension rates are not uncommon. The graph represents the total number of middle schools in the 18 districts that have suspension rates of over 33% for various subgroups.
Of the 175 schools suspending more than 33% of the Black males enrolled, 84 were suspending Black males at a rate of at least 50%. The 50% mark was also met or exceeded by 31 schools for Black Females, 13 schools for Hispanic males; 2 schools for Hispanic females; 22 schools for White males and 18 schools for White Females.
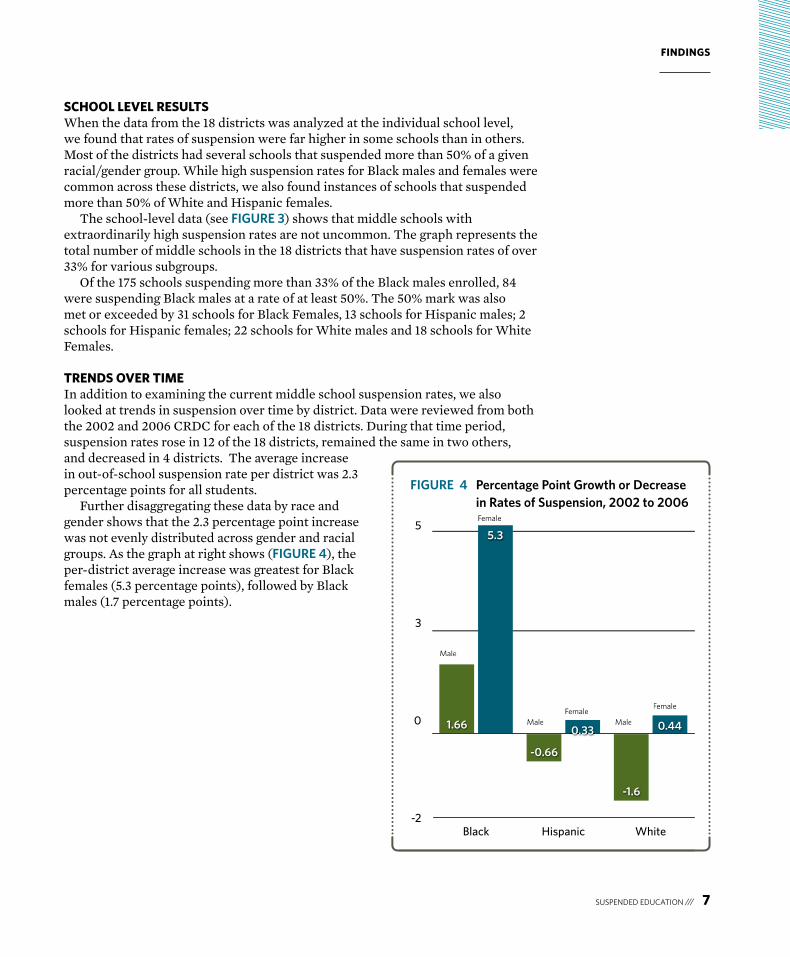
TReNDs OveR TIMeIn addition to examining the current middle school suspension rates, we also looked at trends in suspension over time by district. Data were reviewed from both the 2002 and 2006 CRDC for each of the 18 districts. During that time period, suspension rates rose in 12 of the 18 districts, remained the same in two others, and decreased in 4 districts. The average increase in out-of-school suspension rate per district was 2.3 percentage points for all students.
Further disaggregating these data by race and gender shows that the 2.3 percentage point increase was not evenly distributed across gender and racial groups. As the graph at right shows (Figure 4), the per-district average increase was greatest for Black females (5.3 percentage points), followed by Black males (1.7 percentage points).
Figure 4 Percentage Point growth or Decrease in rates of Suspension, 2002 to 2006
Male
Male Male
Female
FemaleFemale
in rates of Suspension, 2002 to 2006
Male
Female
Male MaleFemale
Female
-2
0
3
5
Black Hispanic White
0.440.33
5.3
-1.6
-0.66
1.66
DIsCUssION
8 /// SUSPENDED EDUCATION
DiscussionThe high and disproportionate suspension rates being experienced by youth of color in most of these urban districts means that minority students are being removed from the opportunity to learn at a much higher rate than their peers. Because the OCR survey does not measure the overall number of suspensions, but rather the number of students suspended at least once, these data likely underestimate the frequency of the use of suspension and the amount of instructional time these students lose. Given the importance of the instructional time in predicting achievement outcomes (Greenwood, Horton, & Utley, 2002; Wang, Haertel, & Walberg, 1997), one might argue that concerns about high suspension rates should be treated with the same level of concern often expressed for low test scores, poor attendance, and high dropout rates.
Although the 18 school districts reviewed were not a randomly selected sample, the size and demographic scope of the sample also suggest that resorting to disciplinary removal from school is a deepening problem in urban middle schools across the country. It is critical to note that schools with very high suspension rates (e.g., suspending one-third or more of the student body at least once) are not receiving the kind of public attention or regular exposure that schools with low test scores receive.
The extreme disparities along racial and gender lines - especially the pronounced differences for Black males - also raise difficult questions as to what may cause these race/gender disparities. Although we did not perform a regression analysis, it seems unlikely that poverty could sufficiently explain the gender and racial differences in these current data. For example, if we assume that Black and Hispanic poverty rates are similar in these districts (as they are nationally), and if we assume that Black males and females have similar exposure to poverty, it becomes difficult to explain why suspension rates are so much higher for Black males than for both Hispanic males and Black females. Furthermore, previous research (Skiba et al., 2002; Wallace et al, 2009, APA 2008) has consistently found that racial/ethnic disproportionality in discipline persists even when poverty and other demographic factors are controlled.
As to gender disparities, the sample showed males of each racial group were consistently at greater risk for suspension. Yet gender differences in this sample were far less salient than differences in suspension due to race. For example, we found suspension rates were consistently higher for Black females than for Hispanic or White males.
The profound race- and gender-based disparities found throughout the sample — most dramatically at the school level — raise important questions about both the condition of education in our urban middle schools and the possibility of conscious or unconscious racial and gender biases at the school level. Educators and policymakers should be concerned about the harms that overuse of suspension can cause to students and their academic careers. Where the data suggest that certain racial/gender groups are at far greater risk, the potential harm from harsh discipline policies becomes a civil rights issue as well.
As stated at the outset, the heart of the issue is not whether students should
Concerns about high suspension rates should be treated with the same level of concern often expressed for lowtest scores, poor attendance, and high dropout rates.
DIsCUssION
SUSPENDED EDUCATION /// 9
ever be suspended, but whether frequent suspension is an effective disciplinary tool that can aid schools in achieving the goal of a safe and productive educational environment. High rates of suspension, and even apparent race and gender disparities, would not be as problematic if research were to demonstrate that the frequent use of suspension compared to the costs, offered greater benefits in safety or improved instructional climate. As described in the next section, however, the research findings of the American Psychological Association (APA 2008 at p. 4) and others have consistently found otherwise. To provide additional context for the statistics discussed above, the remainder of this report reviews research on the efficacy of suspension as a means of improving learning for both suspended students and their classmates.
hOw Is sUspeNsION UseD? In reviewing studies of school discipline, it is clear that school suspension tends not to be reserved for serious or dangerous behaviors. Fights or physical aggression among students are consistently found to be among the most common reasons for suspension (Costenbader & Markson, 1994; Dupper & Bosch, 1996; Imich, 1994; Menacker, Hurwitz, & Weldon, 1994; Skiba et al., 1997; Stone, 1993). Yet the majority of offenses for which students are suspended appear to be non-violent, less disruptive offenses (Children’s Defense Fund, 1975; Raffaele Mendez & Knoff, 2003). After fighting, the most common offenses appear to be abusive language (Imich, 1994; Kaeser, 1979) and attendance issues such as cutting class, tardiness, and truancy (Kaeser, 1979; Morgan D’Atrio et al., 1996). Other common reasons for school suspension are disobedience and disrespect (Bain & MacPherson, 1990; Cooley, 1995; Raffaele Mendez & Knoff, 2003; Skiba et al., 1997), and general classroom disruption (Imich, 1994; Massachussetts Advocacy Center, 1986; Morgan D’Atrio et al., 1996; Rausch & Skiba, 2004a; Raffaele Mendez & Knoff, 2003), often framed as a “catch-all category” (Dupper & Bosch, 1996). In an analysis of out-of-school suspensions in a single state, Rausch and Skiba (2004a) reported that only 5% of all out-of-school suspensions were issued for disciplinary incidents that are typically considered serious or dangerous, such as possession of weapons or drugs. The remaining 95% of suspensions fell into two categories: disruptive behavior and other. Concluding a review of a national survey on the disciplinary practices of 35 school districts representing over a million students, Donald Stone wrote, “It appears clear that on reviewing the data to determine if the crime fits the punishment, the answer is no” (p. 367). These data seems consistent with Stone’s conclusion.
hOw eFFeCTIve Is sUspeNsION? In an era of accountability, federal legislation has called for schools to use only those interventions that are research-based and proven effective. As some educators highlight harsh discipline policies as a means to improving student achievement, such policies should be supported by research documenting their effectiveness. Suspension and expulsion could be judged as evidence-based if their use was shown to result in lower rates of disruptive or violent behavior among students, improvements in overall school safety or climate, higher graduation rates, or other gains in academic achievement, including gains for the suspended or expelled students.5
A study of one state showedthat only 5% of all out-of-school suspensions were issued for disciplinary incidents that are typically considered serious or dangerous, such as possession of weapons or drugs.
DIsCUssION
10 /// SUSPENDED EDUCATION
There are no data showing that out-of-school suspension or expulsion reduce rates of disruption or improve school climate; indeed, the available data suggest that, if anything, disciplinary removal appears to have negative effects on student outcomes and the learning climate (American Psychological Association, 2008). Longitudinal studies have shown that students suspended in sixth grade are more likely to receive office referrals or suspensions by eighth grade, prompting some researchers to conclude that suspension may act more as a reinforcer than a punisher for inappropriate behavior (Tobin, Sugai, & Colvin, 1998). In the long term, school suspension has been found to be a moderate-to-strong predictor of school dropout (Balfanz 2003), and may in some cases be used as a tool to “cleanse” the school of students who are perceived by school administrators as troublemakers (Bowditch, 1993). Other research raises doubts as to whether harsh school discipline has a deterrent value (Raffaele Mendez 2003).
Perhaps counter-intuitively, purging the school of misbehaving students does not appear to improve school climate. Schools with higher rates of school suspension have been found to pay significantly less attention to school climate and have lower ratings in academic quality and quality of school governance (Skiba & Rausch, 2006). Perhaps most importantly, emerging data indicate that schools with higher rates of school suspension and expulsion have poorer outcomes on standardized achievement tests, regardless of the economic level or demographics of their students. It is difficult to argue that disciplinary removals result in improvements to the school learning climate when schools with higher suspension and expulsion rates average lower test scores than do schools with lower suspension and expulsion rates.
At least some of the variability in schools’ rates of out-of-school suspension and expulsion appear to be attributable to differences in principal attitudes towards the disciplinary process. The national report, Opportunities Suspended (Advancement Project/Civil Rights Project, 2000), suggested that school principals used out-of-school suspension in direct proportion to their stated support for zero tolerance policies and procedures. In a comprehensive study of the relationship between principal attitudes and disciplinary outcomes, Skiba et al. (2003) surveyed 325 principals regarding their attitudes toward zero tolerance, suspension and expulsion, and violence-prevention strategies. They found principal attitude and school disciplinary outcomes to be correlated: rates of out-of-school suspension were lower, and the use of preventive measures more frequent, at schools whose principals believed that suspension and expulsion were unnecessary given a positive school climate.
Regarding the causes for the disproportionately high rates at which students of color are suspended, some argue that minority children, particularly male students of color, tend to misbehave more frequently in school than do White children. Research on student behavior, race, and discipline has found no evidence that African-American over-representation in school suspension is due to higher rates of misbehavior (McCarthy and Hoge, 1987; McFadden et al., 1992; Shaw & Braden, 1990; Wu et al., 1982). Skiba et al. (2002) reviewed racial and gender disparities in school punishments in an urban setting, and found that White students were referred to the office significantly more frequently for offenses that appear more capable of objective documentation (e.g., smoking, vandalism, leaving without
Emerging data indicate that schools with higher rates of school suspension and expulsion have poorer outcomes on standardized achievement tests, regardless of the economic level or demographics of their students.
Research on student behavior, race, and discipline has found no evidence that African-American over-represenation in school suspension is due to higher rates of misbehavior.
DIsCUssION
SUSPENDED EDUCATION /// 11
permission, and obscene language). African-American students, however, were referred more often for disrespect, excessive noise, threat, and loitering - behaviors that would seem to require more subjective judgment on the part of the referring agent. In short, there is no evidence that racial disparities in school discipline can be explained through higher rates of disruption among African-American students.
To the extent that safety is the motivation behind the use of suspension, it is short sighted at best to fail to understand that removing many students from school simply leaves them unsupervised on the street. The frequent use of suspension by schools may thus lead to a net reduction in community safety. One organization, Fight Crime: Invest in Kids, a non-profit organization of 5,000 police chiefs, sheriffs, prosecutors and other law enforcement leaders recently stated, “While school safety must be maintained and truly dangerous students removed from the school community as appropriate, suspension and expulsion often provide troubled kids exactly what they do not need: an extended, unsupervised hiatus from school that increases their risk of engaging in substance abuse and violent crime” (Fight Crime: Invest in Kids, 2009). The statement goes on to cite the need for more data to “help educational authorities track suspensions and expulsions to evaluate their approach to school discipline and ensure students are not inappropriately placed at risk.”
Adolescence is a time where youth can be expected to challenge authority, whether at home, or at school, and do not consistently exercise good judgment (APA, 2008). From a developmental standpoint, it is not surprising that students attending middle schools might be expected to misbehave more often than older and younger students. As a modicum of rule-breaking is normal for adolescents, some form of discipline is clearly necessary in order to teach appropriate behavior in school and society. Yet it also stands to reason that fair and effective discipline in middle schools would maintain safe and orderly learning environments without removing large percentages of students and “not be harsh and traumatic for minor incidents” (Comer & Poussaint 1992). The choice suggested by the research is thus not between frequent discipline and lax discipline, but between frequent use of out-of-school suspension that removes adolescents from the opportunity to learn, and strong but caring discipline that works to inculcate good behavior, while resorting to out-of-school suspension only rarely.
One of the goals of public schooling is to prepare children to participate in our democracy, and become productive law-abiding citizens. Disciplinary tactics that respond to typical adolescent behavior by removing students from school do not better prepare students for adulthood. Instead, they increase their risk of educational failure and dropout. Are there ways of educating adolescents - ways to structure the school environment - that yield less disruptive behavior than others? And when rules are broken, are there disciplinary methods that are developmentally sound and proven effective with regard to safety and achievement, yet keep the loss of instructional time to an absolute minimum? While a full review of the research on effective schools and discipline is beyond the scope of this report, extensive research and policy studies on school violence and school discipline over the last decade have identified a host of effective alternatives to zero tolerance that are more likely to ensure safe and orderly schools while keeping students in school (Dwyer, Osher, & Warger, 1998; Gagnon & Leone, 2001;
“...Suspension and expulsion often provide troubled kids exactly what they do not need: an extended, unsupervised hiatus from school that increases their risk of engaging in substance abuse and violent crime.”
pOlICY ReCOMMeNDaTIONs
12 /// SUSPENDED EDUCATION
Gottfredson, 1997; Greenberg et al., 2003; Mihalic, Irwin, Elliott, Fagan, & Hansen, 2001; Elliott, Hatot, Sirovatka, & Potter, 2001; Thornton, Craft, Dahlberg, Lynch, & Baer, 2000; Tolan & Guerra, and Kendall, 1995; Zins, Weissberg, Wang & Walberg, 2004).
The disturbing data in this brief report suggest that, especially in urban districts, middle schools wishing to both diminish misbehavior and keep students in school may need more support. We believe greater awareness of the high rates of discipline and federal support for positive interventions could also help schools with the most frequent use of out-of-school suspensions to reduce their reliance on suspension while learning to utilize more effective forms of intervention that yield better academic and social outcomes.
policy Recommendations1. increase the collection and use of data, especially data disaggregated by race and gender, on school discipline.Generally, suspension data are not among the required elements of school or district reports to the public. Nor are they often used as indicators of effective schooling under federal law. As a result, school discipline data only receives attention on an occasional basis, when the news reports on students who were expelled unfairly, or after a violent incident. Given the research that frequent use of suspension may be ineffective and even harmful to students in the long run, our first recommendation is that discipline data be collected and publicly reported for all schools and districts, at least annually, and with full disaggregation of the data by race with gender.
2. identify schools and districts with high suspension rates and provide technical assistance on effective alternative strategies.Our second recommendation is that the federal government combine its monitoring and grant-making authority to identify schools and districts with comparatively high rates of suspension and provide technical assistance grants to help these schools and districts adopt evidence-based methods that can reduce the removal of students, improve school climate, and improve school safety.
3. use the investigative authority of OCr to identify and address unlawful discrimination in the use of exclusionary school discipline.Third, the magnitude of the differences in risk for suspension by race with gender revealed in this study suggests the possibility of unlawful discrimination and the need for intensified monitoring by the U.S. Department of Education Office for Civil Rights (OCR), which has the jurisdiction to investigate possible race- and gender-based discrimination. Data alone do not prove discrimination. OCR has the authority to investigate, however, whether policies or practices have an unlawful discriminatory impact - an impact that can occur even where the disparity in question was not the result of intentional discrimination. If, for example, in pursuit of a safer learning environment, a well-meaning school board pursued a school discipline policy (e.g. suspending truant youth) that resulted in large and
CONClUsION
SUSPENDED EDUCATION /// 13
disparate numbers of students by race or gender losing instructional time, but had no positive impact on truancy, that policy could be found by OCR to violate the disparate impact regulations promulgated pursuant to federal antidiscrimination law. The purpose of issuing such a finding would be to prompt the school or district to replace the ineffective discipline policy with one that works for all students.
ConclusionThese statistics and policy recommendations are intended to stimulate robust debate among educators and policymakers. We believe that, once aware of the high frequency and large disparities in the use of school discipline, educators and policymakers will want more information about ways to reduce suspensions while maintaining safe and orderly school climates. If our national education leaders are serious about improving the conditions and outcomes of all of our public school students, we cannot afford to leave the issue of discipline out of the debate. We hope that this report also leads to deeper explorations of how school discipline relates to the quality of middle school education and academic outcomes, especially in school districts serving large numbers of minority youth.
appeNDIX 1
14 /// SUSPENDED EDUCATION
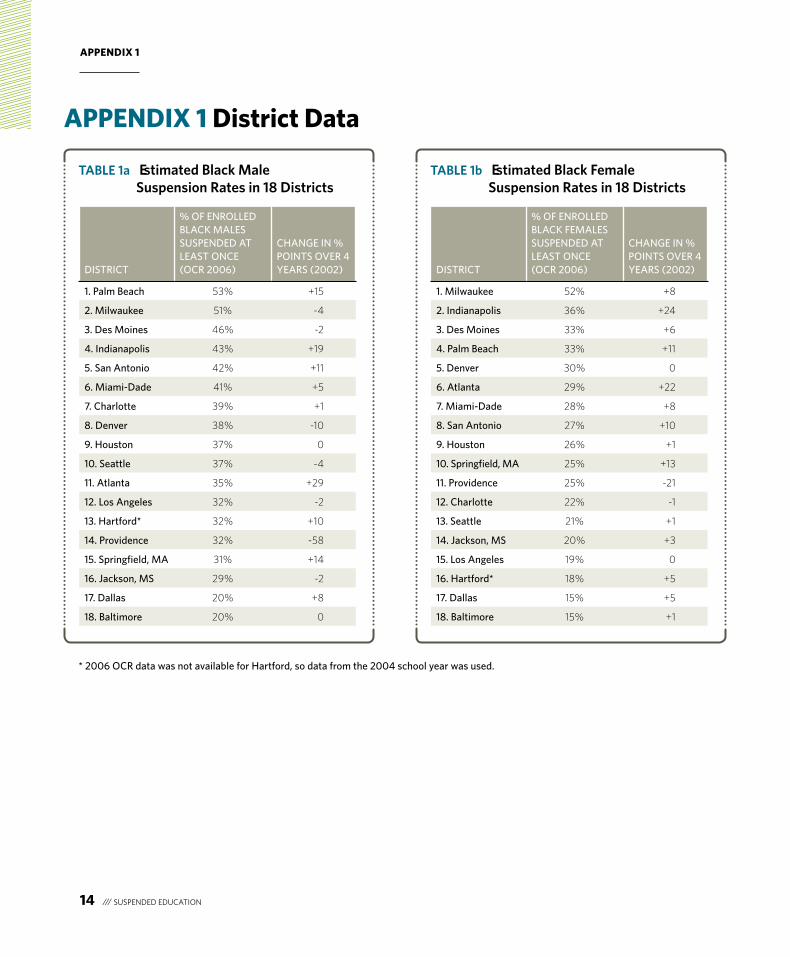
TAble 1a estimated black Male Suspension rates in 18 Districts
TAble 1b estimated black Female Suspension rates in 18 Districts
distRiCt
% OF ENROLLEd BLACK MALEs sUsPENdEd At LEAst ONCE (OCR 2006)
CHANGE iN % POiNts OvER 4 yEARs (2002)
1. Palm Beach 53% +15
2. Milwaukee 51% -4
3. des Moines 46% -2
4. indianapolis 43% +19
5. san Antonio 42% +11
6. Miami-dade 41% +5
7. Charlotte 39% +1
8. denver 38% -10
9. Houston 37% 0
10. seattle 37% -4
11. Atlanta 35% +29
12. Los Angeles 32% -2
13. Hartford* 32% +10
14. Providence 32% -58
15. springfield, MA 31% +14
16. Jackson, Ms 29% -2
17. dallas 20% +8
18. Baltimore 20% 0
distRiCt
% OF ENROLLEd BLACK FEMALEs sUsPENdEd At LEAst ONCE (OCR 2006)
CHANGE iN % POiNts OvER 4 yEARs (2002)
1. Milwaukee 52% +8
2. indianapolis 36% +24
3. des Moines 33% +6
4. Palm Beach 33% +11
5. denver 30% 0
6. Atlanta 29% +22
7. Miami-dade 28% +8
8. san Antonio 27% +10
9. Houston 26% +1
10. springfield, MA 25% +13
11. Providence 25% -21
12. Charlotte 22% -1
13. seattle 21% +1
14. Jackson, Ms 20% +3
15. Los Angeles 19% 0
16. Hartford* 18% +5
17. dallas 15% +5
18. Baltimore 15% +1
appeNDIX 1 District Data
* 2006 OCR data was not available for Hartford, so data from the 2004 school year was used.
appeNDIX 1
SUSPENDED EDUCATION /// 15
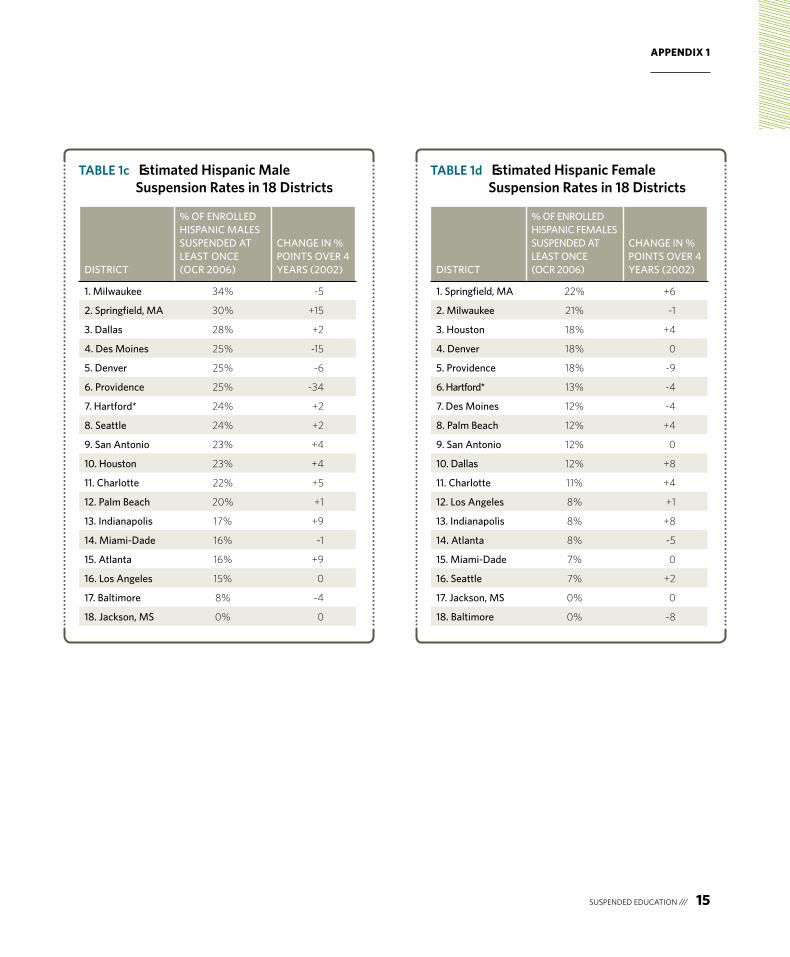
TAble 1c estimated Hispanic Male Suspension rates in 18 Districts
TAble 1d estimated Hispanic Female Suspension rates in 18 Districts
distRiCt
% OF ENROLLEd HisPANiC MALEs sUsPENdEd At LEAst ONCE (OCR 2006)
CHANGE iN % POiNts OvER 4 yEARs (2002)
1. Milwaukee 34% -5
2. springfield, MA 30% +15
3. dallas 28% +2
4. des Moines 25% -15
5. denver 25% -6
6. Providence 25% -34
7. Hartford* 24% +2
8. seattle 24% +2
9. san Antonio 23% +4
10. Houston 23% +4
11. Charlotte 22% +5
12. Palm Beach 20% +1
13. indianapolis 17% +9
14. Miami-dade 16% -1
15. Atlanta 16% +9
16. Los Angeles 15% 0
17. Baltimore 8% -4
18. Jackson, Ms 0% 0
distRiCt
% OF ENROLLEd HisPANiC FEMALEs sUsPENdEd At LEAst ONCE (OCR 2006)
CHANGE iN % POiNts OvER 4 yEARs (2002)
1. springfield, MA 22% +6
2. Milwaukee 21% -1
3. Houston 18% +4
4. denver 18% 0
5. Providence 18% -9
6. Hartford* 13% -4
7. des Moines 12% -4
8. Palm Beach 12% +4
9. san Antonio 12% 0
10. dallas 12% +8
11. Charlotte 11% +4
12. Los Angeles 8% +1
13. indianapolis 8% +8
14. Atlanta 8% -5
15. Miami-dade 7% 0
16. seattle 7% +2
17. Jackson, Ms 0% 0
18. Baltimore 0% -8
appeNDIX 1
16 /// SUSPENDED EDUCATION
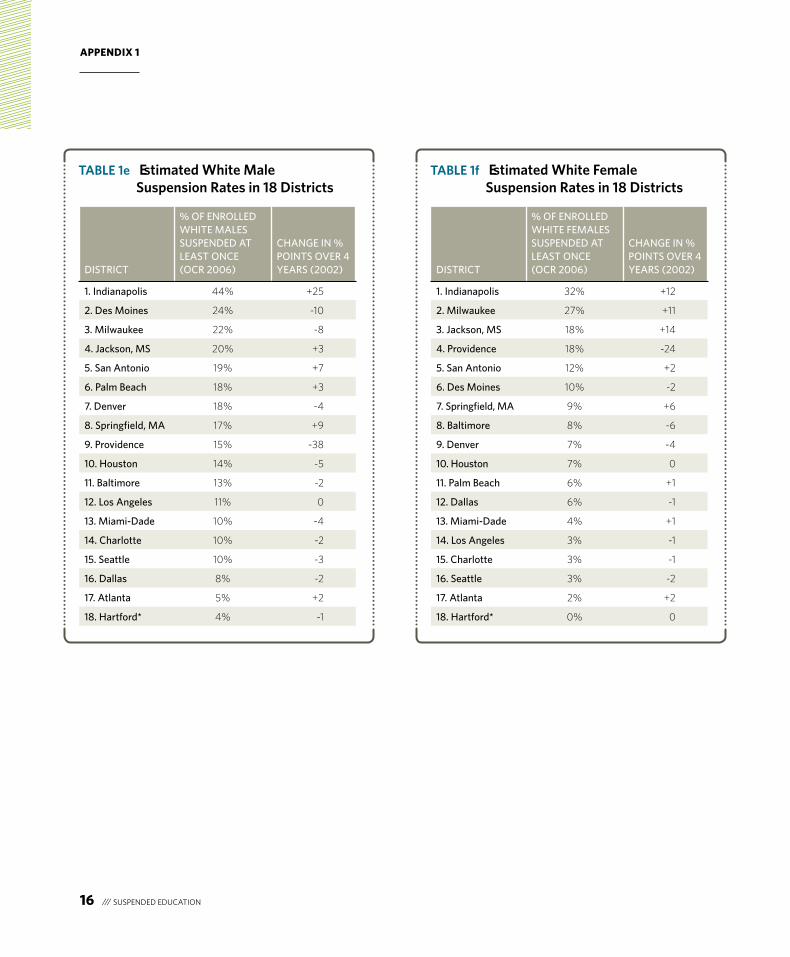
TAble 1e estimated White Male Suspension rates in 18 Districts
TAble 1f estimated White Female Suspension rates in 18 Districts
distRiCt
% OF ENROLLEd WHitE MALEs sUsPENdEd At LEAst ONCE (OCR 2006)
CHANGE iN % POiNts OvER 4 yEARs (2002)
1. indianapolis 44% +25
2. des Moines 24% -10
3. Milwaukee 22% -8
4. Jackson, Ms 20% +3
5. san Antonio 19% +7
6. Palm Beach 18% +3
7. denver 18% -4
8. springfield, MA 17% +9
9. Providence 15% -38
10. Houston 14% -5
11. Baltimore 13% -2
12. Los Angeles 11% 0
13. Miami-dade 10% -4
14. Charlotte 10% -2
15. seattle 10% -3
16. dallas 8% -2
17. Atlanta 5% +2
18. Hartford* 4% -1
distRiCt
% OF ENROLLEd WHitE FEMALEs sUsPENdEd At LEAst ONCE (OCR 2006)
CHANGE iN % POiNts OvER 4 yEARs (2002)
1. indianapolis 32% +12
2. Milwaukee 27% +11
3. Jackson, Ms 18% +14
4. Providence 18% -24
5. san Antonio 12% +2
6. des Moines 10% -2
7. springfield, MA 9% +6
8. Baltimore 8% -6
9. denver 7% -4
10. Houston 7% 0
11. Palm Beach 6% +1
12. dallas 6% -1
13. Miami-dade 4% +1
14. Los Angeles 3% -1
15. Charlotte 3% -1
16. seattle 3% -2
17. Atlanta 2% +2
18. Hartford* 0% 0
appeNDIX 2
SUSPENDED EDUCATION /// 17
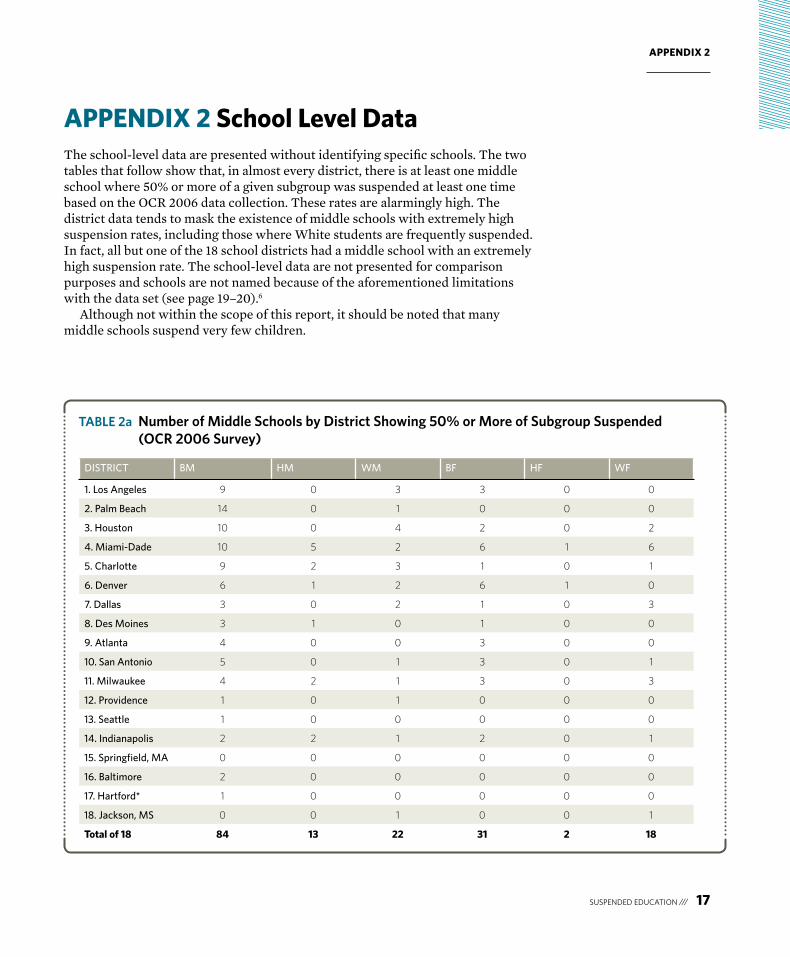
The school-level data are presented without identifying specific schools. The two tables that follow show that, in almost every district, there is at least one middle school where 50% or more of a given subgroup was suspended at least one time based on the OCR 2006 data collection. These rates are alarmingly high. The district data tends to mask the existence of middle schools with extremely high suspension rates, including those where White students are frequently suspended. In fact, all but one of the 18 school districts had a middle school with an extremely high suspension rate. The school-level data are not presented for comparison purposes and schools are not named because of the aforementioned limitations with the data set (see page 19–20).6
Although not within the scope of this report, it should be noted that many middle schools suspend very few children.
TAble 2a Number of Middle Schools by District Showing 50% or More of Subgroup Suspended (OCr 2006 Survey)
distRiCt BM HM WM BF HF WF
1. Los Angeles 9 0 3 3 0 0
2. Palm Beach 14 0 1 0 0 0
3. Houston 10 0 4 2 0 2
4. Miami-dade 10 5 2 6 1 6
5. Charlotte 9 2 3 1 0 1
6. denver 6 1 2 6 1 0
7. dallas 3 0 2 1 0 3
8. des Moines 3 1 0 1 0 0
9. Atlanta 4 0 0 3 0 0
10. san Antonio 5 0 1 3 0 1
11. Milwaukee 4 2 1 3 0 3
12. Providence 1 0 1 0 0 0
13. seattle 1 0 0 0 0 0
14. indianapolis 2 2 1 2 0 1
15. springfield, MA 0 0 0 0 0 0
16. Baltimore 2 0 0 0 0 0
17. Hartford* 1 0 0 0 0 0
18. Jackson, Ms 0 0 1 0 0 1
Total of 18 84 13 22 31 2 18
appeNDIX 2 school level Data
appeNDIX 2
18 /// SUSPENDED EDUCATION
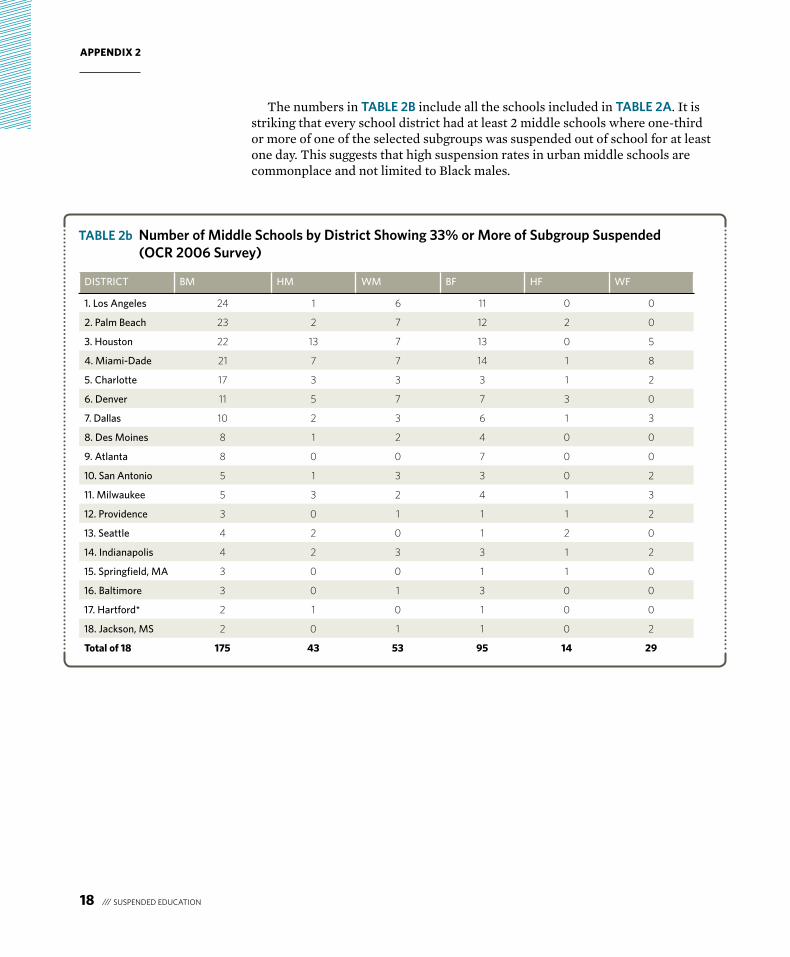
The numbers in TAble 2b include all the schools included in TAble 2A. It is striking that every school district had at least 2 middle schools where one-third or more of one of the selected subgroups was suspended out of school for at least one day. This suggests that high suspension rates in urban middle schools are commonplace and not limited to Black males.
TAble 2b Number of Middle Schools by District Showing 33% or More of Subgroup Suspended (OCr 2006 Survey)
distRiCt BM HM WM BF HF WF
1. Los Angeles 24 1 6 11 0 0
2. Palm Beach 23 2 7 12 2 0
3. Houston 22 13 7 13 0 5
4. Miami-dade 21 7 7 14 1 8
5. Charlotte 17 3 3 3 1 2
6. denver 11 5 7 7 3 0
7. dallas 10 2 3 6 1 3
8. des Moines 8 1 2 4 0 0
9. Atlanta 8 0 0 7 0 0
10. san Antonio 5 1 3 3 0 2
11. Milwaukee 5 3 2 4 1 3
12. Providence 3 0 1 1 1 2
13. seattle 4 2 0 1 2 0
14. indianapolis 4 2 3 3 1 2
15. springfield, MA 3 0 0 1 1 0
16. Baltimore 3 0 1 3 0 0
17. Hartford* 2 1 0 1 0 0
18. Jackson, Ms 2 0 1 1 0 2
Total of 18 175 43 53 95 14 29
appeNDIX 3
SUSPENDED EDUCATION /// 19
appeNDIX 3 Issues in Using U.s. Department of education Office for Civil Rights Compliance survey DataAs noted in the text, these data were drawn from the Elementary and Secondary Education Civil Rights Compliance Survey from the U.S. Department of Education Office for Civil Rights (OCR). As Morrison and Skiba (2002) note, although data reported by schools to the OCR represent our best estimate on the extent of use of suspension or expulsion, it is important to recognize that there are inherent limitations in using such data to assess the status or trends of school discipline.
There are two technical problems with the OCR data collection. First, the disciplinary and enrollment data reviewed are from different school years. OCR typically sends its survey out in the winter and asks schools and districts to report their current enrollment. Because the school year is only half complete when the survey begins, OCR asks schools and districts to provide their discipline data from the prior school year. Because the survey is biennial, there is no way to exactly align enrollment data to the discipline data for the year in which the discipline occurred. Therefore, the risk of suspension is an estimate.
Despite the mismatch in years, this method of collecting and reporting suspension data has remained constant since the early 1970s. While the misalignment of years can have a profound impact on reported rates for a given school, the use of different years is not critical for reporting trends in districts, states, or for the nation. In fact, because enrollment can fluctuate dramatically over the course of any academic school year, defining a given school’s actual enrollment based on one collection date introduces further accuracy questions.
The authors could have compared OCR discipline data with enrollment data collected from another independent source for the correct school year, such as the Common Core of Data (CCD). However, aligning the sources down to the school level would have been difficult and the results no more reliable as OCR and CCD use different school codes.
The second technical problem with the OCR data collection is that, while enrollment figures include both students with disabilities and their non-disabled peers, the suspension data does not include students with disabilities. Instead, suspension data for students with disabilities is reported in a manner that makes it incompatible with the suspension data used in this study. For students with disabilities, the compliance survey only collected suspensions of 10 days or more and reported the data in a separate report. As a result, the calculations used to report “risk” for suspension, divides the number of non-disabled students suspended at least one time by all students, including students with disabilities. There are several studies suggesting that students with disabilities tend to be suspended at rates that are higher than their non-disabled peers (Christie 2004). Although we cannot conclude that this is the case in each district, if it is generally true that students with disabilities tend to be suspended more often than their non-disabled peers, the reported risk levels in this study are likely depressed by the
appeNDIX 3
20 /// SUSPENDED EDUCATION
exclusion of students with disabilities from the numerator but not the denominator in our suspension-risk calculation.
Data Cleaning: This report acknowledges that the OCR survey may include data that are seriously underreported in some cases and mistakenly over-reported in others. We excluded all schools whose data was clearly erroneous. In some cases, the OCR data indicated that more students were suspended than were listed as enrolled. A review of these data anomalies revealed that they were far more common when the numbers of the enrolled group fell below 10 students. However, we also recognize that, in some cases, the data may have been reported incorrectly. One theory is that, despite explicit instructions to the contrary, some data recorders may have counted the number of suspensions rather than the numbers of students suspended. In preparing this report, we excluded all of the data from a school if the data in even one subcategory appeared to include an error. This, arguably, biased the suspension rates to be lower, as schools with high numbers of suspensions were removed from the study while few if any schools with low numbers of suspensions were excluded.
ReFeReNCes
SUSPENDED EDUCATION /// 21
ReFeReNCesAdvancement Project/Civil Rights Project. (2000, February). Opportunities suspended: The devastating consequences of zero tolerance and school discipline. Cambridge, MA: Author.
American Psychological Association Zero Tolerance Task Force. (2008). Are zero tolerance policies effective in the schools? An evidentiary review and recommendations. American Psychologist, 63, 852-862.
Bain, A., & MacPherson, A. (1990). An examination of the system-wide use of exclusion with disruptive students. Australia and New Zealand Journal of Developmental Disabilities, 16, 109-123.
Balfanz R. et al. (2003). High Poverty Secondary Schools and the Juvenile Justice System. In Wald & Losen (Eds.), Deconstructing The School To Prison Pipeline, 77-78. San Francisco: Jossey-Bass.
Bowditch, C. (1993). Getting rid of troublemakers: High school disciplinary procedures and the production of dropouts. Social Problems, 40, 493-507.
Children’s Defense Fund. (1975). School suspensions: Are they helping children?Cambridge, MA: Washington Research Project.
Christie, C., et al. (2004). School characteristics related to the use of suspension. Education and Treatment of Children, 27, 509-526 (online abstract citing Mallard & Sebert 1996).
Comer, J.P. & Poussaint A.F. (1992) Raising African American Children, 197-198. New York: Plume.
Cooley, S. (1995). Suspension/expulsion of regular and special education students in Kansas: A report to the Kansas State Board of Education. Topeka, KS: Kansas State Board of Education.
Dupper, D.R. & Bosch, L.A. (1996). Reasons for school suspensions: An examination of data from one school district and recommendations for reducing suspensions. Journal for a Just and Caring Education, 2, 140-150.
Dwyer, K., Osher, D., & Warger, C. (1998). Early warning, timely response: A guide to safe schools. Washington, DC: U.S. Department of Education.
Elliott, D., Hatot, N.J., Sirovatka, P, & Potter, B.B. (2001). Youth violence: A report of the Surgeon General. Washington, DC: U.S. Surgeon General.
ReFeReNCes
22 /// SUSPENDED EDUCATION
Ewing, C.P. (2000, January/February). Sensible zero tolerance protects students. Harvard Education Letter(Online). Retrieved July 21, 2004 from http://www.edlettr.org/past/issues/2000-jf/zero.shtml.
Fight Crime: Invest in Kids. (2009). Comments Pursuant to Notice of Proposed Information Collection Request. New York: Author.
Florida State Department of Education. (1995). Florida school discipline study: 1994 juvenile justice reform act. A report to the Florida legislature. Tallahassee, FL: Author.
Gagnon, J.C., & Leone, P.E. (2001). Alternative strategies for youth violence prevention. In R.J. Skiba & G.G. Noam (Eds.), New Directions for Youth Development (no. 92; Zero tolerance: Can suspension and expulsion keep school safe?), (pp. 101-125). San Francisco: Jossey-Bass.
Gottfredson, D.C. (1997). School-based crime prevention. In L. Sherman, D. Gottfredson, D. MacKenzie, J. Eck, P. Ruter, & S. Bushway (Eds.), Preventing crime: What works, what doesn’t, what’s promising: A report to the United States Congress (pp. 1-74). Washington, D. C.: U. S. Department of Justice, Office of Justice Programs.
Greenberg, M.T., Weissberg, R.P., O’Brien, M.U., Zins, J.E., Fredericks, L., Resnik, H., Elias, M.J. (2003). Enhancing school-based prevention and youth development through coordinated social, emotional, and academic learning. American Psychologist, 58, 466-474.
Greenwood, C.R., Horton, B.T., & Utley, C.A. (2002). Academic engagement: Current perspectives on research and practice. School Psychology Review, 31, 328-349.
Imich, A.J. (1994). Exclusions from school: Current trends and issues. Educational Research, 36 (1), 3-11.
Kaeser, S.C. (1979). Suspensions in school discipline. Education and Urban Society, 11, 465-484.
Massachusetts Advocacy Center. (1986). The way out: Student exclusion practices in Boston middle schools. Boston, MA: Author.
McCarthy, J. D., & Hoge, D.R. (1987). The social construction of school punishment: Racial disadvantage out of universalistic process. Social Forces, 65, 1101-1120.
McFadden, A.C., Marsh, G. E., Price, B.J., & Hwang, Y. (1992). A study of race and gender bias in the punishment of handicapped school children. Urban Review, 24, 239-251.
ReFeReNCes
SUSPENDED EDUCATION /// 23
Menacker, J.C., Hurwitz, E., & Weldon, W. (1988). Legislating school discipline: The application of a systemwide discipline code to schools in a large urban district. Urban Education, 23, 12-23.
Mihalic, S., Irwin, K., Elliott, D., Fagan, A., & Hansen, D. (2001, July). Blueprints for violence prevention (OJJDP Juvenile Justice Bulletin). Washington, DC: U.S. Department of Justice, Office of Juvenile Justice and Delinquency Prevention.
Morgan-D’Atrio, C., Northrup, J., LaFleur, L., & Spera, S. (1996). Toward prescriptive alternatives to suspensions: A preliminary evaluation. Behavioral Disorders, 21, 190-200.
Raffaele Mendez, L. (2003) Predictors of suspension and negative school outcomes: A longitudinal investigation. In Wald & Losen (Eds.), Deconstructing the School to Prison Pipeline (p. 27). San Francisco: Jossey-Bass.
Raffaele Mendez, L.M. & Knoff, H.M. (2003). Who gets suspended from school and why: A demographic analysis of schools and disciplinary infractions in a large school district. Education and Treatment of Children, 26, 30-51.
Skiba, R.J., Michael, R. S., Nardo, A.C., & Peterson, R.L. (2002). The color of discipline: Sources of racial and gender disproportionality in school punishment. Urban Review, 34, 317-342.
Skiba, R.J., Peterson, R.L., & Williams, T. (1997). Office referrals and suspension: Disciplinary intervention in middle schools. Education and Treatment of Children, 20, 295-315.
Skiba, R.J., & Rausch, M.K. (2006). Zero tolerance, suspension, and expulsion: Questions of equity and effectiveness. In C.M. Evertson, & C.S. Weinstein (Eds.), Handbook for Classroom Management: Research, Practice, and Contemporary Issues (pp. 1063-1089). Mahwah, NJ: Lawrence Erlbaum Associates.
Skiba, R.J., Simmons, A.B, Staudinger, L.P., Rausch, M.K., Dow, G. & Feggins, L.R. (2003). Consistent removal: Contributions of school discipline to the school-prison pipeline. Paper presented at the Harvard Civil Rights Conference School-to-Prison Pipeline Conference, Cambridge, MA.
Stone, D.H. (1993). Crime and punishment in public schools: An empirical study of disciplinary proceedings. Journal of Trial Advocacy, 17, 351-398.
Thornton, T.N., Craft, C.A., Dahlberg, L.L., Lynch, B.S., & Baer, K. (2000). Best practices of youth violence prevention: A sourcebook for community action.Atlanta: Centers for Disease Control and Prevention, National Center for Injury Prevention and Control.
ReFeReNCes
24 /// SUSPENDED EDUCATION
Tolan, P.H., Guerra, N.G., & Kendall, P.C. (1995). Prediction and prevention of antisocial behavior in children and adolescents. Journal of Consulting and Clinical Psychology, 63, 515-517.
Wallace, Jr., J. M., Goodkind, S., Wallace, C. M., & Bachman, J. G. (2008). Racial, ethnic, and gender differences in school discipline among U.S. high school students: 1991-2005. Negro Educational Review, 59, 47-62.
Wang, M.C., Haertel, G.D., & Walberg, H.J. (1997). Learning influences. In H.J. Walberg & G.D. Haertel (Eds.), Psychology and educational practice (pp. 199-211). Berkeley: McCutchan.
eNDNOTes1 This report focuses on school suspension, not school expulsion. Most incidents posing
serious safety issues, such as serious threats of harm, or bringing a weapon or illegal drugs to school, result in expulsion, not suspension. Expulsion is also an area of less discretion for schools and school districts, as the Safe and Drug Free Schools Act, notwithstanding some discretion by the chief school administrator, requires public schools to expel students for the aforementioned offenses pursuant to federal requirements. 20 U.S.C. 8921 et seq. (2010).
2 All the data were reported by the U.S. Department of Education’s Office for Civil Rights. The1972–73 data were taken from the Children’s defense fund of the Washington researCh ProjeCt, sChool susPensions: are they helPing Children? app. B (1975); the 1988 data are from the Officefor Civil Rights’ Time Series CD-Rom.
3 Some states do report middle school suspension data. The State of Wisconsin’s Departmentof Public Instruction, for example, reports on its website (under data/behavior and attendance/suspension) that over 50.6% of all enrolled Black Middle School/Junior High students were suspended at least one time in 2005-2006. In comparison, the suspension rates for other groups of students were reported as 22.9% for American Indian students; 20.4% for Hispanic students; 5.4% for White students, and 4.6% for Asian students. The data are available at http://data.dpi.state.wi.us/data/graphshell.asp?STYP=5&GrapFile=SUSPEXP&DETAIL (Last visited on 7/31/2008). OCR’s published state reports combine all grades K-12, and uses the district samples and statistical weighting to create values for each state. These projected values are available on the U.S. Department of Education’s website at http://ocrdata.ed.gov/Projections_2006.aspx. (Last visited on 12/02/09).
4 Because most of the districts reviewed in this report had very low enrollment levels for NativeAmericans and Asian/Pacific Islanders these groups were not included in this analysis.
5 Including the disciplined students prevents artificial achievement gains that might accrue if alllow achievers were expelled from school or simply suspended around test time.
6 The two issues highlighted earlier, the lack of alignment with the enrollment year and theexclusion of suspensions meted out to students with disabilities, could most dramatically impact calculation of risk at the individual school level.