advances in geographic profiling - towson university applied... · rigel (kim rossmo) mike...
TRANSCRIPT

Advances in Geographic Profiling
Mike O’Leary
Department of MathematicsTowson University
31st Applied Geography ConferenceWilmington, DEOctober 2008
Mike O’Leary (Towson University) Advances in Geographic Profiling Applied Geography Conference 1 / 47
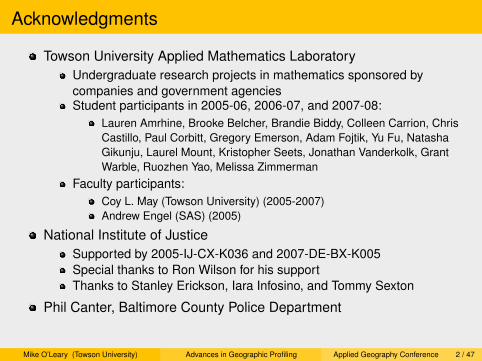
Acknowledgments
Towson University Applied Mathematics LaboratoryUndergraduate research projects in mathematics sponsored bycompanies and government agenciesStudent participants in 2005-06, 2006-07, and 2007-08:
Lauren Amrhine, Brooke Belcher, Brandie Biddy, Colleen Carrion, ChrisCastillo, Paul Corbitt, Gregory Emerson, Adam Fojtik, Yu Fu, NatashaGikunju, Laurel Mount, Kristopher Seets, Jonathan Vanderkolk, GrantWarble, Ruozhen Yao, Melissa Zimmerman
Faculty participants:Coy L. May (Towson University) (2005-2007)Andrew Engel (SAS) (2005)
National Institute of JusticeSupported by 2005-IJ-CX-K036 and 2007-DE-BX-K005Special thanks to Ron Wilson for his supportThanks to Stanley Erickson, Iara Infosino, and Tommy Sexton
Phil Canter, Baltimore County Police Department
Mike O’Leary (Towson University) Advances in Geographic Profiling Applied Geography Conference 2 / 47
The Geographic Profiling Problem
The Geographic Profiling ProblemHow can we estimate for the location of the anchor point of a serialoffender from knowledge of the locations of the offender’s crime sites?
The anchor point can be the offender’s place of residence, place ofwork, or some other location important to the offender.
Mike O’Leary (Towson University) Advances in Geographic Profiling Applied Geography Conference 3 / 47

Mike O’Leary (Towson University) Advances in Geographic Profiling Applied Geography Conference 4 / 47

Mike O’Leary (Towson University) Advances in Geographic Profiling Applied Geography Conference 5 / 47

Mike O’Leary (Towson University) Advances in Geographic Profiling Applied Geography Conference 6 / 47

Mike O’Leary (Towson University) Advances in Geographic Profiling Applied Geography Conference 7 / 47
Mike O’Leary (Towson University) Advances in Geographic Profiling Applied Geography Conference 8 / 47

Mike O’Leary (Towson University) Advances in Geographic Profiling Applied Geography Conference 9 / 47
The Geographic Profiling Problem
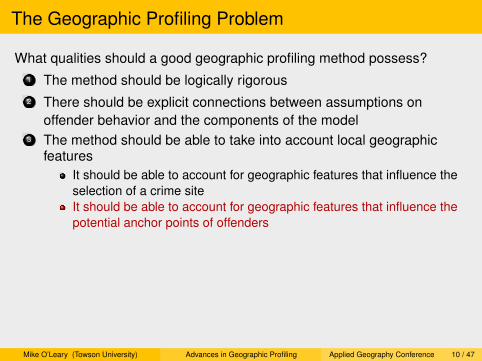
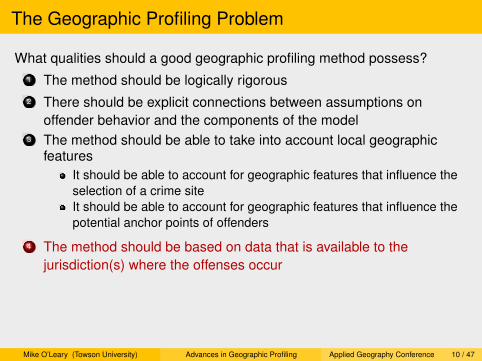
What qualities should a good geographic profiling method possess?1 The method should be logically rigorous
2 There should be explicit connections between assumptions onoffender behavior and the components of the model
3 The method should be able to take into account local geographicfeatures
It should be able to account for geographic features that influence theselection of a crime siteIt should be able to account for geographic features that influence thepotential anchor points of offenders
4 The method should be based on data that is available to thejurisdiction(s) where the offenses occur
5 The method should return a prioritized search area for lawenforcement officers
Mike O’Leary (Towson University) Advances in Geographic Profiling Applied Geography Conference 10 / 47

The Geographic Profiling Problem
What qualities should a good geographic profiling method possess?1 The method should be logically rigorous2 There should be explicit connections between assumptions on
offender behavior and the components of the model
3 The method should be able to take into account local geographicfeatures
It should be able to account for geographic features that influence theselection of a crime siteIt should be able to account for geographic features that influence thepotential anchor points of offenders
4 The method should be based on data that is available to thejurisdiction(s) where the offenses occur
5 The method should return a prioritized search area for lawenforcement officers
Mike O’Leary (Towson University) Advances in Geographic Profiling Applied Geography Conference 10 / 47

The Geographic Profiling Problem
What qualities should a good geographic profiling method possess?1 The method should be logically rigorous2 There should be explicit connections between assumptions on
offender behavior and the components of the model3 The method should be able to take into account local geographic
features
It should be able to account for geographic features that influence theselection of a crime siteIt should be able to account for geographic features that influence thepotential anchor points of offenders
4 The method should be based on data that is available to thejurisdiction(s) where the offenses occur
5 The method should return a prioritized search area for lawenforcement officers
Mike O’Leary (Towson University) Advances in Geographic Profiling Applied Geography Conference 10 / 47

The Geographic Profiling Problem
What qualities should a good geographic profiling method possess?1 The method should be logically rigorous2 There should be explicit connections between assumptions on
offender behavior and the components of the model3 The method should be able to take into account local geographic
featuresIt should be able to account for geographic features that influence theselection of a crime site
It should be able to account for geographic features that influence thepotential anchor points of offenders
4 The method should be based on data that is available to thejurisdiction(s) where the offenses occur
5 The method should return a prioritized search area for lawenforcement officers
Mike O’Leary (Towson University) Advances in Geographic Profiling Applied Geography Conference 10 / 47
The Geographic Profiling Problem
What qualities should a good geographic profiling method possess?1 The method should be logically rigorous2 There should be explicit connections between assumptions on
offender behavior and the components of the model3 The method should be able to take into account local geographic
featuresIt should be able to account for geographic features that influence theselection of a crime siteIt should be able to account for geographic features that influence thepotential anchor points of offenders
4 The method should be based on data that is available to thejurisdiction(s) where the offenses occur
5 The method should return a prioritized search area for lawenforcement officers
Mike O’Leary (Towson University) Advances in Geographic Profiling Applied Geography Conference 10 / 47

Existing Methods
Spatial distribution strategies
Estimate the anchor point with the centroid of the crime series locationsEstimate the anchor point with the center of miniumum distance fromthe crime locationsCanter’s Circle hypotheses:
The anchor point is contained in a circle whose diameter is formed by thetwo crime locations that are farthest apart
Probability distance strategies
These have been implemented in software
CrimeStat (Ned Levine)Dragnet (David Canter)Rigel (Kim Rossmo)
Mike O’Leary (Towson University) Advances in Geographic Profiling Applied Geography Conference 11 / 47
Existing Methods
Spatial distribution strategiesEstimate the anchor point with the centroid of the crime series locations
Estimate the anchor point with the center of miniumum distance fromthe crime locationsCanter’s Circle hypotheses:
The anchor point is contained in a circle whose diameter is formed by thetwo crime locations that are farthest apart
Probability distance strategies
These have been implemented in software
CrimeStat (Ned Levine)Dragnet (David Canter)Rigel (Kim Rossmo)
Mike O’Leary (Towson University) Advances in Geographic Profiling Applied Geography Conference 11 / 47

Existing Methods
Spatial distribution strategiesEstimate the anchor point with the centroid of the crime series locationsEstimate the anchor point with the center of miniumum distance fromthe crime locations
Canter’s Circle hypotheses:
The anchor point is contained in a circle whose diameter is formed by thetwo crime locations that are farthest apart
Probability distance strategies
These have been implemented in software
CrimeStat (Ned Levine)Dragnet (David Canter)Rigel (Kim Rossmo)
Mike O’Leary (Towson University) Advances in Geographic Profiling Applied Geography Conference 11 / 47
Existing Methods
Spatial distribution strategiesEstimate the anchor point with the centroid of the crime series locationsEstimate the anchor point with the center of miniumum distance fromthe crime locationsCanter’s Circle hypotheses:
The anchor point is contained in a circle whose diameter is formed by thetwo crime locations that are farthest apart
Probability distance strategies
These have been implemented in software
CrimeStat (Ned Levine)Dragnet (David Canter)Rigel (Kim Rossmo)
Mike O’Leary (Towson University) Advances in Geographic Profiling Applied Geography Conference 11 / 47

Existing Methods
Spatial distribution strategiesEstimate the anchor point with the centroid of the crime series locationsEstimate the anchor point with the center of miniumum distance fromthe crime locationsCanter’s Circle hypotheses:
The anchor point is contained in a circle whose diameter is formed by thetwo crime locations that are farthest apart
Probability distance strategiesThese have been implemented in software
CrimeStat (Ned Levine)Dragnet (David Canter)Rigel (Kim Rossmo)
Mike O’Leary (Towson University) Advances in Geographic Profiling Applied Geography Conference 11 / 47
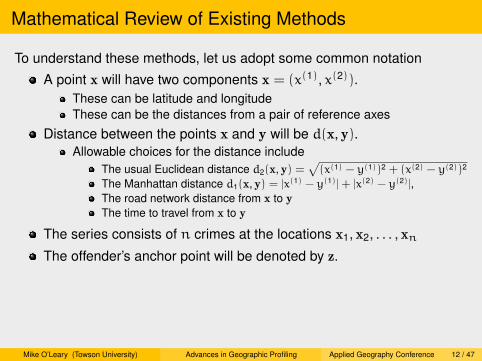
Mathematical Review of Existing Methods
To understand these methods, let us adopt some common notation
A point x will have two components x = (x(1), x(2)).These can be latitude and longitudeThese can be the distances from a pair of reference axes
Distance between the points x and y will be d(x, y).Allowable choices for the distance include
The usual Euclidean distance d2(x, y) =√
(x(1) − y(1))2 + (x(2) − y(2))2
The Manhattan distance d1(x, y) = |x(1) − y(1)| + |x(2) − y(2)|,The road network distance from x to yThe time to travel from x to y
The series consists of n crimes at the locations x1, x2, . . . , xnThe offender’s anchor point will be denoted by z.
Mike O’Leary (Towson University) Advances in Geographic Profiling Applied Geography Conference 12 / 47

Mathematical Review of Existing Methods
Existing algorithms begin by first making a choice of distance metricd; they then select a decay function f and construct a hit scorefunction S(y) by computing
S(y) =
n∑i=1
f(d(xi, y)) = f(d(x1, y)) + · · ·+ f(d(xn, y)).
Regions with a high hit score are considered to be more likely tocontain the offender’s anchor point z than regions with a low hit score.
A map of the hit score is provided to the analyst.
Mike O’Leary (Towson University) Advances in Geographic Profiling Applied Geography Conference 13 / 47

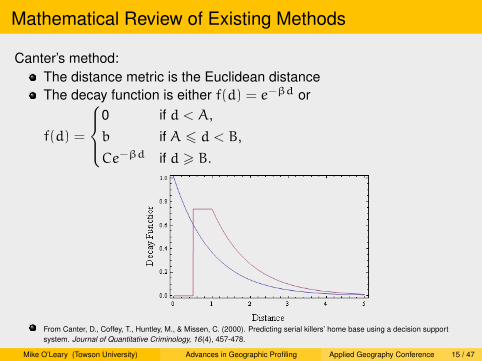
Mathematical Review of Existing Methods
Rossmo’s method:The distance metric is the Manhattan distanceThe distance decay function f is
f(d) =
{kdh
if d > B,kBg−h
(2B−d)g if d 6 B.
From Rossmo, K. (2000). Geographic profiling, CRC Press
Mike O’Leary (Towson University) Advances in Geographic Profiling Applied Geography Conference 14 / 47
Mathematical Review of Existing Methods
Canter’s method:The distance metric is the Euclidean distanceThe decay function is either f(d) = e−βd or
f(d) =
0 if d < A,
b if A 6 d < B,
Ce−βd if d > B.
From Canter, D., Coffey, T., Huntley, M., & Missen, C. (2000). Predicting serial killers’ home base using a decision supportsystem. Journal of Quantitative Criminology, 16(4), 457-478.
Mike O’Leary (Towson University) Advances in Geographic Profiling Applied Geography Conference 15 / 47
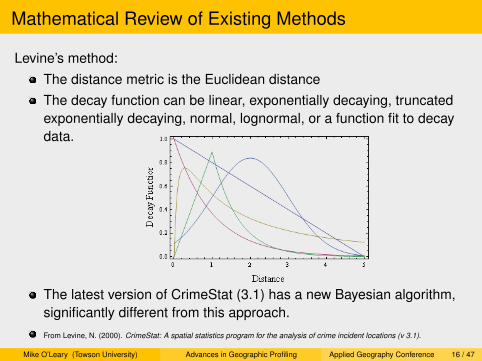
Mathematical Review of Existing Methods
Levine’s method:The distance metric is the Euclidean distanceThe decay function can be linear, exponentially decaying, truncatedexponentially decaying, normal, lognormal, or a function fit to decaydata.
The latest version of CrimeStat (3.1) has a new Bayesian algorithm,significantly different from this approach.From Levine, N. (2000). CrimeStat: A spatial statistics program for the analysis of crime incident locations (v 3.1).
Mike O’Leary (Towson University) Advances in Geographic Profiling Applied Geography Conference 16 / 47
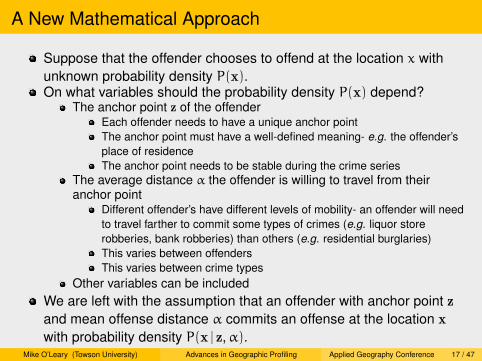
A New Mathematical Approach
Suppose that the offender chooses to offend at the location x withunknown probability density P(x).On what variables should the probability density P(x) depend?
The anchor point z of the offenderEach offender needs to have a unique anchor pointThe anchor point must have a well-defined meaning- e.g. the offender’splace of residenceThe anchor point needs to be stable during the crime series
The average distance α the offender is willing to travel from theiranchor point
Different offender’s have different levels of mobility- an offender will needto travel farther to commit some types of crimes (e.g. liquor storerobberies, bank robberies) than others (e.g. residential burglaries)This varies between offendersThis varies between crime types
Other variables can be includedWe are left with the assumption that an offender with anchor point zand mean offense distance α commits an offense at the location xwith probability density P(x | z,α).
Mike O’Leary (Towson University) Advances in Geographic Profiling Applied Geography Conference 17 / 47

A New Mathematical Approach
Our mathematical problem then becomes the following:Given a sample x1, x2, . . . , xn (the crime sites) from a probabilitydistribution P(x | z,α), estimate the parameter z (the anchor point).
This is a well-studied mathematical problemOne approach is the theory of maximum likelihood.
Construct the likelihood function
L(y,a) =
n∏i=1
P(xi | y,a) = P(x1 | y,a) · · ·P(xn | y,a)
Then the best choice of z is the choice of y that makes the likelihood aslarge as possible.This is equivalent to maximizing the log-likelihood
λ(y,a) =
n∑i=1
lnP(xi | y,a) = lnP(x1 | y,a) + · · ·+ lnP(xn | y,a)
The log-likelihood has a similar structure to the hit score methodRossmo mentions the possibility of constructing hit scores bymultiplication in Rossmo, K. (2000). Geographic profiling, CRC Press
Mike O’Leary (Towson University) Advances in Geographic Profiling Applied Geography Conference 18 / 47

Bayesian Analysis
Suppose that there is only one crime site x. Then Bayes’ Theoremimplies that
P(z,α | x) =P(x | z,α)π(z,α)
P(x)
P(z,α | x) is the posterior distributionIt gives the probability density that the offender has anchor point z andthe average offense distance α, given that the offender has committed acrime at x
π(z,α) is the prior distribution.It represents our knowledge of the probability density for the anchor pointz and the average offense distance α before we incorporate informationabout the crimeIf we assume that the choice of anchor point is independent of theaverage offense distance, we can write
π(z,α) = H(z)π(α)
where H(z) is the prior distribution of anchor points, and π(α) is the priordistribution of average offense distances
P(x) is the marginal distribution
Mike O’Leary (Towson University) Advances in Geographic Profiling Applied Geography Conference 19 / 47

Bayesian Analysis
A similar analysis holds when there is a series of n crimes; in thiscase
P(z,α | x1, . . . , xn) =P(x1, . . . , xn | z,α)π(z,α)
P(x1, . . . , xn).
If we assume that the offender’s choice of crime sites are mutuallyindependent, then
P(x1, . . . , xn | z,α) = P(x1 | z,α) · · ·P(xn | z,α)
giving us the relationship
P(z,α | x1, . . . , xn) ∝ P(x1 | z,α) · · ·P(xn | z,α)H(z)π(α).
Because we are only interested in the location of the anchor point, wetake the conditional distribution with respect to α to obtain thefollowing
Mike O’Leary (Towson University) Advances in Geographic Profiling Applied Geography Conference 20 / 47

Fundamental Theorem of Geographic ProfilingSuppose that an unknown offender has committed crimes atx1, x2, . . . , xn, and that
The offender has a unique stable anchor point z
The offender chooses targets to offend according to the probabilitydensity P(x | z,α) where α is the average distance the offender iswilling to travel
The target locations in the series are chosen independently
The prior distribution of anchor points is H(z), the prior distribution ofthe average offense distance is π(α) and these are independent ofone another.
Then the probability density that the offender has anchor point at thelocation z satisfies
P(z | x1, . . . , xn) ∝∫∞
0P(x1 | z,α) · · ·P(xn | z,α)H(z)π(α) dα
Mike O’Leary (Towson University) Advances in Geographic Profiling Applied Geography Conference 21 / 47

Remarks
1 The framework is independent of the significance of the anchor point z
2 This framework holds for any model of offender behavior P(x | z,α)
3 This framework holds for any choice of prior distributions H(z) andπ(α)
4 The framework is independent of the choice of distance metric5 Geographic features that affect crime selection can be incorporated
into the form of P(x | z,α)
6 Geographic features that affect the selection of anchor points areincorporated into the form of H(z)
7 The framework provides a prioritized search area; the frameworkestimates P(z | x1, . . . , xn) which is the probability density for theoffender’s anchor point; by definition locations where P(z | x1, . . . , xn)
are larger are more likely to contain the anchor point than regionswhere it is smaller.
Mike O’Leary (Towson University) Advances in Geographic Profiling Applied Geography Conference 22 / 47

Using the Fundamental Theorem
For the mathematics to be useful, we need to be able to:Make some reasonable choice for our model for offender behaviorMake some reasonable choice for the prior distribution of anchor pointsMake some reasonable choice for the prior distribution of the averageoffense distance, andBe able to evaluate the mathematical terms that appear
Mike O’Leary (Towson University) Advances in Geographic Profiling Applied Geography Conference 23 / 47

Models of Offender Behavior
Suppose that we assume that offenders choose offense sitesaccording to a normal distribution, so that
P(x | z,α) =1
4α2 exp(−π
4α2 |x − z|2)
.
If we also assume that all offenders have the same average offensedistance α, and that all anchor points are equally likely, then
P(z | x1, . . . , xn) =
(1
4α2
)nexp
(−π
4α2
n∑i=1
|xi − z|2
).
The mode of this distribution- thepoint most likely to be the offender’sanchor point- is the mean center ofthe crime site locations.
Mike O’Leary (Towson University) Advances in Geographic Profiling Applied Geography Conference 24 / 47

Models of Offender Behavior
Suppose that we assume that offenders choose offense sitesaccording to a negative exponential distribution, so that
P(x | z,α) =2πα2 exp
(−
2α
|x − z|
).
If we also assume that all offenders have the same average offensedistance α, and that all anchor points are equally likely, then
P(z | x1, . . . , xn) =
(2πα2
)nexp
(−
2α
n∑i=1
|xi − z|
)
The mode of this distribution- thepoint most likely to be the offender’sanchor point- is the center of minimumdistance of the crime site locations.
Mike O’Leary (Towson University) Advances in Geographic Profiling Applied Geography Conference 25 / 47

Models of Offender Behavior
What would a more realistic model for offender behavior look like?Consider a model in the form
P(x | z,α) = D(d(x, z),α) ·G(x) ·N(z)
D models the effect of distance decay using the distance metric d(x, z)We can specify a normal decay, so that D(d,α) = 1
4α2 exp(− π
4α2 d2)
We can specify a negative exponential decay, so thatD(d,α) = 2
πα2 exp(− 2αd)
Any choice can be made for the distance metric (Euclidean, Manhattan,et.al)
G models the geographic features that influence crime site selectionHigh values for G(x) indicate that x is a likely target for typical offenders;Low values for G(x) indicate that x is a less likely target
N is a normalization factor, required to ensure that P is a probabilitydistribution
N(z) =[∫∫
D(d(y, z),α)G(y)dy(1)dy(2)]−1
N is completely determined by the choices for D and G.
Mike O’Leary (Towson University) Advances in Geographic Profiling Applied Geography Conference 26 / 47

Geographic Features that Influence Crime Selection
G models the geographic features that influence crime site selection,with high values indicating the location was more likely to be targetedby an offender.How can we calculate G?
Use available geographic and demographic data and the correlationsbetween crime rates and these variables that have already beenpublished to construct an appropriate choice for G(x)
Different crime types have different etiologies; in particular theirrelationship to the local geographic and demographic backcloth dependsstrongly on the particular type of crime. This would limit the method toonly those crimes where this relationship has been well studied
Some crimes can only occur at certain, well-known locations, which areknown to law enforcement
For example, gas station robberies, ATM robberies, bank robberies,liquor store robberiesThis does not apply to all crime types- e.g. street robberies, vehiclethefts.
We can assume that historical crime patterns are good predictors ofthe likelihood that a particular location will be the site of a crime.
Mike O’Leary (Towson University) Advances in Geographic Profiling Applied Geography Conference 27 / 47

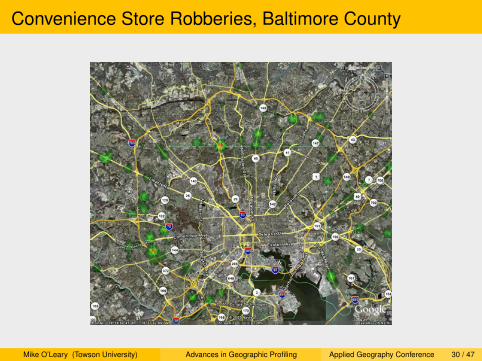
Convenience Store Robberies, Baltimore County
Mike O’Leary (Towson University) Advances in Geographic Profiling Applied Geography Conference 28 / 47
Geographic Features that Influence Crime Selection
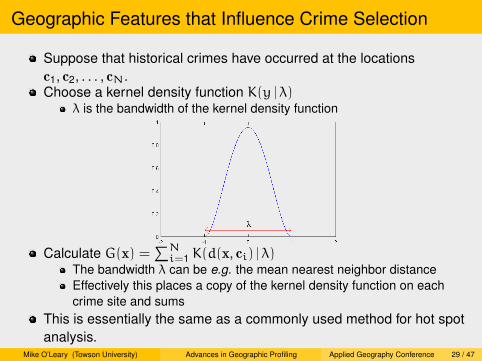
Suppose that historical crimes have occurred at the locationsc1, c2, . . . , cN.Choose a kernel density function K(y | λ)
λ is the bandwidth of the kernel density function
Calculate G(x) =∑Ni=1 K(d(x, ci) | λ)
The bandwidth λ can be e.g. the mean nearest neighbor distanceEffectively this places a copy of the kernel density function on eachcrime site and sums
This is essentially the same as a commonly used method for hot spotanalysis.
Mike O’Leary (Towson University) Advances in Geographic Profiling Applied Geography Conference 29 / 47
Convenience Store Robberies, Baltimore County
Mike O’Leary (Towson University) Advances in Geographic Profiling Applied Geography Conference 30 / 47
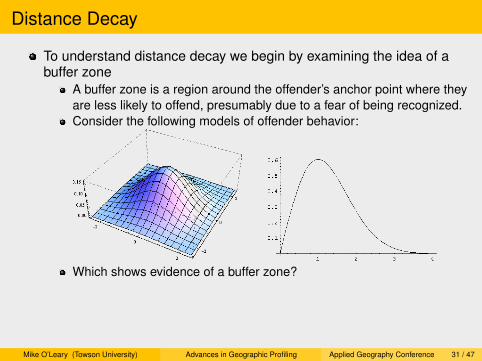
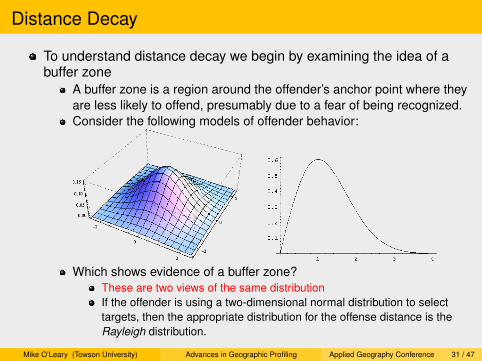
Distance Decay
To understand distance decay we begin by examining the idea of abuffer zone
A buffer zone is a region around the offender’s anchor point where theyare less likely to offend, presumably due to a fear of being recognized.Consider the following models of offender behavior:
Which shows evidence of a buffer zone?
These are two views of the same distributionIf the offender is using a two-dimensional normal distribution to selecttargets, then the appropriate distribution for the offense distance is theRayleigh distribution.
Mike O’Leary (Towson University) Advances in Geographic Profiling Applied Geography Conference 31 / 47

Distance Decay
To understand distance decay we begin by examining the idea of abuffer zone
A buffer zone is a region around the offender’s anchor point where theyare less likely to offend, presumably due to a fear of being recognized.Consider the following models of offender behavior:
Which shows evidence of a buffer zone?These are two views of the same distribution
If the offender is using a two-dimensional normal distribution to selecttargets, then the appropriate distribution for the offense distance is theRayleigh distribution.
Mike O’Leary (Towson University) Advances in Geographic Profiling Applied Geography Conference 31 / 47
Distance Decay
To understand distance decay we begin by examining the idea of abuffer zone
A buffer zone is a region around the offender’s anchor point where theyare less likely to offend, presumably due to a fear of being recognized.Consider the following models of offender behavior:
Which shows evidence of a buffer zone?These are two views of the same distributionIf the offender is using a two-dimensional normal distribution to selecttargets, then the appropriate distribution for the offense distance is theRayleigh distribution.
Mike O’Leary (Towson University) Advances in Geographic Profiling Applied Geography Conference 31 / 47

Distance Decay
Suppose that the (two-dimensional) distance decay componentD(d(x, z) |α) is modeled with a Euclidean distance d
Then the (one-dimensional) distribution of offense distancesDone-dim(d |α) is given by
Done-dim(d |α) = 2πd ·D(d |α)
In particular, Done-dim(d |α)→ 0 as d→ 0, regardless of theparticular choice of D(d |α), provided D(0 |α) <∞.
Mike O’Leary (Towson University) Advances in Geographic Profiling Applied Geography Conference 32 / 47

Distance Decay: Residential Burglaries in BaltimoreCounty
Mike O’Leary (Towson University) Advances in Geographic Profiling Applied Geography Conference 33 / 47
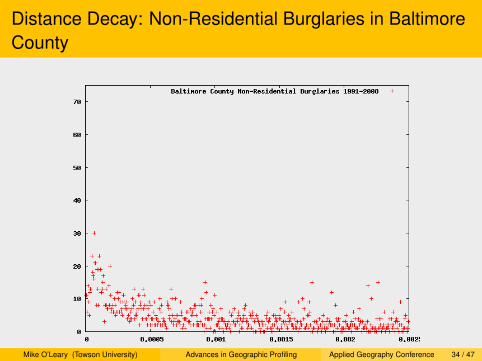
Distance Decay: Non-Residential Burglaries in BaltimoreCounty
Mike O’Leary (Towson University) Advances in Geographic Profiling Applied Geography Conference 34 / 47

Distance Decay: Data Fitting
Suppose that we measure the aggregate number of offenders whocommit a crime at a distance d from their anchor point; call therelative fraction A(d).
Different offenders are willing to travel different distances to offend;π(α) was defined to be the probability distribution for the averageoffense distance across offenders.
Suppose that each offender chooses targets according toDone-dim(d |α)
Then
A(d) =
∫∞0Done-dim(d |α)π(α)dα
A(d) can be sampledDone-dim(d |α) modeledπ(α) is the unknown prior distribution for average offense distance.
Mike O’Leary (Towson University) Advances in Geographic Profiling Applied Geography Conference 35 / 47

Distance Decay: Data Fitting
Suppose that we have a sample {d1,d2, . . . ,dS} from A(d). Then tofind π, we need to solve the integral equation
A(d) =
∫∞0Done-dim(d |α)π(α)dα.
The process of inverting this Fredholm integral equation is ill-posed.
Both A(d) ≈ 0 and Done-dim(d |α) ≈ 0 for d� 0, so we can collocateand discretize the integral equation, and obtain an (ill-posed) linearsystem.
The linear system can be solved via SVD decomposition using aTikhonov regularization; the optimal value of the regularizationparameter can be found via L-curve analysis.
Mike O’Leary (Towson University) Advances in Geographic Profiling Applied Geography Conference 36 / 47

Distance Decay: Residential Burglaries in BaltimoreCounty- Model Fit
Mike O’Leary (Towson University) Advances in Geographic Profiling Applied Geography Conference 37 / 47

Distance Decay: Non-Residential Burglaries in BaltimoreCounty- Model Fit
Mike O’Leary (Towson University) Advances in Geographic Profiling Applied Geography Conference 38 / 47
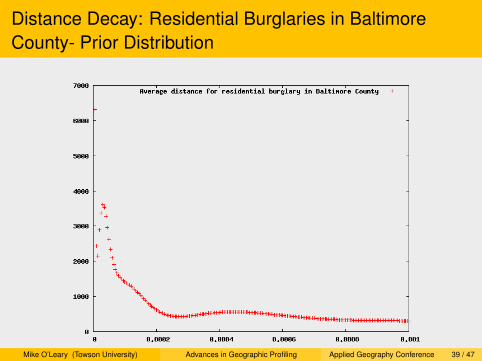
Distance Decay: Residential Burglaries in BaltimoreCounty- Prior Distribution
Mike O’Leary (Towson University) Advances in Geographic Profiling Applied Geography Conference 39 / 47

Distance Decay: Residential Burglaries in BaltimoreCounty- Prior Distribution by Age
Mike O’Leary (Towson University) Advances in Geographic Profiling Applied Geography Conference 40 / 47

Anchor Points
We have assumedEach offender has a unique, well-defined anchor point that is stablethroughout the crime seriesThe function H(z) represents our prior knowledge of the distribution ofanchor points before we incorporate information about the crime series.
What are reasonable choices for the anchor point?ResidencesPlaces of work
Suppose that anchor points are residences- can we estimate H(z)?Population density information is available from the U.S. Census at theblock level, sorted by age, sex, and race/ethnic group.
We can use available demographic information about the offenderSet H(z) =
∑Nblocksi=1 = piK(z − qi |
√Ai)
Here block i has population pi, center qi, and area Ai.Distribution of residences of past offenders can be used.
Calculate H(z) using the same techniques used to calculate G(x)
Mike O’Leary (Towson University) Advances in Geographic Profiling Applied Geography Conference 41 / 47

Washington D.C., 18-29 year old white non-hispanic men
Mike O’Leary (Towson University) Advances in Geographic Profiling Applied Geography Conference 42 / 47

Washington D.C., 18-29 year old white hispanic men
Mike O’Leary (Towson University) Advances in Geographic Profiling Applied Geography Conference 43 / 47

Washington D.C., 18-29 year old black men
Mike O’Leary (Towson University) Advances in Geographic Profiling Applied Geography Conference 44 / 47

Software
Code that implements this method is nearing completion, and will bereleased to police agencies.
Mike O’Leary (Towson University) Advances in Geographic Profiling Applied Geography Conference 45 / 47

Software
Required Input:Crime series locationsRepresentative selection of the locations of historically similar crimes,(as determined by the analyst) to estimate target attractivenessGeographic boundaries of the jurisdiction(s) reporting the crime seriesand historical crimesAvailable demographic information about the offender, if anyLocations of both anchor points and crime sites of historically similarcrimes (as determines by the analyst) to estimate the distribution ofaverage offense distances
The code will then automaticallyCalculate an estimate of the target attractiveness distributionEstimate the prior distribution of anchor points, assuming anchor pointdensity is proportional to population densityEstimate the prior distribution of average offense distances
The code will then return a map giving the probability distribution foroffender anchor points
Available output formats include .kml and .csv, for display and analysisis a wide range of further applications.
Mike O’Leary (Towson University) Advances in Geographic Profiling Applied Geography Conference 46 / 47

Questions?
Mike O’LearyDepartment of MathematicsTowson University
Mike O’Leary (Towson University) Advances in Geographic Profiling Applied Geography Conference 47 / 47