addressing alternative explanations: multiple regression
DESCRIPTION
Addressing Alternative Explanations: Multiple Regression. 17.871 Spring 2007. Gore Likeability Example. Did Clinton hurt Gore in the 2000 election? How would you test this? What alternative explanations would you need to address? - PowerPoint PPT PresentationTRANSCRIPT

Addressing Alternative Explanations: Multiple Regression
17.871
Spring 2007

Gore Likeability Example
Did Clinton hurt Gore in the 2000 election? How would you test this? What alternative explanations would you
need to address?
Other examples of alternative explanations based on omitted variables?

Democratic picture
Clinton thermometer

Independent picture
Clinton thermometer

Republican picture
Clinton thermometer

Combined data picture
Clinton thermometer

Combined data picture with regression
Clinton thermometer

Combined data picture with “true” regression lines overlaid
Clinton thermometer

Tempting yet wrong normalizations
Clinton thermometer
Clinton thermometer
Subtract the Goretherm. from theavg. Gore therm. score
Subtract the Clintontherm. from theavg. Clinton therm. score

Summary: Why we control Address alternative explanations by removing
confounding effects Improve efficiency

Gore vs. ClintonG
ore
the
rmo
me
ter
Graphs by Party (3 point scale)Clinton thermometer
Gore thermometer pyp Fitted values
party3==-1
0
100
party3==0
0 100party3==1
0 100
0
100 Overall
Within party
Rep. Ind.
Dem.

3D Relationship

3D Linear Relationship

The Linear Relationship between Three Variables
iiii XXY ,22,110

The Slope Coefficients
n
ii
n
iii
n
ii
n
iii
n
ii
n
iii
n
ii
n
iii
XX
XXXX
XX
XXYY
XX
XXXX
XX
XXYY
1
2,22
1,22,11
1
1
2,22
1,12
2
1
2,11
1,22,11
2
1
2,11
1,11
1
)(
))((ˆ-
)(
))((ˆ
and )(
))((ˆ-
)(
))((ˆ

The Slope Coefficients More Simply
)var(
),cov(ˆ- )var(
),cov(ˆ
and)var(
),cov(ˆ- )var(
),cov(ˆ
2
211
2
22
1
212
1
11
X
XX
X
YX
X
XX
X
YX
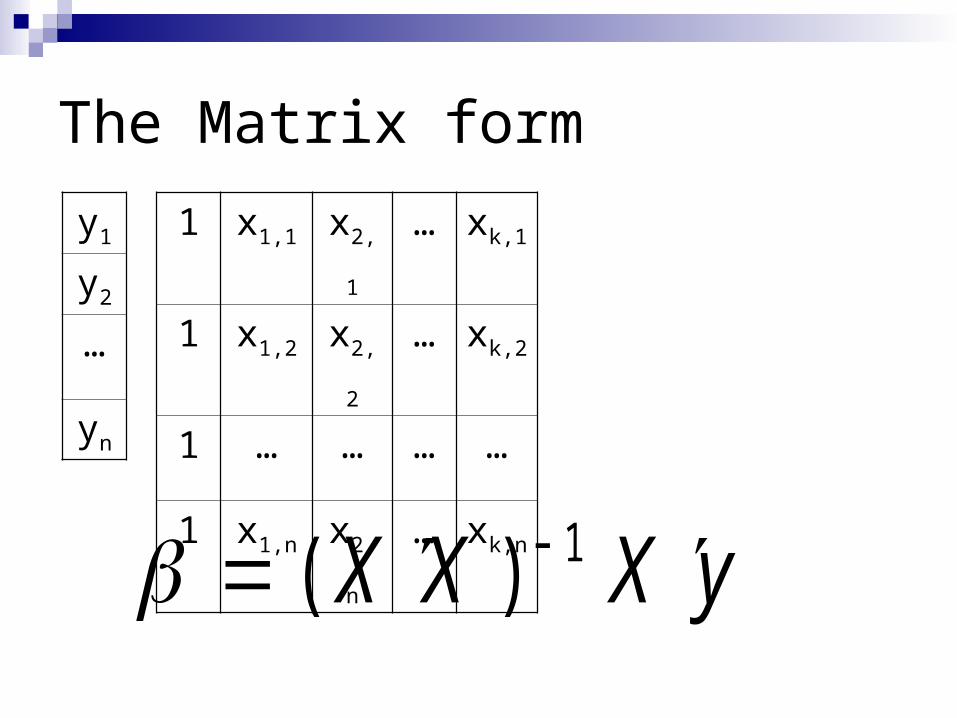
The Matrix form
y1
y2
…
yn
1 x1,1 x2,1 … xk,1
1 x1,2 x2,2 … xk,2
1 … … … …
1 x1,n x2,n … xk,n
( )X X X y1

Consider two regression coefficients
)var(
),cov(ˆ- )var(
),cov(ˆ
vs.)var(
),cov(ˆ
1
212
1
11
1
11
X
XX
X
YX
X
YX
MM
B
When does ? Obviously, when 0)var(
),cov(ˆ1
212
X
XXMMB11
ˆˆ

Separate regressions
(1) (2) (3)
Intercept 23.1 55.9 28.6
Clinton 0.62 -- 0.51
Party -- 15.7 5.8

Why did the Clinton Coefficient change from 0.62 to 0.51
. corr gore clinton party,cov(obs=1745)
| gore clinton party3-------------+--------------------------- gore | 660.681 clinton | 549.993 883.182 party3 | 13.7008 16.905 .8735

The Calculations
5122.0
1105.06227.0182.883
905.167705.5
182.883
993.549
)var(
),cov(ˆ)var(
),cov(ˆ
6227.0182.883
993.549
)var(
),cov(ˆ
21
1
clinton
partyclinton
clinton
clintongore
clinton
clintongore
MM
B
. corr gore clinton party,cov(obs=1745)
| gore clinton party3-------------+--------------------------- gore | 660.681 clinton | 549.993 883.182 party3 | 13.7008 16.905 .8735
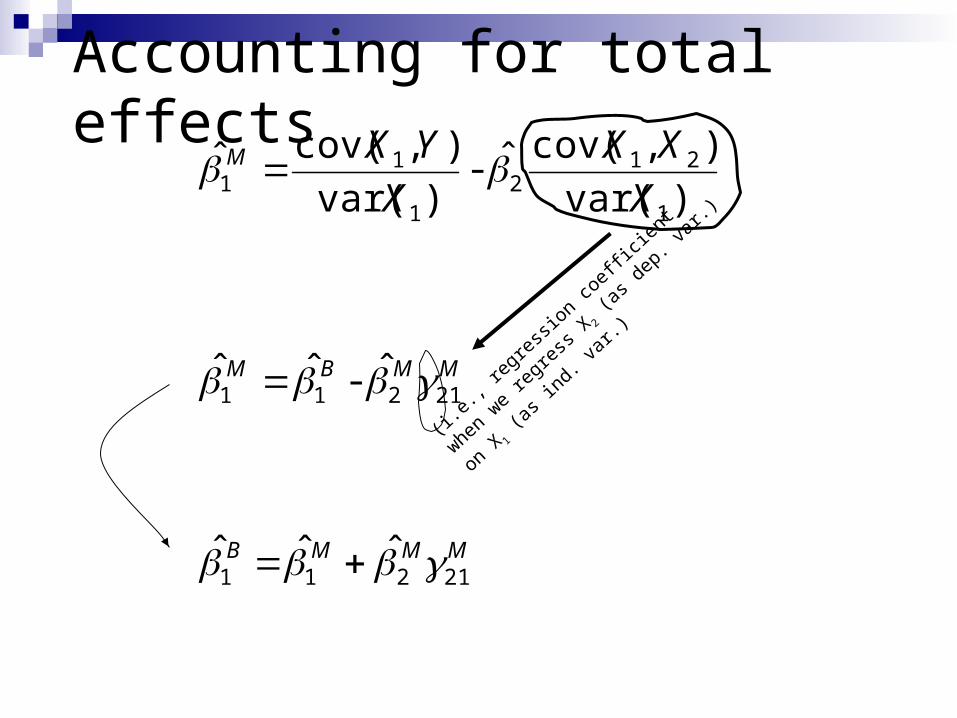
Accounting for total effects
MMMB
MMBM
M
X
XX
X
YX
21211
21211
1
212
1
11
ˆˆ ˆ
ˆ- ˆˆ
)var(
),cov(ˆ- )var(
),cov(ˆ
(i.e.,
regr
essio
n coe
fficie
nt
when w
e reg
ress X
2 (a
s dep
. var.
)
on X 1
(as i
nd. v
ar.)

Accounting for the total effect
21211ˆˆ ˆ MMB
21
Total effect = Direct effect + indirect effect
Y
X1
X2
M2̂
M1
ˆ

Accounting for the total effects in the Gore thermometer example
Effect Total Direct Indirect
Clinton 0.62 0.51 0.11
Party 15.7 5.8 9.9

The Output. reg gore clinton party3
Source | SS df MS Number of obs = 1745-------------+------------------------------ F( 2, 1742) = 1048.04 Model | 629261.91 2 314630.955 Prob > F = 0.0000 Residual | 522964.934 1742 300.209492 R-squared = 0.5461-------------+------------------------------ Adj R-squared = 0.5456 Total | 1152226.84 1744 660.68053 Root MSE = 17.327
------------------------------------------------------------------------------ gore | Coef. Std. Err. t P>|t| [95% Conf. Interval]-------------+---------------------------------------------------------------- clinton | .5122875 .0175952 29.12 0.000 .4777776 .5467975 party3 | 5.770523 .5594846 10.31 0.000 4.673191 6.867856 _cons | 28.6299 1.025472 27.92 0.000 26.61862 30.64119------------------------------------------------------------------------------

Other approaches to addressing confounding effects? Experiments Difference-in-differences designs Others?
Is regression the best approach to addressing confounding effects?Problems
Drinking and Greek Life Example
Why is there a correlation between living in a fraternity/sorority house and drinking?Greek organizations often emphasize social
gatherings that have alcohol. The effect is being in the Greek organization itself, not the house.
There’s something about the House environment itself.

Dependent variable: Times Drinking in Past 30 Days

. infix age 10-11 residence 16 greek 24 screen 102 timespast30 103 howmuchpast30 104 gpa 278-279 studying 281 timeshs 325 howmuchhs 326 socializing 283 stwgt_99 475-493weight99 494-512 using da3818.dat,clear(14138 observations read)
. recode timespast30 timeshs (1=0) (2=1.5) (3=4) (4=7.5) (5=14.5) (6=29.5) (7=45)(timespast30: 6571 changes made)(timeshs: 10272 changes made)
. replace timespast30=0 if screen<=3(4631 real changes made)

. tab timespast30
timespast30 | Freq. Percent Cum.------------+----------------------------------- 0 | 4,652 33.37 33.37 1.5 | 2,737 19.64 53.01 4 | 2,653 19.03 72.04 7.5 | 1,854 13.30 85.34 14.5 | 1,648 11.82 97.17 29.5 | 350 2.51 99.68 45 | 45 0.32 100.00------------+----------------------------------- Total | 13,939 100.00

Three Regressions
Dependent variable: number of times drinking in past 30 days
Live in frat/sor house 4.44
(0.35)
--- 2.26
(0.38)
Member of frat/sor --- 2.88
(0.16)
2.44
(0.18)
Intercept 4.54
(0.56)
4.27
(0.059)
4.27
(0.059)
R2 .011 .023 .025
N 13,876 13,876 13,876
Note: Corr. Between living in frat/sor house and being a member of a Greek organization is .42

The Picture
Drinks per 30 day period
Living in frat house
Member of fraternity
2.44
2.26
0.19

Accounting for the effects of frat house living and Greek membership on drinking
Effect Total Direct Indirect
Member of Greek org.
2.88 2.44
(85%)
0.44
(15%)
Live in frat/ sor. house
4.44 2.26
(51%)
2.18
(49%)