actuarial audit of liabilities, assets, and … · new york city retirement systems actuarial audit...
TRANSCRIPT

New York City Retirement Systems
ACTUARIAL AUDIT OF LIABILITIES, ASSETS, AND EMPLOYER PENSION CONTRIBUTIONS One-Year Lag Valuation Date As of June 30, 2004, for Fiscal Year 2006 Contributions November 30, 2006

THE SEGAL COMPANY One Park Avenue, New York, NY 10016-5895 T 212-251-5000 F 212.251.5490 www.segalco.com
Benefits, Compensation and HR Consulting ATLANTA BOSTON CHICAGO CLEVELAND DENVER HARTFORD HOUSTON LOS ANGELES MINNEAPOLIS NEW ORLEANS NEW YORK PHILADELPHIA PHOENIX SAN FRANCISCO SEATTLE TORONTO WASHINGTON, DC
Multinational Group of Actuaries and Consultants AMSTERDAM BARCELONA GENEVA HAMBURG LONDON MELBOURNE MEXICO CITY OSLO PARIS
November 30, 2006 The Honorable William C. Thompson, Jr. Comptroller of the City of New York c/o The Actuarial Audit Oversight Committee The Office of the Comptroller The City of New York
Re: Actuarial Audit of the New York City Retirement Systems (“NYCRS”)
Dear Comptroller Thompson:
We are pleased to submit this report on the actuarial audit of the New York City Retirement Systems (“NYCRS”). The purpose of the audit was to verify the results of the Fiscal Year 2006 actuarial valuation (based on census data as of June 30, 2004) performed by the Office of the Actuary with regards to the calculation of the NYCRS liabilities, assets and employer pension contributions. It covers the accuracy of the actuarial calculations themselves and our professional judgment with respect to whether the actuarial assumptions and funding methods were appropriately applied in the valuation process.
We received the cooperation of the staff of the Office of the Actuary. That cooperation is greatly appreciated.
In our opinion, the actuarial valuations of the New York City Retirement Systems present fairly, in all material respects, the actuarial position of the NYCRS as of June 30, 2004, for purposes of the Fiscal Year 2006 contribution requirement, in conformity with generally accepted actuarial principles and practices. This report presents our findings and comments that provide the basis for our opinion.
We look forward to meeting with you to discuss this report and any follow-up to it.
Sincerely yours,
Michael J. Karlin, F.S.A., M.A.A.A. Howard Rog, F.S.A., M. A.A.A. Senior Vice President and Actuary Senior Vice President and Actuary
Elnatan Sulimanoff, F.S.A., M.A.A.A. Associate Actuary
11-30-06>6008554v3 - nyc 2nd engagement contribution audit report05902.010>audit report final.doc i
T a b l e o f C o n t e n t s
Actuarial Audit of Liabilities and Assets as of June 30, 2004 for Purposes of Fiscal Year 2006 Employer Pension Contributions November 2006
Section 1: Introduction................................................................................................................ 1
Section 2: Executive Summary .................................................................................................. 2
Purpose of the Audit ............................................................................................................... 3 Variations in Actuarial Results ................................................................................................3 Summary of Findings and Recommendations ........................................................................ 4
Section 3: Analysis of Actuarial Valuation Data, Software, Assumptions and Methods ............. 7
Validity of Actuarial Data and Software................................................................................... 7 Actuarial Valuation Assumptions and Funding Methods......................................................... 8 One Year Lag Methodology.................................................................................................. 10 Timing of Decrements...........................................................................................................11 Progress in Adopting Prior Recommendations .....................................................................11 Miscellaneous Issues............................................................................................................ 12
Section 4: Verification and Analysis of Actuarial Liabilities, Assets and Employer Pension Contributions .............................................................................................................. 19
Tolerance Range .................................................................................................................. 19 Variable Supplements Funds................................................................................................ 20
Section 5: Recommendations .................................................................................................. 21
Tables................................................................................................................................... 22

11-30-06>6008554v3 - nyc 2nd engagement contribution audit report05902.010>audit report final.doc 1
Section 1: Introduction
In January 2005, The Office of the Comptroller of the City of New York retained The Segal Company (Segal) to perform actuarial audits and related services with respect to the following five actuarially-funded New York City Retirement Systems (collectively the NYCRS, “Retirement Systems”, or “Systems”):
• New York City Employees’ Retirement System (NYCERS)
• Teachers’ Retirement System of the City of New York (TRS)
• New York City Board of Education Retirement System (BERS)
• New York City Police Pension Fund (POLICE)
• New York City Fire Pension Fund (FIRE)
The contract covers two consecutive engagements covering two biennial periods. Each engagement is comprised of the following for the five Systems:
(1) An Experience Study which compares actual experience with the assumptions used to calculate pension contributions and comments on the appropriateness of each assumption. The first engagement reviews experience data through June 30, 2003 while the second engagement reviews experience data through June 30, 2005.
(2) An audit of Employer Pension Contributions, which confirms the computations of actuarial assets and liabilities, including the software used, and the appropriateness and legality of the actuarial assumptions and methods used. The first engagement audits Employer Pension Contributions for Fiscal Year 2004 while the second engagement audits Employer Pension Contributions for Fiscal Year 2006.
(3) An Administrative Review which reviews the actuarial valuation data processes and comments on the quality and completeness of the data and financial, actuarial and operational procedures used in the valuations.
(4) An Independent Actuary’s Statement which reviews the entire engagement and comments on the financial condition and financing policies.
This report is the deliverable for the audit of Employer Pension Contributions (“Contribution Audit”) for the second engagement and focuses on verifying the Fiscal Year 2006 contribution requirements determined by the Office of the Actuary (OA), as well as the methods and procedures used in determining those amounts.

11-30-06>6008554v3 - nyc 2nd engagement contribution audit report05902.010>audit report final.doc 2
Section 2: Executive Summary
This report presents the results of our Contribution Audit of the New York City Retirement Systems (NYCRS). Our review included an examination of the actuarial work conducted by the OA.
The following five major Systems were included in the audits that we performed: New York City Employees’ Retirement System (NYCERS) Teachers’ Retirement System of the City of New York (TRS) New York City Board of Education Retirement System (BERS) New York City Police Pension Fund (POLICE) New York City Fire Pension Fund (FIRE)
The audit of NYCERS included each of the participating employer subgroups which comprise the aggregate active employee population (current and former) of NYCERS, as follows:
Corrections District Attorney Investigators (DAI) Emergency Medical Technicians (EMT) Fire Alarm Dispatchers (FAD) General city employees Housing Police and Transit Police (HPTP) Sanitation Special officers, deputy sheriffs and auto mechanics Transit Triborough Bridge and Tunnel Authority (TBTA)
In addition, audits of the following Funds were also conducted: Police Officers’ Variable Supplements Fund Police Superior Officers’ Variable Supplements Fund Firefighters’ Variable Supplements Fund Fire Officers’ Variable Supplements Fund Housing Police Officers’ Variable Supplements Fund Housing Police Superior Officers’ Variable Supplements Fund Transit Police Officers’ Variable Supplements Fund Transit Police Superior Officers’ Variable Supplements Fund Correction Officers’ Variable Supplements Fund

11-30-06>6008554v3 - nyc 2nd engagement contribution audit report05902.010>audit report final.doc 3
Purpose of the Audit
For purposes of the Contribution Audit, Segal conducted a thorough review of the following issues to provide assurance that:
The data used for purposes of the actuarial valuation is acceptable and consistent with the data used for the Experience Study. In a separate Administrative Review report, we focus more closely on the consistency between the processed valuation data and the raw data provided by the Retirement Systems.
The actuarial work for determining the Systems’ liabilities, assets, and employer contribution requirements is being carried out correctly, reasonably and within the bounds of generally accepted actuarial principles and practices.
The actuarial methods and assumptions used in the valuation process are consistent with those adopted by the Boards of Trustees of the various Systems and/or promulgated by the State legislature*.
The software used by the OA for the valuation produces acceptable results.
Progress has been made in adopting the recommendations of the prior actuarial auditor.
In addition, Segal is providing comments and recommendations that the City and the OA should consider regarding the valuation methods and processes.
Our analysis was limited to the actuarial matters described above. We have not explored legal, tax, accounting, benefit entitlement or other matters that go beyond our assignment or areas of expertise.
Variations in Actuarial Results
We note that it is not surprising that different actuaries will arrive at liability and contribution requirements that differ in minor respects. These differences may be due to variations in computer programs, methodologies, and valuation and data procedures that can vary from organization to organization but that are still reasonable. Therefore, we established what we considered to be acceptable tolerance ranges for variations in the results. These tolerance ranges were applied to various categories of liabilities within each System as well as to the total amounts for each System. We also applied these tolerance ranges to the Variable Supplements Funds. Section IV of this report describes the tolerance ranges that we used and, along with showing the results of our calculations compared to the results of the OA, showed that the differences were all within (i.e., “Passed”) the acceptable tolerance ranges.
* The Actuary proposed changes to actuarial assumptions and methods effective for Fiscal Years 2006 and later. The Boards of Trustees of each System adopted the assumption changes requiring their approval and the State Legislature and Governor enacted those changes to assumptions and methods requiring legislation.

11-30-06>6008554v3 - nyc 2nd engagement contribution audit report05902.010>audit report final.doc 4
Summary of Findings and Recommendations
Overview
One of the major facets of our Contribution Audit was to verify that the valuation results obtained by the OA are accurate, within the parameters established for variations in results described in Section IV. Our conclusions are supported by the detailed tables included in this report, and demonstrate that the OA’s valuation results for Fiscal Year 2006 are accurate (as defined by the parameters described), and completely represent the information required to determine the Systems’ contribution requirements. During the course of our working with the OA, we had the opportunity to meet with and work closely over an extended period with many of their staff. We also were provided with pertinent plan provisions and financial information needed to learn about the pension programs (e.g. SPD’s, CAFR’s, VSF audited reports, etc.), in addition to internal resources developed by the OA to facilitate the valuation process (e.g. concise benefit summaries, worksheets developing certain liabilities, etc.). The OA also provided an orientation of its own detailed valuation software output for individual testcases, which we used to compare to our own valuation software. Our conclusion in all our dealings with the OA is that they operate in a highly professional and competent manner, meeting and/or exceeding the actuarial professional standards we’ve observed among professional service firms. In addition, they were courteous, cooperative and accommodating. Our favorable impression of the OA and its staff assisted in allowing us to complete our assignment.
Validity of Actuarial Data
As part of its data validation measures, Segal independently used the designated codes for determination of participant status, benefit plan category, Tier, and cause of retirement, and successfully matched the OA’s participant counts in each particular category. Participant counts determined by both Segal and the OA are shown in the “Tables” section of the report. In addition, various reasonability checks were performed and the OA’s data validations were reviewed. Based on these tests, we believe that the data is valid for the purpose of preparing the actuarial valuations.
Accuracy of Actuarial Valuation Results
We were able to independently replicate closely (within the acceptable tolerance ranges) the actuarial valuation results provided to us by the OA. Thus, we conclude the OA is following their stated assumptions and procedures. Shown below is a summary of those results for the five major Systems. Additional details and breakdowns are provided in the “Tables” section of this report:

11-30-06>6008554v3 - nyc 2nd engagement contribution audit report05902.010>audit report final.doc 5
Liability
($ millions) Employer Contribution Requirements
($ millions)
System OA Segal Percent
Difference OA Segal Percent
Difference
NYCERS TRS BERS POLICE FIRE
$50,839 48,081 2,748
29,589 12,219
$51,043 48,019 2,767
29,494 12,216
0.4% (0.1) 0.7 0.0 0.0
$1,024 1,317
91 1,338
609
$1,039 1,288
90 1,320
599
1.5% (2.2) (1.1) (1.3) (1.6)
Total $143,476 $143,539 0.0% $4,379 $4,336 (1.0%)
Actuarial Valuation Assumptions and Funding Methods
The actuarial assumptions used by the OA are consistent with those adopted by the Boards of Trustees of the various Systems and with generally accepted actuarial principles and practices.
The Frozen Initial Liability (FIL) actuarial cost method is used by the OA for the purpose of determining liabilities and funding requirements. Outstanding balances of Unfunded Actuarial Accrued Liability (UAAL) are amortized over a closed time period in level dollar amounts or in fixed rate of increase installments. The assets used for funding are based on a six year smoothing method which immediately recognizes investment returns equal to the plan’s assumption, and phases in excess/deficit returns above/below the assumption over a six year period.
One-Year Lag Methodology
The Fiscal Year 2006 contribution is the first which is calculated based on the One-Year Lag Methodology, a methodology required by a recent amendment to the ACNY and Education Law. Under this methodology as applied to the Fiscal Year 2006 contribution, actuarial assets and liabilities, as well as other valuation measures, are determined as of June 30, 2004, with certain adjustments made in order to actuarially determine the appropriate contribution requirement for Fiscal Year 2006. The details of the adjustments made to the June 30, 2004 results are described in Section 3.
Progress in Adopting Prior Recommendations
The prior auditor completed an Experience Study containing recommendations for certain changes to the actuarial assumptions used for determining the Systems’ funding requirements. These recommendations formed the foundation of a proposed set of assumptions by the OA, which were approved by the individual Boards of Trustees of each Retirement System and enacted by the State Legislature and Governor (as per applicable requirements). The Fiscal Year 2006 contribution is based on actuarial calculations which fully reflect these adopted assumptions,

11-30-06>6008554v3 - nyc 2nd engagement contribution audit report05902.010>audit report final.doc 6
and Segal’s independent, parallel calculations shown in the “Tables” section of this report also incorporated all of these assumptions.
The prior auditor also made recommendations with respect to the OA’s valuation processes, methods and data. The OA has implemented a number of these recommendations. Others have either been partially implemented, or the OA has determined that they are not currently feasible and/or not significant.
Recommendations
Section IV of the report contains our recommendations based upon the audit that we performed.

11-30-06>6008554v3 - nyc 2nd engagement contribution audit report05902.010>audit report final.doc 7
Section 3: Analysis of Actuarial Valuation Data, Software, Assumptions and Methods
Validity of Actuarial Data and Software
A vital input item for the actuarial valuations is the census of participant data maintained by the Systems and transmitted to the OA. In addition, there are important components of the actuarial data which are directly developed or estimated by the OA because either they depend entirely on previous years’ valuation data maintained by the OA, or because they are not available conveniently or in a timely manner, from the Retirement Systems. As part of its separate administrative review, Segal researched the accuracy, efficiency, and technology considerations applicable to the steps and procedures which are followed by the OA and individual Retirement Systems in order to transmit required valuation data elements from the Systems to the OA. The findings and recommendations of this research are included in a separate administrative review report. From the perspective of the Contribution Audit, data auditing and verification was limited to the following:
1. Review the data validations and checks performed by the OA for the purpose of generating the final valuation data files. A comprehensive description of these validation checks is laid out in the OA’s “Valuation Data Procedures” document, which we were provided for each Retirement System. For the purpose of this Contribution Audit, we assessed completeness, appropriateness and soundness of professional judgment with respect to the validation rules and tolerance thresholds adopted by the OA in its data processing work. We generally agree with the steps taken by the OA to ensure the accuracy and completeness of the data provided by the Retirement Systems. A separate Administrative Review report provides our assessment of how well the OA and the Systems work together to practically implement the data procedures and validation checks described in the OA’s “Valuation Data Procedures” document.
2. Perform aggregate reasonability checks on key demographic statistics such as age, sex, and service by ensuring that the corresponding valuation data items affecting these statistics did not deviate beyond reasonable levels from prior years’ valuation data. We applied these checks to the June 30, 2004 census data, and confirmed the reasonableness of the relevant statistics as described.
3. Many NYCRS benefits involve contribution account balances which are not available from the individual Systems within enough time to be used for the actuarial valuations, and are therefore estimated by the OA based on the contribution and interest credit formulas governing them, as well as the prior year’s balance. We verified that the 6/30/2004 account
11-30-06>6008554v3 - nyc 2nd engagement contribution audit report05902.010>audit report final.doc 8
balances provided in the OA’s data files were consistent and reasonable in relation to the corresponding balances shown on previous years’ valuation data.
One other important data auditing procedure we undertook was to ensure the consistency of the data used for the Contribution Audit with the data used for the Experience Study. Although this aspect of the audit was carried out as part of the Experience Study, it is worth mentioning that prior to generating our Experience Study results, we confirmed that the basic demographic statistics reflected in the Experience Study data as of 6/30/2004 matched (notwithstanding a reasonable degree of difference considering the different source files) the corresponding demographics reflected in the valuation data.
For purposes of our review and audit of the valuation software employed by the OA, we requested and received detailed pension actuarial valuation calculations for a number of employees in each of the Systems. For these individuals, we generally matched (within reasonable differences) our detailed actuarial valuation results, which reflected our understanding of the Systems eligibility and benefit provisions, with the OA’s corresponding results. Therefore, based on this individual testing of results combined with the matching of the actuarial valuation results by groups and in total (within the acceptable tolerance ranges) we validated the software being used by the OA.
While the results were within acceptable differences, the following paragraphs describe some of our findings concerning the software and methods being utilized.
Actuarial Valuation Assumptions and Funding Methods
The actuarial assumptions used by the OA are reasonable and are consistent with actuarial experience and with generally accepted actuarial principles and practices.
The Frozen Initial Liability (FIL) actuarial method is used by the OA for determining liabilities and funding requirements. As an observation, based on recent survey information, about 5% of large governmental pension plans use this funding method. In comparison, about 75% of such plans use the Entry Age Normal (EAN) funding method, 10% use the Aggregate method and 10% use the Projected Unit Credit (PUC) method. However, the FIL method is reasonable and appropriate for funding the liabilities of the Systems as it provides that the retirement benefits earned by the covered members are funded for over their aggregate working careers and not beyond. That is, under FIL there is preservation of intergenerational equity, which is often lost when using other cost methods, if such cost methods are combined with the use of long amortization periods.
Under the FIL method, actuarial gains and losses (difference of actual emerging experience from that assumed) are reflected in the employer normal cost. The employer normal cost is determined by spreading the unfunded present value of future benefits (net of any unfunded actuarial accrued liability and future employee contributions) over the future working lifetime of the active participants as a level percent of pay.

11-30-06>6008554v3 - nyc 2nd engagement contribution audit report05902.010>audit report final.doc 9
Many large governmental Retirement Systems operate with some level of unfunded actuarial accrued liability (UAAL). The UAAL under the FIL method can exist for reasons such as a decision to recognize past service for benefit purposes, when benefit increases are adopted or when a change in the actuarial assumptions or methods occurs.
The five major New York City Retirement Systems fund UAAL over closed time periods, either in level dollar amounts or in installments which increase annually at a fixed rate. For purposes of the Fiscal Year 2006 contribution, the payment from the original amortization schedule due as of June 30, 2005 is applied for each System’s contribution requirement. As of Fiscal Year ending June 30, 2006, POLICE had no outstanding UAAL amortization payments due. FIRE consolidated its UAAL as of June 30, 1999 based on updated actuarial assumptions and assets, using an 11 year increasing amortization schedule at a 3%/year increase rate. There are 4 years left on this schedule after Fiscal Year ending June 30, 2006. NYCERS, TRS and BERS established new UAAL amounts in Fiscal Year 2003, and are amortizing these amounts over 5 years in level installments. There are 2 years remaining on this amortization schedule for each System affected, following payment of the Fiscal Year 2006 amortization amount. NYCERS also established a new UAAL amount in Fiscal Year 2001; the final amortization to fund that amount was applied for the Fiscal Year 2006 contribution. The amortization periods as well as the payment schedules adopted for each of the NYC Retirement Systems are reasonable.
One-Year Lag Methodology
In accordance with a recent amendment to the Administrative Code of New York, the OA calculated the Fiscal Year 2006 contribution based on the One-Year Lag Methodology, and this was the first fiscal year which employed this methodology. Under this methodology , the actuarial values which underlie the FY’s contribution, including the census population used in the valuation, actuarial value of assets and liabilities, and present value of future salaries, are calculated as of the end of the second Fiscal Year prior to the year for which the contribution is determined. Therefore, the valuation date used for the Fiscal Year 2006 contribution was June 30, 2004. Additionally, in order for the contribution amount determination under this method to actuarially correspond to the Fiscal Year following the valuation date, certain adjustments to some of the key valuation components needed to be made:
The present value of future normal costs at June 30, 2004 is reduced by the discounted value of the Fiscal Year 2005 employer contribution;
The present value of future salaries was reduced by the value of salaries projected to be paid in Fiscal Year 2005;
The salary which is multiplied by the normal cost percentage is the salary projected to be paid in Fiscal Year 2006 to the participants on payroll as of June 30, 2004.
The result of the above adjustments is that a valuation date of June 30, 2004, reflecting actual investment and demographic experience through that date, is used to determine the contribution

11-30-06>6008554v3 - nyc 2nd engagement contribution audit report05902.010>audit report final.doc 10
requirement for Fiscal Year 2006, with assumed payment of such contribution the middle of the Fiscal Year.
Asset Valuation Method (AVM)
The selection of an asset valuation method involves balancing smoothing investment returns and being responsive to changes in market value. The most responsive method is market value, but that comes with significant volatility in the contribution requirements. Other methods have varying degrees of smoothing, but will be below market values in times of favorable markets and above market values in times of unfavorable investment returns. The Systems fresh started the actuarial value of assets at market value as of June 30, 1999. Since then, the Systems use for purposes of the actuarial value of assets a smoothing methodology which uses the assumed investment return and spreads the investment gains or losses in excess/below the assumed return in any Fiscal Year over future Fiscal Years. For purposes of the 2006 Fiscal Year contribution determination, the AVM was changed to a method which reset the actuarial value of assets to market value (i.e. market value restart) as of June 30, 1999. As of each June 30 thereafter the AVM recognizes investment gains or losses greater or less than expected over a period of six years.
Under this revised AVM, any unexpected investment returns for Fiscal Years 2000 and later are phased into the actuarial value of assets beginning the following June 30 at a rate of 15%, 15%, 15%, 15%, 20% and 20% per year (or cumulative rate of 15%, 30%, 45%, 60%, 80% and 100% over a period of six years). These revised averaging factors were applied against the unexpected investment returns computed under the prior five-year AVM used for Fiscal Years 2000 to 2004.
The revised AVM was utilized for the first time in the June 30, 2004 (Lag) actuarial valuation to determine the Fiscal Year 2006 Employer Contributions in conjunction with the One-Year Lag Methodology and the revised actuarial assumptions and methods.
Note, the unexpected investment return which occurred in Fiscal Year 2006 will be spread over a period beginning with Fiscal Year 2006 using the above averaging factors. The AVM as of June 30, 2006 will be used to determine Fiscal Year 2008 employer contributions.
The assumed return asset smoothing method is a common method both in the public and private sectors. In the majority of cases, investment gains or losses under this type of method are spread over five years. The OA however, uses a six year smoothing period combined with a moderate step-rate approach (e.g. 15% for each of the first four years and 20% for each of the last two years), in order to make budgeting of each Fiscal Year’s result less volatile. We find the use of the assumed return asset smoothing method in conjunction with using a slightly graded schedule for recognizing excess or deficit returns to be reasonable, and the AVM to be appropriate for the NYCRS.

11-30-06>6008554v3 - nyc 2nd engagement contribution audit report05902.010>audit report final.doc 11
Timing of Decrements
As discussed in the previous section, the OA determined the Fiscal Year 2006 contribution under the One-Year Lag Methodology as if paid in the middle of the Fiscal Year. In addition, the OA uses mid-year decrements for determining the Systems’ liabilities to reflect that deaths, disabilities, terminations and retirements occur continuously throughout the year.
The OA also uses mid-year decrements for purposes of determining the Present Value of Future Salaries (PVFS). In Segal’s first engagement audit, the Fiscal Year under audit (2004) was not based on the One-Year Lag Methodology. It was pointed out in our prior report that under the previous method, an inconsistency is introduced in the normal cost calculation due to the difference in the timing of payments associated with the PVFS and annual payroll components of the calculation. However, under the current One-Year Lag Methodology first implemented for FY 2006, the inconsistency due to decrement timing in the normal cost calculation is removed. The PVFS and the projected payroll in Fiscal Year 2006 are consistent with each other and the general mid-year decrement methodology used by the OA. As a result, the employer contribution determined corresponds to the OA’s method as well as the actual timing of the contribution payment, which is the middle of the Fiscal Year.
Progress in Adopting Prior Recommendations
After thoroughly reviewing the previous auditor’s recommendations, and in conjunction with his own modifications to these recommendations, the Chief Actuary proposed a new set of actuarial assumptions and methods for all of NYCRS. The Boards of Trustees of each Retirement System approved the OA’s proposals, and the Fiscal Year 2006 contribution for each system fully reflects these assumptions (adopted by the Boards of each System or enacted by the State Legislature, as required). A detailed explanation of each actuarial assumption used by the OA for FY 2006 employer contributions (and later) can be found in the NYCRS August 2005 reports proposing changes in the actuarial assumptions and methods for determining employer contributions for fiscal years beginning on and after July 1, 2005 (“August 2005 Reports” or “Gold Books”), published by the OA.
In addition, the prior auditor had made recommendations for the OA to consider implementing with respect to their valuation processes, methods and data. The OA has implemented a number of these recommendations. Listed below are those that the OA has either partially implemented or which the OA has determined are either not currently feasible (e.g. data not available) and/or not significant:
Conducting a study of active member marital status to determine the appropriateness of the active member percent married assumption;

11-30-06>6008554v3 - nyc 2nd engagement contribution audit report05902.010>audit report final.doc 12
Expanding the valuation data base to include part time service rendered prior to the full time service date currently reflected in the data; expanding the valuation database to reflect breaks in service;
Implementing a future part-time service assumption for BERS;
Reconciling the disparity between the BERS assumption for future Tier 2-4 retirees electing Death Benefit #2, and the actual observed number of retirees entitled to this benefit; this would entail either revising the assumption to more closely match observed experience, or to refine the method of determining entitlement of current retirees to Death Benefit #2;
Adopting an assumption for future service buy backs, especially for POLICE;
Preparing annual valuation reports for each System (currently, the OA prepares valuation reports for POLICE and FIRE only).
Miscellaneous Issues
In the course of our performing the audit, we found the following items. Since our overall results closely replicated those of the OA, these items are not likely significant. We have indicated them for further investigation by the OA.
General Software and Methodology Issues
1. “Active Inactives”: For each Retirement System, the OA values liabilities for a group of participants not on active payroll at the valuation date, referred to as “Active Inactives,” using an accumulated benefit obligation (ABO) valuation methodology. Benefit service and salary are not projected, and non-service related benefits are prorated based on frozen service as compared with service that would have been projected for a regular active participant. We suggest the following with respect to the OA’s valuation of “Active Inactives:”
a. The ABO prorate methodology used by the OA has been internally discussed by the OA as well as prior auditors. Certain aspects of this methodology may be reconsidered, such as the service prorates applied to non-service benefits. As indicated in the liability comparison schedules shown in the “Tables” section of this report, “Active Inactive” liabilities are generally small relative to the total System liability (see Tables 1A-I.b, 2A-I.b, 3A-I.b, 4A-I.b, and 5A-I.b for each System’s “Active Inactive” liability); therefore, differing valuation methodologies used to value the “Active Inactive” group does not significantly impact the overall liability for the System. However, we suggest the OA consider modifying certain aspects of the methodology in order to more closely resemble the valuation of an active participant with level salary and level service.
b. The OA uses a salary scale assumption which reflects assumed increases in salary due to longevity. However, the longevity increases do not get reflected in projected Final Average Pay (FAP) benefits until the member is projected to have 20 years of service.

11-30-06>6008554v3 - nyc 2nd engagement contribution audit report05902.010>audit report final.doc 13
This is accomplished in the valuation through the use of FAP adjustment factors, which the OA also uses to value “Active Inactive” members. Since “Active Inactive” members are not assumed to get future salary increases, we recommend the OA discontinue the use of FAP longevity adjustment factors in the valuation of “Active Inactive” members.
2. $50,000 Term Life Insurance Benefit: The first $50,000 of retirement plan death benefits are paid from a separate account and the OA determines an allocation of the annual contribution payable to this account. The issue of whether to include accidental deaths in this allocation was raised with the OA. Currently, the OA only includes ordinary death in this allocation. While this issue does not impact the Employer Contribution, the OA has agreed to research whether accidental death benefits are actually paid from this account, which would dictate the methodology to be used.
3. Transfer Liability: When an individual transfers between Systems, there’s a residual liability left in the original system representing the accrued benefit earned for his or her employment in that System. This is called a transfer liability and is calculated for each System. The OA currently computes this liability using a sampling methodology, whereby the liability for the entire group of transfers is estimated based on the calculated liability of a subset of the transfer group. For purposes of the Contribution Audit, we used the transfer liability calculated by the OA for each System (see Tables 1A-I.d, 2A-I.d, 3A-I.d, 4A-I.d, and 5A-I.d for each System’s transfer liability). We suggest the OA refine the accuracy of liability calculations for transfers by using an individual life valuation approach, including all members who have transferred. However, since the transfer liability is relatively small, continuing the use of a sampling methodology for this small group does not materially alter the valuation results.
4. Timing of Annuity Payments: The OA assumes a continuous payment stream instead of monthly payments. This results in a small liability difference from our calculations.
5. Pensioner Joint and Survivor Payments: In previous discussions with the OA, we pointed out that those retirees who had payment types with “miscellaneous fractions or amounts” payable to the surviving beneficiary were not being correctly valued. It was determined that this was because certain payment option information fields which were only recently added to the data may not have been incorporated into the Buck valuation system. Although this issue affects very few retirees (since most NYC retirees do not elect this option), we suggest the OA work with Buck to keep their valuation programming current with data enhancements achieved by the OA.
6. Deferred Vested Member Valuation Issues: We raised the following issues with the OA, and we recommend that they be researched and corrected, if appropriate. However, we caveat this by noting that significant liability discrepancies found for this status of participants is mitigated by the fact that they represent a small part of the total liability, as indicated by the liability comparison schedules shown in the “Tables” section of this report,

11-30-06>6008554v3 - nyc 2nd engagement contribution audit report05902.010>audit report final.doc 14
and therefore do not fail the overall threshold test used for comparing liabilities (see Tables 1A-I.c, 2A-I.c, 3A-I.c, 4A-I.c, and 5A-I.c for each System’s deferred vested members’ liability):
a. Based on test cases provided, the OA does not appear to value COLA for this group, although our understanding of the plan is that COLA should be valued;
b. A portion of the NYCRS plan benefits comes from the accumulated contribution account balances which are funded both by the member and by NYC (NYC funded balances are called Increased Take Home Pay, or ITHP balances). The amount by which these balances exceed or fall short of pre-determined target levels is converted into an annuity based on assumptions specified in the plan. These annuities are added to or are subtracted from the base benefits offered by the plan. In the OA’s valuation, the actuarial assumptions used to convert contribution account balances into annuities are not consistent for deferred vested members as compared with active members. For example, for POLICE and FIRE, a “best-of-3” assumption set is applied for actives with membership date before 8/19/1985, whereas only one unisex mortality assumption basis is used for those with membership dates on or after 8/19/1985. By contrast, deferred vested members were valued based on a different membership cutoff date.
System Specific Methodology Issues – POLICE and FIRE
1. Dual Overtime Assumption: This assumption applies to the final year of pay preceding a service retirement or disability retirement. For the Final Average Pay (FAP) portion of the benefit applicable to service less than 20 years, the additional overtime load should be applied to all prior years of service, since FAP plans apply a final pay (or average pay) to all years of service. This is consistent with the methodology used by the OA. However, the POLICE and FIRE plans include an additional Career Average (CA) benefit which begins to accrue after 20 years of service. The OA accumulates this CA benefit by including the dual overtime load in each year’s accrual, even though it should only be included in the year prior to decrement. We suggest the OA modify the way it handles the overtime load with respect to the development of the career average retirement and disability benefits for POLICE and FIRE.
2. Annuity Versus Pension Fund Liabilities: Although our pensioner calculations of fixed dollar benefit liabilities match closely to the OA’s in total (see Table 4a and Table 5a of the “Tables” section of this report), we do come up with differences in the allocation of the total liability between the annuity and pension funds for POLICE and FIRE. The allocation of the total pensioner liability for each System between the annuity and pension funds has no impact on the employer contribution. In previous discussions with the OA, it was suggested that the discrepancy might be related to a special allocation adjustment made for a subgroup of POLICE and FIRE retirees called “Non-finalized Retirees” included in the valuation. Non-finalized retirees are provided pension benefits in only one field, with no breakdown

11-30-06>6008554v3 - nyc 2nd engagement contribution audit report05902.010>audit report final.doc 15
for pension versus annuity benefits. In order for the auditor to be able to apply the correct allocation for this group, additional information would need to be supplied to the auditor regarding the allocation. We suggest that the OA consider including the necessary additional information needed by the auditor to apply this adjustment to the pensioner liability for future audits. No additional effort is recommended for the purpose of the FY 2006 audit, since as mentioned, the allocation issue is only one of presentation, but does not affect the employer contribution.
System Specific Methodology Issues – TRS and BERS
1. Conversion Loss Factors for Variable Fund Benefits: TRS and BERS allow participants to invest a portion of their retirement benefit dollars in variable fund accounts, which gives participants the opportunity for investment exposure to the stock market, and also provides protection against inflation. Participants are also given the option to transfer between their fixed and variable retirement accounts after their initial allocations are made. The OA accounts for this option by applying actuarially determined loss factors to the total variable account balances and adding the result to the total plan liabilities. The basis of the loss factors is the difference in the mortality assumption used to annuitize the variable accounts, as compared with the mortality assumption used for the valuation. The loss factors are a function of the likelihood that participants will transfer their variable accounts to fixed accounts, and the distribution of pension payment option types and male/female participants within the pensioner population. The current conversion factors used by the OA are based on assumed conversion election rates and retiree payment option and sex demographics as of 6/30/1999. We recommend the OA implement a regular cycle of three to five years for the review of the underlying demographics and assumptions affecting the determination of the conversion loss factors and for updating these factors as is appropriate.
2. “Maximum Benefit” for Pop-up Option: The key purpose of the “Maximum Benefit” for the valuation is for the base level on which COLA amounts are computed. The law requires that COLA be calculated based on the Fixed Account “Maximum Benefit” as of retirement. In TRS and BERS, due to the option to transfer funds between the fixed and variable accounts, the Fixed Account “Maximum Benefit” at retirement may not be the same as the current Fixed Account “Maximum Benefit”. The OA currently only carries the field for the “Maximum Benefit” at retirement, for purposes of COLA calculations, but not the current level as of the valuation date. The current level of the “Maximum Benefit” would be used as the pop-up amount that would be payable should a pensioner’s beneficiary predecease him/her. In discussions with the OA, the OA agreed that a refinement in their data collection process for the future would be to request “Maximum Benefit” levels both as of retirement as well as the valuation date for TRS and BERS. In terms of impact on the liability, there are relatively few pensioners who elect the pop-up option. In addition, much of the liability overstatement or understatement that results in the Fixed Account for these pop-up pensioners is offset by a similar and opposite over/understatement in the Variable Account. This is because the transfer of funds between the variable and fixed accounts causes a

11-30-06>6008554v3 - nyc 2nd engagement contribution audit report05902.010>audit report final.doc 16
discrepancy between the two “Maximum Benefit” levels of each account that is equal and opposite. Therefore, this issue is more relevant to the allocation of the liability between the fixed and variable funds than it is to the total liability attributable to both funds.
3. Beneficiary COLA Liability: The detailed liability comparisons below show a significant difference in beneficiary COLA liability between our results and those of the OA. This was discussed in detail during meetings with the OA, and analysis of test case information provided indicates that there are issues with how the OA processes the valuation data for the beneficiary of a deceased retiree. An explanation supported by the test cases, which explains the higher OA liability for this category, is that the OA values a joint life record for the deceased retiree and beneficiary, as if the retiree has not yet died. We recommend that the OA look into its process for converting beneficiary data for the valuation, specifically for COLA, in order to properly value only the beneficiary once the retiree is deceased. We also note that despite the issues raised, the beneficiary COLA liability difference was still acceptable within the tolerance threshold parameters set out in this report.
4. COLA Commencement for Recent Retirees: In addition to the issue noted in the previous item relating specifically to beneficiaries, the liability comparisons below show a larger overall discrepancy in the COLA liability for TRS and BERS as compared with the other Systems. Our research into this issue has shown that the OA uses an earlier COLA commencement date for recently retired TRS and BERS members than what would seem appropriate based on the plan’s COLA provision. Our understanding is that COLA increases do not begin until the participant is either 55 and retired for at least 10 years, or 62 and retired for 5 years, whichever is earlier. Testcase information we have received shows that the OA values COLA increases for TRS and BERS recent retirees earlier than the expected commencement date. Ultimately, this difference in Segal and the OA’s valuations does not produce a material difference, as demonstrated by the threshold tests included later in this report. However, we point this out as an area for future refinement in the valuation.
System Specific Methodology Issues – NYCERS
1. “Active Inactive” Accrual Rates: Some of the NYCERS benefits involve benefit accrual rates which depend on service. For such cases involving “Active Inactives”, the OA applies the accrual rate that would be applicable at the projected eligibility age (including future eligibility service). Since for “Active Inactives” the OA assumes level service credit in the valuation’s projection of future benefits, it may be argued that the benefit accrual rate which is dependent on service should also be projected to remain the same, based on current service as of the valuation date. For purposes of our audit, we conformed our valuation methodology to that of the OA, and we point out the relatively small magnitude of the “Active Inactive” liability compared to each System total (see Table 1A-I.b).
2. Deferred Retirement Benefit for NYCERS Tiers 1/2 General Employees: Our understanding of the benefit provisions for general NYCERS employees is that Tiers 1/2

11-30-06>6008554v3 - nyc 2nd engagement contribution audit report05902.010>audit report final.doc 17
deferred retirees with less than 25 years of service at termination receive the ISF (Increased Service Fraction) benefit formula, regardless of the plan they could have received had they remained active until retirement eligibility. However, test cases provided by the OA show that deferred retirement benefits, like service retirement benefits, are based on the service retirement plan type under which the member is covered, which includes more generous plan types than the ISF plan (e.g. the Career Pension Plan and the 55/25 modified Career Pension Plan). We modeled our liability calculations based on our understanding of the NYCERS plan provisions, and thus our vested withdrawal decrement liability for general NYCERS employees in Tiers 1/2 is significantly less than the OA’s. As indicated in the liability comparison schedules shown in the “Tables” section of this report (see Table 1A(V)-I.a), the overall impact of this difference is small relative to the total active liability, since Tiers 1/2 are small compared to Tiers 3/4, and because the withdrawal decrement’s liability is small relative to the total active liability. However, we still bring this to the OA’s attention for the purpose of refining the valuation in the future.
3. Deferred Retirement Benefit for NYCERS Members in Physically Taxing Positions: Our understanding of the NYCERS plan provisions is that there is a 25 year service requirement for members in physically taxing positions to be eligible to retire early at age 50 under a deferred retirement. OA test cases indicate that even members who terminate with less than 25 years of service receive a deferred pension at the age the member would have had 25 years of service. Our understanding is that such members would be treated similar to a regular NYCERS deferred retiree, who becomes eligible for benefits at age 62. The impact on the total withdrawal decrement liability due to this provision is small, since there are not many participants in these positions. However, we suggest the OA clarify the actual provision, and if necessary, modify the valuation program accordingly.
4. Employee Contribution Account Balance Projections: Our analysis of the test cases we received for POLICE and FIRE indicated that the OA bases each year’s projected pay credit to the account on the average of the current year’s salary and the one year forward salary. This was based on the idea that salary increases would be applied on January 1st to the pay rate in effect on the projected valuation date (6/30) resulting in an average pay for the FY that is the average of the two pay rates. However, NYCERS test cases indicate that the pay credit to the contribution account is based on each projected year’s valuation pay rate, with no reflection of the one year forward pay rate. Although either method can be justified, and the impact is just ½ year of salary increase on the contribution pay credit, we still suggest that consistency be achieved for the contribution balance projections across each System. For purposes of our audit, we used the OA’s methodology for each respective System.
5. Sanitation Employees’ Return of AMC to Vested Deferreds: The liability comparison schedules shown in the “Tables” section of this report indicate a significant difference in the Tier 3/4 vested withdrawal liability (see Table 1A(VI)-I.a). One possible source of the discrepancy is the return of Additional Member Contribution (AMC) balances to deferred vested members with less than 15 years of service. We understand this to be a benefit

11-30-06>6008554v3 - nyc 2nd engagement contribution audit report05902.010>audit report final.doc 18
payable to Sanitation employees. However, the test cases we studied for Sanitation indicate that the OA did not value the return of AMC balances to terminations with less than 15 years of service. We call attention to this potential programming oversight, but note that the resulting liability difference does not fall outside of our liability difference thresholds.

11-30-06>6008554v3 - nyc 2nd engagement contribution audit report05902.010>audit report final.doc 19
Section 4: Verification and Analysis of Actuarial Liabilities, Assets and Employer Pension Contributions
It is not surprising that different actuaries will arrive at liability and contribution requirements that differ in minor respects. These differences may be due to variations in computer programs and valuation and data procedures that can vary from organization to organization but that are still reasonable. Therefore, we established what we considered to be acceptable tolerance ranges for variations in the results.
Tolerance Range Active Liability Comparisons
Rule 1: Each line liability calculated by Segal to be within 5% of the OA results.
Rule 2: The difference in each line liability between Segal’s results and the OA’s results to be within 0.5% of the total liability calculated by the OA.
Retiree Liability Comparisons Rule 1: Each line liability calculated by Segal to be within 3% of the OA results.
Rule 2: The difference in each line liability between Segal’s results and the OA’s results to be within 0.5% of the total retiree liability calculated by the OA.
Either Rule 1 or Rule 2 must be satisfied for each line liability. In addition, the total active liability is expected to be within 5% of the total active liability calculated by the OA and the total retiree liability is expected to be within 3% of the total retiree liability calculated by the OA.
These tolerance ranges were applied to various categories of liabilities within each System as well as to the total amounts for each System. We also applied these tolerance ranges to the Variable Supplements Funds.
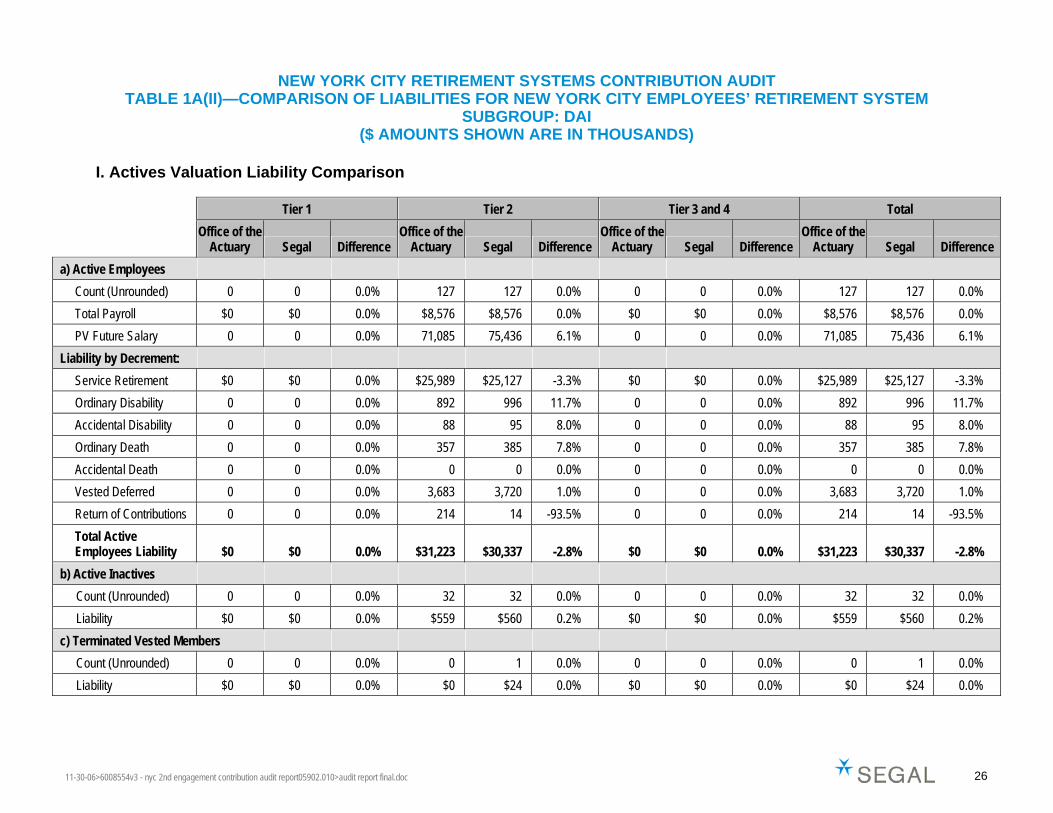
Tables 1-5 presented after Section V show separately for each of the Systems (and the nine participating employer subgroups of NYCERS) a “line by line” comparison of the OA’s results with the audit/Segal results. The Tables show the comparison of counts and liability by:
Status of participant (e.g., active, inactive, terminated vested, pensioner etc.).
Type of benefit (e.g., service retirement, death, disability, etc.).
Supplementation/Automatic COLA, and VSF.
Tolerance test results for each item (e.g., PASS/FAIL).
Development of Employer Contribution requirements.

11-30-06>6008554v3 - nyc 2nd engagement contribution audit report05902.010>audit report final.doc 20
Variable Supplements Funds
In addition to the five Retirement Systems which comprise NYCRS, the City also provides supplemental benefits corresponding to nine distinct Variable Supplements Funds (VSFs) mentioned earlier in this report. The members of NYCRS covered by the VSFs are participants meeting certain eligibility requirements within the POLICE and FIRE pension plans as well as the Housing Police, Transit Police and Corrections Officers employer subgroups of NYCERS. In addition, for all but Corrections, there are two separate VSFs.
The extensive liability comparison charts shown in Tables 1-5 at the end of this report include the VSF liabilities for each Retirement System, both based on the OA’s 6/30/04 valuation as well as based on our valuation software. In addition to the VSF liability comparisons by Retirement System included in these charts, we also present in Table 6 a VSF summary chart which shows a concise comparison of VSF benefits and liabilities for each of the nine distinct VSFs. Note that the non-Segal benefit figures shown are those taken from the audited VSF financial statements provided by the auditor Deloitte, and the non-Segal liability figures were provided by the OA.
As Table 6 below indicates, our liabilities generally match the OA’s liabilities within the acceptable tolerance differences. The benefits comparison is presented in a logical chronological sequence. However, it is important to note that the timing and quantity of payments included in the FY’s ending 2004/2005 actual payment amounts provided in the financial statements differ from the amount shown as “Annual Benefit Rate” computed by our valuation software system. Whereas the former represents actual payments made to beneficiaries over the 12 month period ending 6/30/FY, the Segal computed amount is a snapshot benefit rate in effect on the valuation date, i.e. the annual amount of payments due to the current retirees over the prospective 12 month period, assuming no new retirees, and assuming no deaths or other changes in the payment stream scheduled for the current retirees. Assuming an even distribution of deaths throughout the year as well as a constant rate of new retirees, we would expect that the “Annual Benefit Rate” would generally be between the 2004 and 2005 FYs’ ending actual payments. However, the actual rate of retiree deaths and new retirements fluctuates throughout the year, making it difficult to precisely relate the “Annual Benefit Rate” to the two years of actual payments.

11-30-06>6008554v3 - nyc 2nd engagement contribution audit report05902.010>audit report final.doc 21
Section 5: Recommendations
1. Consider the various methodology issues raised in Section III and determine which changes should be implemented based on materiality as well as theoretical considerations.
2. Providing annual valuation reports for the other Systems, in addition to those the OA already publishes for POLICE and FIRE.
3. Investigate the impact of changing the funding method from Frozen Initial Liability (FIL) to either Entry Age Normal (EAN) or Projected Unit Credit (PUC). These alternative methods are more commonly used in the public sector than FIL, and also provide a better and more direct measure of both the cost of benefits for each year of service, as well as the funded status of the Systems. We would suggest consideration of this option only as part of a combined package that also includes adoption of (i) an appropriate amortization period for unfunded actuarial accrued liabilities, and (ii) new actuarial assumptions based on the recommendations to be contained in the 2001-2005 Experience Study.
As part of a study to evaluate the potential impact of a change in funding method, we would suggest the use of stochastic asset/liability modeling (ALM). A growing number of private sector and governmental retirement systems are starting to use ALM studies to provide the range and probabilities of projected future years' results for employer contributions, assets and liabilities as a result of the variability and volatility of investment returns. It is our understanding that the OA is already considering the use of ALM for purposes of projecting future years’ contribution requirements under the FIL funding method. An ALM study would provide the City and the Retirement Systems with the potential variability of future results, and could form the basis for additional modeling and consideration of alternative funding, asset smoothing and asset allocation methods.
4. Repeated audits (including this one) have only found minor discrepancies with the OA’s valuation results. Furthermore, we have found the OA staff to be very competent and highly professional. Also, conducting audits every two years is not common in the industry. For these reasons, we recommend that audits be conducted not more frequently than once every 5 years for each System, rather than every second year. This could be done concurrently with experience studies.

11-30-06>6008554v3 - nyc 2nd engagement contribution audit report05902.010>audit report final.doc 22
Tables
Table 1A – Comparison of Liabilities for New York City Employees’ Retirement System .............. 21
Table 1A(I-IX) – Comparison of Liabilities for New York City Employees’ Retirement System Subgroups........................................................................................................ 25–33
Table 1B – Threshold Test for Liabilities of New York City Employees’ Retirement System ........... 34
Table 1C – Development of Fiscal Year 2006 Contribution – NYCERS ............................................ 35
Table 2A – Comparison of Liabilities for Teachers Retirement System.............................................. 36
Table 2B – Threshold Test for Liabilities of Teachers Retirement System ......................................... 39
Table 2C – Development of Fiscal Year 2006 Contribution – TRS..................................................... 40
Table 3A – Comparison of Liabilities for Board of Education Retirement System............................. 41
Table 3B – Threshold Test for Liabilities of Board of Education Retirement Systems ....................... 44
Table 3C – Development of Fiscal Year 2006 Contribution – BERS .................................................. 45
Table 4A – Comparison of Liabilities for Police Pension Fund........................................................... 46
Table 4B – Threshold Test for Liabilities of Police Pension Fund....................................................... 49
Table 4C – Development of Fiscal Year 2006 Contribution – POLICE .............................................. 50
Table 5A – Comparison of Liabilities for Fire Pension Fund............................................................... 51
Table 5B – Threshold Test for Liabilities of Fire Pension Fund .......................................................... 54
Table 5C – Development of Fiscal Year 2006 Contribution – FIRE.................................................... 55
Table 6 – Variable Supplements Funds Benefit and Liability Comparisons........................................ 56
11-30-06>6008554v3 - nyc 2nd engagement contribution audit report05902.010>audit report final.doc 21
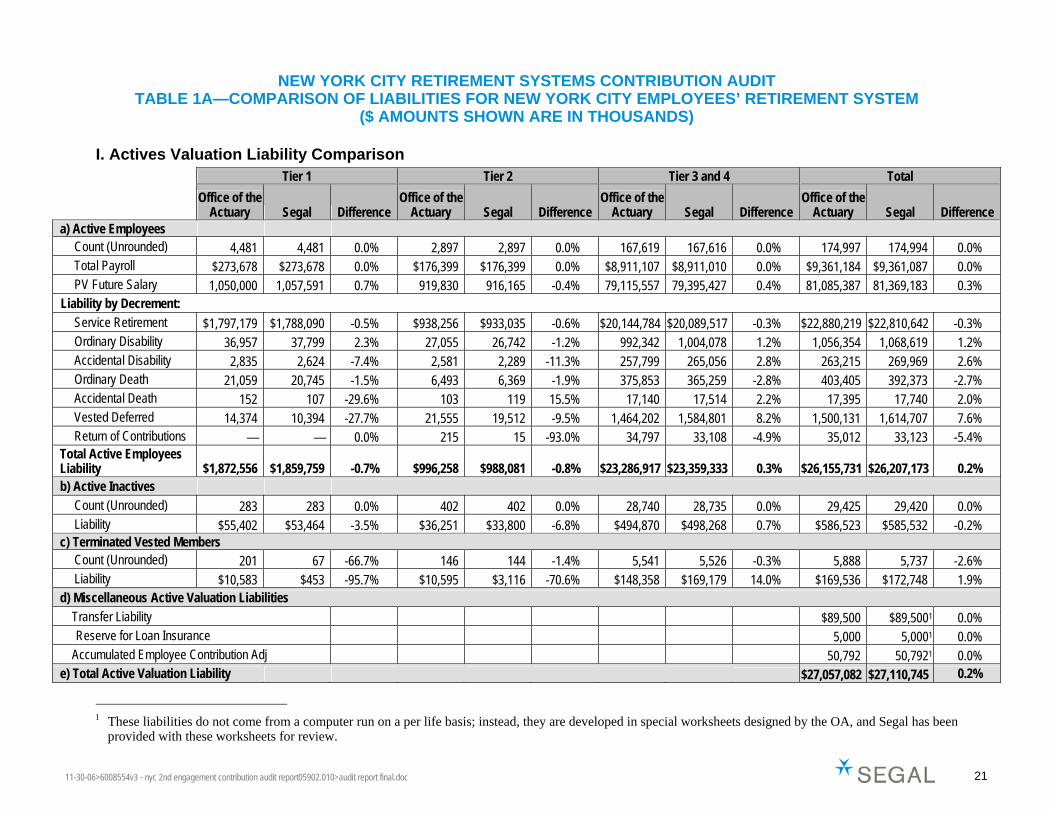
NEW YORK CITY RETIREMENT SYSTEMS CONTRIBUTION AUDIT TABLE 1A—COMPARISON OF LIABILITIES FOR NEW YORK CITY EMPLOYEES’ RETIREMENT SYSTEM
($ AMOUNTS SHOWN ARE IN THOUSANDS)
I. Actives Valuation Liability Comparison Tier 1 Tier 2 Tier 3 and 4 Total
Office of the
Actuary Segal Difference Office of the
Actuary Segal Difference Office of the
Actuary Segal Difference Office of the
Actuary Segal Difference a) Active Employees
Count (Unrounded) 4,481 4,481 0.0% 2,897 2,897 0.0% 167,619 167,616 0.0% 174,997 174,994 0.0% Total Payroll $273,678 $273,678 0.0% $176,399 $176,399 0.0% $8,911,107 $8,911,010 0.0% $9,361,184 $9,361,087 0.0% PV Future Salary 1,050,000 1,057,591 0.7% 919,830 916,165 -0.4% 79,115,557 79,395,427 0.4% 81,085,387 81,369,183 0.3%
Liability by Decrement: Service Retirement $1,797,179 $1,788,090 -0.5% $938,256 $933,035 -0.6% $20,144,784 $20,089,517 -0.3% $22,880,219 $22,810,642 -0.3% Ordinary Disability 36,957 37,799 2.3% 27,055 26,742 -1.2% 992,342 1,004,078 1.2% 1,056,354 1,068,619 1.2% Accidental Disability 2,835 2,624 -7.4% 2,581 2,289 -11.3% 257,799 265,056 2.8% 263,215 269,969 2.6% Ordinary Death 21,059 20,745 -1.5% 6,493 6,369 -1.9% 375,853 365,259 -2.8% 403,405 392,373 -2.7% Accidental Death 152 107 -29.6% 103 119 15.5% 17,140 17,514 2.2% 17,395 17,740 2.0% Vested Deferred 14,374 10,394 -27.7% 21,555 19,512 -9.5% 1,464,202 1,584,801 8.2% 1,500,131 1,614,707 7.6% Return of Contributions — — 0.0% 215 15 -93.0% 34,797 33,108 -4.9% 35,012 33,123 -5.4%
Total Active Employees Liability $1,872,556 $1,859,759 -0.7% $996,258 $988,081 -0.8% $23,286,917 $23,359,333 0.3% $26,155,731 $26,207,173 0.2% b) Active Inactives
Count (Unrounded) 283 283 0.0% 402 402 0.0% 28,740 28,735 0.0% 29,425 29,420 0.0% Liability $55,402 $53,464 -3.5% $36,251 $33,800 -6.8% $494,870 $498,268 0.7% $586,523 $585,532 -0.2%
c) Terminated Vested Members Count (Unrounded) 201 67 -66.7% 146 144 -1.4% 5,541 5,526 -0.3% 5,888 5,737 -2.6% Liability $10,583 $453 -95.7% $10,595 $3,116 -70.6% $148,358 $169,179 14.0% $169,536 $172,748 1.9%
d) Miscellaneous Active Valuation Liabilities Transfer Liability $89,500 $89,5001 0.0% 1Reserve for Loan Insurance 5,000 5,0001 0.0% Accumulated Employee Contribution Adj 50,792 50,7921 0.0%
e) Total Active Valuation Liability $27,057,082 $27,110,745 0.2%
1 These liabilities do not come from a computer run on a per life basis; instead, they are developed in special worksheets designed by the OA, and Segal has been
provided with these worksheets for review.

11-30-06>6008554v3 - nyc 2nd engagement contribution audit report05902.010>audit report final.doc 22
NEW YORK CITY RETIREMENT SYSTEMS CONTRIBUTION AUDIT TABLE 1A—COMPARISON OF LIABILITIES FOR NEW YORK CITY EMPLOYEES’ RETIREMENT SYSTEM
($ AMOUNTS SHOWN ARE IN THOUSANDS) continued
II. Retired Members Liability Comparison
Fixed Dollar Benefit Supplementation Benefit Total Benefit
Office of the Actuary Segal Difference
Office of the Actuary Segal Difference
Office of the Actuary Segal Difference
a) Benefits in Force Retiree Count (Unrounded) 127,037 127,123 0.1% 125,357 -100.0% 127,037 127,123 0.1% Annual Benefits Payable:
Service Retirees $1,968,955 $1,968,962 0.0% $247,141 $247,208 0.0% $2,216,096 $2,216,170 0.0% Ordinary Disability Retirees 100,842 100,842 0.0% 17,439 17,441 0.0% 118,281 118,283 0.0% Accidental Disability Retirees 85,785 85,785 0.0% 22,033 22,033 0.0% 107,818 107,818 0.0% Accidental Death Beneficiaries 1,391 143 -89.7% 767 — -100.0% 2,158 143 -93.4% Beneficiaries 114,194 115,497 1.1% 45,349 46,241 2.0% 159,543 161,738 1.4%
Total Benefit $2,271,167 $2,271,229 0.0% $332,729 $332,923 0.1% $2,603,896 $2,604,152 0.0%
Note: Annual benefits shown for supplementation do not include the Sept. 2003 COLA increases.
Annuity Fund Pension Fund Total Fund
Office of the
Actuary Segal Difference Office of the
Actuary Segal Difference Office of the
Actuary Segal Difference b) Fixed Dollar Benefit Liabilities
Service Retirees $736,434 $742,033 0.8% $16,113,249 $16,208,942 0.6% $16,849,683 $16,950,975 0.6% Ordinary Disability Retirees 24,527 24,697 0.7% 860,700 864,592 0.5% 885,227 889,289 0.5% Accidental Disability Retirees 15,511 15,615 0.7% 748,916 752,733 0.5% 764,427 768,348 0.5% Accidental Death Beneficiaries — — 0.0% 13,531 1,481 -89.1% 13,531 1,481 -89.1% Beneficiaries 54,984 55,435 0.8% 745,998 762,273 2.2% 800,982 817,708 2.1% Total Fixed Benefit Pensioner Liability $831,456 $837,780 0.8% $18,482,394 $18,590,021 0.6% $19,313,850 $19,427,801 0.6%
Note: Employer Contribution is based on “Total Fund” results, not the allocation between Annuity/Pension Funds. As such, any discrepancies between Segal and the OA results in these breakdowns do not impact the Employer Contribution.
11-30-06>6008554v3 - nyc 2nd engagement contribution audit report05902.010>audit report final.doc 23
NEW YORK CITY RETIREMENT SYSTEMS CONTRIBUTION AUDIT TABLE 1A—COMPARISON OF LIABILITIES FOR NEW YORK CITY EMPLOYEES’ RETIREMENT SYSTEM
($ AMOUNTS SHOWN ARE IN THOUSANDS) continued
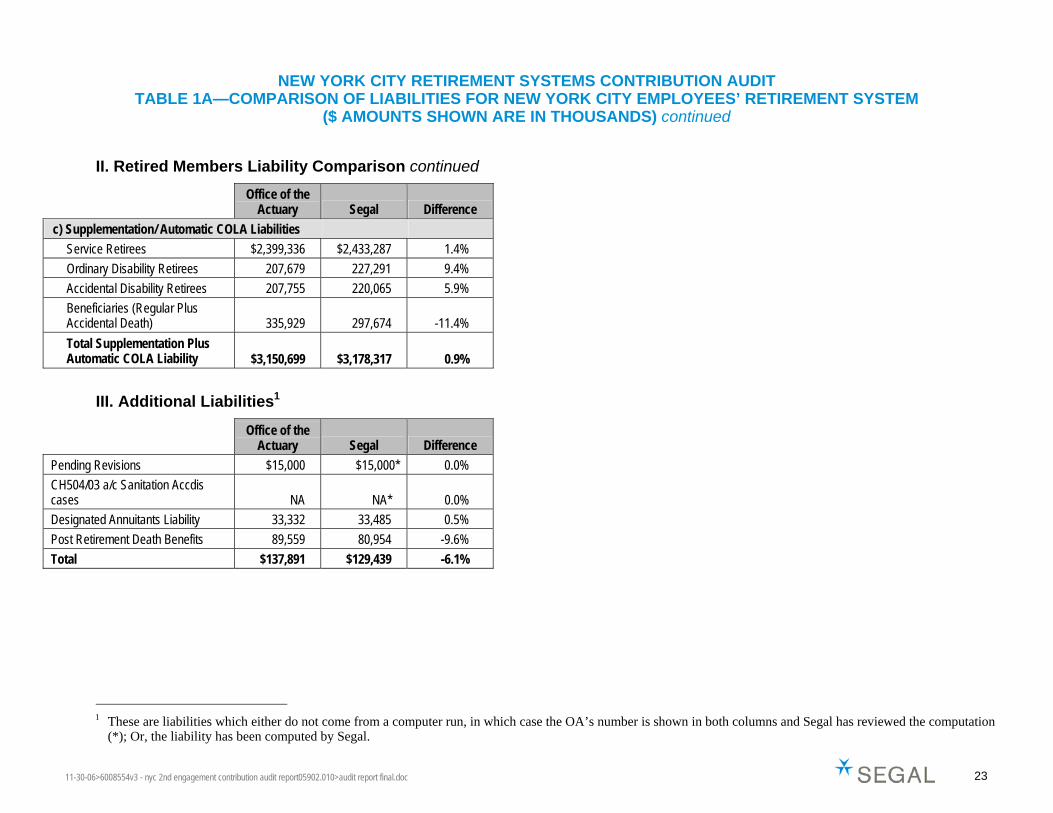
II. Retired Members Liability Comparison continued
Office of the Actuary Segal Difference
c) Supplementation/ Automatic COLA Liabilities Service Retirees $2,399,336 $2,433,287 1.4% Ordinary Disability Retirees 207,679 227,291 9.4% Accidental Disability Retirees 207,755 220,065 5.9% Beneficiaries (Regular Plus Accidental Death) 335,929 297,674 -11.4%
Total Supplementation Plus Automatic COLA Liability $3,150,699 $3,178,317 0.9%
III. Additional Liabilities1
Office of the
Actuary Segal Difference
Pending Revisions $15,000 $15,000* 0.0% CH504/03 a/c Sanitation Accdis cases NA NA* 0.0%
Designated Annuitants Liability 33,332 33,485 0.5% Post Retirement Death Benefits 89,559 80,954 -9.6% Total $137,891 $129,439 -6.1%
1 These are liabilities which either do not come from a computer run, in which case the OA’s number is shown in both columns and Segal has reviewed the computation
(*); Or, the liability has been computed by Segal.

11-30-06>6008554v3 - nyc 2nd engagement contribution audit report05902.010>audit report final.doc 24
NEW YORK CITY RETIREMENT SYSTEMS CONTRIBUTION AUDIT TABLE 1A—COMPARISON OF LIABILITIES FOR NEW YORK CITY EMPLOYEES’ RETIREMENT SYSTEM
($ AMOUNTS SHOWN ARE IN THOUSANDS) continued
IV. VSF Funds Liability Comparison
Corrections Housing Police Transit Police Total
Office of the
Actuary Segal Difference Office of the
Actuary Segal Difference Office of the
Actuary Segal Difference Office of the
Actuary Segal Difference
a) Active VSF Liability1 $774,106 $787,149 1.7% NA NA NA NA NA NA $774,106 $787,149 1.7%
b) Retiree VSF Liability1 352,973 357,462 1.3% 67,350 67,037 -0.5% 93,376 92,857 -0.6% 513,699 517,356 0.7%
c) Total VSF Liability1 $1,127,079 $1,144,611 1.6% $67,350 $67,037 -0.5% $93,376 $92,857 -0.6% $1,287,805 $1,304,505 1.3%
V. Grand Total—All Liabilities
Office of the
Actuary Segal Difference
Total Present Value of Benefits $50,947,327 $51,150,807 0.4%
1 VSF liabilities shown include offset due to COLA; amounts are not offset by assets in VSF funds, which is used to determine PV of future SKIM transfers.

11-30-06>6008554v3 - nyc 2nd engagement contribution audit report05902.010>audit report final.doc 25
NEW YORK CITY RETIREMENT SYSTEMS CONTRIBUTION AUDIT TABLE 1A(I)—COMPARISON OF LIABILITIES FOR NEW YORK CITY EMPLOYEES’ RETIREMENT SYSTEM
SUBGROUP: CORRECTION ($ AMOUNTS SHOWN ARE IN THOUSANDS)
I. Actives Valuation Liability Comparison
Tier 1 Tier 2 Tier 3 and 4 Total
Office of the
Actuary Segal Difference Office of the
Actuary Segal Difference Office of the
Actuary Segal Difference Office of the
Actuary Segal Difference a) Active Employees
Count (Unrounded) 27 27 0.0% 28 28 0.0% 9,209 9,209 0.0% 9,264 9,264 0.0% Total Payroll $2,478 $2,478 0.0% $2,433 $2,433 0.0% $678,356 $678,356 0.0% $683,267 $683,267 0.0% PV Future Salary 7,902 7,865 -0.5% 9,104 9,114 0.1% 4,771,331 4,955,867 3.9% 4,788,337 4,972,846 3.9% Liability by Decrement: Service Retirement $15,604 $14,838 -4.9% $13,947 $13,649 -2.1% $2,264,347 $2,201,126 -2.8% $2,293,898 $2,229,613 -2.8% Ordinary Disability 1,640 1,584 -3.4% 1,355 1,296 -4.4% 143,606 171,008 19.1% 146,601 173,888 18.6% Accidental Disability 568 569 0.2% 593 595 0.3% 135,848 145,156 6.9% 137,009 146,320 6.8% Ordinary Death 150 163 8.7% 67 64 -4.5% 16,592 17,174 3.5% 16,809 17,401 3.5% Accidental Death 6 7 16.7% 7 10 42.9% 3,570 3,553 -0.5% 3,583 3,570 -0.4% Vested Deferred 0 0 0.0% 0 0 0.0% 216,929 220,156 1.5% 216,929 220,156 1.5% Return of Contributions 0 0 0.0% 0 0 0.0% 1,262 1,218 -3.5% 1,262 1,218 -3.5% Total Active Employees Liability $17,968 $17,161 -4.5% $15,969 $15,614 -2.2% $2,782,154 $2,759,391 -0.8% $2,816,091 $2,792,166 -0.8%
b) Active Inactives Count (Unrounded) 2 2 0.0% 6 6 0.0% 1,219 1,219 0.0% 1,227 1,227 0.0% Liability $858 $711 -17.1% $1,747 $1,542 -11.7% $85,858 $87,703 2.1% $88,464 $89,957 1.7%
c) Terminated Vested Members Count (Unrounded) 1 0 -100.0% 1 1 0.0% 275 275 0.0% 277 276 -0.4% Liability $0 $0 0.0% $445 $405 -9.0% $10,130 $23,315 130.2% $10,575 $23,720 124.3%
11-30-06>6008554v3 - nyc 2nd engagement contribution audit report05902.010>audit report final.doc 26
NEW YORK CITY RETIREMENT SYSTEMS CONTRIBUTION AUDIT TABLE 1A(II)—COMPARISON OF LIABILITIES FOR NEW YORK CITY EMPLOYEES’ RETIREMENT SYSTEM
SUBGROUP: DAI ($ AMOUNTS SHOWN ARE IN THOUSANDS)
I. Actives Valuation Liability Comparison
Tier 1 Tier 2 Tier 3 and 4 Total
Office of the
Actuary Segal Difference Office of the
Actuary Segal Difference Office of the
Actuary Segal Difference Office of the
Actuary Segal Difference a) Active Employees
Count (Unrounded) 0 0 0.0% 127 127 0.0% 0 0 0.0% 127 127 0.0% Total Payroll $0 $0 0.0% $8,576 $8,576 0.0% $0 $0 0.0% $8,576 $8,576 0.0% PV Future Salary 0 0 0.0% 71,085 75,436 6.1% 0 0 0.0% 71,085 75,436 6.1%
Liability by Decrement: Service Retirement $0 $0 0.0% $25,989 $25,127 -3.3% $0 $0 0.0% $25,989 $25,127 -3.3% Ordinary Disability 0 0 0.0% 892 996 11.7% 0 0 0.0% 892 996 11.7% Accidental Disability 0 0 0.0% 88 95 8.0% 0 0 0.0% 88 95 8.0% Ordinary Death 0 0 0.0% 357 385 7.8% 0 0 0.0% 357 385 7.8% Accidental Death 0 0 0.0% 0 0 0.0% 0 0 0.0% 0 0 0.0% Vested Deferred 0 0 0.0% 3,683 3,720 1.0% 0 0 0.0% 3,683 3,720 1.0% Return of Contributions 0 0 0.0% 214 14 -93.5% 0 0 0.0% 214 14 -93.5% Total Active Employees Liability $0 $0 0.0% $31,223 $30,337 -2.8% $0 $0 0.0% $31,223 $30,337 -2.8%
b) Active Inactives Count (Unrounded) 0 0 0.0% 32 32 0.0% 0 0 0.0% 32 32 0.0% Liability $0 $0 0.0% $559 $560 0.2% $0 $0 0.0% $559 $560 0.2%
c) Terminated Vested Members Count (Unrounded) 0 0 0.0% 0 1 0.0% 0 0 0.0% 0 1 0.0% Liability $0 $0 0.0% $0 $24 0.0% $0 $0 0.0% $0 $24 0.0%

11-30-06>6008554v3 - nyc 2nd engagement contribution audit report05902.010>audit report final.doc 27
NEW YORK CITY RETIREMENT SYSTEMS CONTRIBUTION AUDIT TABLE 1A(III)—COMPARISON OF LIABILITIES FOR NEW YORK CITY EMPLOYEES’ RETIREMENT SYSTEM
SUBGROUP: EMT ($ AMOUNTS SHOWN ARE IN THOUSANDS)
I. Actives Valuation Liability Comparison
Tier 1 Tier 2 Tier 3 and 4 Total
Office of the
Actuary Segal Difference Office of the
Actuary Segal Difference Office of the
Actuary Segal Difference Office of the
Actuary Segal Difference a) Active Employees
Count (Unrounded) 6 6 0.0% 14 14 0.0% 2,286 2,286 0.0% 2,306 2,306 0.0% Total Payroll $303 $303 0.0% $800 $800 0.0% $102,347 $102,347 0.0% $103,450 $103,450 0.0% PV Future Salary 1,084 1,084 0.0% 5,291 3,506 -33.7% 996,658 995,644 -0.1% 1,003,033 1,000,234 -0.3%
Liability by Decrement: Service Retirement $1,886 $1,909 1.2% $4,223 $3,908 -7.5% $224,725 $220,627 -1.8% $230,834 $226,444 -1.9% Ordinary Disability 41 41 0.0% 186 121 -34.9% 9,783 9,626 -1.6% 10,010 9,788 -2.2% Accidental Disability 2 2 0.0% 9 6 -33.3% 1,213 1,056 -12.9% 1,224 1,064 -13.1% Ordinary Death 27 27 0.0% 55 34 -38.2% 3,943 4,335 9.9% 4,025 4,396 9.2% Accidental Death 0 0 0.0% 0 0 0.0% 0 0 0.0% 0 — 0.0% Vested Deferred 0 0 0.0% 120 45 -62.5% 31,853 38,927 22.2% 31,973 38,972 21.9% Return of Contributions 0 0 0.0% 0 0 0.0% 766 750 -2.1% 766 750 -2.1% Total Active Employees Liability $1,956 $1,979 1.2% $4,593 $4,114 -10.4% $272,283 $275,321 1.1% $278,832 $281,414 0.9%
b) Active Inactives Count (Unrounded) 0 0 0.0% 1 1 0.0% 380 380 0.0% 381 381 0.0% Liability $0 $0 0.0% $109 $119 9.2% $5,352 $5,294 -1.1% $5,462 $5,414 -0.9%
c) Terminated Vested Members Count (Unrounded) 0 0 0.0% 0 1 0.0% 0 20 0.0% 0 21 0.0% Liability $0 $0 0.0% $0 ($2) 0.0% $0 $1,474 0.0% $0 $1,472 0.0%

11-30-06>6008554v3 - nyc 2nd engagement contribution audit report05902.010>audit report final.doc 28
NEW YORK CITY RETIREMENT SYSTEMS CONTRIBUTION AUDIT TABLE 1A(IV)—COMPARISON OF LIABILITIES FOR NEW YORK CITY EMPLOYEES’ RETIREMENT SYSTEM
SUBGROUP: FAD ($ AMOUNTS SHOWN ARE IN THOUSANDS)
I. Actives Valuation Liability Comparison
Tier 1 Tier 2 Tier 3 and 4 Total
Office of the
Actuary Segal Difference Office of the
Actuary Segal Difference Office of the
Actuary Segal Difference Office of the
Actuary Segal Difference a) Active Employees
Count (Unrounded) 0 0 0.0% 0 0 0.0% 92 92 0.0% 92 92 0.0% Total Payroll $0 $0 0.0% $0 $0 0.0% $4,459 $4,459 0.0% $4,459 $4,459 0.0% PV Future Salary 0 0 0.0% 0 0 0.0% 38,938 40,192 3.2% 38,938 40,192 3.2%
Liability by Decrement: Service Retirement $0 $0 0.0% $0 $0 0.0% $11,207 $10,706 -4.5% $11,207 $10,706 -4.5% Ordinary Disability 0 0 0.0% 0 0 0.0% 348 375 7.8% 348 375 7.8% Accidental Disability 0 0 0.0% 0 0 0.0% 47 49 4.3% 47 49 4.3% Ordinary Death 0 0 0.0% 0 0 0.0% 139 166 19.4% 139 166 19.4% Accidental Death 0 0 0.0% 0 0 0.0% 0 0 0.0% 0 0 0.0% Vested Deferred 0 0 0.0% 0 0 0.0% 1,359 1,493 9.9% 1,359 1,493 9.9% Return of Contributions 0 0 0.0% 0 0 0.0% 64 64 0.0% 64 64 0.0% Total Active Employees Liability $0 $0 0.0% $0 $0 0.0% $13,164 $12,853 -2.4% $13,164 $12,853 -2.4%
b) Active Inactives Count (Unrounded) 0 0 0.0% 0 0 0.0% 17 17 0.0% 17 17 0.0% Liability $0 $0 0.0% $0 $0 0.0% $835 $810 -3.0% $835 $810 -3.0%
c) Terminated Vested Members Count (Unrounded) 0 0 0.0% 0 0 0.0% 0 2 0.0% 0 2 0.0% Liability $0 $0 0.0% $0 $0 0.0% $0 $103 0.0% $0 $103 0.0%

11-30-06>6008554v3 - nyc 2nd engagement contribution audit report05902.010>audit report final.doc 29
NEW YORK CITY RETIREMENT SYSTEMS CONTRIBUTION AUDIT TABLE 1A(V)—COMPARISON OF LIABILITIES FOR NEW YORK CITY EMPLOYEES’ RETIREMENT SYSTEM
SUBGROUP: OTHERS ($ AMOUNTS SHOWN ARE IN THOUSANDS)
I. Actives Valuation Liability Comparison
Tier 1 Tier 2 Tier 3 and 4 Total
Office of the
Actuary Segal Difference Office of the
Actuary Segal Difference Office of the
Actuary Segal Difference Office of the
Actuary Segal Difference a) Active Employees
Count (Unrounded) 3,737 3,737 0.0% 2,161 2,161 0.0% 110,954 110,955 0.0% 116,852 116,853 0.0% Total Payroll $219,004 $219,004 0.0% $125,021 $125,021 0.0% $5,441,374 $5,441,430 0.0% $5,785,399 $5,785,455 0.0% PV Future Salary 889,478 889,244 0.0% 674,135 653,334 -3.1% 50,725,576 50,221,829 -1.0% 52,289,189 51,764,407 -1.0%
Liability by Decrement: Service Retirement $1,460,769 $1,456,346 -0.3% $685,831 $685,046 -0.1% $10,791,793 $10,855,341 0.6% $12,938,393 $12,996,733 0.5% Ordinary Disability 29,691 30,307 2.1% 19,544 18,996 -2.8% 555,201 539,053 -2.9% 604,436 588,356 -2.7% Accidental Disability 1,090 1,103 1.2% 804 778 -3.2% 26,036 25,647 -1.5% 27,930 27,528 -1.4% Ordinary Death 17,417 16,815 -3.5% 4,800 4,568 -4.8% 231,310 223,511 -3.4% 253,527 244,894 -3.4% Accidental Death 0 0 0.0% 0 0 0.0% 0 0 0.0% 0 — 0.0% Vested Deferred 14,207 10,182 -28.3% 13,614 9,959 -26.8% 793,920 860,095 8.3% 821,741 880,236 7.1% Return of Contributions 0 0 0.0% 1 1 0.0% 27,590 25,432 -7.8% 27,591 25,433 -7.8% Total Active Employees Liability $1,523,174 $1,514,753 -0.6% $724,594 $719,348 -0.7% $12,425,850 $12,529,079 0.8% $14,673,618 $14,763,180 0.6%
b) Active Inactives Count (Unrounded) 245 245 0.0% 329 329 0.0% 21,757 21,752 0.0% 22,331 22,326 0.0% Liability $45,288 $43,326 -4.3% $26,308 $24,378 -7.3% $265,289 $267,601 0.9% $336,884 $335,305 -0.5%
c) Terminated Vested Members Count (Unrounded) 197 65 -67.0% 145 141 -2.8% 4,988 4,945 -0.9% 5,330 5,151 -3.4% Liability $10,349 $491 -95.3% $10,150 $2,689 -73.5% $118,387 $124,068 4.8% $138,886 $127,248 -8.4%

11-30-06>6008554v3 - nyc 2nd engagement contribution audit report05902.010>audit report final.doc 30
NEW YORK CITY RETIREMENT SYSTEMS CONTRIBUTION AUDIT TABLE 1A(VI)—COMPARISON OF LIABILITIES FOR NEW YORK CITY EMPLOYEES’ RETIREMENT SYSTEM
SUBGROUP: SANITATION ($ AMOUNTS SHOWN ARE IN THOUSANDS)
I. Actives Valuation Liability Comparison
Tier 1 Tier 2 Tier 3 and 4 Total
Office of the
Actuary Segal Difference Office of the
Actuary Segal Difference Office of the
Actuary Segal Difference Office of the
Actuary Segal Difference a) Active Employees
Count (Unrounded) 62 62 0.0% 65 65 0.0% 7,227 7,227 0.0% 7,354 7,354 0.0% Total Payroll $5,942 $5,942 0.0% $5,819 $5,819 0.0% $510,706 $510,706 0.0% $522,467 $522,467 0.0% PV Future Salary 16,616 16,508 -0.6% 17,971 17,808 -0.9% 4,013,945 3,952,233 -1.5% 4,048,532 3,986,549 -1.5%
Liability by Decrement: Service Retirement $39,625 $38,416 -3.1% $32,780 $32,426 -1.1% $1,812,705 $1,812,445 0.0% $1,885,110 $1,883,287 -0.1% Ordinary Disability 1,627 1,645 1.1% 1,494 1,362 -8.8% 100,441 96,673 -3.8% 103,562 99,680 -3.7% Accidental Disability 971 712 -26.7% 851 536 -37.0% 80,611 78,311 -2.9% 82,433 79,559 -3.5% Ordinary Death 450 446 -0.9% 202 202 0.0% 20,868 19,938 -4.5% 21,520 20,586 -4.3% Accidental Death 18 13 -27.8% 15 14 -6.7% 2,698 2,667 -1.1% 2,731 2,694 -1.4% Vested Deferred 0 0 0.0% 0 0 0.0% 69,622 74,000 6.3% 69,622 74,000 6.3% Return of Contributions 0 0 0.0% 0 0 0.0% 764 741 -3.0% 764 741 -3.0% Total Active Employees Liability $42,691 $41,232 -3.4% $35,342 $34,540 -2.3% $2,087,709 $2,084,775 -0.1% $2,165,742 $2,160,547 -0.2%
b) Active Inactives Count (Unrounded) 0 0 0.0% 6 6 0.0% 527 527 0.0% 533 533 0.0% Liability $0 $0 0.0% $1,848 $1,877 1.6% $41,853 $42,102 0.6% $43,700 $43,979 0.6%
c) Terminated Vested Members Count (Unrounded) 1 1 0.0% 0 0 0.0% 108 108 0.0% 109 109 0.0% Liability $10 ($22) -320.0% $0 $0 0.0% $12,230 $12,467 1.9% $12,240 $12,445 1.7%

11-30-06>6008554v3 - nyc 2nd engagement contribution audit report05902.010>audit report final.doc 31
NEW YORK CITY RETIREMENT SYSTEMS CONTRIBUTION AUDIT TABLE 1A(VII)—COMPARISON OF LIABILITIES FOR NEW YORK CITY EMPLOYEES’ RETIREMENT SYSTEM
SUBGROUP: SPECIAL OFFICERS, DEPUTY SHERIFFS AND AUTO MECHANICS ($ AMOUNTS SHOWN ARE IN THOUSANDS)
I. Actives Valuation Liability Comparison
Tier 1 Tier 2 Tier 3 and 4 Total
Office of the
Actuary Segal Difference Office of the
Actuary Segal Difference Office of the
Actuary Segal Difference Office of the
Actuary Segal Difference a) Active Employees
Count (Unrounded) 0 0 0.0% 0 0 0.0% 1,689 1,689 0.0% 1,689 1,689 0.0% Total Payroll $0 $0 0.0% $0 $0 0.0% $75,558 $75,558 0.0% $75,558 $75,558 0.0% PV Future Salary 0 0 0.0% 0 0 0.0% 704,823 677,329 -3.9% 704,823 677,329 -3.9%
Liability by Decrement: Service Retirement $0 $0 0.0% $0 $0 0.0% $156,089 $153,568 -1.6% $156,089 $153,568 -1.6% Ordinary Disability 0 0 0.0% 0 0 0.0% 6,119 5,777 -5.6% 6,119 5,777 -5.6% Accidental Disability 0 0 0.0% 0 0 0.0% 450 412 -8.4% 450 412 -8.4% Ordinary Death 0 0 0.0% 0 0 0.0% 2,730 2,816 3.2% 2,730 2,816 3.2% Accidental Death 0 0 0.0% 0 0 0.0% 0 0 0.0% 0 - 0.0% Vested Deferred 0 0 0.0% 0 0 0.0% 22,139 23,619 6.7% 22,139 23,619 6.7% Return of Contributions 0 0 0.0% 0 0 0.0% 1,491 1,588 6.5% 1,491 1,588 6.5% Total Active Employees Liability $0 $0 0.0% $0 $0 0.0% $189,018 $187,780 -0.7% $189,018 $187,780 -0.7%
b) Active Inactives Count (Unrounded) 0 0 0.0% 0 0 0.0% 123 123 0.0% 123 123 0.0% Liability $0 $0 0.0% $0 $0 0.0% $1,487 $1,502 1.0% $1,487 $1,502 1.0%
c) Terminated Vested Members Count (Unrounded) 0 0 0.0% 0 0 0.0% 0 6 0.0% 0 6 0.0% Liability $0 $0 0.0% $0 $0 0.0% $0 $660 0.0% $0 $660 0.0%

11-30-06>6008554v3 - nyc 2nd engagement contribution audit report05902.010>audit report final.doc 32
NEW YORK CITY RETIREMENT SYSTEMS CONTRIBUTION AUDIT TABLE 1A(VIII)—COMPARISON OF LIABILITIES FOR NEW YORK CITY EMPLOYEES’ RETIREMENT SYSTEM
SUBGROUP: TBTA ($ AMOUNTS SHOWN ARE IN THOUSANDS)
I. Actives Valuation Liability Comparison
Tier 1 Tier 2 Tier 3 and 4 Total
Office of the
Actuary Segal Difference Office of the
Actuary Segal Difference Office of the
Actuary Segal Difference Office of the
Actuary Segal Difference a) Active Employees
Count (Unrounded) 17 17 0.0% 21 21 0.0% 1,588 1,588 0.0% 1,626 1,626 0.0% Total Payroll $1,598 $1,598 0.0% $1,911 $1,911 0.0% $96,655 $96,655 0.0% $100,164 $100,164 0.0% PV Future Salary 6,605 6,698 1.4% 10,878 12,949 19.0% 931,669 869,363 -6.7% 949,152 889,010 -6.3%
Liability by Decrement: Service Retirement $10,352 $9,960 -3.8% $9,840 $8,828 -10.3% $237,450 $233,214 -1.8% $257,642 $252,002 -2.2% Ordinary Disability 227 249 9.7% 342 419 22.5% 10,340 10,565 2.2% 10,909 11,233 3.0% Accidental Disability 45 49 8.9% 77 94 22.1% 2,222 2,441 9.9% 2,344 2,584 10.2% Ordinary Death 143 126 -11.9% 96 116 20.8% 4,325 4,359 0.8% 4,564 4,601 0.8% Accidental Death 7 5 -28.6% 8 13 62.5% 565 590 4.4% 580 608 4.8% Vested Deferred 160 169 5.6% 341 221 -35.2% 22,870 22,912 0.2% 23,371 23,302 -0.3% Return of Contributions 0 0 0.0% 0 0 0.0% 760 741 -2.5% 760 741 -2.5% Total Active Employees Liability $10,934 $10,558 -3.4% $10,704 $9,691 -9.5% $278,532 $274,822 -1.3% $300,170 $295,071 -1.7%
b) Active Inactives Count (Unrounded) 1 1 0.0% 4 4 0.0% 90 90 0.0% 95 95 0.0% Liability $585 $592 1.2% $1,449 $978 -32.5% $3,366 $3,359 -0.2% $5,399 $4,928 -8.7%
c) Terminated Vested Members Count (Unrounded) 1 1 0.0% 0 0 0.0% 10 10 0.0% 11 11 0.0% Liability $59 ($16) -127.1% $0 $0 0.0% $992 $873 -12.0% $1,051 $857 -18.5%

11-30-06>6008554v3 - nyc 2nd engagement contribution audit report05902.010>audit report final.doc 33
NEW YORK CITY RETIREMENT SYSTEMS CONTRIBUTION AUDIT TABLE 1A(IX)—COMPARISON OF LIABILITIES FOR NEW YORK CITY EMPLOYEES’ RETIREMENT SYSTEM
SUBGROUP: TRANSIT ($ AMOUNTS SHOWN ARE IN THOUSANDS)
I. Actives Valuation Liability Comparison
Tier 1 Tier 2 Tier 3 and 4 Total
Office of the
Actuary Segal Difference Office of the
Actuary Segal Difference Office of the
Actuary Segal Difference Office of the
Actuary Segal Difference a) Active Employees
Count (Unrounded) 632 632 0.0% 481 481 0.0% 34,574 34,570 0.0% 35,687 35,683 0.0% Total Payroll $44,353 $44,353 0.0% $31,839 $31,839 0.0% $2,001,652 $2,001,499 0.0% $2,077,844 $2,077,691 0.0% PV Future Salary 128,315 136,192 6.1% 131,366 144,018 9.6% 16,932,617 17,682,970 4.4% 17,192,298 17,963,180 4.5%
Liability by Decrement: Service Retirement $268,943 $266,621 -0.9% $165,646 $164,051 -1.0% $4,646,468 $4,602,490 -0.9% $5,081,057 $5,033,162 -0.9% Ordinary Disability 3,731 3,973 6.5% 3,242 3,552 9.6% 166,504 171,001 2.7% 173,477 178,526 2.9% Accidental Disability 159 189 18.9% 159 185 16.4% 11,372 11,984 5.4% 11,690 12,358 5.7% Ordinary Death 2,872 3,168 10.3% 916 1,000 9.2% 95,946 92,960 -3.1% 99,734 97,128 -2.6% Accidental Death 121 82 -32.2% 73 82 12.3% 10,307 10,704 3.9% 10,501 10,868 3.5% Vested Deferred 7 43 514.3% 3,797 5,567 46.6% 305,510 343,599 12.5% 309,314 349,209 12.9% Return of Contributions 0 0 0.0% 0 0 0.0% 2,100 2,574 22.6% 2,100 2,574 22.6% Total Active Employees Liability $275,833 $274,076 -0.6% $173,833 $174,437 0.3% $5,238,207 $5,235,312 -0.1% $5,687,873 $5,683,825 -0.1%
b) Active Inactives Count (Unrounded) 35 35 0.0% 24 24 0.0% 4,627 4,627 0.0% 4,686 4,686 0.0% Liability $8,671 $8,835 1.9% $4,231 $4,346 2.7% $90,830 $89,897 -1.0% $103,732 $103,078 -0.6%
c) Terminated Vested Members Count (Unrounded) 1 0 -100.0% 0 0 0.0% 160 160 0.0% 161 160 -0.6% Liability $165 $0 -100.0% $0 $0 0.0% $6,619 $6,219 -6.0% $6,784 $6,219 -8.3%

11-30-06>6008554v3 - nyc 2nd engagement contribution audit report05902.010>audit report final.doc 34
NEW YORK CITY RETIREMENT SYSTEMS CONTRIBUTION AUDIT TABLE 1B—THRESHOLD TEST FOR LIABILITIES OF NEW YORK CITY EMPLOYEES’ RETIREMENT SYSTEM
Rule 1 Individual
Liability Test Rule 2
Total Liability Test Rule 1
Test Result Rule 2
Test Result Overall Test Result a) Active Liabilities
Service Retirement -0.3% -0.1% PASS PASS PASS Ordinary Disability 1.2% 0.0% PASS PASS PASS Accidental Disability 2.6% 0.0% PASS PASS PASS Ordinary Death -2.7% 0.0% PASS PASS PASS Accidental Death 2.0% 0.0% PASS PASS PASS Vested Deferred 7.6% 0.2% FAIL PASS PASS Return of Contributions -5.4% 0.0% FAIL PASS PASS Total Active 0.2% 0.1% PASS
b) Active Inactive Liabilities -0.2% 0.0% PASS PASS PASS c) Terminated Vested Liabilities 1.9% 0.0% PASS PASS PASS d) Retiree Liabilities
(i) Fixed Benefit Liabilities Service Retirees 0.6% 0.2% PASS PASS PASS Ordinary Disability Retirees 0.5% 0.0% PASS PASS PASS Accidental Disability Retirees 0.5% 0.0% PASS PASS PASS Accidental Death Beneficiaries -89.1% 0.0% FAIL PASS PASS Beneficiaries 2.1% 0.0% PASS PASS PASS
(ii) Supplementation Benefit Liabilities Service Retirees 1.4% 0.1% PASS PASS PASS Ordinary Disability Retirees 9.4% 0.0% FAIL PASS PASS Accidental Disability Retirees 5.9% 0.0% FAIL PASS PASS Beneficiaries (Regular Plus Accidental Death) -11.4% -0.1% FAIL PASS PASS
Total Retirees 0.6% 0.3% PASS e) Retiree Liabilities not Included Above
Designated Annuitants Liability 0.5% 0.0% PASS PASS PASS Post Retirement Death Benefits -9.6% 0.0% FAIL PASS PASS
f) VSF Liabilities Active VSF Liability 1.7% 0.0% PASS PASS PASS Retiree VSF Liability 0.7% 0.0% PASS PASS PASS

11-30-06>6008554v3 - nyc 2nd engagement contribution audit report05902.010>audit report final.doc 35
NEW YORK CITY RETIREMENT SYSTEMS CONTRIBUTION AUDIT TABLE 1C—DEVELOPMENT OF FISCAL YEAR 2006 CONTRIBUTION—NYCERS
($ AMOUNTS SHOWN ARE IN THOUSANDS)
Office of the Actuary Segal Difference ($) Difference (%)
Total PVB Before Adjustments $50,947,327 $51,150,807 $203,480 0.4% VSF Actuarial Value of Assets Offset to VSF Liability 108,137 108,137 — 0.0%
Total PVB Net of Adjustments $50,839,190 $51,042,670 $203,480 0.4% Assets
Actuarial Value of Assets $41,430,332 $41,430,332 $0 0.0% PV Future UAL conts 148,045 148,045 — 0.0% Present Value of Future Employee Contributions 1,530,627 1,504,553 (26,074) -1.7%
Total Prospective Assets $43,109,004 $43,082,930 ($26,074) -0.1%
Present Value of Future Employer Normal Contributions $7,730,186 $7,959,740 $229,554 3.0%
Present Value of Future Salaries (Proj, 1-Yr Lag Methodology) $72,172,986 $72,464,636 $291,650 0.4% Normal Cost Percentage 10.711% 10.984% N/A 2.5% Annual Payroll (Proj, 1-Yr Lag Methodology) $9,124,498 $9,034,476 ($90,022) -1.0%
Normal Contribution $977,325 $992,347 $15,022 1.5% Consolidated UAL Contribution 47,033 47,033 — 0.0% Investment Expenses — — — 0.0% Administrative Expenses — — — 0.0% Total NYCERS Contribution $1,024,358 $1,039,380 $15,022 1.5%
Note: Detailed figures may not add due to rounding

11-30-06>6008554v3 - nyc 2nd engagement contribution audit report05902.010>audit report final.doc 36
NEW YORK CITY RETIREMENT SYSTEMS CONTRIBUTION AUDIT TABLE 2A—COMPARISON OF LIABILITIES FOR TEACHERS’ RETIREMENT SYSTEM
($ AMOUNTS SHOWN ARE IN THOUSANDS)
I. Actives Valuation Liability Comparison Tier 1 Tier 2 Tiers 3 & 4 Total
Office of the
Actuary Segal Difference
Office of the
Actuary Segal Difference
Office of the
Actuary Segal Difference
Office of the
Actuary Segal Difference a) Active Employees
Count (Unrounded) 8,000 8,000 0.0% 2,579 2,579 0.0% 94,812 94,813 0.0% 105,391 105,392 0.0% Total Payroll $685,335 $685,335 0.0% $223,811 $223,811 0.0% $5,266,794 $5,266,857 0.0% $6,175,940 $6,176,003 0.0% PV Future Salary 3,510,386 3,661,428 4.3% 1,545,288 1,819,025 17.7% 64,564,580 64,918,375 0.5% 69,620,254 70,398,828 1.1% Liability by Decrement:
Service Retirement $4,151,758 $4,100,041 -1.2% $1,247,656 $1,234,580 -1.0% $13,382,067 $13,387,224 0.0% $18,781,481 $18,721,845 -0.3% Ordinary Disability 39,419 40,303 2.2% 15,093 18,131 20.1% 250,052 252,163 0.8% 304,564 310,597 2.0% Accidental Disability 9,989 9,950 -0.4% 4,106 4,778 16.4% 91,425 93,594 2.4% 105,520 108,357 2.7% Ordinary Death 52,497 56,388 7.4% 8,317 8,694 4.5% 214,284 209,925 -2.0% 275,098 275,007 0.0% Accidental Death — — 0.0% — — 0.0% — — 0.0% — — 0.0% Vested Deferred 7,772 5,824 -25.1% 13,408 13,181 -1.7% 638,593 614,420 -3.8% 659,773 633,425 -4.0% Return of Contributions 3 61 1933.3% 12 35 191.7% 24,009 24,715 2.9% 24,024 24,811 3.3%
Total Active Employees Liability $4,261,438 $4,212,567 -1.1% $1,288,592 $1,279,399 -0.7% $14,600,430 $14,582,041 -0.1% $20,150,460 $20,074,007 -0.4% b) Active Inactives
Count (Unrounded) 80 80 0.0% 33 33 0.0% 8,981 8,980 0.0% 9,094 9,093 0.0% Liability $18,450 $18,392 -0.3% $5,424 $5,622 3.7% $96,023 $92,190 -4.0% $119,897 $116,204 -3.1%
c) Terminated Vested Members Count (Unrounded) 672 648 -3.6% 236 236 0.0% 3,846 3,846 0.0% 4,754 4,730 -0.5% Liability $124,242 $121,896 -1.9% $35,678 $38,822 8.8% $173,275 $162,394 -6.3% $333,195 $323,112 -3.0%
d) Miscellaneous Active Valuation Liabilities Transfer Liability $7,700 $7,7001 0.0% Reserve for Loan Insurance 700 7001 0.0% Accumulated Employee Contribution Adj 109,477 109,4771 0.0%
e) Total Active Valuation Liability $20,721,429 $20,631,200 -0.4%
1 These liabilities do not come from a computer run on a per life basis; instead, they are developed in special worksheets designed by the OA, and Segal has been
provided with these worksheets for review.

11-30-06>6008554v3 - nyc 2nd engagement contribution audit report05902.010>audit report final.doc 37
NEW YORK CITY RETIREMENT SYSTEMS CONTRIBUTION AUDIT TABLE 2A—COMPARISON OF LIABILITIES FOR TEACHERS’ RETIREMENT SYSTEM
($ AMOUNTS SHOWN ARE IN THOUSANDS) continued
II. Retired Members Liability Comparison Fixed Dollar Benefit Supplementation Benefit Total Benefit
Office of the
Actuary Segal Difference Office of the
Actuary Segal Difference Office of the
Actuary Segal Difference a) Benefits in Force
Retiree Count (Unrounded) 62,421 62,541 0.2% 62,154 62,430 0.4% 62,421 62,541 0.2% Annual Benefits Payable:
Service Retirees $1,655,910 $1,655,921 0.0% $133,609 $133,664 0.0% $1,789,519 $1,789,585 0.0% Ordinary Disability Retirees 22,436 22,436 0.0% 4,912 4,912 0.0% 27,348 27,348 0.0% Accidental Disability Retirees 10,960 10,960 0.0% 2,136 2,136 0.0% 13,096 13,096 0.0% Accidental Death Beneficiaries 13 13 0.0% 6 6 0.0% 19 19 0.0% Beneficiaries 43,275 43,264 0.0% 11,336 11,327 -0.1% 54,611 54,591 0.0%
Total Benefit $1,732,594 $1,732,594 0.0% $151,999 $152,045 0.0% $1,884,593 $1,884,639 0.0%
Note: Annual benefits shown for supplementation do not include the Sept. 2003 COLA increases
Annuity Fund Pension Fund Total Fund
Office of the
Actuary Segal Difference Office of the
Actuary Segal Difference Office of the
Actuary Segal Difference b) Fixed Dollar Benefit Liabilities
Service Retirees $503,279 $506,052 0.6% $15,341,492 $15,441,363 0.7% $15,844,771 $15,947,415 0.6% Ordinary Disability Retirees 6,205 6,240 0.6% 200,075 201,360 0.6% 206,280 207,600 0.6% Accidental Disability Retirees 1,446 1,454 0.6% 97,931 98,463 0.5% 99,377 99,917 0.5% Accidental Death Beneficiaries — — 0.0% 59 59 0.0% 59 59 0.0% Beneficiaries 10,867 10,897 0.3% 317,651 318,841 0.4% 328,518 329,738 0.4% Total Fixed Benefit Pensioner Liability $521,797 $524,643 0.5% $15,957,208 $16,060,086 0.6% $16,479,005 $16,584,729 0.6%
Note: Employer Contribution is based on “Total Fund” results, not the allocation between Annuity/Pension Funds. As such, any discrepancies between Segal and the OA results in these breakdowns do not impact the Employer Contribution.
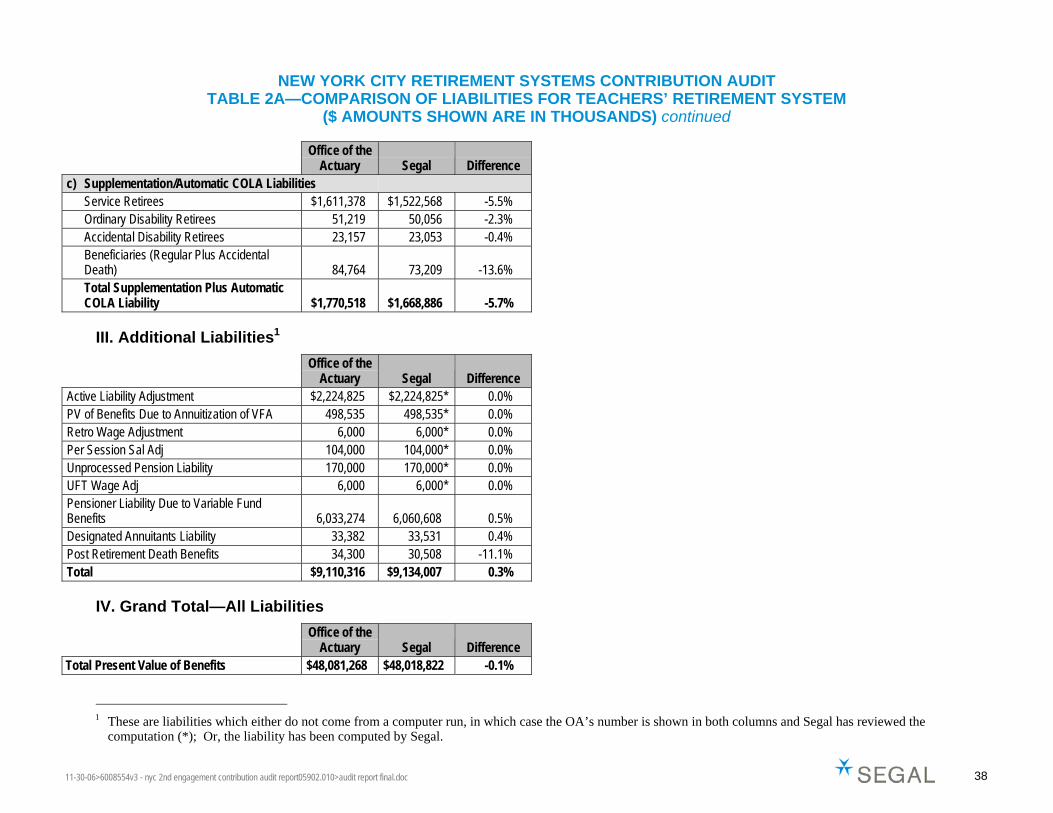
11-30-06>6008554v3 - nyc 2nd engagement contribution audit report05902.010>audit report final.doc 38
NEW YORK CITY RETIREMENT SYSTEMS CONTRIBUTION AUDIT TABLE 2A—COMPARISON OF LIABILITIES FOR TEACHERS’ RETIREMENT SYSTEM
($ AMOUNTS SHOWN ARE IN THOUSANDS) continued
Office of the
Actuary Segal Difference c) Supplementation/Automatic COLA Liabilities
Service Retirees $1,611,378 $1,522,568 -5.5% Ordinary Disability Retirees 51,219 50,056 -2.3% Accidental Disability Retirees 23,157 23,053 -0.4% Beneficiaries (Regular Plus Accidental Death) 84,764 73,209 -13.6% Total Supplementation Plus Automatic COLA Liability $1,770,518 $1,668,886 -5.7%
III. Additional Liabilities1
Office of the
Actuary Segal Difference Active Liability Adjustment $2,224,825 $2,224,825* 0.0% PV of Benefits Due to Annuitization of VFA 498,535 498,535* 0.0% Retro Wage Adjustment 6,000 6,000* 0.0% Per Session Sal Adj 104,000 104,000* 0.0% Unprocessed Pension Liability 170,000 170,000* 0.0% UFT Wage Adj 6,000 6,000* 0.0% Pensioner Liability Due to Variable Fund Benefits 6,033,274 6,060,608 0.5% Designated Annuitants Liability 33,382 33,531 0.4% Post Retirement Death Benefits 34,300 30,508 -11.1% Total $9,110,316 $9,134,007 0.3%
IV. Grand Total—All Liabilities
Office of the
Actuary Segal Difference Total Present Value of Benefits $48,081,268 $48,018,822 -0.1%
1 These are liabilities which either do not come from a computer run, in which case the OA’s number is shown in both columns and Segal has reviewed the
computation (*); Or, the liability has been computed by Segal.

11-30-06>6008554v3 - nyc 2nd engagement contribution audit report05902.010>audit report final.doc 39
NEW YORK CITY RETIREMENT SYSTEMS CONTRIBUTION AUDIT TABLE 2B—THRESHOLD TEST FOR LIABILITIES OF TEACHERS’ RETIREMENT SYSTEM
Rule 1 Individual
Liability Test Rule 2
Total Liability Test Rule 1
Test Result Rule 2
Test Result Overall
Test Result a) Active Liabilities
Service Retirement -0.3% -0.1% PASS PASS PASS Ordinary Disability 2.0% 0.0% PASS PASS PASS Accidental Disability 2.7% 0.0% PASS PASS PASS Ordinary Death 0.0% 0.0% PASS PASS PASS Accidental Death 0.0% 0.0% PASS PASS PASS Vested Deferred -4.0% -0.1% PASS PASS PASS Return of Contributions 3.3% 0.0% PASS PASS PASS Total Active -0.4% -0.2% PASS
b) Active Inactive Liabilities -3.1% 0.0% PASS PASS PASS c) Terminated Vested Liabilities -3.0% 0.0% PASS PASS PASS d) Retiree Liabilities
(i) Fixed Benefit Liabilities Service Retirees 0.6% 0.2% PASS PASS PASS Ordinary Disability Retirees 0.6% 0.0% PASS PASS PASS Accidental Disability Retirees 0.5% 0.0% PASS PASS PASS Accidental Death Beneficiaries 0.0% 0.0% PASS PASS PASS Beneficiaries 0.4% 0.0% PASS PASS PASS
(ii) Supplementation Benefit Liabilities Service Retirees -5.5% -0.2% FAIL PASS PASS Ordinary Disability Retirees -2.3% 0.0% PASS PASS PASS Accidental Disability Retirees -0.4% 0.0% PASS PASS PASS Beneficiaries (Regular Plus Accidental Death) -13.6% 0.0% FAIL PASS PASS
Total Retirees 0.0% 0.0% PASS e) Retiree Liabilities not Included Above
Pensioner Liability Due to Variable Fund Benefits 0.5% 0.1% PASS PASS PASS Designated Annuitants Liability 0.4% 0.0% PASS PASS PASS Post Retirement Death Benefits -11.1% 0.0% FAIL PASS PASS

11-30-06>6008554v3 - nyc 2nd engagement contribution audit report05902.010>audit report final.doc 40
NEW YORK CITY RETIREMENT SYSTEMS CONTRIBUTION AUDIT TABLE 2C—DEVELOPMENT OF FISCAL YEAR 2006 CONTRIBUTION – TRS
($ AMOUNTS SHOWN ARE IN THOUSANDS)
Office of the
Actuary Segal Difference ($) Difference (%)
Total PVB $48,081,268 $48,018,822 ($62,446) -0.1%
Assets
Actuarial Value of Assets $34,331,160 $34,331,160 $0 0.0%
Present Value of Future UAL Conts 10,439 10,439 — 0.0%
Present Value of Future Employee Contributions 464,292 462,478 (1,814) -0.4%
Due from TDA Program (203,501) (203,501) — 0.0%
Total Prospective Assets $34,602,390 $34,600,576 ($1,814) 0.0%
Present Value of Future Employer Normal Contributions $13,478,878 $13,418,246 ($60,632) -0.4%
Present Value of Future Salaries (Proj, 1-Yr Lag Methodology) $63,694,768 $64,471,133 $776,365 1.2%
Normal Cost Percentage 21.162% 20.813% N/A -1.6%
Annual Payroll (Proj, 1-Yr Lag Methodology) $6,208,883 $6,176,054 ($32,829) -0.5%
Normal Contribution $1,313,924 $1,285,422 ($28,502) -2.2%
Normal Cont Credit A/C CH125/00 — — — 0.0%
Consolidated UAL Contribution 2,687 2,687 — 0.0%
Investment Expenses — — — 0.0%
Administrative Expenses — — — 0.0%
Total Teachers’ Retirement System Contribution $1,316,611 $1,288,109 ($28,502) -2.2%
Note: Detailed figures may not add due to rounding

11-30-06>6008554v3 - nyc 2nd engagement contribution audit report05902.010>audit report final.doc 41
NEW YORK CITY RETIREMENT SYSTEMS CONTRIBUTION AUDIT TABLE 3A—COMPARISON OF LIABILITIES FOR BOARD OF EDUCATION RETIREMENT SYSTEM
($ AMOUNTS SHOWN ARE IN THOUSANDS)
I. Actives Valuation Liability Comparison Tier 1 Tier 2 Tiers 3 & 4 Total
Office of the
Actuary Segal Difference
Office of the
Actuary Segal Difference
Office of the
Actuary Segal Difference
Office of the
Actuary Segal Difference a) Active Employees
Count (Unrounded) 367 367 0.0% 145 145 0.0% 20,387 20,387 0.0% 20,899 20,899 0.0% Total Payroll $16,731 $16,731 0.0% $7,347 $7,347 0.0% $600,806 $600,806 0.0% $624,884 $624,884 0.0% PV Future Salary 63,901 72,665 13.7% 37,361 34,152 -8.6% 5,462,777 5,640,453 3.3% 5,564,039 5,747,270 3.3% Liability by Decrement:
Service Retirement $101,150 $101,956 0.8% $43,005 $43,632 1.5% $1,206,421 $1,223,244 1.4% $1,350,576 $1,368,832 1.4% Ordinary Disability 2,033 2,230 9.7% 1,147 1,062 -7.4% 54,474 56,753 4.2% 57,654 60,045 4.1% Accidental Disability 79 88 11.4% 45 44 -2.2% 2,521 2,623 4.0% 2,645 2,755 4.2% Ordinary Death 1,194 1,107 -7.3% 291 270 -7.2% 22,874 19,243 -15.9% 24,359 20,620 -15.3% Accidental Death 0 0 0.0% 0 0 0.0% 0 0 0.0% — — 0.0% Vested Deferred 692 1,103 59.4% 472 637 35.0% 55,785 59,413 6.5% 56,949 61,153 7.4% Return of Contributions 0 2 0.0% 0 0 0.0% 2,562 2,326 -9.2% 2,562 2,328 -9.1%
Total Active Employees Liability $105,148 $106,486 1.3% $44,960 $45,645 1.5% $1,344,637 $1,363,602 1.4% $1,494,745 $1,515,733 1.4% b) Active Inactives
Count (Unrounded) 49 49 0.0% 17 17 0.0% 4,709 4,709 0.0% 4,775 4,775 0.0% Liability $1,999 $2,382 19.2% $572 $622 8.7% $47,342 $48,723 2.9% $49,913 $51,727 3.6%
c) Terminated Vested Members Count (Unrounded) 3 3 0.0% 6 6 0.0% 178 178 0.0% 187 187 0.0% Liability $240 $236 -1.7% $864 $1,040 20.4% $6,474 $7,422 14.6% $7,578 $8,698 14.8%
d) Miscellaneous Active Valuation Liabilities Transfer Liability 1 $14,500 $14,5001 0.0% Reserve for Loan Insurance 400 4001 0.0% Accumulated Employee Contribution Adj 47,142 47,1421 0.0%
e) Total Active Valuation Liability $1,614,278 $1,638,200 1.5%
1 These liabilities do not come from a computer run on a per life basis; instead, they are developed in special worksheets designed by the OA, and Segal has been
provided with these worksheets for review.

11-30-06>6008554v3 - nyc 2nd engagement contribution audit report05902.010>audit report final.doc 42
NEW YORK CITY RETIREMENT SYSTEMS CONTRIBUTION AUDIT TABLE 3A—COMPARISON OF LIABILITIES FOR BOARD OF EDUCATION RETIREMENT SYSTEM
($ AMOUNTS SHOWN ARE IN THOUSANDS) continued
II. Retired Members Liability Comparison Fixed Dollar Benefit Supplementation Benefit Total Benefit
Office of the
Actuary Segal Difference Office of the
Actuary Segal Difference Office of the
Actuary Segal Difference a) Benefits in Force
Retiree Count (Unrounded) 11,625 11,626 0.0% 11,574 11,599 0.2% 11,625 11,626 0.0% Annual Benefits Payable:
Service Retirees $104,207 $104,221 0.0% $8,616 $8,620 0.0% $112,823 $112,841 0.0% Ordinary Disability Retirees 4,278 4,278 0.0% 186 187 0.5% 4,464 4,465 0.0% Accidental Disability Retirees 1,219 1,219 0.0% 232 232 0.0% 1,451 1,451 0.0% Accidental Death Beneficiaries 12 12 0.0% 17 17 0.0% 29 29 0.0% Beneficiaries 6,123 6,123 0.0% 1,416 1,416 0.0% 7,539 7,539 0.0%
Total Benefit $115,839 $115,853 0.0% $10,467 $10,472 0.0% $126,306 $126,325 0.0%
Note: Annual benefits shown for supplementation do not include the Sept. 2003 COLA increases
Annuity Fund Pension Fund Total Fund
Office of the
Actuary Segal Difference Office of the
Actuary Segal Difference Office of the
Actuary Segal Difference b) Fixed Dollar Benefit Liabilities
Service Retirees $49,254 $49,489 0.5% $794,606 $798,366 0.5% $843,860 $847,855 0.5% Ordinary Disability Retirees 1,154 1,162 0.7% 34,846 35,034 0.5% 36,000 36,196 0.5% Accidental Disability Retirees 253 254 0.4% 9,191 9,255 0.7% 9,444 9,509 0.7% Accidental Death Beneficiaries 0 0 0.0% 115 112 -2.6% 115 112 -2.6% Beneficiaries 3,133 3,155 0.7% 40,947 41,157 0.5% 44,080 44,312 0.5% Total Fixed Benefit Pensioner Liability $53,794 $54,060 0.5% $879,705 $883,924 0.5% $933,499 $937,984 0.5%
Note: Employer Contribution is based on “Total Fund” results, not the allocation between Annuity/Pension Funds. As such, any discrepancies between Segal and the OA results in these breakdowns do not impact the Employer Contribution.

11-30-06>6008554v3 - nyc 2nd engagement contribution audit report05902.010>audit report final.doc 43
NEW YORK CITY RETIREMENT SYSTEMS CONTRIBUTION AUDIT TABLE 3A—COMPARISON OF LIABILITIES FOR BOARD OF EDUCATION RETIREMENT SYSTEM
($ AMOUNTS SHOWN ARE IN THOUSANDS) continued
II. Retired Members Liability Comparison continued
Office of the
Actuary Segal Difference c) Supplementation/Automatic COLA Liabilities
Service Retirees $108,596 $102,114 -6.0% Ordinary Disability Retirees 4,580 4,137 -9.7% Accidental Disability Retirees 2,396 2,337 -2.5% Beneficiaries (Regular Plus Accidental Death) 11,681 9,845 -15.7% Total Supplementation Plus Automatic COLA Liability $127,253 $118,433 -6.9%
III. Additional Liabilities1
Office of the
Actuary Segal Difference Active Liability Adjustment $40,648 $40,648* 0.0% PV of Benefits Due to Annuitization of VFA 813 813* 0.0% Pen Adj 6,000 6,000* Pensioner Liability Due to Variable Fund Benefits 25,066 25,141 0.3% Post Retirement Death Benefits 250 237 -5.2% Total $72,777 $72,839 0.1%
IV. Grand Total—All Liabilities
Office of the
Actuary Segal Difference Total Present Value of Benefits $2,747,807 $2,767,456 0.7%
1 These are liabilities which either do not come from a computer run, in which case the OA's number is shown in both columns and Segal has reviewed the computation
(*); or, the liability has been computed by Segal.

11-30-06>6008554v3 - nyc 2nd engagement contribution audit report05902.010>audit report final.doc 44
NEW YORK CITY RETIREMENT SYSTEMS CONTRIBUTION AUDIT TABLE 3B—THRESHOLD TEST FOR LIABILITIES OF BOARD OF EDUCATION RETIREMENT SYSTEM
Rule 1 Individual
Liability Test Rule 2
Total Liability Test Rule 1
Test Result Rule 2
Test Result Overall
Test Result a) Active Liabilities
Service Retirement 1.4% 0.7% PASS FAIL PASS Ordinary Disability 4.1% 0.1% PASS PASS PASS Accidental Disability 4.2% 0.0% PASS PASS PASS Ordinary Death -15.3% -0.1% FAIL PASS PASS Accidental Death 0.0% 0.0% PASS PASS PASS Vested Deferred 7.4% 0.2% FAIL PASS PASS Return of Contributions -9.1% 0.0% FAIL PASS PASS Total Active 1.4% 0.8% PASS
b) Active Inactive Liabilities 3.6% 0.1% PASS PASS PASS c) Terminated Vested Liabilities 14.8% 0.0% FAIL PASS PASS d) Retiree Liabilities
(i) Fixed Benefit Liabilities Service Retirees 0.5% 0.1% PASS PASS PASS Ordinary Disability Retirees 0.5% 0.0% PASS PASS PASS Accidental Disability Retirees 0.7% 0.0% PASS PASS PASS Accidental Death Beneficiaries -2.6% 0.0% PASS PASS PASS Beneficiaries 0.5% 0.0% PASS PASS PASS
(ii) Supplementation Benefit Liabilities Service Retirees -6.0% -0.2% FAIL PASS PASS Ordinary Disability Retirees -9.7% 0.0% FAIL PASS PASS Accidental Disability Retirees -2.5% 0.0% PASS PASS PASS Beneficiaries (Regular Plus Accidental Death) -15.7% -0.1% FAIL PASS PASS
Total Retirees -0.4% -0.2% PASS e) Retiree Liabilities not Included Above
Pensioner Liability Due to Variable Fund Benefits 0.5% 0.1% PASS PASS PASS Post Retirement Death Benefits 0.4% 0.0% PASS PASS PASS

11-30-06>6008554v3 - nyc 2nd engagement contribution audit report05902.010>audit report final.doc 45
NEW YORK CITY RETIREMENT SYSTEMS CONTRIBUTION AUDIT TABLE 3C—DEVELOPMENT OF FISCAL YEAR 2006 CONTRIBUTION – BERS
($ AMOUNTS SHOWN ARE IN THOUSANDS)
Office of the
Actuary Segal Difference ($) Difference (%)
Total PVB $2,747,807 $2,767,456 $19,649 0.7%
Assets
Actuarial Value of Assets $1,936,786 $1,936,786 $0 0.0%
Present Value of Future UAL Conts 6,794 6,794 — 0.0%
Present Value of Future Employee Contributions 87,140 85,067 (2,073) -2.4%
Due from TDA Program (13,029) (13,029) — 0.0%
Total Prospective Assets $2,017,691 $2,015,618 ($2,073) -0.1%
Present Value of Future Employer Normal Contributions $730,116 $751,838 $21,722 3.0%
Present Value of Future Salaries (Proj, 1-Yr Lag Methodology) $4,975,507 $5,158,009 $182,502 3.7%
Normal Cost Percentage 14.674% 14.576% N/A -0.7%
Annual Payroll (Proj, 1-Yr Lag Methodology) 605,594 602,167 (3,427) -0.6%
Normal Contribution $88,865 $87,772 ($1,093) -1.2%
Normal Cont Credit A/C CH125/00 — — — 0.0%
Consolidated UAL Contribution 1,974 1,974 — 0.0%
Investment Expenses — — — 0.0%
Administrative Expenses — — — 0.0%
Total BERS Contribution $90,839 $89,746 ($1,093) -1.2%
Note: Detailed figures may not add due to rounding

11-30-06>6008554v3 - nyc 2nd engagement contribution audit report05902.010>audit report final.doc 46
NEW YORK CITY RETIREMENT SYSTEMS CONTRIBUTION AUDIT TABLE 4A—COMPARISON OF LIABILITIES FOR POLICE PENSION FUND
($ AMOUNTS SHOWN ARE IN THOUSANDS)
I. Actives Valuation Liability Comparison Tier 1 Tier 2 Total
Office of the
Actuary Segal Difference Office of the
Actuary Segal Difference Office of the
Actuary Segal Difference a) Active Employees
Count (Unrounded) 175 175 0.0% 34,874 34,874 0.0% 35,049 35,049 0.0% Total Payroll $20,898 $20,898 0.0% $2,736,764 $2,736,764 0.0% $2,757,662 $2,757,662 0.0% PV Future Salary 47,951 46,977 -2.0% 22,086,222 21,931,258 -0.7% 22,134,173 21,978,235 -0.7% Liability by Decrement:
Service Retirement $120,085 $120,619 0.4% $9,866,488 $9,838,279 -0.3% $9,986,573 $9,958,898 -0.3% Ordinary Disability 22,398 22,257 -0.6% 517,902 520,942 0.6% 540,300 543,199 0.5% Accidental Disability 30,594 30,329 -0.9% 2,942,624 2,935,478 -0.2% 2,973,218 2,965,807 -0.2% Ordinary Death 3,001 2,989 -0.4% 131,758 131,865 0.1% 134,759 134,854 0.1% Accidental Death 44 43 -2.3% 14,747 14,670 -0.5% 14,791 14,713 -0.5% Vested Deferred 0 0 0.0% 269,803 274,999 1.9% 269,803 274,999 1.9% Return of Contributions 0 0 0.0% 2,864 2,830 -1.2% 2,864 2,830 -1.2%
Total Active Employees Liability $176,122 $176,237 0.1% $13,746,186 $13,719,063 -0.2% $13,922,308 $13,895,300 -0.2% b) Active Inactives
Count (Unrounded) 9 9 0.0% 2,212 2,212 0.0% 2,221 2,221 0.0% Liability $7,305 $7,308 0.0% $226,755 $227,604 0.4% $234,061 $234,912 0.4%
c) Terminated Vested Members Count (Unrounded) N/A N/A N/A 490 490 0.0% 490 490 0.0% Liability N/A N/A N/A $52,353 $56,555 8.0% $52,353 $56,555 8.0%
d) Miscellaneous Active Valuation Liabilities Transfer Liability and WTC Liability $232,500 $232,5001 0.0% Reserve for Loan Insurance 3,400 3,400
1 0.0% Accumulated Employee Contribution Adj 603,163 603,163
1 0.0% e) Total Active Valuation Liability $15,047,785 $15,025,830 -0.1%
1 These liabilities do not come from a computer run on a per life basis; instead, they are developed in special worksheets designed by the OA, and Segal has been
provided with these worksheets for review.

11-30-06>6008554v3 - nyc 2nd engagement contribution audit report05902.010>audit report final.doc 47
NEW YORK CITY RETIREMENT SYSTEMS CONTRIBUTION AUDIT TABLE 4A—COMPARISON OF LIABILITIES FOR POLICE PENSION FUND
($ AMOUNTS SHOWN ARE IN THOUSANDS) continued
II. Retired Members Liability Comparison Fixed Dollar Benefit Supplementation Benefit Total Benefit
Office of the
Actuary Segal Difference Office of the
Actuary Segal Difference Office of the
Actuary Segal Difference a) Benefits in Force
Retiree Count (Unrounded) 39,452 39,452 0.0% 39,384 39,370 0.0% 39,452 39,452 0.0% Annual Benefits Payable:
Service Retirees $620,287 $620,287 0.0% $97,893 $99,052 1.2% $718,180 $719,339 0.2% Ordinary Disability Retirees 90,036 90,036 0.0% 23,167 23,193 0.1% 113,203 113,229 0.0% Accidental Disability Retirees 361,579 361,579 0.0% 59,374 59,391 0.0% 420,953 420,970 0.0% Accidental Death Beneficiaries 5,274 5,269 -0.1% 2,221 2,225 0.2% 7,495 7,494 0.0% Beneficiaries 9,100 9,104 0.0% 4,272 4,274 0.0% 13,372 13,378 0.0%
Total Benefit $1,086,276 $1,086,275 0.0% $186,927 $188,135 0.6% $1,273,203 $1,274,410 0.1% Annuity Fund Pension Fund Total Fund
Office of the
Actuary Segal Difference Office of the
Actuary Segal Difference Office of the
Actuary Segal Difference b) Fixed Dollar Benefit Liabilities
Service Retirees $151,603 $113,165 -25.4% $6,088,969 $6,118,558 0.5% $6,240,572 $6,231,723 -0.1% Ordinary Disability Retirees 20,775 20,154 -3.0% 711,455 713,400 0.3% 732,230 733,554 0.2% Accidental Disability Retirees 91,107 81,001 -11.1% 3,552,574 3,565,074 0.4% 3,643,681 3,646,075 0.1% Accidental Death Beneficiaries 11 0 -100.0% 53,401 52,287 -2.1% 53,412 52,287 -2.1% Beneficiaries 7,457 2,778 -62.7% 62,079 66,761 7.5% 69,536 69,539 0.0% Sal Adjustment Unprocess1 N/A N/A N/A N/A N/A N/A 211,000 211,000 0.0% Total Fixed Benefit Pensioner Liability $270,953 $217,098 -19.9% $10,468,478 $10,516,080 0.5% $10,950,431 $10,944,178 -0.1%
Note: Employer Contribution is based on “Total Fund” results, not the allocation between Annuity/Pension Funds. As such, any discrepancies between Segal and the OA results in these breakdowns do not impact the Employer Contribution.
1 This number is developed in a special worksheet designed by the OA, representing anticipated liability adjustments for retirees with unfinal pension contracts; Segal
was provided with these worksheets for review.

11-30-06>6008554v3 - nyc 2nd engagement contribution audit report05902.010>audit report final.doc 48
NEW YORK CITY RETIREMENT SYSTEMS CONTRIBUTION AUDIT TABLE 4A—COMPARISON OF LIABILITIES FOR POLICE PENSION FUND
($ AMOUNTS SHOWN ARE IN THOUSANDS) continued
Office of the
Actuary Segal Difference c) Supplementation/Automatic COLA Liabilities
Service Retirees $1,022,776 $1,023,602 0.1% Ordinary Disability Retirees 222,235 220,199 -0.9% Accidental Disability Retirees 689,949 681,509 -1.2% Beneficiaries (Regular Plus Accidental Death) 48,641 49,816 2.4% Total Supplementation Plus Automatic COLA Liability $1,983,601 $1,975,126 -0.4%
III. VSF Funds Liability Comparison
Office of the
Actuary Segal Difference a) Active VSF Liability1 $2,029,600 $2,000,296 -1.4% b) Retiree VSF Liability1 2,145,621 2,116,909 -1.3% c) Total VSF Liability1 $4,175,221 $4,117,205 -1.4%
IV. Grand Total—All Liabilities
Office of the
Actuary Segal Difference Total Present Value of Benefits $32,157,038 $32,062,339 -0.3%
1 VSF liabilities shown include offset due to COLA; amounts are not offset by assets in VSF funds, which is used to determine PV of future SKIM transfers.

11-30-06>6008554v3 - nyc 2nd engagement contribution audit report05902.010>audit report final.doc 49
NEW YORK CITY RETIREMENT SYSTEMS CONTRIBUTION AUDIT TABLE 4B—THRESHOLD TEST FOR LIABILITIES OF POLICE PENSION FUND
Rule 1 Individual Liability
Test Rule 2
Total Liability Test Rule 1
Test Result Rule 2
Test Result Overall
Test Result a) Active Liabilities
Service Retirement -0.3% -0.1% PASS PASS PASS Ordinary Disability 0.5% 0.0% PASS PASS PASS Accidental Disability -0.2% 0.0% PASS PASS PASS Ordinary Death 0.1% 0.0% PASS PASS PASS Accidental Death -0.5% 0.0% PASS PASS PASS Vested Deferred 1.9% 0.0% PASS PASS PASS Return of Contributions -1.2% 0.0% PASS PASS PASS Total Active -0.2% -0.1% PASS
b) Active Inactive Liabilities 0.4% 0.0% PASS PASS PASS c) Terminated Vested Liabilities 8.0% 0.0% FAIL PASS PASS d) Retiree Liabilities
(i) Fixed Benefit Liabilities Service Retirees -0.1% 0.0% PASS PASS PASS Ordinary Disability Retirees 0.2% 0.0% PASS PASS PASS Accidental Disability Retirees 0.1% 0.0% PASS PASS PASS Accidental Death Beneficiaries -2.1% 0.0% PASS PASS PASS Beneficiaries 0.0% 0.0% PASS PASS PASS
(ii) Supplementation Benefit Liabilities Service Retirees 0.1% 0.0% PASS PASS PASS Ordinary Disability Retirees -0.9% 0.0% PASS PASS PASS Accidental Disability Retirees -1.2% 0.0% PASS PASS PASS Beneficiaries (Regular Plus Accidental Death) 2.4% 0.0% PASS PASS PASS
Total Retirees -0.1% 0.0% PASS e) VSF Liabilities
Active VSF Liability -1.4% -0.1% PASS PASS PASS Retiree VSF Liability -1.3% -0.1% PASS PASS PASS

11-30-06>6008554v3 - nyc 2nd engagement contribution audit report05902.010>audit report final.doc 50
NEW YORK CITY RETIREMENT SYSTEMS CONTRIBUTION AUDIT TABLE 4C—DEVELOPMENT OF FISCAL YEAR 2006 CONTRIBUTION – POLICE
($ AMOUNTS SHOWN ARE IN THOUSANDS)
Office of the
Actuary Segal Difference ($) Difference (%)
Total PVB Before Adjustments $32,157,038 $32,062,339 ($94,699) -0.3%
VSF Actuarial Value of Assets Offset to VSF Liability 2,567,981 2,567,981 — 0.0%
Total PVB Net of Adjustments $29,589,057 $29,494,358 ($94,699) -0.3%
Assets
Actuarial Value of Assets $19,729,413 $19,729,413 $0 0.0%
Present Value of Future Employee Contributions 346,089 337,830 (8,259) -2.4%
Total Prospective Assets $20,075,502 $20,067,243 ($8,259) 0.0%
Present Value of Future Employer Normal Contributions $9,513,555 $9,427,115 ($86,440) -0.9%
Present Value of Future Salaries (Proj, 1-Yr Lag Methodology) $19,475,731 $19,344,831 ($130,900) -0.7%
Normal Cost Percentage 48.848% 48.732% N/A -0.2%
Annual Payroll (Proj, 1-Yr Lag Methodology) 2,738,526 2,708,203 (30,323) -1.1%
Normal Contribution $1,337,715 $1,319,761 ($17,954) -1.3%
Investment Expenses — — — 0.0%
Administrative Expenses — — — 0.0%
Total POLICE Pension Fund Contribution $1,337,715 $1,319,761 ($17,954) -1.3%
Note: Detailed figures may not add due to rounding.

11-30-06>6008554v3 - nyc 2nd engagement contribution audit report05902.010>audit report final.doc 51
NEW YORK CITY RETIREMENT SYSTEMS CONTRIBUTION AUDIT TABLE 5A—COMPARISON OF LIABILITIES FOR FIRE PENSION FUND
($ AMOUNTS SHOWN ARE IN THOUSANDS)
I. Actives Valuation Liability Comparison Tier 1 Tier 2 Total
Office of the
Actuary Segal Difference Office of the
Actuary Segal Difference Office of the
Actuary Segal Difference a) Active Employees
Count (Unrounded) 138 138 0.0% 11,101 11,101 0.0% 11,239 11,239 0.0% Total Payroll $16,405 $16,405 0.0% $848,419 $848,419 0.0% $864,824 $864,824 0.0% PV Future Salary 34,886 35,045 0.5% 8,682,298 8,790,042 1.2% 8,717,184 8,825,087 1.2% Liability by Decrement:
Service Retirement $68,334 $68,345 0.0% $2,143,120 $2,164,413 1.0% $2,211,454 $2,232,758 1.0% Ordinary Disability 12,773 12,860 0.7% 240,516 243,685 1.3% 253,289 256,545 1.3% Accidental Disability 48,970 49,303 0.7% 2,619,731 2,637,431 0.7% 2,668,701 2,686,734 0.7% Ordinary Death 1,770 1,784 0.8% 94,046 94,559 0.5% 95,816 96,343 0.6% Accidental Death 753 751 -0.3% 62,944 63,141 0.3% 63,697 63,892 0.3% Vested Deferred 0 0 0.0% 26,711 27,046 1.3% 26,711 27,046 1.3% Return of Contributions 0 0 0.0% 133 139 4.5% 133 139 4.5%
Total Active Employees Liability $132,600 $133,043 0.3% $5,187,201 $5,230,414 0.8% $5,319,801 $5,363,457 0.8% b) Active Inactives
Count (Unrounded) 2 2 0.0% 58 58 0.0% 60 60 0.0% Liability $1,283 $1,288 0.4% $7,039 $7,066 0.4% $8,322 $8,354 0.4%
c) Terminated Vested Members Count (Unrounded) N/A N/A N/A 0 0 0.0% 12 12 0.0% Liability N/A N/A N/A $1,199 $1,496 24.8% $1,199 $1,496 24.8%
d) Miscellaneous Active Valuation Liabilities Transfer Liability and WTC Liability $230,225 $230,225
1 0.0% Reserve for Loan Insurance 800 800
1 0.0% Accumulated Employee Contribution Adj 27,330 27,330
1 0.0% e) Total Active Valuation Liability $5,587,677 $5,631,662 0.8%
1 These liabilities do not come from a computer run on a per life basis; instead, they are developed in special worksheets designed by the OA, and Segal has been
provided with these worksheets for review.

11-30-06>6008554v3 - nyc 2nd engagement contribution audit report05902.010>audit report final.doc 52
NEW YORK CITY RETIREMENT SYSTEMS CONTRIBUTION AUDIT TABLE 5A—COMPARISON OF LIABILITIES FOR FIRE PENSION FUND
($ AMOUNTS SHOWN ARE IN THOUSANDS) continued
II. Retired Members Liability Comparison Fixed Dollar Benefit Supplementation Benefit Total Benefit
Office of the
Actuary Segal Difference Office of the
Actuary Segal Difference Office of the
Actuary Segal Difference a) Benefits in Force
Retiree Count (Unrounded) 17,459 17,458 0.0% 17,440 17,444 0.0% 17,459 17,458 0.0% Annual Benefits Payable:
Service Retirees $221,575 $221,575 0.0% $35,101 $35,210 0.3% $256,676 $256,785 0.0% Ordinary Disability Retirees 54,852 54,849 0.0% 9,016 9,018 0.0% 63,868 63,867 0.0% Accidental Disability Retirees 296,830 296,830 0.0% 41,221 41,239 0.0% 338,051 338,069 0.0% Accidental Death Beneficiaries 18,017 18,017 0.0% 2,249 2,251 0.1% 20,266 20,268 0.0% Beneficiaries 4,866 4,866 0.0% 3,712 3,712 0.0% 8,578 8,578 0.0%
Total Benefit $596,140 $596,137 0.0% $91,299 $91,430 0.1% $687,439 $687,567 0.0% Annuity Fund Pension Fund Total Fund
Office of the
Actuary Segal Difference Office of the
Actuary Segal Difference Office of the
Actuary Segal Difference b) Fixed Dollar Benefit Liabilities
Service Retirees $37,879 $15,306 -59.6% $2,038,949 $2,059,147 1.0% $2,076,828 $2,074,453 -0.1% Ordinary Disability Retirees 5,071 4,386 -13.5% 411,636 414,828 0.8% 416,707 419,214 0.6% Accidental Disability Retirees 53,808 37,538 -30.2% 2,767,779 2,784,563 0.6% 2,821,587 2,822,101 0.0% Accidental Death Beneficiaries 4,757 67 -98.6% 198,164 198,288 0.1% 202,921 198,355 -2.3% Beneficiaries 7,492 312 -95.8% 29,168 35,948 23.2% 36,660 36,260 -1.1% Sal Adjustment Unprocess1 N/A N/A N/A N/A N/A N/A 155,000 155,000 0.0% Total Fixed Benefit Pensioner Liability $109,007 $57,609 -47.2% $5,445,696 $5,492,774 0.9% $5,709,703 $5,705,383 -0.1%
Note: Employer Contribution is based on “Total Fund” results, not the allocation between Annuity/Pension Funds. As such, any discrepancies between Segal and the OA results in these breakdowns do not impact the Employer Contribution.
1 This number is developed in a special worksheet designed by the OA, representing anticipated liability adjustments for retirees with unfinal pension contracts; Segal
was provided with these worksheets for review.

11-30-06>6008554v3 - nyc 2nd engagement contribution audit report05902.010>audit report final.doc 53
NEW YORK CITY RETIREMENT SYSTEMS CONTRIBUTION AUDIT TABLE 5A—COMPARISON OF LIABILITIES FOR FIRE PENSION FUND
($ AMOUNTS SHOWN ARE IN THOUSANDS) continued
Office of the
Actuary Segal Difference c) Supplementation/Automatic COLA Liabilities
Service Retirees $307,572 $308,983 0.5% Ordinary Disability Retirees 69,724 69,875 0.2% Accidental Disability Retirees 398,504 392,441 -1.5% Beneficiaries (Regular Plus Accidental Death) 48,784 49,000 0.4% Total Supplementation Plus Automatic COLA Liability $824,584 $820,299 -0.5%
III. VSF Funds Liability Comparison
Office of the
Actuary Segal Difference a) Active VSF Liability1 $447,364 $419,387 -6.3% b) Retiree VSF Liability1 619,013 607,983 -1.8% c) Total VSF Liability1 $1,066,377 $1,027,370 -3.7%
IV. Grand Total—All Liabilities
Office of the
Actuary Segal Difference Total Present Value of Benefits $13,188,341 $13,184,714 0.0%
1 VSF liabilities shown include offset due to COLA; amounts are not offset by assets in VSF funds, which is used to determine PV of future SKIM transfers.

11-30-06>6008554v3 - nyc 2nd engagement contribution audit report05902.010>audit report final.doc 54
NEW YORK CITY RETIREMENT SYSTEMS CONTRIBUTION AUDIT TABLE 5B—THRESHOLD TEST FOR LIABILITIES OF FIRE PENSION FUND
Rule 1 Individual
Liability Test Rule 2
Total Liability Test Rule 1
Test Result Rule 2
Test Result Overall
Test Result a) Active Liabilities
Service Retirement 1.0% 0.2% PASS PASS PASS Ordinary Disability 1.3% 0.0% PASS PASS PASS Accidental Disability 0.7% 0.1% PASS PASS PASS Ordinary Death 0.6% 0.0% PASS PASS PASS Accidental Death 0.3% 0.0% PASS PASS PASS Vested Deferred 1.3% 0.0% PASS PASS PASS Return of Contributions 4.5% 0.0% PASS PASS PASS Total Active 0.8% 0.3% PASS
b) Active Inactive Liabilities 0.4% 0.0% PASS PASS PASS c) Terminated Vested Liabilities 24.8% 0.0% FAIL PASS PASS d) Retiree Liabilities
(i) Fixed Benefit Liabilities Service Retirees -0.1% 0.0% PASS PASS PASS Ordinary Disability Retirees 0.6% 0.0% PASS PASS PASS Accidental Disability Retirees 0.0% 0.0% PASS PASS PASS Accidental Death Beneficiaries -2.3% 0.0% PASS PASS PASS Beneficiaries -1.1% 0.0% PASS PASS PASS
(ii) Supplementation Benefit Liabilities Service Retirees 0.5% 0.0% PASS PASS PASS Ordinary Disability Retirees 0.2% 0.0% PASS PASS PASS Accidental Disability Retirees -1.5% 0.0% PASS PASS PASS Beneficiaries (Regular Plus Accidental Death) 0.4% 0.0% PASS PASS PASS
Total Retirees -0.1% -0.1% PASS e) VSF Liabilities
Active VSF Liability -6.3% -0.2% FAIL PASS PASS Retiree VSF Liability -1.8% -0.1% PASS PASS PASS

11-30-06>6008554v3 - nyc 2nd engagement contribution audit report05902.010>audit report final.doc 55
NEW YORK CITY RETIREMENT SYSTEMS CONTRIBUTION AUDIT TABLE 5C—DEVELOPMENT OF FISCAL YEAR 2006 CONTRIBUTION – FIRE
($ AMOUNTS SHOWN ARE IN THOUSANDS)
Office of the
Actuary Segal Difference ($) Difference (%)
Total PVB Before Adjustments $13,188,341 $13,184,714 ($3,627) 0.0% VSF Actuarial Value of Assets Offset to VSF Liability 969,104 969,104 — 0.0%
Total PVB Net of Adjustments $12,219,237 $12,215,610 ($3,627) 0.0% Assets
Actuarial Value of Assets $6,748,327 $6,748,327 $0 0.0% Present Value of Future UAL Contributions 105,170 105,170 — 0.0% Present Value of Future Employee Contributions 81,905 81,115 (790) -1.0%
Total Prospective Assets $6,935,402 $6,934,612 ($790) 0.0% Present Value of Future Employer Normal Contributions $5,283,835 $5,280,998 ($2,837) -0.1% Present Value of Future Salaries (Proj, 1-Yr Lag Methodology) $7,881,652 $7,989,206 $107,554 1.4% Normal Cost Percentage 67.040% 66.102% N/A -1.4% Annual Payroll (Proj, 1-Yr Lag Methodology) 876,667 873,894 (2,773) -0.3% Normal Contribution $587,718 $577,661 ($10,056) -1.7% UAL Contribution 21,054 21,054 — 0.0% Investment Expenses — — — 0.0% Adminstrative Expenses — — — 0.0% Total FIRE Pension Fund Contribution $608,772 $598,715 ($10,056) -1.7%
Note: Detailed figures may not add due to rounding.

11-30-06>6008554v3 - nyc 2nd engagement contribution audit report05902.010>audit report final.doc 56
TABLE 6 NEW YORK CITY RETIREMENT SYSTEMS CONTRIBUTION AUDIT
VARIABLE SUPPLEMENTS FUNDS BENEFIT AND LIABILITY COMPARISONS
Benefits Comparison Liabilities Comparison Actual
Payments Annual Benefit
Actual Payments
Fund FY End 6/30/041
Rate as of 6/30/042
FY End 6/30/051 OA PVB Segal PVB
Percent Delta
Police Officers’ VSF $56,105,843 $54,118,488 $66,007,387 $1,648,152,025 $1,618,480,049 (1.8%)
Police Superior Officers’ VSF 90,488,731 88,346,030 106,388,776 2,257,069,178 2,498,725,170 (1.1%)
Firefighters’ VSF 27,718,621 29,838,929 31,056,783 683,569,572 660,720,404 (3.3%)
Fire Officers’ VSF 11,591,698 13,002,895 12,726,625 382,807,561 366,649,725 (4.2%)
Housing Police Officers’ VSF 1,785,453 1,666,978 1,951,676 30,492,786 30,178,523 (1.0%)
Housing Police Superior Officers’ VSF
2,246,437 2,114,724 2,451,466 36,856,623 36,858,632 0.0%
Transit Police Officers’ VSF 3,031,877 2,861,224 3,380,139 53,622,429 53,179,924 (0.8%)
Transit Police Superior Officers’ VSF
2,496,045 2,234,480 2,515,805 39,753,501 39,676,645 (0.2%)
Corrections’ VSF 16,232,490 20,727,927 22,660,810 1,127,079,631 1,144,611,176 1.6%
1 As per the financial statements provided by the Funds’ independent auditor (Deloitte). 2 As per Segal’s VSF valuation results.