shrewsbury contributory retirement …€¦ · present value of actuarial accrued liabilities 5 ......
TRANSCRIPT

SHREWSBURY CONTRIBUTORY RETIREMENT SYSTEM
Actuarial Valuation Report January 1, 2017

Shrewsbury Retirement System Shrewsbury 17
TABLE OF CONTENTS
Page REPORT SUMMARY
Highlights 1
Introduction 2
Actuarial Experience 3
ACTUARIAL COSTS AND LIABILITIES
Normal Costs 4
Present Value of Actuarial Accrued Liabilities 5
Present Value of Future Benefits 6
FUNDED STATUS AND APPROPRIATIONS
Market Value of Plan Assets 7
Actuarial Value of Assets 8
Unfunded Actuarial Accrued Liabilities 9
Appropriations 10
Appropriation Forecast 11
EXHIBITS
1 Age/Service Distribution with Salary 15
2 Retiree Distribution 16
3 Disabled Retiree Distribution 17
4 Distribution Forecast 18
5 Summary of Plan Provisions 19
6 Actuarial Methods and Assumptions 28
7 Glossary of Terms 33
CERTIFICATION 35
BREAKOUTS 36
Shrewsbury Retirement System Page 1
H:\Shrewsbury\Val17\[Shrew17_Val Experience 7_5% v3.xlsm]Approp. Results
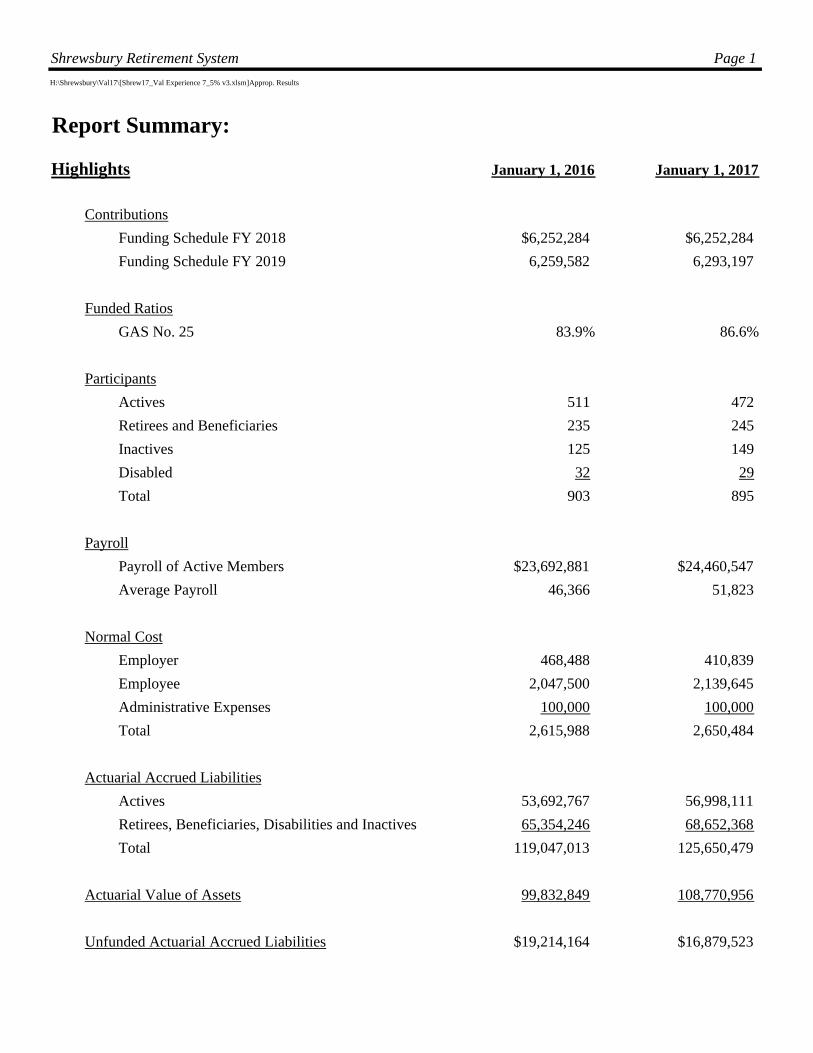
Report Summary:
Highlights January 1, 2016 January 1, 2017
Contributions
Funding Schedule FY 2018 $6,252,284 $6,252,284
Funding Schedule FY 2019 6,259,582 6,293,197
Funded Ratios
GAS No. 25 83.9% 86.6%
Participants
Actives 511 472
Retirees and Beneficiaries 235 245
Inactives 125 149
Disabled 32 29
Total 903 895
Payroll
Payroll of Active Members $23,692,881 $24,460,547
Average Payroll 46,366 51,823
Normal Cost
Employer 468,488 410,839
Employee 2,047,500 2,139,645
Administrative Expenses 100,000 100,000
Total 2,615,988 2,650,484
Actuarial Accrued Liabilities
Actives 53,692,767 56,998,111
Retirees, Beneficiaries, Disabilities and Inactives 65,354,246 68,652,368
Total 119,047,013 125,650,479
Actuarial Value of Assets 99,832,849 108,770,956
Unfunded Actuarial Accrued Liabilities $19,214,164 $16,879,523

Shrewsbury Retirement System Page 2 Shrewsbury 17
Introduction
This report presents the findings of an actuarial valuation as of January 1, 2017, of Shrewsbury
Contributory Retirement System.
The actuarial valuation is based on:
Provisions Chapter 32 of the Massachusetts General Laws, "M.G.L", as of
January 1, 2017.
Employee data provided by the Retirement Board
Asset information reported to the Public Employee Retirement Administration
Commission by the Shrewsbury Retirement System
Actuarial assumptions approved by the Retirement Board
The valuation and appropriation forecast are prepared in accordance with Chapter 32 of the M.G.L.
as of January 1, 2017.
The valuation and forecast do not account for:
Any subsequent changes in the law
Chapter 32 of the M.G.L., Section 3(8)(c) transfers between systems
State-mandated benefits
Cost-of-living increases granted to retired members between 1982 and 1997. The
cost of these benefits has been assumed by the State under Proposition Two and
One-Half.

Shrewsbury Retirement System Page 3 Shrewsbury 17
Actuarial Experience
In performing the actuarial valuation, various assumptions are made regarding such factors as
mortality, retirement, disability, and withdrawal rates as well as both payroll, salary increases, and
investment returns. A comparison of the current valuation and the prior valuation is made to
determine how closely actual experience corresponded to anticipated occurrences. This analysis of
the system provides insight into the overall quality of the actuarial assumptions and helps explain
any change in the annual appropriation.
During the last year, based on the 2016 actuarial assumptions and plan provisions, the total
unfunded actuarial accrued liability decreased by 6.3% to $16,879,523. The decrease is the result
of net unfavorable actuarial experience during the preceding year, offset by an aggressive funding
schedule. The sources of actuarial (gains) and losses are as follows:
Assets (887,895) Salary Increases 934,622 New Participants 304,649 Active - Retirements (776,083) Active - Terminations 722,125 Active - Mortality (144,334) Active - Disabilities (225,736) Inactive - Mortality and data adjustments 4,406,508 Other, including data changes, service purchases, etc. (467,951) Benefit Payments (1,388,222) Total (Gain) / Loss 2,477,684

Shrewsbury Retirement System Page 4
H:\Shrewsbury\Val17\[Shrew17_Val Experience 7_5% v3.xlsm]Approp. Results
Actuarial Costs and Liabilities:
Normal Costs
The normal cost is the sum of the individual normal costs determined for each member as if the assumptions
underlying the cost determinations had been exactly realized. An individual normal cost represents that part
of the cost of a member's future benefits which are assigned to the current year as if the costs are to remain
level as a percentage of the member's pay. Benefits payable under all circumstances (i.e., retirement, death,
disability, and terminations) are included in this calculation. Anticipated employee contributions to be made
during the year are subtracted from the total normal cost to determine employer normal cost. The total
normal cost is divided by total payroll to determine the normal cost as a percent of pay. The normal cost
is shown in Table I.
Table I
January 1, 2016 January 1, 2017
Superannuation $1,396,717 $1,430,657
Termination 813,868 805,660
Death 106,312 106,927
Disability 199,091 207,240
Administrative Expenses 100,000 100,000
Total Normal Cost 2,615,988 2,650,484
% of Pay 11.0% 10.8%
Employee Contributions 2,047,500 2,139,645
% of Pay 8.6% 8.7%
Employer Normal Cost $568,488 $510,839
% of Pay 2.4% 2.1%
Shrewsbury Retirement System Page 5
H:\Shrewsbury\Val17\[Shrew17_Val Experience 7_5% v3.xlsm]Approp. Results
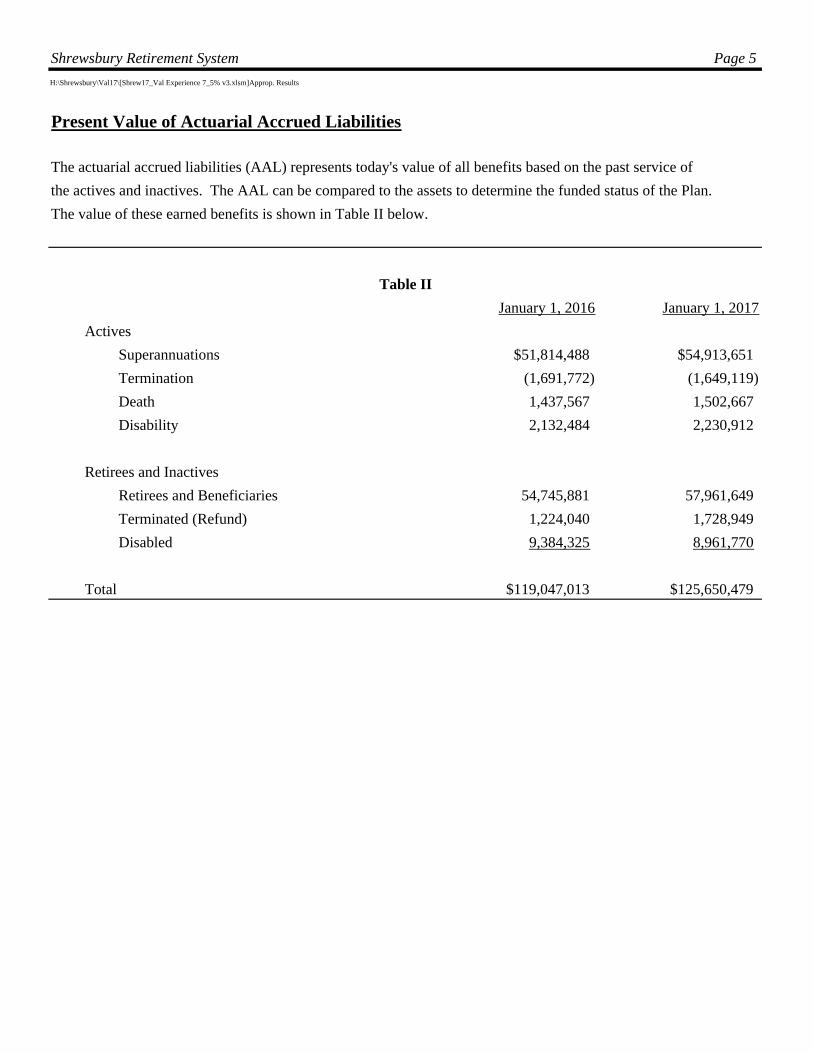
Present Value of Actuarial Accrued Liabilities
The actuarial accrued liabilities (AAL) represents today's value of all benefits based on the past service of
the actives and inactives. The AAL can be compared to the assets to determine the funded status of the Plan.
The value of these earned benefits is shown in Table II below.
Table II
January 1, 2016 January 1, 2017
Actives
Superannuations $51,814,488 $54,913,651
Termination (1,691,772) (1,649,119)
Death 1,437,567 1,502,667
Disability 2,132,484 2,230,912
Retirees and Inactives
Retirees and Beneficiaries 54,745,881 57,961,649
Terminated (Refund) 1,224,040 1,728,949
Disabled 9,384,325 8,961,770
Total $119,047,013 $125,650,479
Shrewsbury Retirement System Page 6
H:\Shrewsbury\Val17\[Shrew17_Val Experience 7_5% v3.xlsm]Approp. Results
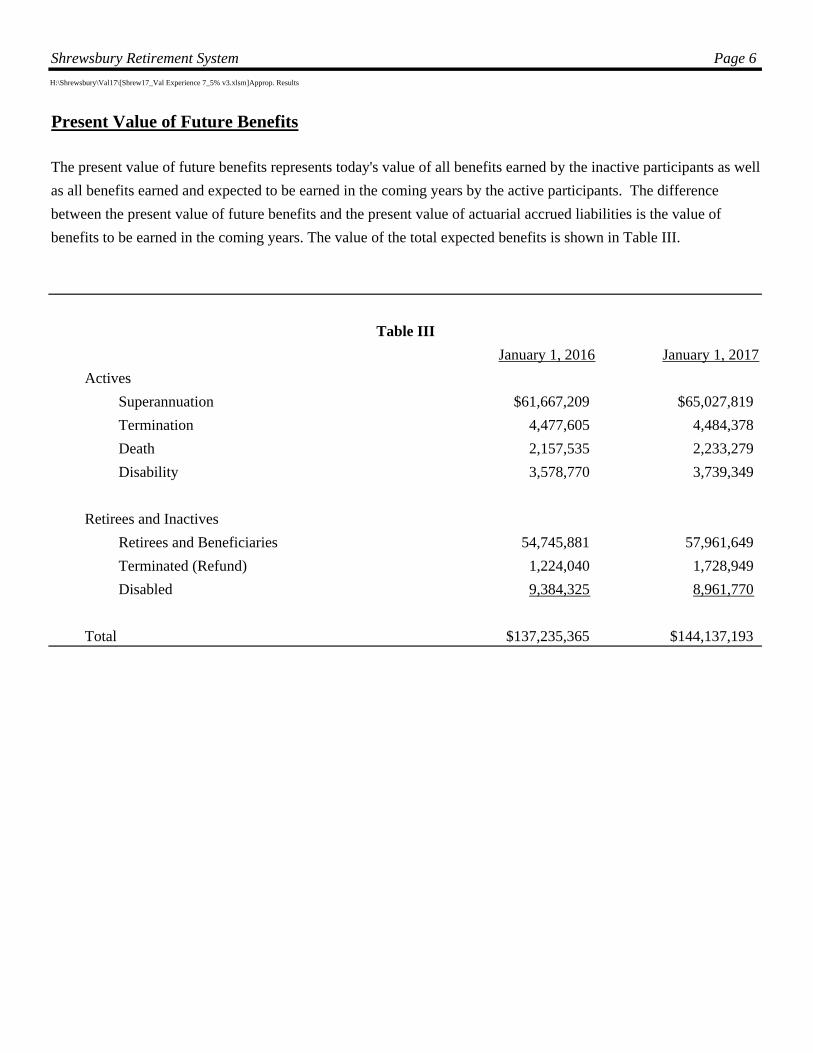
Present Value of Future Benefits
The present value of future benefits represents today's value of all benefits earned by the inactive participants as well
as all benefits earned and expected to be earned in the coming years by the active participants. The difference
between the present value of future benefits and the present value of actuarial accrued liabilities is the value of
benefits to be earned in the coming years. The value of the total expected benefits is shown in Table III.
Table III
January 1, 2016 January 1, 2017
Actives
Superannuation $61,667,209 $65,027,819
Termination 4,477,605 4,484,378
Death 2,157,535 2,233,279
Disability 3,578,770 3,739,349
Retirees and Inactives
Retirees and Beneficiaries 54,745,881 57,961,649
Terminated (Refund) 1,224,040 1,728,949
Disabled 9,384,325 8,961,770
Total $137,235,365 $144,137,193
Shrewsbury Retirement System Page 7
H:\Shrewsbury\Val17\[Shrew17_Val Experience 7_5% v3.xlsm]Approp. Results
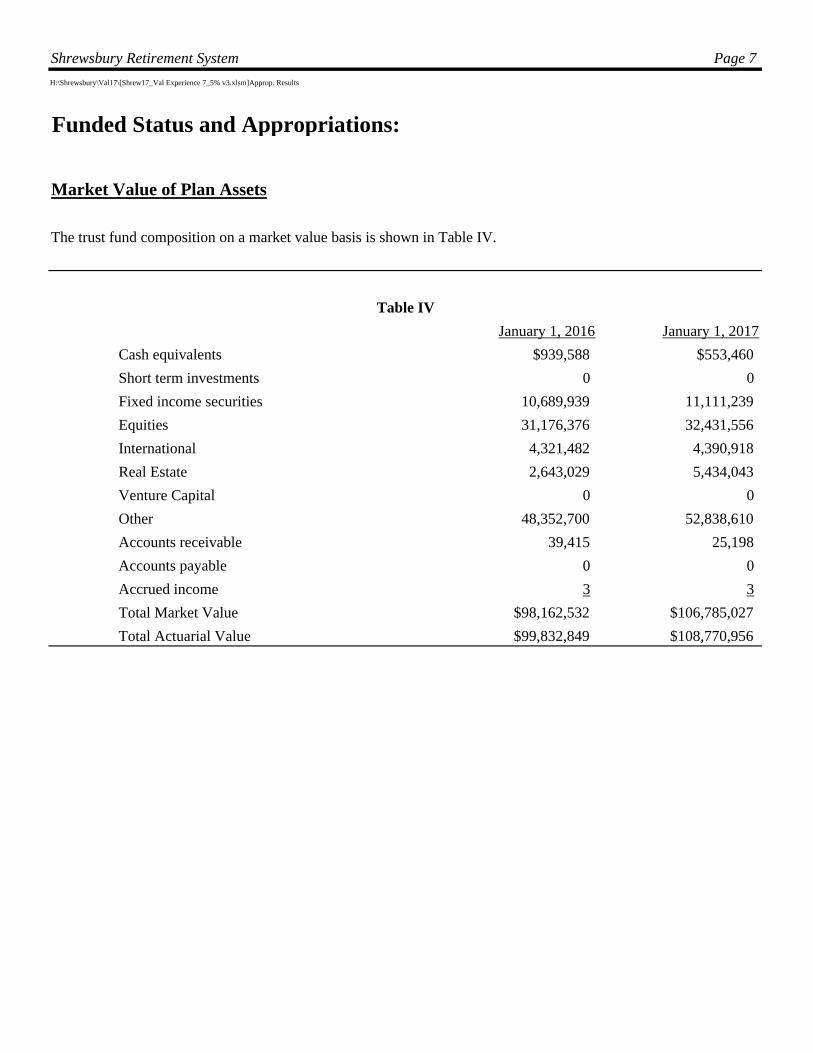
Funded Status and Appropriations:
Market Value of Plan Assets
The trust fund composition on a market value basis is shown in Table IV.
Table IV
January 1, 2016 January 1, 2017
Cash equivalents $939,588 $553,460
Short term investments 0 0
Fixed income securities 10,689,939 11,111,239
Equities 31,176,376 32,431,556
International 4,321,482 4,390,918
Real Estate 2,643,029 5,434,043
Venture Capital 0 0
Other 48,352,700 52,838,610
Accounts receivable 39,415 25,198
Accounts payable 0 0
Accrued income 3 3
Total Market Value $98,162,532 $106,785,027
Total Actuarial Value $99,832,849 $108,770,956
Shrewsbury Retirement System Page 8H:\Shrewsbury\Val17\[ShrewAssets17.xlsx]output
Actuarial Value of Assets
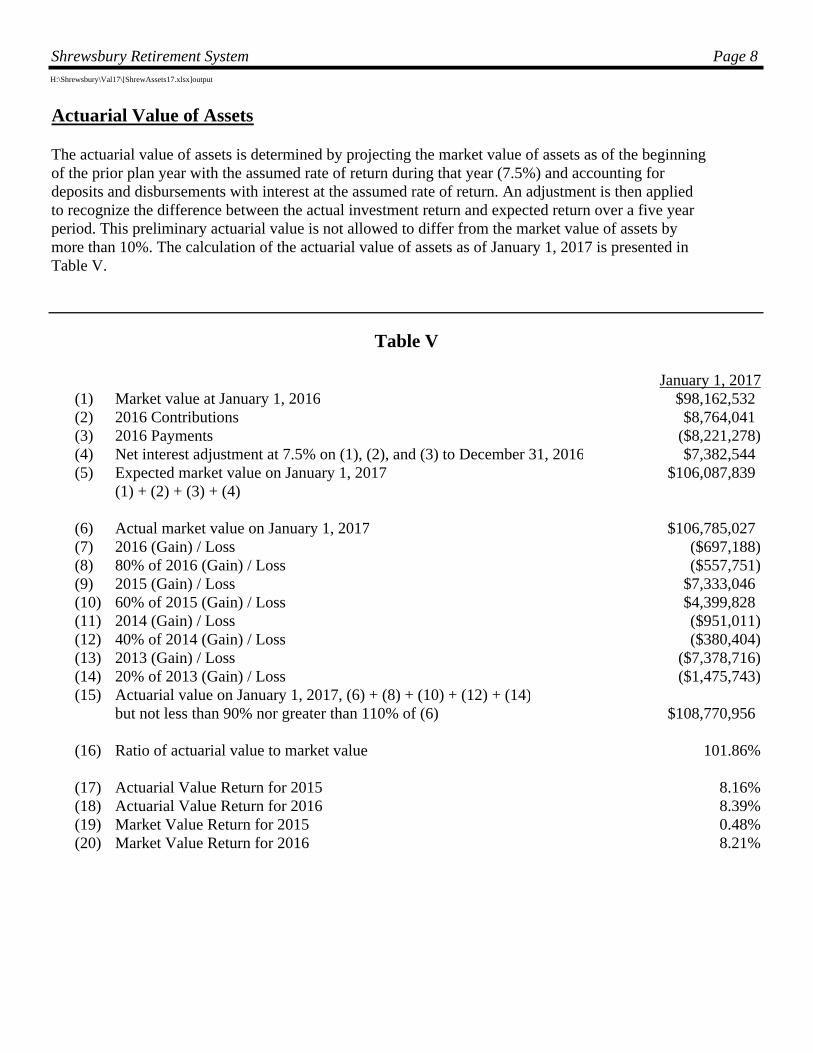
The actuarial value of assets is determined by projecting the market value of assets as of the beginning of the prior plan year with the assumed rate of return during that year (7.5%) and accounting for deposits and disbursements with interest at the assumed rate of return. An adjustment is then applied to recognize the difference between the actual investment return and expected return over a five year period. This preliminary actuarial value is not allowed to differ from the market value of assets by more than 10%. The calculation of the actuarial value of assets as of January 1, 2017 is presented in Table V.
Table V
January 1, 2017(1) Market value at January 1, 2016 $98,162,532(2) 2016 Contributions $8,764,041(3) 2016 Payments ($8,221,278)(4) Net interest adjustment at 7.5% on (1), (2), and (3) to December 31, 2016 $7,382,544(5) Expected market value on January 1, 2017 $106,087,839
(1) + (2) + (3) + (4)
(6) Actual market value on January 1, 2017 $106,785,027(7) 2016 (Gain) / Loss ($697,188)(8) 80% of 2016 (Gain) / Loss ($557,751)(9) 2015 (Gain) / Loss $7,333,046(10) 60% of 2015 (Gain) / Loss $4,399,828(11) 2014 (Gain) / Loss ($951,011)(12) 40% of 2014 (Gain) / Loss ($380,404)(13) 2013 (Gain) / Loss ($7,378,716)(14) 20% of 2013 (Gain) / Loss ($1,475,743)(15) Actuarial value on January 1, 2017, (6) + (8) + (10) + (12) + (14)
but not less than 90% nor greater than 110% of (6) $108,770,956
(16) Ratio of actuarial value to market value 101.86%
(17) Actuarial Value Return for 2015 8.16%(18) Actuarial Value Return for 2016 8.39%(19) Market Value Return for 2015 0.48%(20) Market Value Return for 2016 8.21%
Shrewsbury Retirement System Page 9
H:\Shrewsbury\Val17\[Shrew17_Val Experience 7_5% v3.xlsm]Approp. Results
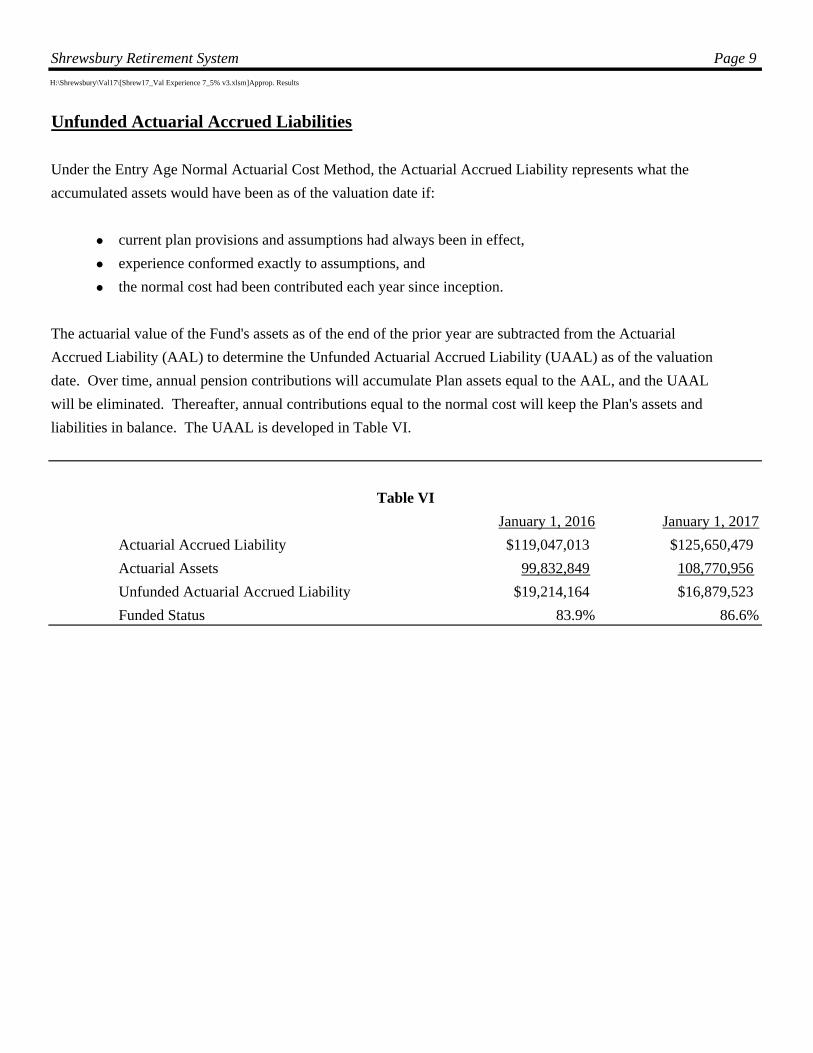
Unfunded Actuarial Accrued Liabilities
Under the Entry Age Normal Actuarial Cost Method, the Actuarial Accrued Liability represents what the
accumulated assets would have been as of the valuation date if:
current plan provisions and assumptions had always been in effect,
experience conformed exactly to assumptions, and
the normal cost had been contributed each year since inception.
The actuarial value of the Fund's assets as of the end of the prior year are subtracted from the Actuarial
Accrued Liability (AAL) to determine the Unfunded Actuarial Accrued Liability (UAAL) as of the valuation
date. Over time, annual pension contributions will accumulate Plan assets equal to the AAL, and the UAAL
will be eliminated. Thereafter, annual contributions equal to the normal cost will keep the Plan's assets and
liabilities in balance. The UAAL is developed in Table VI.
Table VI
January 1, 2016 January 1, 2017
Actuarial Accrued Liability $119,047,013 $125,650,479
Actuarial Assets 99,832,849 108,770,956
Unfunded Actuarial Accrued Liability $19,214,164 $16,879,523
Funded Status 83.9% 86.6%
Shrewsbury Retirement System Page 10
H:\Shrewsbury\Val17\[Shrew17_Val Experience 7_5% v3.xlsm]Approp. Results
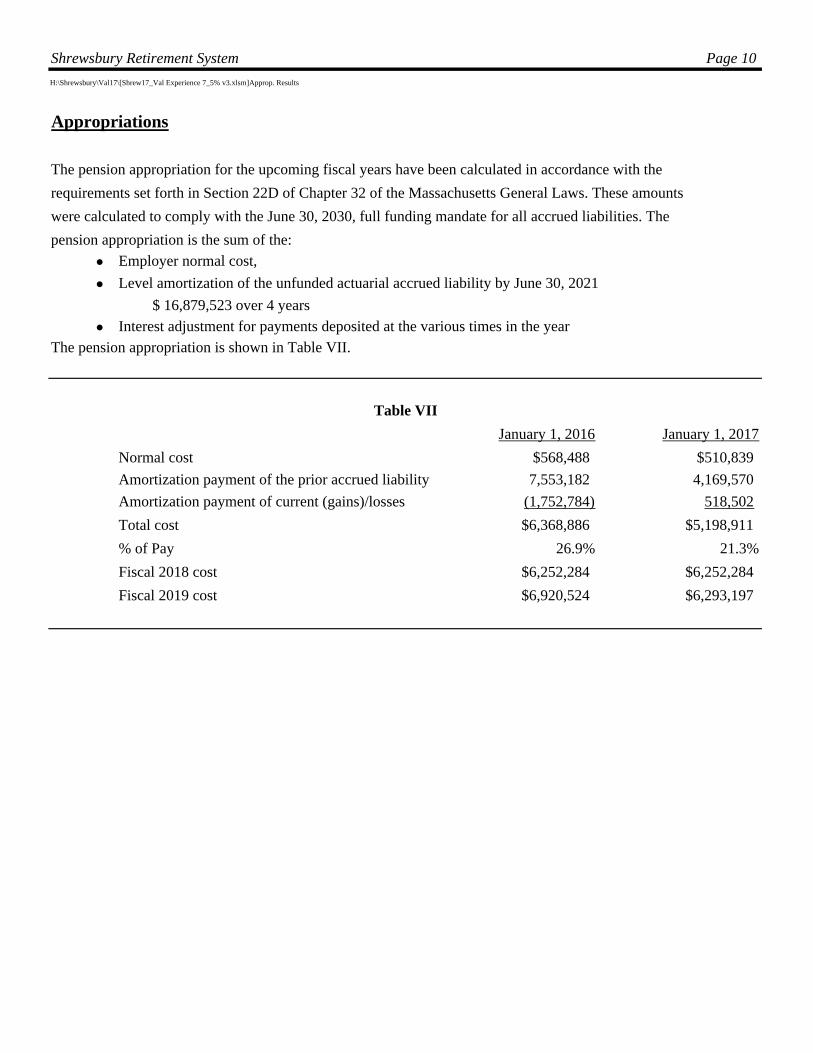
Appropriations
The pension appropriation for the upcoming fiscal years have been calculated in accordance with the
requirements set forth in Section 22D of Chapter 32 of the Massachusetts General Laws. These amounts
were calculated to comply with the June 30, 2030, full funding mandate for all accrued liabilities. The
pension appropriation is the sum of the:
Employer normal cost,
Level amortization of the unfunded actuarial accrued liability by June 30, 2021
$ 16,879,523 over 4 years
Interest adjustment for payments deposited at the various times in the year
The pension appropriation is shown in Table VII.
Table VII
January 1, 2016 January 1, 2017
Normal cost $568,488 $510,839
Amortization payment of the prior accrued liability 7,553,182 4,169,570
Amortization payment of current (gains)/losses (1,752,784) 518,502
Total cost $6,368,886 $5,198,911
% of Pay 26.9% 21.3%
Fiscal 2018 cost $6,252,284 $6,252,284
Fiscal 2019 cost $6,920,524 $6,293,197
Shrewsbury Retirement System Page 11
Shrewsbury 17
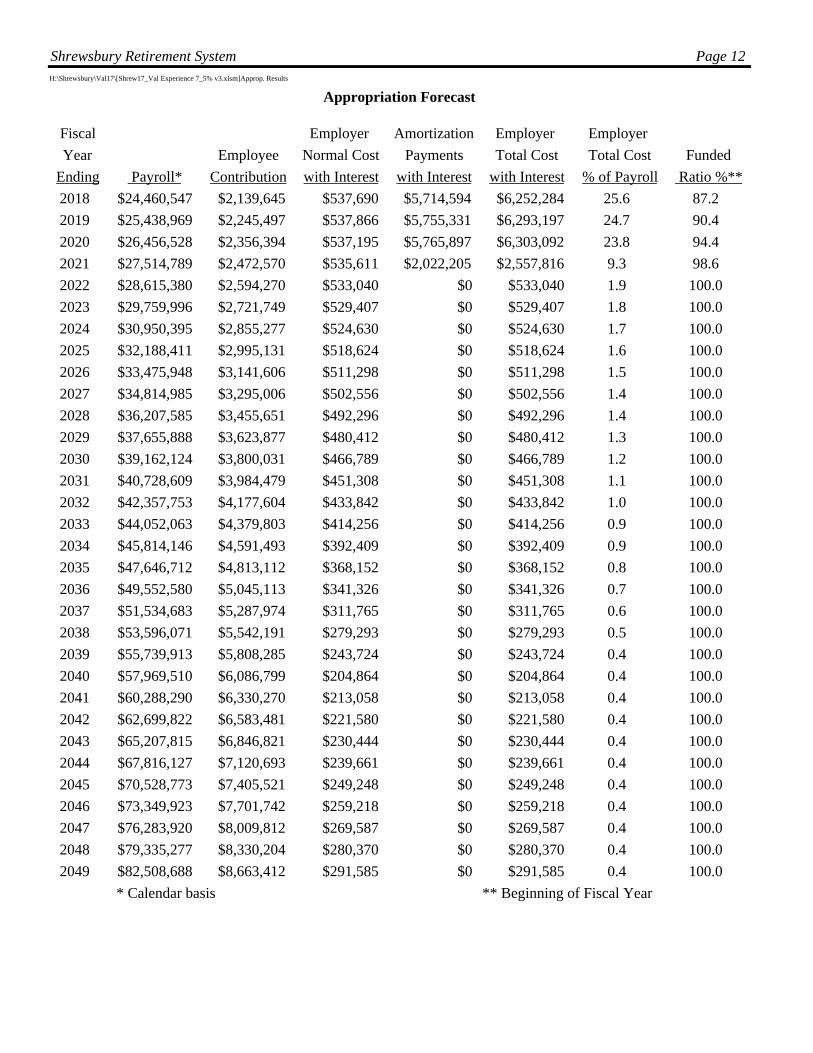
Appropriation Forecast
The following exhibit forecasts employer and employee contributions over the next 32 years under
the adopted funding schedule.
Note that the forecast is based upon an "open group" method. This method assumes that sufficient
employees will be hired each year to keep the number constant. The total payroll of the system is
expected to increase 4.0% per year. The employee contribution rate is expected to increase to
10.5% by 2042 as members contributing base percentages 5%, 7%, and 8% are replaced by new
members, whose base contribution is 9%. Payments are assumed to be made at the beginning of
the year.
The employer total cost is expected to increase during the next 4 years until the unfunded liabilities
are substantially paid off, at which time only the normal cost will remain. The total cost represents
about 26% of payroll, decreasing to 23.8% by the time the unfunded liabilities are fully paid off,
leaving only a normal cost of about 1% thereafter. The decrease in the cost as a percentage of
payroll is a result of the increase in member deductions.
Shrewsbury Retirement System Page 12H:\Shrewsbury\Val17\[Shrew17_Val Experience 7_5% v3.xlsm]Approp. Results
Appropriation Forecast
Fiscal Employer Amortization Employer Employer
Year Employee Normal Cost Payments Total Cost Total Cost Funded
Ending Payroll* Contribution with Interest with Interest with Interest % of Payroll Ratio %**
2018 $24,460,547 $2,139,645 $537,690 $5,714,594 $6,252,284 25.6 87.2
2019 $25,438,969 $2,245,497 $537,866 $5,755,331 $6,293,197 24.7 90.4
2020 $26,456,528 $2,356,394 $537,195 $5,765,897 $6,303,092 23.8 94.4
2021 $27,514,789 $2,472,570 $535,611 $2,022,205 $2,557,816 9.3 98.6
2022 $28,615,380 $2,594,270 $533,040 $0 $533,040 1.9 100.0
2023 $29,759,996 $2,721,749 $529,407 $0 $529,407 1.8 100.0
2024 $30,950,395 $2,855,277 $524,630 $0 $524,630 1.7 100.0
2025 $32,188,411 $2,995,131 $518,624 $0 $518,624 1.6 100.0
2026 $33,475,948 $3,141,606 $511,298 $0 $511,298 1.5 100.0
2027 $34,814,985 $3,295,006 $502,556 $0 $502,556 1.4 100.0
2028 $36,207,585 $3,455,651 $492,296 $0 $492,296 1.4 100.0
2029 $37,655,888 $3,623,877 $480,412 $0 $480,412 1.3 100.0
2030 $39,162,124 $3,800,031 $466,789 $0 $466,789 1.2 100.0
2031 $40,728,609 $3,984,479 $451,308 $0 $451,308 1.1 100.0
2032 $42,357,753 $4,177,604 $433,842 $0 $433,842 1.0 100.0
2033 $44,052,063 $4,379,803 $414,256 $0 $414,256 0.9 100.0
2034 $45,814,146 $4,591,493 $392,409 $0 $392,409 0.9 100.0
2035 $47,646,712 $4,813,112 $368,152 $0 $368,152 0.8 100.0
2036 $49,552,580 $5,045,113 $341,326 $0 $341,326 0.7 100.0
2037 $51,534,683 $5,287,974 $311,765 $0 $311,765 0.6 100.0
2038 $53,596,071 $5,542,191 $279,293 $0 $279,293 0.5 100.0
2039 $55,739,913 $5,808,285 $243,724 $0 $243,724 0.4 100.0
2040 $57,969,510 $6,086,799 $204,864 $0 $204,864 0.4 100.0
2041 $60,288,290 $6,330,270 $213,058 $0 $213,058 0.4 100.0
2042 $62,699,822 $6,583,481 $221,580 $0 $221,580 0.4 100.0
2043 $65,207,815 $6,846,821 $230,444 $0 $230,444 0.4 100.0
2044 $67,816,127 $7,120,693 $239,661 $0 $239,661 0.4 100.0
2045 $70,528,773 $7,405,521 $249,248 $0 $249,248 0.4 100.0
2046 $73,349,923 $7,701,742 $259,218 $0 $259,218 0.4 100.0
2047 $76,283,920 $8,009,812 $269,587 $0 $269,587 0.4 100.0
2048 $79,335,277 $8,330,204 $280,370 $0 $280,370 0.4 100.0
2049 $82,508,688 $8,663,412 $291,585 $0 $291,585 0.4 100.0
* Calendar basis ** Beginning of Fiscal Year

Shrewsbury Retirement System Page 13H:\Shrewsbury\Val17\[Shrew17_Val Experience 7_5% v3.xlsm]PERAC Ann'l Stmt
PERAC Annual StatementAPPENDIX PAGE 3
ACTUARIAL VALUATION AND ASSUMPTIONS
The most recent actuarial valuation of the System was prepared by Sherman Actuarial Services as of January 1, 2017.
The normal cost for employees on that date was: $2,139,645 8.7% of pay
The normal cost for the employer was: 410,839 1.7% of pay
The actuarial liability for active members was: $56,998,111
The actuarial liability for retired and inactive members was: 68,652,368
Total actuarial accrued liability: 125,650,479
System assets as of that date: 108,770,956
Unfunded actuarial accrued liability: $16,879,523
The ratio of system's assets to total actuarial liability was 86.6%
The principal actuarial assumptions used in the valuation are as follows:
Investment Return: 7.50%
Rate of Salary Increase: 3.50%
SCHEDULE OF FUNDING PROGRESS
Actuarial Actuarial Actuarial Unfunded Funded Covered UAALValuation Value Accrued Actuarial Ratio Payroll as a percent
Date of Assets Liability Accrued of CoveredLiability Payroll
(a) (b) (b-a) (a/b) (c) (b-a)/c
01/01/17 $108,770,956 $125,650,479 $16,879,523 86.6% $24,460,547 69.0%
01/01/16 98,162,532 119,047,013 20,884,481 82.5% 23,692,881 88.1%
01/01/14 82,514,065 114,519,810 32,005,745 72.1% 23,896,051 133.9%
01/01/12 71,863,914 105,086,411 33,222,497 68.4% 22,671,647 146.5%
01/01/10 64,467,201 91,059,541 26,592,340 70.8% 22,460,537 118.4%
01/01/08 65,665,411 85,256,692 19,591,281 77.0% 22,402,987 87.4%
01/01/06 54,147,807 75,979,303 21,831,496 71.3% 19,896,839 109.7%
01/01/04 50,857,118 65,276,552 14,419,434 77.9% 17,995,844 80.1%
01/01/02 46,779,157 59,312,723 12,533,566 78.9% 16,773,825 74.7%
Attach Copy of Current Approved Funding Schedule
Shrewsbury Retirement System Page 14 Shrewsbury 17
EXHIBITS
Shrewsbury Retirement System Page 15
H:\Shrewsbury\Val17\Report\[ACT1.xls]Actives
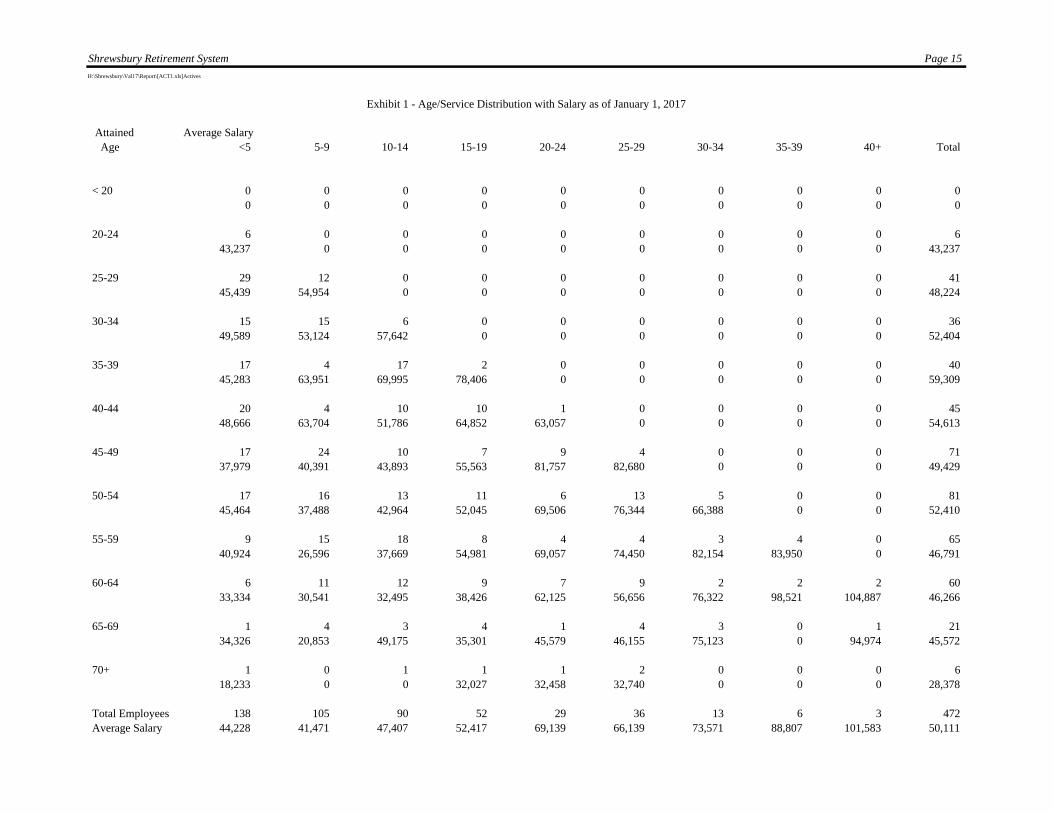
Exhibit 1 - Age/Service Distribution with Salary as of January 1, 2017
Attained Average Salary Age <5 5-9 10-14 15-19 20-24 25-29 30-34 35-39 40+ Total
< 20 0 0 0 0 0 0 0 0 0 00 0 0 0 0 0 0 0 0 0
20-24 6 0 0 0 0 0 0 0 0 643,237 0 0 0 0 0 0 0 0 43,237
25-29 29 12 0 0 0 0 0 0 0 4145,439 54,954 0 0 0 0 0 0 0 48,224
30-34 15 15 6 0 0 0 0 0 0 3649,589 53,124 57,642 0 0 0 0 0 0 52,404
35-39 17 4 17 2 0 0 0 0 0 4045,283 63,951 69,995 78,406 0 0 0 0 0 59,309
40-44 20 4 10 10 1 0 0 0 0 4548,666 63,704 51,786 64,852 63,057 0 0 0 0 54,613
45-49 17 24 10 7 9 4 0 0 0 7137,979 40,391 43,893 55,563 81,757 82,680 0 0 0 49,429
50-54 17 16 13 11 6 13 5 0 0 8145,464 37,488 42,964 52,045 69,506 76,344 66,388 0 0 52,410
55-59 9 15 18 8 4 4 3 4 0 6540,924 26,596 37,669 54,981 69,057 74,450 82,154 83,950 0 46,791
60-64 6 11 12 9 7 9 2 2 2 6033,334 30,541 32,495 38,426 62,125 56,656 76,322 98,521 104,887 46,266
65-69 1 4 3 4 1 4 3 0 1 2134,326 20,853 49,175 35,301 45,579 46,155 75,123 0 94,974 45,572
70+ 1 0 1 1 1 2 0 0 0 618,233 0 0 32,027 32,458 32,740 0 0 0 28,378
Total Employees 138 105 90 52 29 36 13 6 3 472 Average Salary 44,228 41,471 47,407 52,417 69,139 66,139 73,571 88,807 101,583 50,111
Shrewsbury Retirement System Page 16H:\Shrewsbury\Val17\Report\[RET1.xls]Retirees
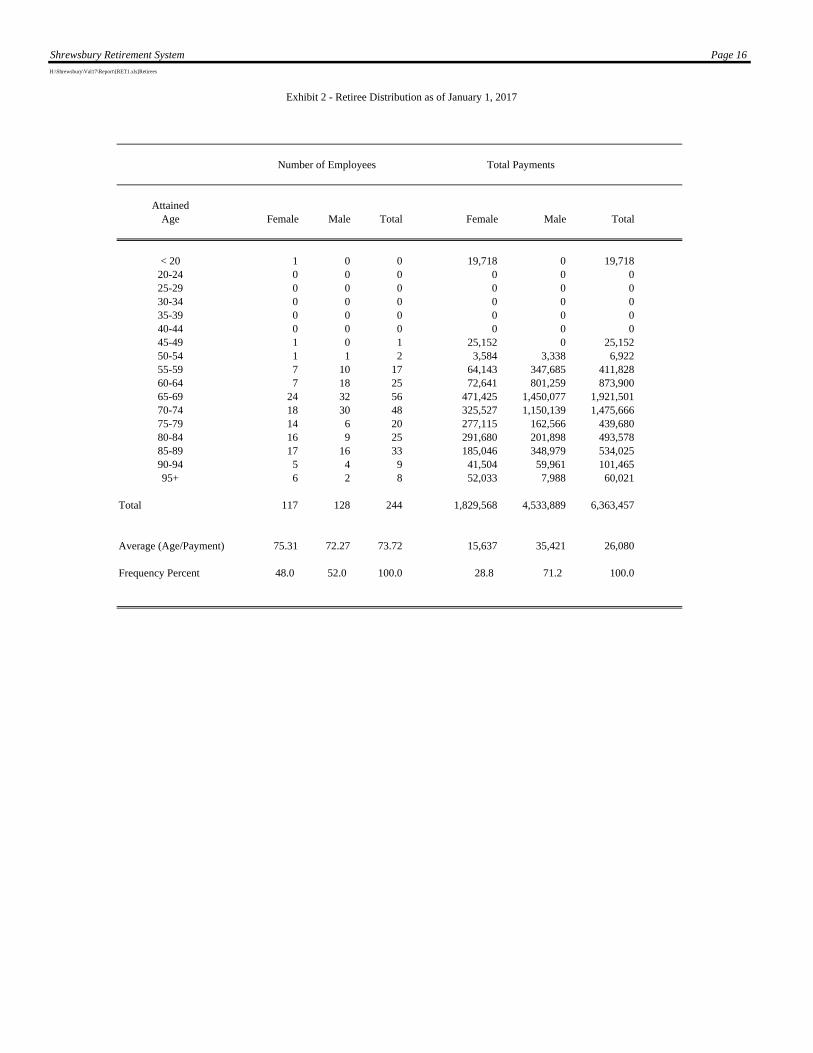
Exhibit 2 - Retiree Distribution as of January 1, 2017
AttainedAge Female Male Total Female Male Total
< 20 1 0 0 19,718 0 19,71820-24 0 0 0 0 0 025-29 0 0 0 0 0 030-34 0 0 0 0 0 035-39 0 0 0 0 0 040-44 0 0 0 0 0 045-49 1 0 1 25,152 0 25,15250-54 1 1 2 3,584 3,338 6,92255-59 7 10 17 64,143 347,685 411,82860-64 7 18 25 72,641 801,259 873,90065-69 24 32 56 471,425 1,450,077 1,921,50170-74 18 30 48 325,527 1,150,139 1,475,66675-79 14 6 20 277,115 162,566 439,68080-84 16 9 25 291,680 201,898 493,57885-89 17 16 33 185,046 348,979 534,02590-94 5 4 9 41,504 59,961 101,46595+ 6 2 8 52,033 7,988 60,021
Total 117 128 244 1,829,568 4,533,889 6,363,457
Average (Age/Payment) 75.31 72.27 73.72 15,637 35,421 26,080
Frequency Percent 48.0 52.0 100.0 28.8 71.2 100.0
Number of Employees Total Payments

Shrewsbury Retirement System Page 17H:\Shrewsbury\Val17\Report\[DIS1.xls]Disabled
Exhibit 3 - Disabled Retiree Distribution as of January 1, 2017
AttainedAge Female Male Total Female Male Total
< 20 0 0 0 0 0 020-24 0 0 0 0 0 025-29 0 0 0 0 0 030-34 0 0 0 0 0 035-39 0 1 1 0 55,651 55,65140-44 1 0 1 23,059 0 23,05945-49 0 1 1 0 40,027 40,02750-54 0 2 2 0 74,502 74,50255-59 2 1 3 22,876 31,806 54,68260-64 0 7 7 0 261,245 261,24565-69 0 4 4 0 136,164 136,16470-74 0 3 3 0 79,493 79,49375-79 0 3 3 0 99,218 99,21880-84 0 3 3 0 78,059 78,05985-89 0 0 0 0 0 090-94 0 1 1 0 24,829 24,82995-99 0 0 0 0 0 0
Total 3 26 29 45,935 880,995 926,930
Average (Age/Payment) 53.1 67.2 65.8 15,312 33,884 31,963
Frequency Percent 10.3 89.7 100.0 5.0 95.0 100.0
Number of Employees Total Payments
Shrewsbury Retirement System Page 18H:\Shrewsbury\Val17\[Shrew17_Val Experience 7_5% v3.xlsm]PERAC Ann'l Stmt
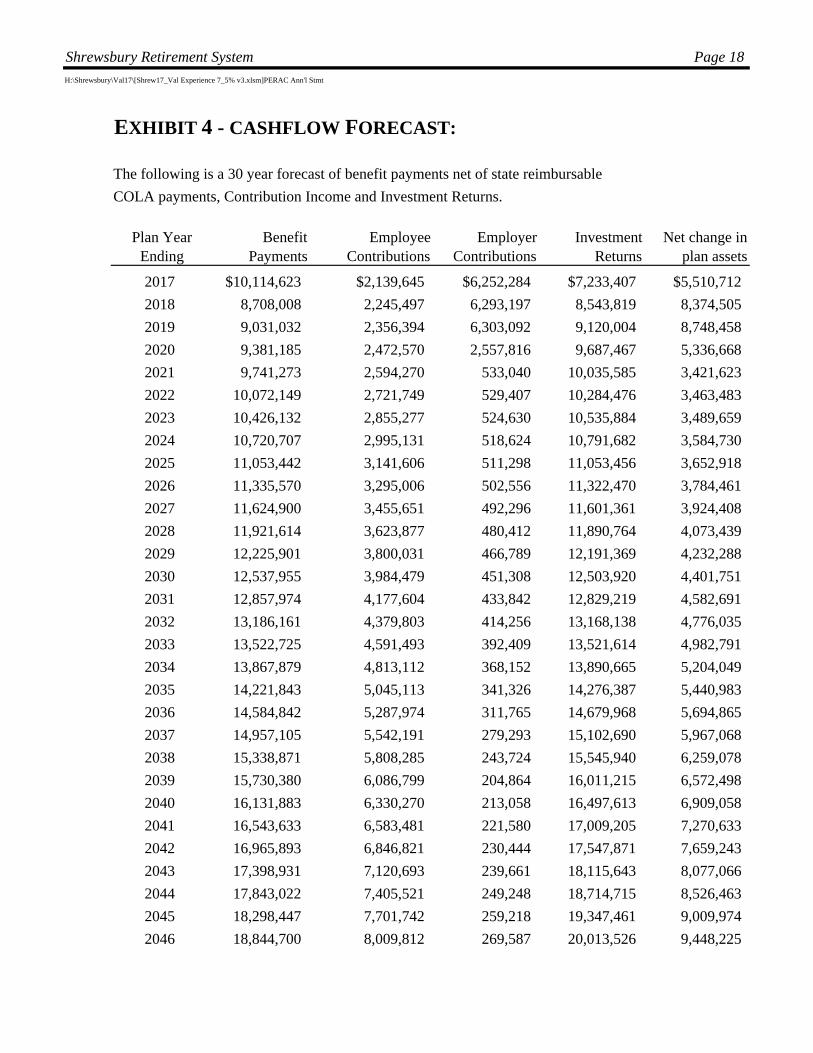
EXHIBIT 4 - CASHFLOW FORECAST:
The following is a 30 year forecast of benefit payments net of state reimbursable
COLA payments, Contribution Income and Investment Returns.
Plan Year Ending
Benefit Payments
Employee Contributions
Employer Contributions
Investment Returns
Net change in plan assets
2017 $10,114,623 $2,139,645 $6,252,284 $7,233,407 $5,510,712
2018 8,708,008 2,245,497 6,293,197 8,543,819 8,374,505
2019 9,031,032 2,356,394 6,303,092 9,120,004 8,748,458
2020 9,381,185 2,472,570 2,557,816 9,687,467 5,336,668
2021 9,741,273 2,594,270 533,040 10,035,585 3,421,623
2022 10,072,149 2,721,749 529,407 10,284,476 3,463,483
2023 10,426,132 2,855,277 524,630 10,535,884 3,489,659
2024 10,720,707 2,995,131 518,624 10,791,682 3,584,730
2025 11,053,442 3,141,606 511,298 11,053,456 3,652,918
2026 11,335,570 3,295,006 502,556 11,322,470 3,784,461
2027 11,624,900 3,455,651 492,296 11,601,361 3,924,408
2028 11,921,614 3,623,877 480,412 11,890,764 4,073,439
2029 12,225,901 3,800,031 466,789 12,191,369 4,232,288
2030 12,537,955 3,984,479 451,308 12,503,920 4,401,751
2031 12,857,974 4,177,604 433,842 12,829,219 4,582,691
2032 13,186,161 4,379,803 414,256 13,168,138 4,776,035
2033 13,522,725 4,591,493 392,409 13,521,614 4,982,791
2034 13,867,879 4,813,112 368,152 13,890,665 5,204,049
2035 14,221,843 5,045,113 341,326 14,276,387 5,440,983
2036 14,584,842 5,287,974 311,765 14,679,968 5,694,865
2037 14,957,105 5,542,191 279,293 15,102,690 5,967,068
2038 15,338,871 5,808,285 243,724 15,545,940 6,259,078
2039 15,730,380 6,086,799 204,864 16,011,215 6,572,498
2040 16,131,883 6,330,270 213,058 16,497,613 6,909,058
2041 16,543,633 6,583,481 221,580 17,009,205 7,270,633
2042 16,965,893 6,846,821 230,444 17,547,871 7,659,243
2043 17,398,931 7,120,693 239,661 18,115,643 8,077,066
2044 17,843,022 7,405,521 249,248 18,714,715 8,526,463
2045 18,298,447 7,701,742 259,218 19,347,461 9,009,974
2046 18,844,700 8,009,812 269,587 20,013,526 9,448,225
Shrewsbury Retirement System Page 19 Shrewsbury 17
EXHIBIT 5 – SUMMARY OF PLAN PROVISIONS:
This summary is prepared in accordance with Chapter 32 as of January 1, 2017, and does not take
into account any subsequent changes.
1. Administration
Each of the 104 contributory retirement systems for public employees of the Commonwealth
of Massachusetts are guided by the applicable provisions of Chapter 32 of the Massachusetts
General Laws and other applicable statutes. Although these boards operate semi-
independently, there is a uniform set of rules governing benefits, eligibility, contributions,
financing, and accounting.
2. Participation
Participation is mandatory for all full-time employees whose employment commences prior to age 65. Eligibility with respect to part-time, professional, temporary, or intermittent employment is governed by the local board. Membership is optional for certain elected officials, State officials appointed by the Governor, and certain hospital interns. There are four classes of membership as follows:
(i) Group 1: Most general employees in State and local government
(ii) Group 2: Certain specified hazardous duty positions
(iii) Group 3: State police officers and inspectors
(iv) Group 4: Local police officers, firefighters, and designated employees of the municipal light department.
For members in more than one group, participation will be proportional.
Chapter 176 of the Acts of 2011 created different plan provisions within these groups for those hired on or after April 2, 2012.

Shrewsbury Retirement System Page 20 Shrewsbury 17
3. Salary
Salary is defined as gross regular compensation. Salary does not include bonuses, overtime,
severance pay, unused sick leave credit, or other similar compensation.
4. Member Contributions
Member contributions vary depending upon date hired as follows: Date of Hire
Member Contribution Rate
Prior to 1975 5.0% of Salary
1975 to 1983 7.0% of Salary
1984 to 1996 8.0% of Salary
1996 and Later plus 9.0% of Salary
1979 and Later 2.0% of Salary in excess of $30,000
For Group 1 employees who become members on or after April 2, 2012, the Contribution
Rate shall be 6% after the completion of 30 years of service.
5. Average Salary
Average salary is used to determine a participant's benefit. It is defined as the average salary
during the three consecutive-year period that produces the highest average. (Alternatively, if
a greater amount results, it is the average rate of salary earned during the period or periods,
whether or not consecutive, that constitutes the last three years preceding retirement.). For
employees who become members on or after April 2, 2012, the averaging period shall be five
years.
6. Creditable Service
In general, creditable service is awarded during the period in which a member contributes to
the retirement system.
Shrewsbury Retirement System Page 21 Shrewsbury 17
7. Service Retirement
a. Eligibility:
For an employee to be eligible for service retirement (also referred to as
superannuation), one of the following conditions must be met:
(i) completion of 20 years of service, if hired before April 2, 2012
(ii) for an employee hired prior to January 1, 1978, attainment of age 55 as an
active member
(iii) for an employee hired on or after January 1, 1978, attainment of age 55 as
an active member and completion of ten years of service
(iv) for a Group 1 employee hired on or after April 2, 2012, attainment of age
60 and completion of ten years of service
Shrewsbury Retirement System Page 22 Shrewsbury 17
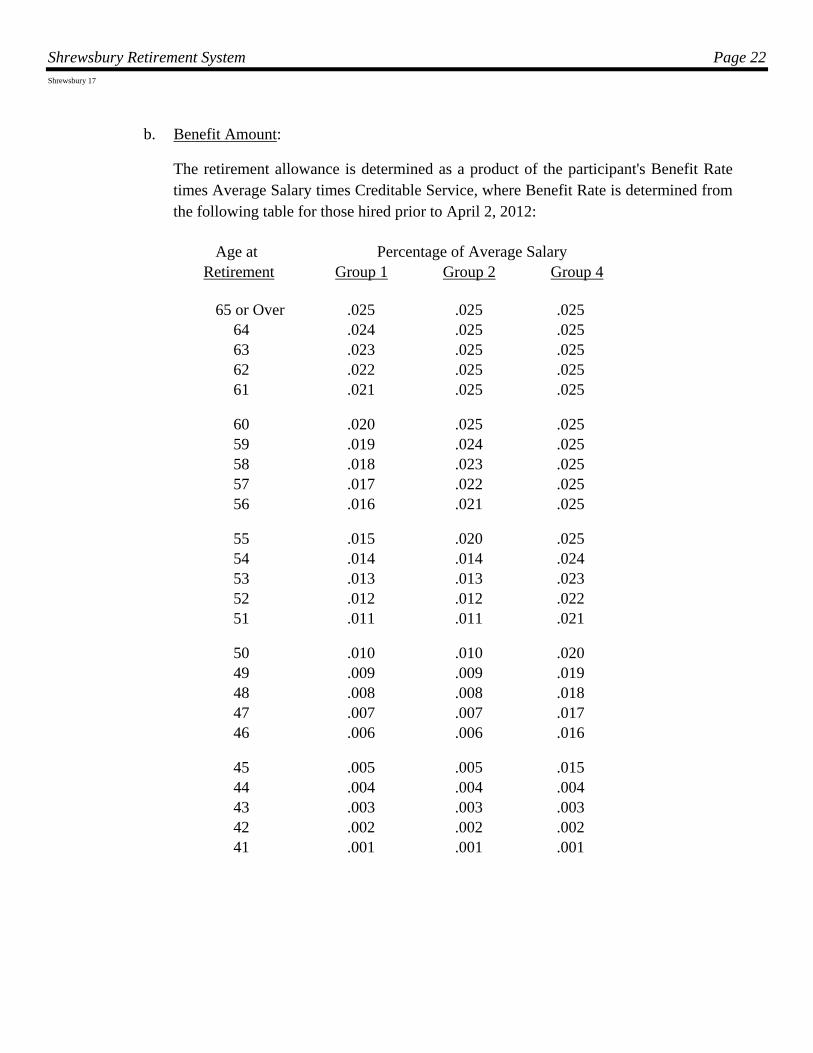
b. Benefit Amount:
The retirement allowance is determined as a product of the participant's Benefit Rate times Average Salary times Creditable Service, where Benefit Rate is determined from the following table for those hired prior to April 2, 2012: Age at Percentage of Average Salary Retirement Group 1 Group 2 Group 4
65 or Over .025 .025 .025 64 .024 .025 .025 63 .023 .025 .025 62 .022 .025 .025 61 .021 .025 .025 60 .020 .025 .025 59 .019 .024 .025 58 .018 .023 .025 57 .017 .022 .025 56 .016 .021 .025 55 .015 .020 .025 54 .014 .014 .024 53 .013 .013 .023 52 .012 .012 .022 51 .011 .011 .021 50 .010 .010 .020 49 .009 .009 .019 48 .008 .008 .018 47 .007 .007 .017 46 .006 .006 .016 45 .005 .005 .015 44 .004 .004 .004 43 .003 .003 .003 42 .002 .002 .002 41 .001 .001 .001
Shrewsbury Retirement System Page 23 Shrewsbury 17
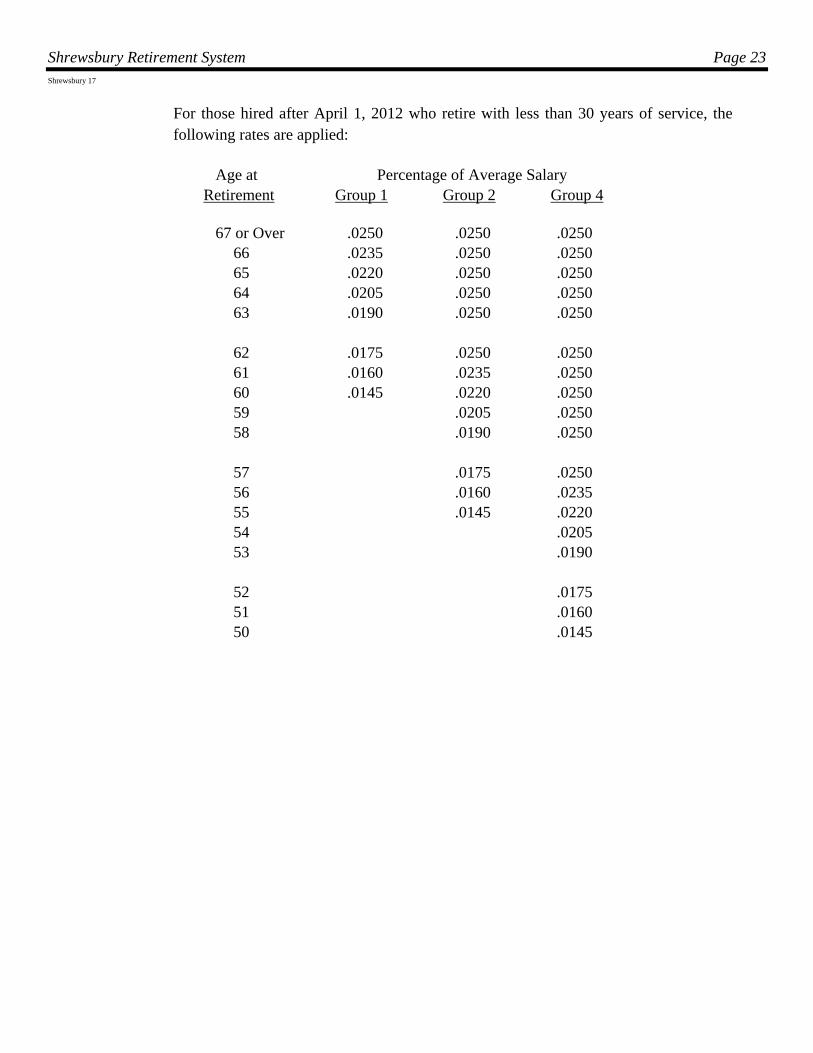
For those hired after April 1, 2012 who retire with less than 30 years of service, the following rates are applied: Age at Percentage of Average Salary Retirement Group 1 Group 2 Group 4
67 or Over .0250 .0250 .0250 66 .0235 .0250 .0250 65 .0220 .0250 .0250 64 .0205 .0250 .0250 63 .0190 .0250 .0250 62 .0175 .0250 .0250 61 .0160 .0235 .0250 60 .0145 .0220 .0250 59 .0205 .0250 58 .0190 .0250 57 .0175 .0250 56 .0160 .0235 55 .0145 .0220 54 .0205 53 .0190 52 .0175 51 .0160 50 .0145
Shrewsbury Retirement System Page 24 Shrewsbury 17
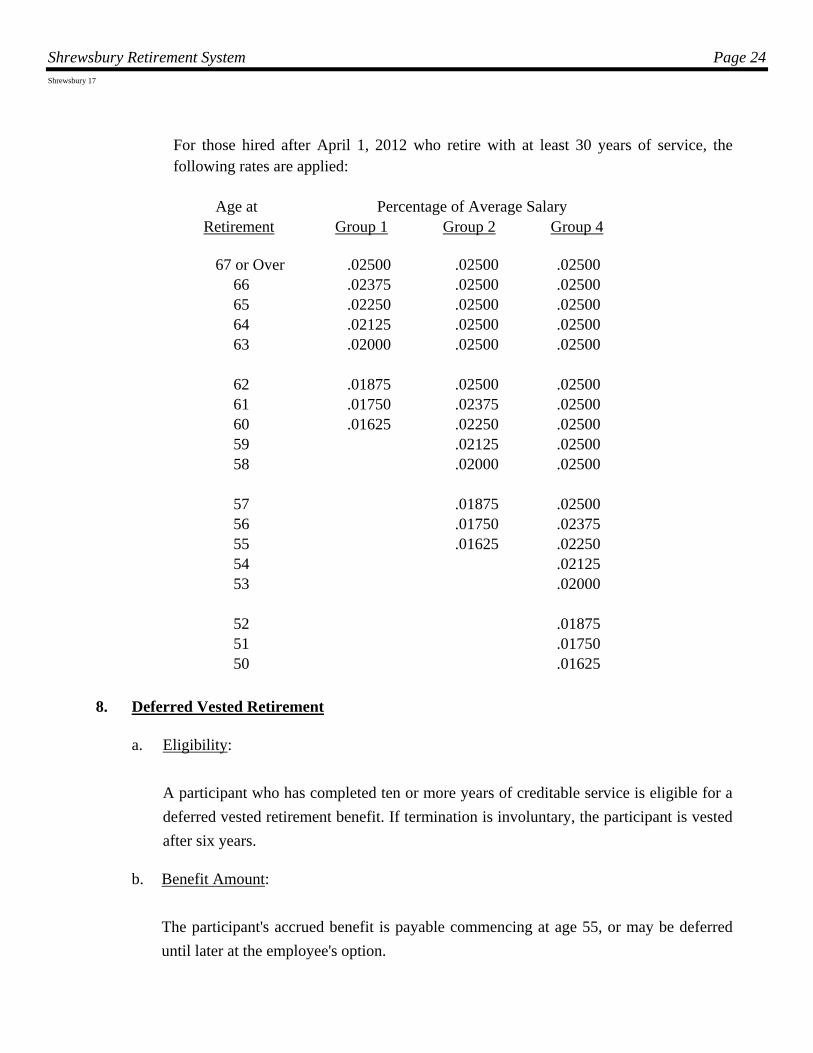
For those hired after April 1, 2012 who retire with at least 30 years of service, the following rates are applied: Age at Percentage of Average Salary Retirement Group 1 Group 2 Group 4
67 or Over .02500 .02500 .02500 66 .02375 .02500 .02500 65 .02250 .02500 .02500 64 .02125 .02500 .02500 63 .02000 .02500 .02500 62 .01875 .02500 .02500 61 .01750 .02375 .02500 60 .01625 .02250 .02500 59 .02125 .02500 58 .02000 .02500 57 .01875 .02500 56 .01750 .02375 55 .01625 .02250 54 .02125 53 .02000 52 .01875 51 .01750 50 .01625
8. Deferred Vested Retirement
a. Eligibility:
A participant who has completed ten or more years of creditable service is eligible for a
deferred vested retirement benefit. If termination is involuntary, the participant is vested
after six years.
b. Benefit Amount:
The participant's accrued benefit is payable commencing at age 55, or may be deferred
until later at the employee's option.
Shrewsbury Retirement System Page 25 Shrewsbury 17
c. Refund of Contributions:
In lieu of the deferred pension benefit, a member may elect to receive a refund of their
accumulated contributions with interest.
9. Accidental Disability
a. Eligibility:
Participants are eligible for an accidental disability benefit, regardless of service or age,
if they become permanently and totally incapacitated for further duty as a result of
personal injury sustained while in the performance of duties.
b. Benefit Amount:
The accidental disability amount is 72% of annual salary plus $450 per year for each
child plus an additional annuity based upon accumulated Member Contributions with
credited interest.
10. Ordinary Disability
a. Eligibility:
An ordinary disability occurs when a member becomes permanently and totally
disabled due to sickness or injury that is not job related. In order to be eligible for an
ordinary disability benefit, a member must have ten years of service (and be less than
age 55 or age 60 if hired on or after April 2, 2012).
b. Benefit Amount:
The ordinary disability amount is equal to the accrued retirement benefit as if the
member were age 55 (age 60 if hired on or after April 2, 2012). If the member was a
veteran, the benefit is 50% of the member's final rate of Salary during the preceding 12
months, plus an annuity based upon accumulated Member Contributions plus credited
interest. If the participant is over age 55 (age 60 if hired on or after April 2, 2012), he
will receive not less than the superannuation allowance to which he is entitled.
Shrewsbury Retirement System Page 26 Shrewsbury 17
11. Survivor Benefits
a. Occupational Death:
The survivors of a member who dies due to an occupational injury will be entitled to a
lump sum return of contributions plus a pension benefit equal to 72% of the
participant's annual Salary.
b. Non-Occupational Death:
Upon the death of a member other than due to an occupational injury, the designated
beneficiary will be entitled to a retirement benefit as if Option C had been elected with
a minimum of $250 per month to the surviving spouse, plus $120 for the first child,
plus $90 for each additional child. If no beneficiary is designated and if the employee
worked two years, and is married at least one year, the spouse may elect benefits. If
there is no designated beneficiary or surviving spouse, then member contributions are
returned. If there are dependent children but no surviving spouse, they may elect
minimum survivor benefits of $250 per month plus $120 for the first child and $90 for
each additional child.
c. Refund of Contributions:
Upon the death of a member not entitled to survivor benefits, the beneficiary is entitled
to a refund of all member contributions with interest.
12. Cost-of-Living Increases
In accordance with the adoption of Chapter 17 of the Acts of 1997, the granting of a cost-
of-living adjustment will be determined by an annual vote by the Retirement Board. The
amount of increase will be based upon the Consumer Price Index, limited to a maximum of
3.0%, beginning on July 1. All retirees, disabled retirees, and beneficiaries who have been
receiving benefits payments for at least one year as of July 1 are eligible for the adjustment.
The maximum amount of pension benefit subject to a COLA is $12,000. All COLAs
granted to members after 1981 and prior to July 1, 1998 are deemed to be an obligation of
the State and are not the liability of the Retirement System.
Shrewsbury Retirement System Page 27 Shrewsbury 17
13. Postretirement Death Benefits
Any benefits following the death of a member after retirement are based upon the form of
benefit the participant elected at the time of retirement. There are three available forms as
follows:
(i) Option A – Life annuity
(ii) Option B – Life annuity with death benefit equal to excess of member
contributions plus credited interest to retirement over annuity benefit paid
to member
(iii) Option C – Life annuity with 66-2/3% of benefit continued after death of
member to designated joint annuitant
Shrewsbury Retirement System Page 28 Shrewsbury 17
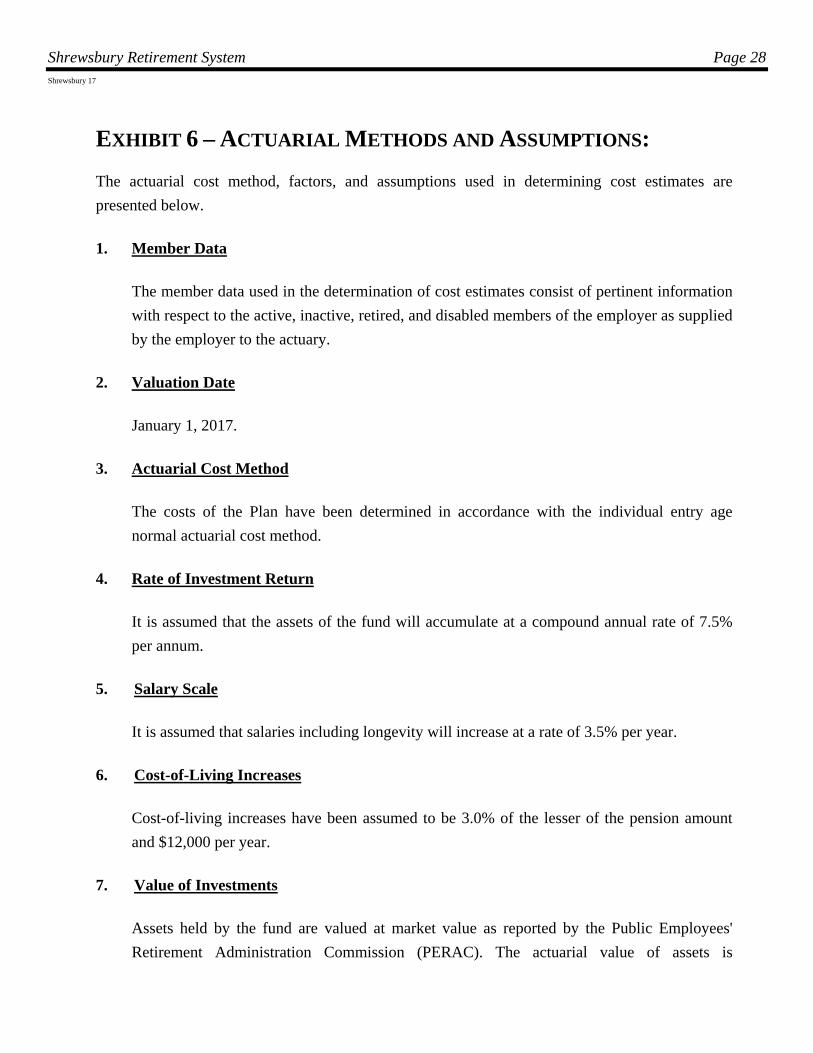
EXHIBIT 6 – ACTUARIAL METHODS AND ASSUMPTIONS:
The actuarial cost method, factors, and assumptions used in determining cost estimates are
presented below.
1. Member Data
The member data used in the determination of cost estimates consist of pertinent information
with respect to the active, inactive, retired, and disabled members of the employer as supplied
by the employer to the actuary.
2. Valuation Date
January 1, 2017.
3. Actuarial Cost Method
The costs of the Plan have been determined in accordance with the individual entry age
normal actuarial cost method.
4. Rate of Investment Return
It is assumed that the assets of the fund will accumulate at a compound annual rate of 7.5%
per annum.
5. Salary Scale
It is assumed that salaries including longevity will increase at a rate of 3.5% per year.
6. Cost-of-Living Increases
Cost-of-living increases have been assumed to be 3.0% of the lesser of the pension amount
and $12,000 per year.
7. Value of Investments
Assets held by the fund are valued at market value as reported by the Public Employees'
Retirement Administration Commission (PERAC). The actuarial value of assets is
Shrewsbury Retirement System Page 29 Shrewsbury 17
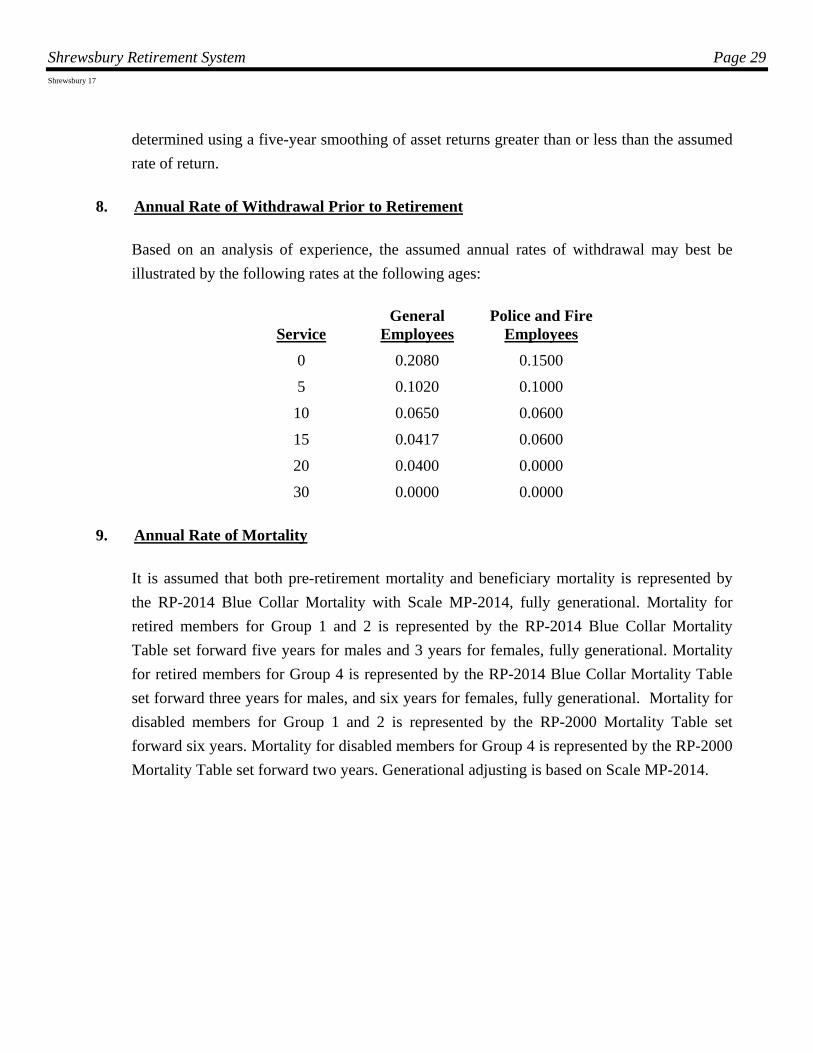
determined using a five-year smoothing of asset returns greater than or less than the assumed
rate of return.
8. Annual Rate of Withdrawal Prior to Retirement
Based on an analysis of experience, the assumed annual rates of withdrawal may best be
illustrated by the following rates at the following ages:
Service General
Employees Police and Fire
Employees
0
5
10
15
20
30
0.2080
0.1020
0.0650
0.0417
0.0400
0.0000
0.1500
0.1000
0.0600
0.0600
0.0000
0.0000
9. Annual Rate of Mortality
It is assumed that both pre-retirement mortality and beneficiary mortality is represented by
the RP-2014 Blue Collar Mortality with Scale MP-2014, fully generational. Mortality for
retired members for Group 1 and 2 is represented by the RP-2014 Blue Collar Mortality
Table set forward five years for males and 3 years for females, fully generational. Mortality
for retired members for Group 4 is represented by the RP-2014 Blue Collar Mortality Table
set forward three years for males, and six years for females, fully generational. Mortality for
disabled members for Group 1 and 2 is represented by the RP-2000 Mortality Table set
forward six years. Mortality for disabled members for Group 4 is represented by the RP-2000
Mortality Table set forward two years. Generational adjusting is based on Scale MP-2014.
Shrewsbury Retirement System Page 30 Shrewsbury 17
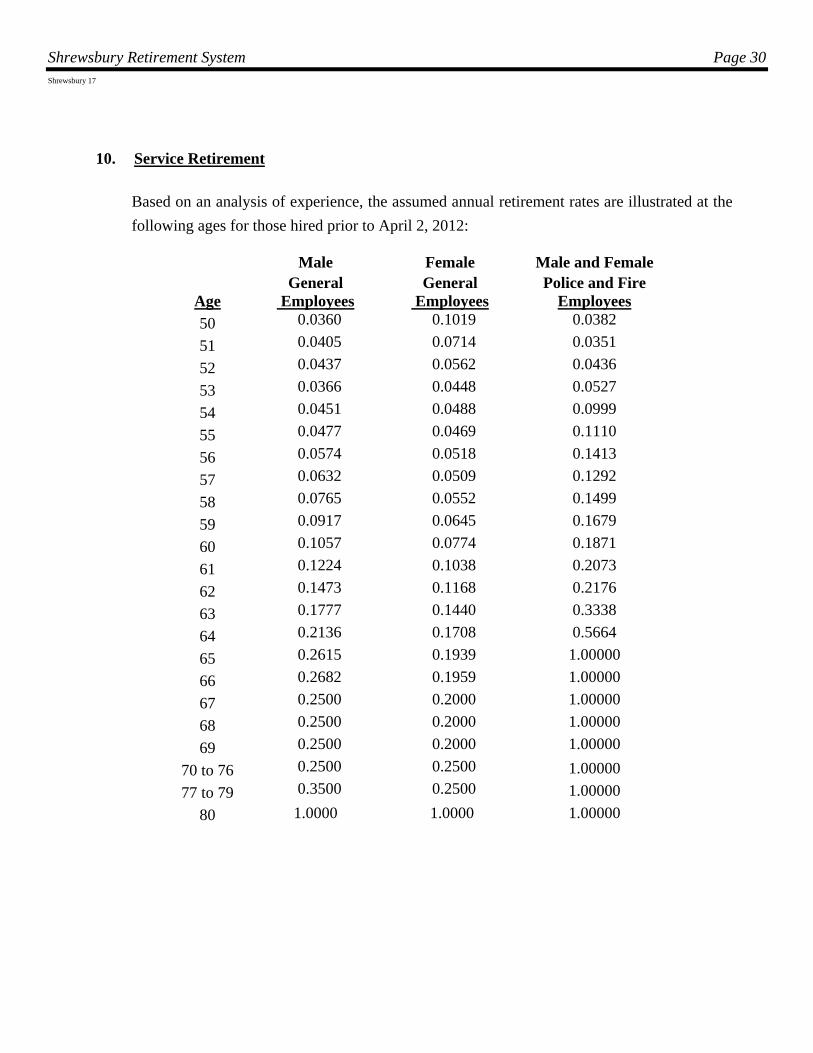
10. Service Retirement
Based on an analysis of experience, the assumed annual retirement rates are illustrated at the
following ages for those hired prior to April 2, 2012:
Male
Female
Male and Female
Age
General Employees
General Employees
Police and Fire Employees
50 0.0360 0.1019 0.0382
51 0.0405 0.0714 0.0351
52 0.0437 0.0562 0.0436
53 0.0366 0.0448 0.0527
54 0.0451 0.0488 0.0999
55 0.0477 0.0469 0.1110
56 0.0574 0.0518 0.1413
57 0.0632 0.0509 0.1292
58 0.0765 0.0552 0.1499
59 0.0917 0.0645 0.1679
60 0.1057 0.0774 0.1871
61 0.1224 0.1038 0.2073
62 0.1473 0.1168 0.2176
63 0.1777 0.1440 0.3338
64 0.2136 0.1708 0.5664
65 0.2615 0.1939 1.00000
66 0.2682 0.1959 1.00000
67 0.2500 0.2000 1.00000
68 0.2500 0.2000 1.00000
69 0.2500 0.2000 1.00000
70 to 76 0.2500 0.2500 1.00000
77 to 79 0.3500 0.2500 1.00000
80 1.0000 1.0000 1.00000

Shrewsbury Retirement System Page 31 Shrewsbury 17
Based on an analysis of experience, the assumed annual retirement rates are illustrated at the
following ages for those hired on or after April 2, 2012:
Male
Female
Male and Female
Age
General Employees
General Employees
Police and Fire Employees
50 0.0000 0.0000 0.0191
51 0.0000 0.0000 0.0176
52 0.0000 0.0000 0.0436
53 0.0000 0.0000 0.0211
54 0.0000 0.0000 0.0266
55 0.0000 0.0000 0.0370
56 0.0000 0.0000 0.1060
57 0.0000 0.0000 0.1938
58 0.0000 0.0000 0.1499
59 0.0000 0.0000 0.1119
60 0.0477 0.0469 0.0936
61 0.0574 0.0518 0.1555
62 0.0632 0.0509 0.1741
63 0.0765 0.0552 0.2670
64 0.0917 0.0645 0.4720
65 0.1057 0.0774 0.2500
66 0.1224 0.1038 0.3000
67 0.1473 0.1168 1.0000
68 0.1777 0.1440 1.0000
69 0.2136 0.1708 1.0000
70 0.2615 0.1939 1.0000
70 to 76 0.2682 0.1959 1.0000
77 to 79 0.2500 0.2000 1.0000
80 0.2500 0.2000 1.0000

Shrewsbury Retirement System Page 32 Shrewsbury 17
12. Annual Rate of Disability Prior to Retirement
Based on an analysis of experience, the assumed annual rates of disability may best be
illustrated by the following probabilities at the following ages:
Attained Age
General Employees
Police and Fire Employees
20 0.000100 0.000500
30 0.000152 0.000967
40 0.000663 0.002500
50 0.001271 0.007634
In addition, it is assumed for the general employees that 30% of all disabilities are ordinary
(70% are service connected). For police and fire employees, 5% of all disabilities are
assumed to be ordinary (95% are service connected).
13. Family Composition
It is assumed that 80% of all members will be survived by a spouse and that females (males)
are three years younger (older) than members.
14. Administrative Expenses
The normal cost is increased by an amount equal to the anticipated administrative expenses
for the upcoming fiscal year. The amount for fiscal year 2017 is $100,000 and is anticipated
to increase at 4.0% per year.
Shrewsbury Retirement System Page 33 Shrewsbury 17
EXHIBIT 7 – GLOSSARY OF TERMS:
This glossary summarizes the technical terms contained in this report.
1. Actuarial Accrued Liability
That portion of the Actuarial Present Value of plan benefits that is not provided for by future
employer Normal Costs or employee contributions.
2. Actuarial Assumptions
Assumptions as to the occurrence of future events affecting the Retirement System such as:
Rates of investment returns
Increases in a member's salary
Inflation
The probability of mortality, turnover, disablement
Retirement at each age and other relevant items
3. Actuarial Cost Method
A procedure for allocating the Actuarial Present Value of pension plan benefits between
Normal Cost and Actuarial Accrued Liability.
4. Actuarial Present Value
The single sum amount required at the valuation date that is required to provide for
anticipated future events based upon the terms of the plan and the Actuarial Assumptions.
5. Forecast
A projection of future benefit payments or contribution requirements based upon the terms of
the plan, the current asset amounts, the Actuarial Assumptions, and additional assumptions as
to the replacement of terminating employees with new employees.

Shrewsbury Retirement System Page 34 Shrewsbury 17
6. Normal Cost
That portion of the Actuarial Present Value of future benefits that is assigned to the current
year.
7. Unfunded Actuarial Accrued Liability
That portion of the Actuarial Accrued Liability that is not provided for by current actuarial
value of assets.
8. Valuation Method
The method used to divide the cost of future benefits among the Actuarial Accrued Liability,
the current year's Normal Costs, and future years' Normal Costs. The resulting current
funding requirement is then determined as the current year's Normal Cost plus the payment
necessary to amortize the Unfunded Actuarial Liability.
9. Vested Liability
That portion of the Actuarial Present Value of Accrued Benefits that a member would be
entitled to if the member terminated employment with the employer as of the valuation date.

Shrewsbury Retirement System Page 35 Shrewsbury 17
CERTIFICATION:
This report fairly represents the actuarial position of the Shrewsbury Retirement System contributing as of January 1, 2017, in accordance with generally accepted actuarial principles applied consistently with the preceding valuation. In our opinion, the actuarial assumptions used to compute actuarial accrued liability and normal cost are reasonably related to plan experience and to reasonable expectations, and represents our best estimate of anticipated plan experience.
The funded status measure is appropriate for assessing the sufficiency of plan assets to cover the estimated cost of settling the plan’s benefit obligations. The funded status measure is appropriate for assessing the need for or the amount of future contributions. The funded status measure would be different if the measure reflected the market value of assets rather than the actuarial value of assets.
Future actuarial measurements may differ significantly from the current measurements presented in this report due to such factors as the following: plan experience differing from that anticipated by the economic or demographic assumptions; changes in economic or demographic assumptions; increases or decreases expected as part of the natural operation of the methodology used for these measurements (such as the end of an amortization period or additional cost or contribution requirements based on the plan’s funded status); and changes in plan provisions or applicable law. Due to the limited scope of our assignment, we did not perform an analysis of the potential range of such future measurements.
The report was prepared under the supervision of Daniel Sherman, an Associate of the Society of Actuaries and a Member of the American Academy of Actuaries, who takes responsibility for the overall appropriateness of the analysis, assumptions and results. Daniel Sherman is deemed to meet the General Qualification Standard and the basic education and experience requirement in the pension area. Based on over thirty years of performing valuations of similar complexity, Mr. Sherman is qualified by experience. Daniel Sherman has met the Qualification Standards of the American Academy of Actuaries to render the actuarial opinion contained herein.
Sherman Actuarial Services, LLC
________________________________________
Daniel W. Sherman, ASA, MAAA
July, 2017

Shrewsbury Retirement System Page 36 Shrewsbury 17
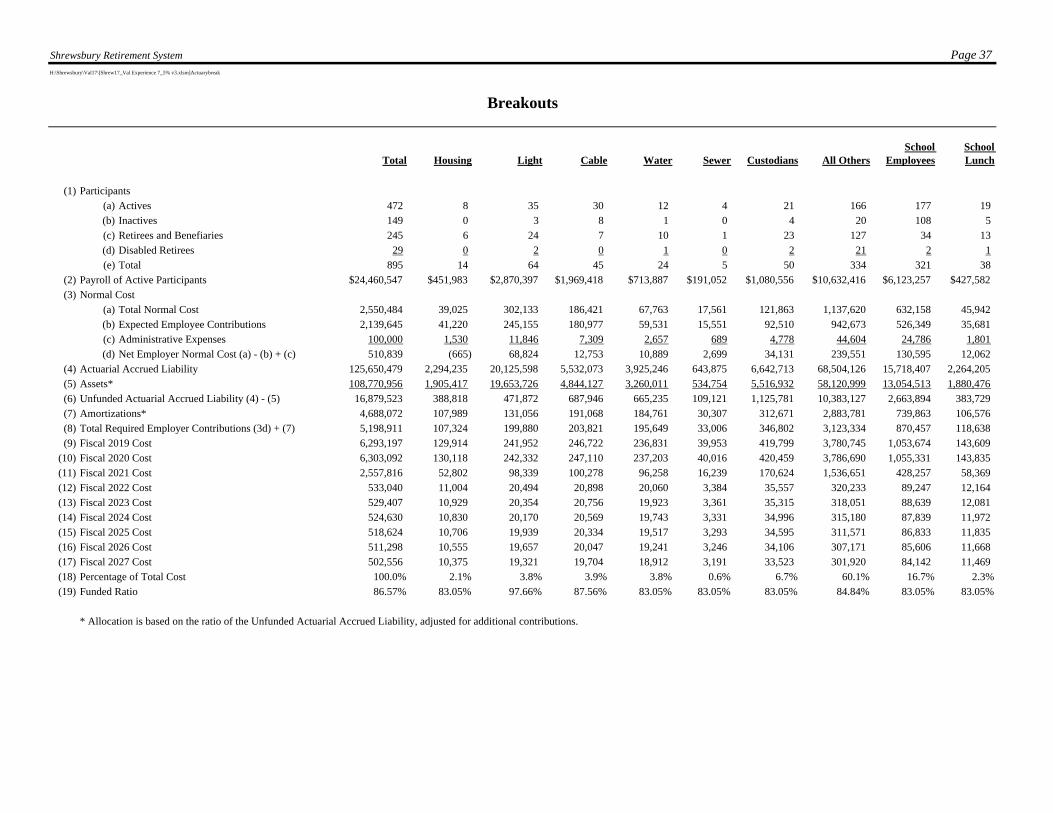
BREAKOUTS
Shrewsbury Retirement System Page 37H:\Shrewsbury\Val17\[Shrew17_Val Experience 7_5% v3.xlsm]Actuarybreak
Total Housing Light Cable Water Sewer Custodians All OthersSchool
EmployeesSchool Lunch
(1) Participants
(a) Actives 472 8 35 30 12 4 21 166 177 19
(b) Inactives 149 0 3 8 1 0 4 20 108 5
(c) Retirees and Benefiaries 245 6 24 7 10 1 23 127 34 13
(d) Disabled Retirees 29 0 2 0 1 0 2 21 2 1
(e) Total 895 14 64 45 24 5 50 334 321 38
(2) Payroll of Active Participants $24,460,547 $451,983 $2,870,397 $1,969,418 $713,887 $191,052 $1,080,556 $10,632,416 $6,123,257 $427,582
(3) Normal Cost
(a) Total Normal Cost 2,550,484 39,025 302,133 186,421 67,763 17,561 121,863 1,137,620 632,158 45,942
(b) Expected Employee Contributions 2,139,645 41,220 245,155 180,977 59,531 15,551 92,510 942,673 526,349 35,681
(c) Administrative Expenses 100,000 1,530 11,846 7,309 2,657 689 4,778 44,604 24,786 1,801
(d) Net Employer Normal Cost (a) - (b) + (c) 510,839 (665) 68,824 12,753 10,889 2,699 34,131 239,551 130,595 12,062
(4) Actuarial Accrued Liability 125,650,479 2,294,235 20,125,598 5,532,073 3,925,246 643,875 6,642,713 68,504,126 15,718,407 2,264,205
(5) Assets* 108,770,956 1,905,417 19,653,726 4,844,127 3,260,011 534,754 5,516,932 58,120,999 13,054,513 1,880,476
(6) Unfunded Actuarial Accrued Liability (4) - (5) 16,879,523 388,818 471,872 687,946 665,235 109,121 1,125,781 10,383,127 2,663,894 383,729
(7) Amortizations* 4,688,072 107,989 131,056 191,068 184,761 30,307 312,671 2,883,781 739,863 106,576
(8) Total Required Employer Contributions (3d) + (7) 5,198,911 107,324 199,880 203,821 195,649 33,006 346,802 3,123,334 870,457 118,638
(9) Fiscal 2019 Cost 6,293,197 129,914 241,952 246,722 236,831 39,953 419,799 3,780,745 1,053,674 143,609
(10) Fiscal 2020 Cost 6,303,092 130,118 242,332 247,110 237,203 40,016 420,459 3,786,690 1,055,331 143,835
(11) Fiscal 2021 Cost 2,557,816 52,802 98,339 100,278 96,258 16,239 170,624 1,536,651 428,257 58,369
(12) Fiscal 2022 Cost 533,040 11,004 20,494 20,898 20,060 3,384 35,557 320,233 89,247 12,164
(13) Fiscal 2023 Cost 529,407 10,929 20,354 20,756 19,923 3,361 35,315 318,051 88,639 12,081
(14) Fiscal 2024 Cost 524,630 10,830 20,170 20,569 19,743 3,331 34,996 315,180 87,839 11,972
(15) Fiscal 2025 Cost 518,624 10,706 19,939 20,334 19,517 3,293 34,595 311,571 86,833 11,835
(16) Fiscal 2026 Cost 511,298 10,555 19,657 20,047 19,241 3,246 34,106 307,171 85,606 11,668
(17) Fiscal 2027 Cost 502,556 10,375 19,321 19,704 18,912 3,191 33,523 301,920 84,142 11,469
(18) Percentage of Total Cost 100.0% 2.1% 3.8% 3.9% 3.8% 0.6% 6.7% 60.1% 16.7% 2.3%
(19) Funded Ratio 86.57% 83.05% 97.66% 87.56% 83.05% 83.05% 83.05% 84.84% 83.05% 83.05%
* Allocation is based on the ratio of the Unfunded Actuarial Accrued Liability, adjusted for additional contributions.
Breakouts