actuarial assessment of pension and gp fund … ... details of net gpf balances from sap/r3 ......
TRANSCRIPT

HEAD OFFICE: KARACHI OFFICE: 7B, Block - F,
Gulberg II, 211, Central Hotel Building, Civil Lines Quarters, Mereweather Road,
Lahore, Pakistan. Karachi, Pakistan. Phones: 5760204, 5754036, 5753381 Fax: 5757867 Phone: 5217157, 5682494 Fax: 5682494
www.naumanassociates.com E-Mail: [email protected] and [email protected]
ACTUARIAL ASSESSMENT OF
PENSION AND GENERAL PROVIDENT FUND LIABILITIES
(AS PER CONTRACT WITH PRMP, GOVERNMENT OF PUNJAB
UNDER TA Loan No. 2386 – PAK)
Prepared by: NAUMAN A. CHEEMA
Lahore, Pakistan
August 31, 2009

Table of Contents Executive Summary.......................................................................................................... 1 Introduction..................................................................................................................... 11 MAIN REPORT.............................................................................................................. 13 CHAPTER 1: Government of Punjab Pension Scheme.............................................. 13
1.1 Introduction..................................................................................................... 13 1.2 Data ................................................................................................................. 13 1.3 Valuation & Cash-flow Projection Assumptions............................................ 35 1.4 Actuarial Valuation Method ........................................................................... 39 1.5 Methodology Used for Data Preparation ........................................................ 41 1.6 Valuation Results ............................................................................................ 44 1.7 Cash Flow Projections .................................................................................... 46
CHAPTER 2: Government of Punjab General Provident Fund Scheme ................. 49
2.1 Introduction..................................................................................................... 49 2.2 Data ................................................................................................................. 49 2.3 Valuation Methodology & Assumptions ........................................................ 57 2.4 Valuation Results ............................................................................................ 61 2.5 Cash Flow Projections .................................................................................... 65
CHAPTER 3: Funding Options..................................................................................... 67
3.1 Introduction..................................................................................................... 67 3.2 Assumptions.................................................................................................... 68 3.3 Different Options for Funding of Pension and GP Fund Liabilities............... 70 3.4 Optimal Funding Strategy for Pension Benefits and GP Fund ....................... 78
CHAPTER 4:International Public Sector Accounting Standard 25 for Punjab
Government Pension & General Provident Fund Schemes...................... 80 4.1 Objective ......................................................................................................... 80 4.2 Scope............................................................................................................... 80 4.3 Definitions, Assumptions & Methodology..................................................... 83 4.4 Reporting of Punjab Government Pension Scheme as per IPSAS 25 ............ 92 4.5 Reporting of Punjab Government General Provident Scheme as per
IPSAS 25......................................................................................................... 98 4.6 Commentary on IPSAS 25 Application to Government of Punjab Pension
and GP Fund Schemes .................................................................................. 103 APPENDIX I ................................................................................................................. 105 APPENDIX II................................................................................................................ 108 APPENDIX III .............................................................................................................. 109 APPENDIX IV .............................................................................................................. 110

APPENDIX V................................................................................................................ 111 APPENDIX VI .............................................................................................................. 113 APPENDIX VII............................................................................................................. 116 APPENDIX VIII ........................................................................................................... 117 APPENDIX IX .............................................................................................................. 123

Executive Summary Page 1 of 135
Actuarial Assessment of Pension and General Provident Fund Liabilities (as per contract with PRMP, Government of Punjab, under TA – Loan No. 2386)
Executive Summary 1. The primary objectives of the current assignment given by Punjab Resource
Management Programme, Government of Punjab (GoPb) (under TA Loan No. 2386)
in the Terms of Reference of contract dated March 9, 2009 are:
i. Conduct an actuarial valuation of Punjab Government Pension and General
Provident Fund Schemes.
ii. Report on anomalies and inaccuracies of computerized Pension and GP Fund
records.
iii. Carry out financial projections of Punjab Pension Fund and General Provident
Fund over future years.
iv. Make recommendations for funding requirements of Punjab Pension Fund and
General Provident Fund, based upon financial projections.
We have also included reporting and disclosures of Pension and General Provident
Fund Schemes as per International Public Sector Accounting Standard (IPSAS) 25.
2. Punjab Government has set up a separate Punjab Pension Fund to pre-finance part of
pension liability. As at 30.06.09, the assets of the Pension Fund amount to Rs. 3
billion. In addition, the legislation for setting up General Provident Fund has been
recently enacted. The Government intends to have Rs.12 billion in Pension Fund by
the end of year 2009 - 10.
3. An initial actuarial assessment of GoPb pension liability was conducted in 2006-07.
The Government of Punjab intends to update the said assessment and to illustrate
financing options for revising the funding strategy.

Executive Summary Page 2 of 135
Actuarial Assessment of Pension and General Provident Fund Liabilities (as per contract with PRMP, Government of Punjab, under TA – Loan No. 2386)
4. The estimated accrued liability of Punjab Government Pension Scheme as at 30th
June 2007 worked out to Rs.425 billion. Out of this, Rs.296 billion pertained to active
employees and the remaining Rs.129 billion associated to pensioners.
However, due to different past service distributions of different districts, the accrued
liability ranged between Rs.349 billion to Rs.485 billion.
5. Data for the current exercise was received from two sources, AG Office and Finance
Department of GoPb.
6. Information received for estimating pension liability and future cash outflows was as
follows:
AG Office:
i. 96.536 records of non-contractual active employees of Lahore District in MS
Excel.
ii. 44,477 records of GoPb Pensioners, received in September 2008 (referred to as
smaller data set in the Report)
iii. 225,840 records of GoPb Pensioners, received in May 2009 (referred to as larger
data set in the Report)
iv. Total pension payout for the year 2007-08 and the estimated payout for 2008-09
(split by pension, commutation and gratuity payments)
v. Information of total number of pensioners for the year 2007-08 and 2008-09.
Finance Department of GoPb:
i. Information of total sanctioned posts for 2009.
7. Different checks revealed a number of anomalies in data set of active employees and
both smaller and larger pensioners’ data sets.

Executive Summary Page 3 of 135
Actuarial Assessment of Pension and General Provident Fund Liabilities (as per contract with PRMP, Government of Punjab, under TA – Loan No. 2386)
The numbers of records discarded from each data set are as follows:
Active Pensioners Smaller Data Set
Pensioners Larger Data Set
Total Discarded Data 36,767 1,883 53,658Total Original Data 96,536 44,477 225,840Final Data Used 59,769 42,594 172,182
8. In greater order to develop greater confidence in the data, various salient features of
the data were checked for their reasonableness.
9. Pensioner’s larger data set requires further analysis and checking. The data can be
used with more refinement and confidence level in the next actuarial valuation.
10. It is strongly recommended that the data for active employees and pensioners should
be transferred to electronic records in proper manner and various checks should be
applied on the data base after feeding the information.
11. From the remaining sample set of 59,769 active employees and 42,594 pensioners
from smaller data set, the distributions of active employees and pensioners were
derived using aggregate information of sanctioned posts for employees (after making
adjustments for actual employees and contractual workers using information received
for previous exercises), and aggregate pension payout during 2007-08.
12. There was adequate confidence in the constructed data in spite of relatively
small samples because the valuation base used aggregate information for both
active employees and pensioners information i.e. aggregate pension payout of Rs.
11.996 billion for the year 2007-08 and aggregate number of active employees of
831,186 (extracted from information of total sanctioned posts). The individual
records of active employees and pensioners were merely used to construct
various age, service, salary and pension amount distributions.

Executive Summary Page 4 of 135
Actuarial Assessment of Pension and General Provident Fund Liabilities (as per contract with PRMP, Government of Punjab, under TA – Loan No. 2386)
13. The accrued liability of the Punjab Government Pension Scheme, based on the
above information base and assuming NIL early retirements is Rs.597.6 billion
as at 30th June 2009.
Out of this liability, Rs.391.7 billion pertains to active employees and the remaining
Rs.206.0 billion is associated with existing pensioners.
14. The assumption of NIL early retirement was based on the following factors:
i. the estimated pension and commutation outflows for the year 2007-08 and 2008-
09, based on NIL assumption of early retirement, matched with the actual payouts
for the same periods,
ii. the Finance Department highlighted that there have been practically no early
retirements in the last couple of years,
iii. early retirements in previous years had been unusually high on account of the
expectation that the Government would soon withdraw commutation benefit, and
iv. the current recessionary environment would force the number of early retirements
downwards.
Valuation conducted in 2007 used early retirement factors calculated on experience of
public sector employee benefit schemes in Pakistan.
However, if the economic conditions return to normalcy, the early retirement may
pick up. Therefore, two sets of valuation results have been provided in the Report,
one based on NIL assumption, and the other on 2007 early retirement rates.
15. The accrued liability of the Punjab Government Pension Scheme, assuming early
retirements based on historical pattern, is Rs.636.3 billion as at 30th June 2009.
Executive Summary Page 5 of 135
Actuarial Assessment of Pension and General Provident Fund Liabilities (as per contract with PRMP, Government of Punjab, under TA – Loan No. 2386)
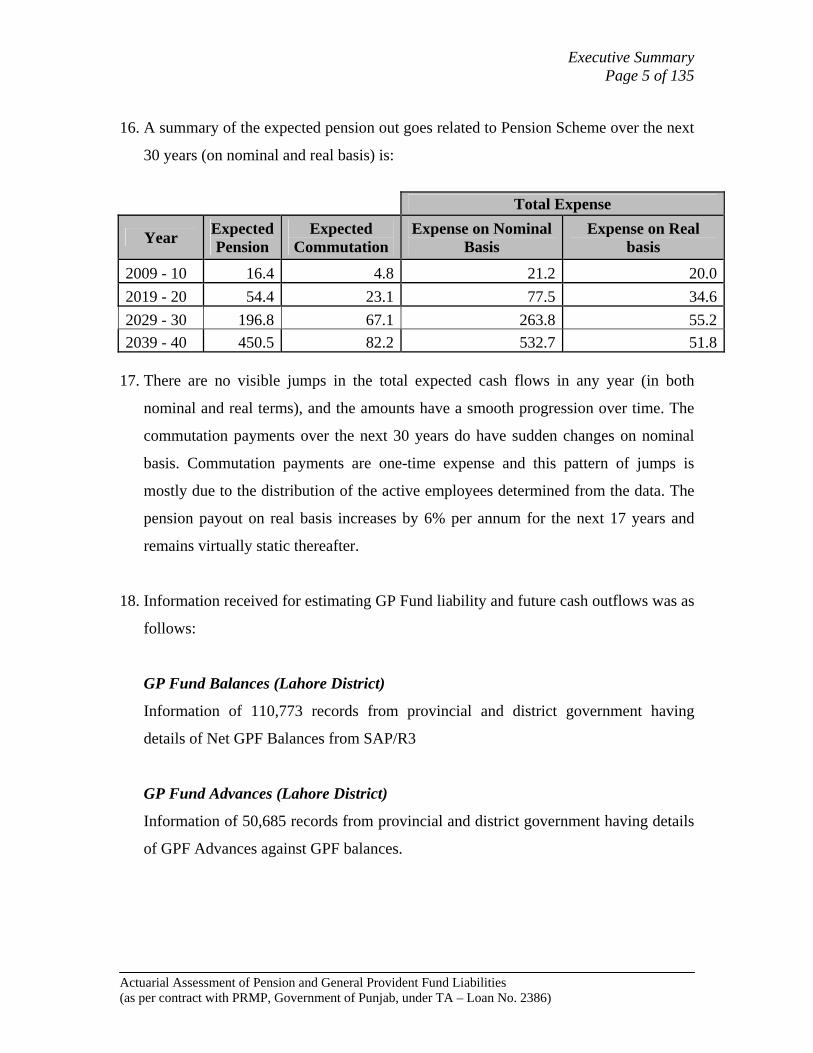
16. A summary of the expected pension out goes related to Pension Scheme over the next
30 years (on nominal and real basis) is:
Total Expense
Year Expected Pension
Expected Commutation
Expense on Nominal Basis
Expense on Real basis
2009 - 10 16.4 4.8 21.2 20.02019 - 20 54.4 23.1 77.5 34.62029 - 30 196.8 67.1 263.8 55.22039 - 40 450.5 82.2 532.7 51.8
17. There are no visible jumps in the total expected cash flows in any year (in both
nominal and real terms), and the amounts have a smooth progression over time. The
commutation payments over the next 30 years do have sudden changes on nominal
basis. Commutation payments are one-time expense and this pattern of jumps is
mostly due to the distribution of the active employees determined from the data. The
pension payout on real basis increases by 6% per annum for the next 17 years and
remains virtually static thereafter.
18. Information received for estimating GP Fund liability and future cash outflows was as
follows:
GP Fund Balances (Lahore District)
Information of 110,773 records from provincial and district government having
details of Net GPF Balances from SAP/R3
GP Fund Advances (Lahore District)
Information of 50,685 records from provincial and district government having details
of GPF Advances against GPF balances.

Executive Summary Page 6 of 135
Actuarial Assessment of Pension and General Provident Fund Liabilities (as per contract with PRMP, Government of Punjab, under TA – Loan No. 2386)
GP Fund Balances and Advances (Other Districts):
Additional information of 145,414 records with GPF Balances and Advances for 8
other districts.
19. Different checks revealed a number of anomalies in data set. The number of records
discarded from each data set are as follows:
GP Fund Balances (Lahore District) 3,988 GP Fund Advances (Lahore District) 19,455 GP Fund Balances and Advances (Other Districts) 49,812
20. It was not possible to use the provided information for other than Lahore Districts,
because the district wise average balances were significantly lower as compared to
those provided for Lahore district earlier (Rs. 86,218) and were much lower than the
expected range of Rs.75,000 –Rs.85,000. It appeared that the accumulated GPF
balances were not updated from the date of start of employment. Thus, to
determine the underlying liability of the Government of Punjab GP Fund and
cash-flow projections the Lahore district information was used.
21. It is strongly recommended that the data for GP Fund Balances and Advances should
be transferred to electronic records in proper manner and various checks should be
applied on the data base after feeding the information.
22. The resulting information was mapped on to the active population to estimate the GP
Fund Liability.
23. Estimate of accrued liability of the Punjab Government General Provident Fund
Scheme, based on the above information base is Rs.79.2 billion as at 30th June
2009.

Executive Summary Page 7 of 135
Actuarial Assessment of Pension and General Provident Fund Liabilities (as per contract with PRMP, Government of Punjab, under TA – Loan No. 2386)
24. The growth in GP Fund balances (i.e. liability), assuming future interest credited is
12% per annum, for the next 30 years at 5 year intervals on nominal and real basis
(using 2009-09 as base year) is given the following table:
Year Estimated GPF
Liability at fiscal year End (Nominal Basis)
Estimated GPF Liability at fiscal year End (Real
Basis)
2009 – 10 89.8 77.8 2013 – 14 148.6 96.4 2018 – 19 260.3 117.4 2023 – 24 408.6 128.0 2028 – 29 571.8 124.6 2033 – 34 873.1 131.8 2037 – 38 1305.8 146.3 2039 – 40 1597.5 154.1
Importantly, GoPb is expected to consume approximately Rs. 5.0 billion of
employees’ money in 2009-10, which is projected to escalate over time.
25. A summary of the expected out goes related to General Provident Scheme over the
next 30 years (on nominal and real basis) is:
Total Expense
Year Expense on
Nominal Basis Expense on Real Basis
2009 - 10 4.2 3.9 2019 - 20 17.5 7.7 2029 - 30 56.1 11.6 2039 - 40 87.9 9.7
26. There is a visibly rapid increase in GP Fund payments on nominal basis after which
the payments have sudden dip in years 2029-30. Overall, even on real basis, the
increase in GP Fund cash outflows is more significant than the increase in pension
outgoes.

Executive Summary Page 8 of 135
Actuarial Assessment of Pension and General Provident Fund Liabilities (as per contract with PRMP, Government of Punjab, under TA – Loan No. 2386)
27. Punjab Government is contemplating various possibilities of capital injections into
the Pension and GP Fund from year 2009-10 onwards. It is, however, extremely
important to determine adequacy of capital injections versus objectives to be achieved
by these contributions. Government can then decide whether it needs to make a
change in proposed capital contribution amount and/or objectives of funding.
28. The most appropriate Funding approach in case of a GP Fund is that Government
should start making contributions deducted from the salaries of the employees to the
General Provident Fund on regular basis and amortize the existing accrued liability
over a period of 10, 20 and 30 years. Amortization of the accumulated GP Fund
liability of Rs.89.8 billion projected at 30.06.2010 for different durations would be as
follows:
Amortization Period Annual Instalment payable at the middle of the Year
10 Years 15.0 billion 20 Years 11.4 billion 30 Years 10.5 billion
29. The Implicit Pension Debt ratio for Government of Punjab Pension Scheme is
estimated to be in range between 11-12%. This is on the lower side when
compared with other countries.
30. In view of existing factors such as revenue crunch, priority for spending in other
areas, relatively low Implicit Pension Debt of Punjab Government, and higher priority
to fund GP Fund liability, it would be advisable to build the Pension Fund gradually
in the first few (5-10) years and treat it as a buffer in case of:
• any unexpected pension outgoes,
• Government revenue shortfall,
• or to fulfil the need of spending in other areas

Executive Summary Page 9 of 135
Actuarial Assessment of Pension and General Provident Fund Liabilities (as per contract with PRMP, Government of Punjab, under TA – Loan No. 2386)
31. Keeping in view the above parameters and constraints, it would be prudent to start
funding of both employee benefit schemes at the same time with higher priority
attached to GP Fund with relatively low contributions for financing accrued GP Fund
liability and meeting pension expenses in the first few years.
32. An optional funding strategy (which has been discussed in detail with the Finance
Department) which incorporates the above criteria is given below:
Year
Annual Regular Contribution
deducted from Salaries
Past GP Fund Liability
Amortization Instalment
Total Amount of Pension Fund Contribution (Option D)
Total Contribution
2010 - 11 5.6 2.0 2.0 9.6 2011 - 12 6.2 3.0 3.0 12.2 2012 - 13 6.8 3.0 3.0 12.8 2013 - 14 7.5 4.0 4.0 15.5 2014 - 15 8.3 5.0 5.7 19.0 2015 - 16 9.2 6.1 6.3 21.6 2016 - 17 10.1 7.3 6.9 24.3 2017 - 18 11.1 8.5 7.5 27.1 2018 - 19 12.3 9.7 8.2 30.2 2023 - 24 19.3 16.8 12.3 48.4 2028 - 29 28.8 25.5 18.2 72.5 2039 - 40 74.6 69.6 58.2 202.4 33. This funding approach should be reviewed in future for a longer time horizon.
34. The reporting and disclosures of GoPb Pension and GPF Schemes have also been
made as per International Public Sector Accounting Standard (IPSAS) 25 for the year
2008-09.
As per our interpretation, GPF Scheme does not fall under IPSAS 25 because it does
not constitute a benefit provided by the Govt. as defined in the Standard. However,

Executive Summary Page 10 of 135
Actuarial Assessment of Pension and General Provident Fund Liabilities (as per contract with PRMP, Government of Punjab, under TA – Loan No. 2386)
best possible reporting of GPF Scheme has been done according to IPSAS assuming
that it is a defined benefit scheme.
35. The Standard has reporting and disclosures of various items (such as present value of
defined benefit pension obligations, fair value of Plan assets etc.) which will emerge
as powerful tools for the Govt. in understanding the liabilities and assets of the
Schemes AND various components of assets and liabilities.
36. The Standard requires calculation of following 2 benchmarks :
i. Statement of Financial Position; and
ii. Statement of Financial Performance.
These act as useful criteria for comparison of assets vs. liabilities AND scheme cost
vs. contributions during the accounting period.
37. It is important to differentiate the accrued (or funding) pension liability from IPSAS
25 liability.
One key difference is that IPSAS 25 spreads non-vested liability (i.e. liability
associated with active employees having less than 25 years of service) over the
average period to vesting. As such, while the accrued (or funding) liability of Punjab
Govt. Pension Scheme is Rs.515.4 billion on 01.07.08, the initial liability as per
IPSAS 25 is Rs.355.6 billion on the same date (assuming the Pension Scheme is
introduced as at the date of adoption of the Standard).
38. Considering that this is a new concept for the Government, its usefulness will start to
emerge gradually over the future years.

Introduction Page 11 of 135
Actuarial Assessment of Pension and General Provident Fund Liabilities (as per contract with PRMP, Government of Punjab, under TA – Loan No. 2386)
Introduction In 2003, the Government of Punjab (GoPb) formed a working group to study the
management of liabilities associated with its existing Pension and General Provident
Fund schemes; to advise the reforms that were needed and suggest how they would be
implemented.
During the first meeting of the working group held on 5th July 2003, it was decided that,
in order to achieve the objectives of the study, it would be necessary to perform a
preliminary actuarial valuation to determine the scope and magnitude of the scheme and
the associated liability of the Government of Punjab Pension Scheme.
Nauman Associates carried out the above mentioned valuation at the behest of the
Provincial Government, the results of which were submitted in report CM/L-1955/03 on
26th September 2003 to the working group. This was followed by a second report CM/L-
2465/03 on 11th November 2003 containing the Firm’s comments, observations and
suggestions regarding the GoPb’s Pension Scheme.
The results of the exercise carried out in 2003 were very approximate as they were based
on minimal information. As such, it was decided to arrive at a better and up-to-date
estimate of the GoPb Pension liability by incorporating greater amount of specific
information.
In 2007, the undersigned under Contract A12419, Project RSC – C71322 (PAK) – Punjab
Government Pension Scheme provided the results of preliminary actuarial valuation for
estimating the extent of Pension liabilities and cash flow projections of the Government
of Punjab employees. The Report highlighted in detail the sources of data, the anomalies
in the available data, cash flow projections of the Pension Fund, sensitivity testing of key
assumptions, and made recommendations for the funding requirement related to the
Pension Fund.

Introduction Page 12 of 135
Actuarial Assessment of Pension and General Provident Fund Liabilities (as per contract with PRMP, Government of Punjab, under TA – Loan No. 2386)
Punjab Government, with the Asian Development Bank (ADB), has initiated the second
phase of reforms under Punjab Government Efficiency Improvement Program [PGEIP].
PGEIP is the continuation of Punjab Resource Management Program [PRMP]. Under
this, the GoPb has created a separate Punjab Pension Fund to pre-finance part of the
liabilities. One of the policy actions under PGEIP requires, streamlining the processing of
Pension cases through necessary restructuring of the Pension administration and
improving Pension & GP Fund record keeping. Government of the Punjab intends to
update the earlier work and to illustrate financing options for revising the funding
strategy. For this purpose, the Finance Department, engaged the undersigned to assist
GoPb in conducting an actuarial assessment of Pension and General Provident Fund
liabilities and carrying out various tasks as given in below.
This Report provides the results of actuarial valuation for estimating the value of Pension
and General Provident (GP) Fund liabilities, related cash flow projections, funding
options and reporting and disclosures of these Schemes under International Public Sector
Accounting Standard 25 (IPSAS 25) of the Government of Punjab (GoPb), (as outlined
under Pension and GP Fund Reforms component of TA Loan No. 2386 – PAK). The
tasks have been conducted using the information available from the GoPb’s Finance
Department and Accounting General’s Office.
The Report highlights in detail the sources of data and the anomalies in the available data.
The Report also examines different funding options for the Government of Punjab
Pension Fund and General Provident Fund.
The Report is split into the following four chapters:
i. Government of Punjab Pension Scheme
ii. Government of Punjab General Provident Fund Scheme
iii. Funding Options
iv. International Public Sector Accounting Standard 25 for Punjab Government
Pension & General Provident Fund Schemes

MAIN REPORT Chapter 1: Government of Punjab Pension Scheme
Page 13 of 135
Actuarial Assessment of Pension and General Provident Fund Liabilities (as per contract with PRMP, Government of Punjab, under TA – Loan No. 2386)
MAIN REPORT
CHAPTER 1 Government of Punjab Pension Scheme
1.1 Introduction
Government of Punjab Pension Scheme is a defined benefit scheme, where the final
pension benefit is calculated on last drawn salary and service rendered by the Punjab
Government Employees.
This chapter gives details on the accrued liability of Government of Punjab Pension
Scheme and the expected future cash-outflows for this scheme. Details of the sources of
data, data analysis and suggestive measures to remove anomalies are also part of this
chapter.
1.2 Data
1.2.1 Data Sources
Data / information for estimating the accrued pension liability and future cash outflows
was provided by the Accountant General (AG) Office and the Finance Department of
Government of Punjab. The following are the details of the data / information obtained
from each of the sources:

MAIN REPORT Chapter 1: Government of Punjab Pension Scheme
Page 14 of 135
Actuarial Assessment of Pension and General Provident Fund Liabilities (as per contract with PRMP, Government of Punjab, under TA – Loan No. 2386)
Accountant General (AG) Office
Active Employees
The AG Office provided data for active employees of Lahore District only. The
information was made available for 96,536 non-contractual active employees in MS
Excel. Each entry of an employee contained fields including:
i. name of employee,
ii. date of birth, date of appointment,
iii. salary,
iv. grade; and
v. other relevant information.
Pensioners
The AG Office provided two data sets for pensioners at different points of time. The first
data set was provided in the month of September, 2008 containing information of 44,477
GoPb’s pensioners. The second, much larger data set, was provided in the month of May,
2009 containing information of 225, 840 GoPb’s pensioners.
The information provided in both data sets was quite similar in terms of the fields for
each pensioner. These fields included:
i. date of birth,
ii. date of appointment,
iii. date of death etc.
However, the amount of information provided for pensioners’ category of each pensioner
was different in the two data sets. The first (smaller) data set provided greater detail of

MAIN REPORT Chapter 1: Government of Punjab Pension Scheme
Page 15 of 135
Actuarial Assessment of Pension and General Provident Fund Liabilities (as per contract with PRMP, Government of Punjab, under TA – Loan No. 2386)
pensioner’s category and included information whether the pensioner was a normal
retiree, invalid retiree, early retiree or the family was the beneficiary in case of death in
service or after retirement. The second (larger) data set only provided information
whether the pension category was surviving or family.
It should be noted that the pension amounts given in both data sets were those as
calculated at the time of retirement of the pensioner or the death of the employee, rather
than the current pension payments (as per the indexation increases announced by GoPb
from time to time). To estimate the accrued pension liability and future cash out flows,
the monthly pension of a pensioner as at the date of valuation is required. For this
purpose, an indexation table was used to calculate factors to determine the pension
amount being received by the pensioner as at 30.06.09. The table was developed using
the information from previous indexations announced by GoPb and is provided in
Appendix III of the Report.
Information of total number of pensioners for the year 2007-08 and 2008-09 were
provided. Details are as follows:
Total Number
of Pensioners 2007-08 381,389 2008-09 360,822
Pension Payout
The following information was provided by AG Office for total pension payout for the
year 2007-08 and the estimated payout for 2008-09 (split by pension, commutation and
gratuity payments) for actuarial valuation of Pension Scheme:

MAIN REPORT Chapter 1: Government of Punjab Pension Scheme
Page 16 of 135
Actuarial Assessment of Pension and General Provident Fund Liabilities (as per contract with PRMP, Government of Punjab, under TA – Loan No. 2386)
(Rs. Billion)
Description 2007-08 (Actual Expenditure)
2008-09 (Projected Figures)
Pension 11.996 13.195 Commutation 3.430 3.773 Gratuity 0.417 0.459 Medical Reimbursement Charges 0.563 0.619 TOTAL 16.407 18.048
Finance Department (FD) of Government of Punjab
The FD of GoPb provided information of the total sanctioned posts for each Grade (1 to
22) as at 30.06.2008 and 30.06.2009. Total sanctioned posts for 2009 are 1,029,646.
1.2.2 Data Analysis
Data provided by the AG office was analysed for its reasonableness to qualify its
appropriateness for the exercise, and to develop confidence in the valuation results. This
section provides a commentary on the reasonableness checks adopted, the anomalies
found in the data, and summarises the number of records discarded for each anomaly
identified in all data sources.
It should be noted that most of the anomalies found in any data occur at the time when
the data is being fed into a system. The data feeder can make a number of errors
including but not limited to:
• missing data entries,
• incorrect feeding of entries,
• feeding entries in a format not readable by system,
• typographical errors, and
• repetition of same entries etc.

MAIN REPORT Chapter 1: Government of Punjab Pension Scheme
Page 17 of 135
Actuarial Assessment of Pension and General Provident Fund Liabilities (as per contract with PRMP, Government of Punjab, under TA – Loan No. 2386)
Anomalies found in active and pensioner’s data are as follows:
Anomalies in Active Employees Data
A number of anomalies were found in the data for active employees highlighted below. A
table at the end summarizes the number of records removed for each anomaly identified.
It should be noted that it was deemed more appropriate to delete an incorrect record
rather than making an adjustment to the data, since a wrong adjustment would distort the
characteristics of active employee’s population, and thus the accrued liability and cash
flow projections.
Incorrect Date of Appointment and/or Birth: A few entries were found where the dates of
appointment and/or birth were in a format that could not be recognized by the system or
could not be understood. These entries were discarded since they could not be used for
any calculations.
Age at Appointment is less than 18 and greater than 45: Age of employees at the time of
appointment was calculated from the information provided in the data. Records with age
at appointment less than 18 and greater than 45 were discarded, since individuals are
highly unlikely to be hired at such ages.
Dummy Entries: A fairly large number of records were found with the same date of birth
and/or date of appointment. These date of births and/or appointments were distributed
equally between all basic pay scales but showed inconsistencies with other fields of the
same record. These entries, referred to as “dummy entries”, were deleted for the purpose
of this exercise. Such dummy entries may exist when the data feeder may not be able to
read certain pieces of information from the hard copy, and decides to enter one value for
the information he/she is unable to read clearly. As mentioned earlier, such entries would
give a distorted picture of the population characteristics.

MAIN REPORT Chapter 1: Government of Punjab Pension Scheme
Page 18 of 135
Actuarial Assessment of Pension and General Provident Fund Liabilities (as per contract with PRMP, Government of Punjab, under TA – Loan No. 2386)
Duplicate/ Triplicate Entries: A number of records were found to be identical and some
recorded twice or thrice. Thus for duplicate entries, one of the two records were discarded
and for triplicate entries, two of the three records were discarded.
Age is greater than 60 years: GoPb has a normal retirement age (NRA) of 60 years.
Therefore, records with age greater than 60 were discarded on the assumption that the
date of birth of these records was incorrect.
Other Anomalies: Some other checks to validate a record were performed, such as date of
appointment should be less than date of retirement, basic pay should be at least Rs. 2,475
since minimum basic pay of grade 1 employees is Rs. 2,475 where salary increases take
place with change of a grade. Entries that failed to pass these checks were qualified as
incorrect and discarded.
The following table provides a summary of each type of anomaly and the number of
records discarded:
Type of Anomaly No. of Records
Age at Appointment was less than 15 115 Date of appointment was Incorrect 122 Basic Pay was missing 158 Date of Appointment was missing 245 Date of Birth was dummy (01/08/1984) 247 Age was more than 60 years 272 Date of Appointment was equal to Date of Retirement 276 Age at Appointment was more than 45 years 500 Duplicate/Triplicate Records 528 Both Date of Birth and Date of Appointment was dummy (01/08/1984 & 01/01/2003) 6,295 Basic Pay was less than 2,500 whereas lowest pay in grade 1 is 2,475 9,335 Date of Appointment was dummy (01/01/2003) 18,674 Total Discarded Data 36,767 Total Original Data 96,536 Final Data Used 59,769

MAIN REPORT Chapter 1: Government of Punjab Pension Scheme
Page 19 of 135
Actuarial Assessment of Pension and General Provident Fund Liabilities (as per contract with PRMP, Government of Punjab, under TA – Loan No. 2386)
Anomalies in Pensioners Data
A number of anomalies were found in the both smaller and larger data sets for pensioners
highlighted below. A table at the end summarizes the number of records removed for
each anomaly identified. It should be noted that it was deemed more appropriate to delete
an incorrect record rather than making an adjustment to the data, since a wrong
adjustment would distort the characteristics of pensioners’ population, and thus the
accrued liability and cash flow projections.
Missing & Incorrect entries: Records with important missing or incorrect fields such as:
• date of birth,
• pension at the time of retirement etc.
were deleted.
Incorrect Beneficiary: A check was performed on records to see if the pensioner status
matched with the beneficiary type. There were a number of entries that showed pensioner
as the beneficiary where date of death and status as dead were provided. There was lack
of confidence in such entries and hence were deleted.
Incorrect Date of Appointment, Date of Retirement, Date of Birth or Date of Death:
Total service at the time of retirement of each retiree was calculated from the information
available. Records with a total service at the time of retirement being less than 10 years
were discarded. As per the rules of the pension scheme, an active employee has to
complete a minimum of 10 years of service to qualify for a pension benefit.
On further analysis, some records had a highly unlikely age of less than 20 or greater than
108. Therefore, a minimum benchmark for each pensioner’s age was determined
according to the category of the pensioner (for instance, for family pensioners, a lower

MAIN REPORT Chapter 1: Government of Punjab Pension Scheme
Page 20 of 135
Actuarial Assessment of Pension and General Provident Fund Liabilities (as per contract with PRMP, Government of Punjab, under TA – Loan No. 2386)
benchmark was set because it was unclear from the data if the date of birth pertains to the
pensioner or beneficiary). Any record not falling in the above set range was discarded.
Also, some records showed a pensioner as a “Normal Retiree” while the status was
“Dead”. A check was carried out to see if the death took place after retirement since for a
case of death during service, the pensioner should fall into the category of “Family
Retiree”. A few records were found to have this anomaly, and since no appropriate
adjustment could be made, these records were discarded.
The following table provides a summary of each type of anomaly and the number of
records discarded:
Pensioners Smaller Data Set
Type of Anomaly No. of Records Incorrect Date at Death 6 Date of Retirement / Date of Death was missing 25 Date or Retirement earlier than Date of Appointment 38 Date of Death earlier than Date of Retirement 42 Pension Type and Pensioners Status did not match 68 Status is Alive but Date of Death is given 86 Service at Date of Retirement/Death was less than 10 years 99 Net Pension was missing 136 Incorrect Date of Birth or Date of Retirement or Date of Death 354 Date of Birth was missing 1,029 Total Discarded Data 1,883 Total Original Data 44,477 Final Data Used 42,594
Note: There were 5,380 Records in which date of appointment was missing. However, we
included this information in the valuation data because there is no impact of this missing
data on liability and cash flow calculations.

MAIN REPORT Chapter 1: Government of Punjab Pension Scheme
Page 21 of 135
Actuarial Assessment of Pension and General Provident Fund Liabilities (as per contract with PRMP, Government of Punjab, under TA – Loan No. 2386)
Pensioners Larger Data Set
Type of Anomaly No. of
Records Discarded due to complex/Invalid column Format of Rahim Yar Khan 11,312 No Names and/or Dates/amounts were missing (core info was missing) 414 Date of Birth was missing or wrong 11,054 Net Pension was missing (most of records have gross pension) or wrong amount given 2,412
Age less than 20 years 613 Date of Retirement/Date of Death was missing OR WRONG Date Entered 6,593
Date or Retirement earlier than Date of Appointment 8,770 Date of Death earlier than Date of Retirement 1,033 Pension Type and Pensioners Status did not match 8,756 Date of Birth equal to Date of Retirement OR Date of Death 57 Pension Type is SELF and status is Alive but Age is Less than 45 Years 2,399 Other Error in Data like double dates , DOR etc. 158 Others DOA more than DOD or DOR or text Date Format 87 Total Discarded Data 53,658 Total Original Data 225,840 Final Data Used 172,182

MAIN REPORT Chapter 1: Government of Punjab Pension Scheme
Page 22 of 135
Actuarial Assessment of Pension and General Provident Fund Liabilities (as per contract with PRMP, Government of Punjab, under TA – Loan No. 2386)
1.2.3 Suggestions for the Improvement in Employees and Pensioners Database
Keeping in view the above anomalies in the active employees and pensioners database,
we suggest that:
1. A proper networking and communication should exist among various districts of
Punjab Government and expert/professional employees should be hired for
streamlining the employees’ and pensioners’ record keeping.
2. Transfers of active employees should be recorded properly and care should be taken
not to create repetitive records of the same employee. This can be done by tracking the
employee through its unique employee number.
3. Date of birth, date of appointment, pay scale, pension nominee, salary history and
other relevant information of each employee should be cross checked through
employee’s original appointment record and the information fed in the system should
be verified by the employee.
4. Dummy entries should be avoided since they may cause significant problems for both
employees and Government in the long-run,
5. Information of the latest pension amounts being paid to pensioners should be recoded
in a proper manner.
6. Date of birth, date of retirement, type of retirement, type of beneficiary, current
monthly pension amount and other relevant information should be obtained from their
corresponding districts and pension disbursement offices.
7. Verification of the survival of the pension recipient should be streamlined, since this
will ensure hedging against the misuse of Pension benefit.

MAIN REPORT Chapter 1: Government of Punjab Pension Scheme
Page 23 of 135
Actuarial Assessment of Pension and General Provident Fund Liabilities (as per contract with PRMP, Government of Punjab, under TA – Loan No. 2386)
8. Various data checks should be applied on the database after feeding in the information
to detect various errors and anomalies. The examples of such checks could be as
follows:
Active Employees:
• Age of an employee should not be greater than 60 years
• Age of an employee should not be less than 18 years
• Date of Birth should be earlier than Date of Appointment
• Salary of an employee should not be less than the minimum salary for his/her
relevant Pay Scale
• Salary of an employee should not be significantly high
Pensioners:
• Date of Birth, Date of Appointment should be earlier than Date of
Retirement/Death
• Retirement before 45 years of age should be verified
• Commutation amount calculated should verified from the gross/net monthly
pension amount
• Type of Pensioner should be consistent with his/her age at retirement (for instance
early retirement age should be less than 60)

MAIN REPORT Chapter 1: Government of Punjab Pension Scheme
Page 24 of 135
Actuarial Assessment of Pension and General Provident Fund Liabilities (as per contract with PRMP, Government of Punjab, under TA – Loan No. 2386)
1.2.4 Data Summary This section provides summary statistics of active employees’ and pensioners’ data after
removal of anomalies as described in the earlier section. It also provides commentary on
any visible trends found in the remaining data and compares the smaller and the larger
data set for pensioners
Active Employees The following table provides summary of the cleaned data of active employees (i.e. data
used for valuation and cash flow projections):
Grade Number Average Basic Pay Average Age Average Past Service 1 318 3,264 29 5 2 6,622 4,535 39 15 3 1,204 5,325 44 19 4 637 5,141 39 14 5 23,444 5,081 33 10 6 808 6,746 43 19 7 6,722 6,760 40 16 8 307 7,885 45 20 9 3,780 7,809 41 18 10 490 10,018 49 26 11 534 8,770 43 19 12 779 8,690 39 15 13 88 9,455 41 17 14 5,129 8,431 36 12 15 761 12,520 44 20 16 2,383 13,360 45 21 17 3,100 19,194 45 18 18 1,733 26,360 49 22 19 673 32,862 52 26 20 218 38,527 54 26 21 36 46,482 56 28 22 3 54,147 60 32
Total 59,769 8,065 38 14

MAIN REPORT Chapter 1: Government of Punjab Pension Scheme
Page 25 of 135
Actuarial Assessment of Pension and General Provident Fund Liabilities (as per contract with PRMP, Government of Punjab, under TA – Loan No. 2386)
The following graph summarizes the grade-wise distribution of employees:
Grade-Wise Distribution
0
5000
10000
15000
20000
25000
1 2 3 4 5 6 7 8 9 10 11 12 13 14 15 16 17 18 19 20 21 22
Grade
Num
ber o
f Em
ploy
ees
Grade-wise average age and average past service are provided in graphs below:
010203040506070
1 2 3 4 5 6 7 8 9 10 11 12 13 14 15 16 17 18 19 20 21
Aver
age
Age
Grade
Grade-Wise Average Age

MAIN REPORT Chapter 1: Government of Punjab Pension Scheme
Page 26 of 135
Actuarial Assessment of Pension and General Provident Fund Liabilities (as per contract with PRMP, Government of Punjab, under TA – Loan No. 2386)
05
101520253035
1 2 3 4 5 6 7 8 9 10 11 12 13 14 15 16 17 18 19 20 21 22
Aver
ageP
ast S
ervi
ce
Grade
Grade-Wise Average Past Service
The grade-wise average age does not show any unusual trends. The trend of grade-wise
average past service cannot be qualified as being unusual or laying out an incorrect
picture since the Government of Punjab does not necessarily promote individuals to a
higher grade based upon past service. No other unusual patterns were observed when data
of active employees was analyzed grade-wise.
Grade-wise average basic pay is provided in the graph below:
0
10,000
20,000
30,000
40,000
50,000
60,000
1 2 3 4 5 6 7 8 9 10 11 12 13 14 15 16 17 18 19 20 21 22
Aver
age
Bais
c Pa
y
Grade
Grade-wise Average Basic Pay
The average salary increases with the grade of the employee which is a very much
expected pattern.

MAIN REPORT Chapter 1: Government of Punjab Pension Scheme
Page 27 of 135
Actuarial Assessment of Pension and General Provident Fund Liabilities (as per contract with PRMP, Government of Punjab, under TA – Loan No. 2386)
Furthermore, to check if any outliers existed or if there were any unusual patterns a
similar analysis was conducted for age-wise distribution of active employees. Age-wise
patterns of total number of employees, average basic pay and average past service are
provided in graphs below:
The dip in the age-wise distribution from age 25 to 40 is merely due to the hiring pattern.

MAIN REPORT Chapter 1: Government of Punjab Pension Scheme
Page 28 of 135
Actuarial Assessment of Pension and General Provident Fund Liabilities (as per contract with PRMP, Government of Punjab, under TA – Loan No. 2386)
Average basic pay is expected to increase with age and it can be clearly seen from the
graph above that the same trend is observed in data under discussion.
In the same way, average past service of employees is expected to increase with age. As
expected, it can be seen above that there is positive correlation between average age and
average past service.
Overall, the patterns seen above do not have any alarming trends indicating any
significant issues with the data.
Detailed tables and figures related to these graphs regarding data of active employees is
provided in Appendix I.
Pensioners Smaller Data Set
Age wise details for each category (normal, early, invalid and family) of retirees are
provided in the Appendix IV. The following tables and graphs shows the summary of the
data of Pensioners after removal of anomalies used for the valuation:
0.0
5.0
10.0
15.0
20.0
25.0
30.0
35.0
18 19 20 21 22 23 24 25 26 27 28 29 30 31 32 33 34 35 36 37 38 39 40 41 42 43 44 45 46 47 48 49 50 51 52 53 54 55 56 57 58 59 60
Average Past Service
Total
MAIN REPORT Chapter 1: Government of Punjab Pension Scheme
Page 29 of 135
Actuarial Assessment of Pension and General Provident Fund Liabilities (as per contract with PRMP, Government of Punjab, under TA – Loan No. 2386)
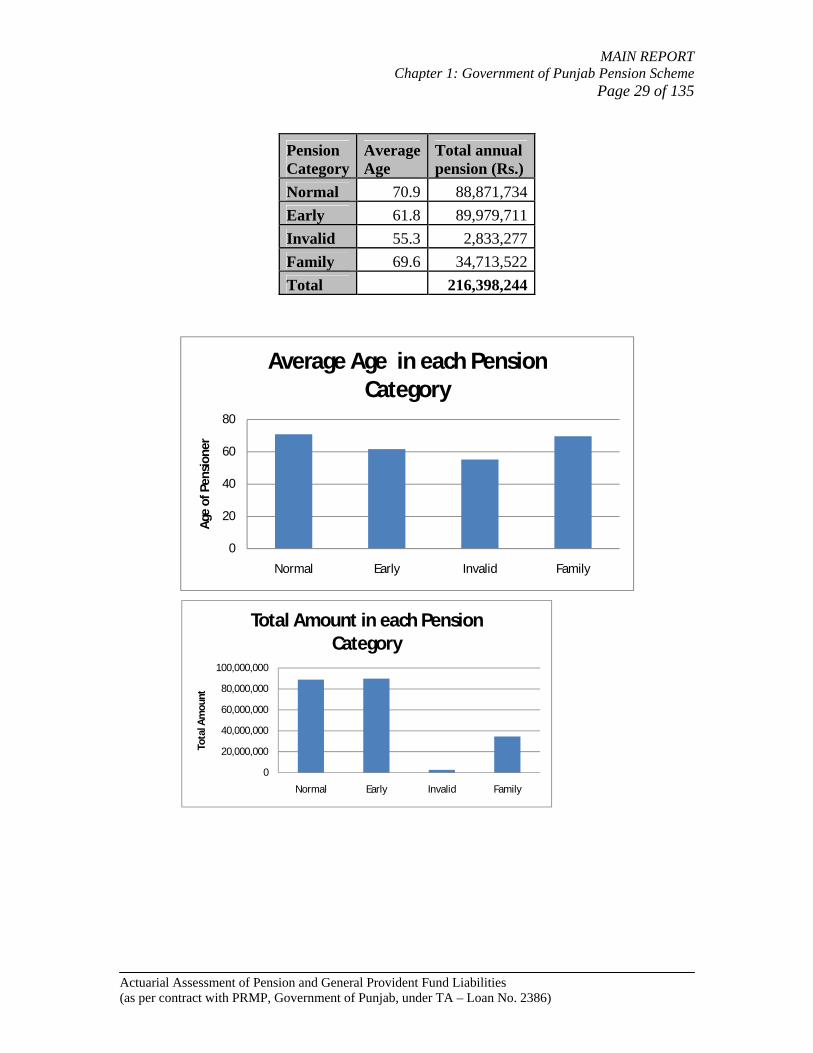
Pension Category
Average Age
Total annual pension (Rs.)
Normal 70.9 88,871,734Early 61.8 89,979,711Invalid 55.3 2,833,277Family 69.6 34,713,522Total 216,398,244
0
20
40
60
80
Normal Early Invalid Family
Age
of P
ensio
ner
Average Age in each Pension Category
0
20,000,000
40,000,000
60,000,000
80,000,000
100,000,000
Normal Early Invalid Family
Tota
l Am
ount
Total Amount in each Pension Category

MAIN REPORT Chapter 1: Government of Punjab Pension Scheme
Page 30 of 135
Actuarial Assessment of Pension and General Provident Fund Liabilities (as per contract with PRMP, Government of Punjab, under TA – Loan No. 2386)
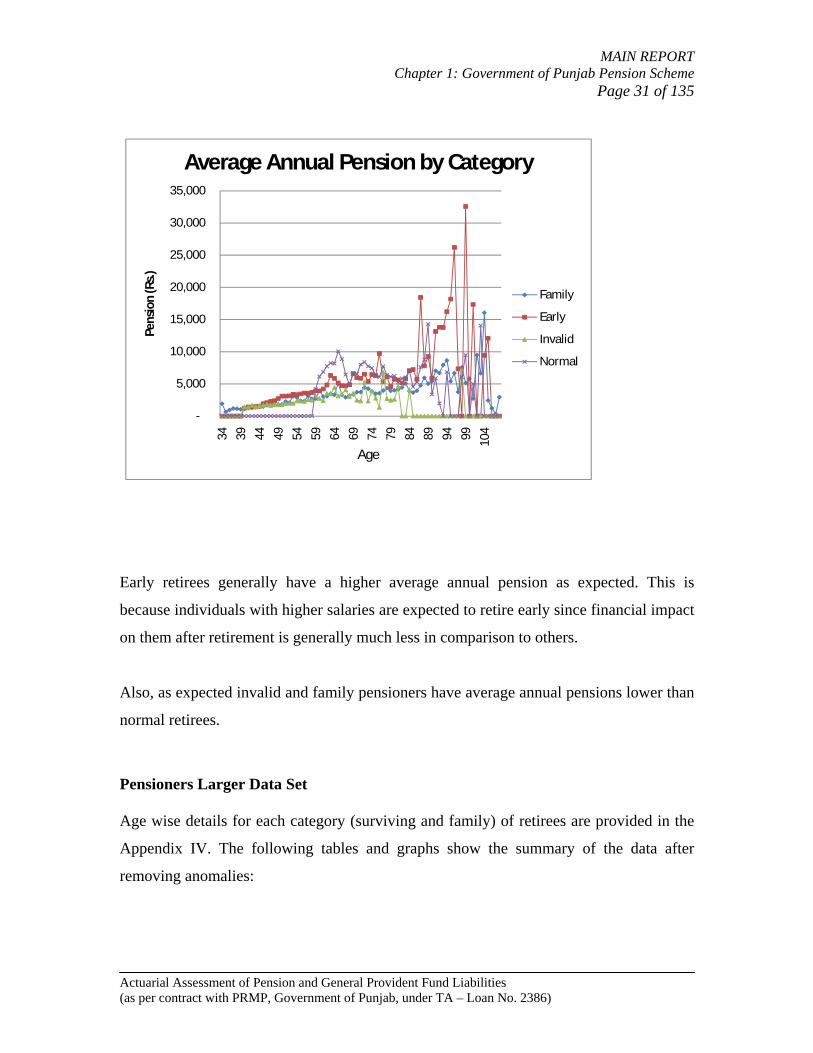
Age-wise comparisons of each category for distribution and average annual pension are
provided in the graphs below:
0%1%2%3%4%5%6%7%8%
34 38 42 46 50 54 58 62 66 70 74 78 82 86 90 94 98 102
106
Perc
enta
ge
Age wise distribution for each category of Pensioners
Family
Early
Invalid
Normal
Age
As expected, distribution of family pensioners has the longest tail because of two main
reasons. One, that family begins to receive pension after the employee has received
pension for several years. Secondly, because most of the workforce of Punjab
Government comprises of males and family pensioners are mostly females and females
have a longer life expectancy than males.
Invalid pensioners become eligible for invalid pension during service; their distribution is
concentrated more at lower ages in comparison to other categories and has the shortest
tail because of having low life expectancy. Nothing unusual can be observed from the
above graph.
MAIN REPORT Chapter 1: Government of Punjab Pension Scheme
Page 31 of 135
Actuarial Assessment of Pension and General Provident Fund Liabilities (as per contract with PRMP, Government of Punjab, under TA – Loan No. 2386)
-
5,000
10,000
15,000
20,000
25,000
30,000
35,000
34 39 44 49 54 59 64 69 74 79 84 89 94 99 104
Pens
ion
(Rs.)
Average Annual Pension by Category
Family
Early
Invalid
Normal
Age
Early retirees generally have a higher average annual pension as expected. This is
because individuals with higher salaries are expected to retire early since financial impact
on them after retirement is generally much less in comparison to others.
Also, as expected invalid and family pensioners have average annual pensions lower than
normal retirees.
Pensioners Larger Data Set Age wise details for each category (surviving and family) of retirees are provided in the
Appendix IV. The following tables and graphs show the summary of the data after
removing anomalies:

MAIN REPORT Chapter 1: Government of Punjab Pension Scheme
Page 32 of 135
Actuarial Assessment of Pension and General Provident Fund Liabilities (as per contract with PRMP, Government of Punjab, under TA – Loan No. 2386)
Type of Retiree
Average Age
Total annual pension (after indexation)
(Rs.) Surviving 66.7 638,076,418Family 66.9 66,491,869
66.5 66.6 66.6 66.7 66.7 66.8 66.8 66.9 66.9 67.0 67.0
Surviving Family
Age
Average Age for each Category
-
100,000,000
200,000,000
300,000,000
400,000,000
500,000,000
600,000,000
700,000,000
Surviving Family
Pens
ion
Amou
nt (R
s.)
Total Pension for each Category

MAIN REPORT Chapter 1: Government of Punjab Pension Scheme
Page 33 of 135
Actuarial Assessment of Pension and General Provident Fund Liabilities (as per contract with PRMP, Government of Punjab, under TA – Loan No. 2386)
Age-wise comparisons of surviving and family pensioner for distribution and average
annual pension are provided in the graphs below:
0%
1%
2%
3%
4%
5%
20 25 30 35 40 45 50 55 60 65 70 75 80 85 90 95 100
Perc
enta
ge
Age-Wise Distribution
Surviving
Family
Age
It can be seen from the graph above that family pensioners distribution is more tilted
towards the right hand side because of similar reasons explained for smaller pensioners
data. Nothing unusual can be observed from the distributions above.
-
2,000
4,000
6,000
8,000
10,000
12,000
20 26 32 38 44 50 56 62 68 74 80 86 92 98
Aver
age
Annu
al P
ensio
n
Average Annual Pension
Surviving
Family
Age

MAIN REPORT Chapter 1: Government of Punjab Pension Scheme
Page 34 of 135
Actuarial Assessment of Pension and General Provident Fund Liabilities (as per contract with PRMP, Government of Punjab, under TA – Loan No. 2386)
As explained earlier, family pensioners are expected to receive less pension on average
the trends that we observe in the graph above are not unexpected.
Comparison of Smaller and Larger Pensioners Data Since two sets of pensioner’s data were provided, a decision had to be made with regards
to which data set should be used. The following parameters were compared between the
two data sets:
Average annual pension after indexation by age for surviving and family pensioners
Age distribution of family and surviving pensioners
Various discrepancies were found in the comparison of two data sets. For instance the
difference in average monthly Pension in the two data sets can be gauged from the
following graph:
-2,000 4,000 6,000 8,000
10,000
34 40 46 52 58 64 70 76 82 88 94 100Ac
erag
e Pe
nsio
n (R
s.)
Comparison Between Small and Larger Data Sets
Smaller Data Set
Larger Data Set
Age

MAIN REPORT Chapter 1: Government of Punjab Pension Scheme
Page 35 of 135
Actuarial Assessment of Pension and General Provident Fund Liabilities (as per contract with PRMP, Government of Punjab, under TA – Loan No. 2386)
The pattern of average pension payout is as per expectation for the smaller data set.
However, it is difficult to justify the constant decline in average pension after age 65.
As such, the smaller data set was considered more credible and was used in the
valuation.
The larger pensioners’ data set requires further analysis and checking. Therefore, it was
considered more appropriate to use smaller pensioners’ data set for this valuation. The
larger pensioners’ data can be used with more refinement and confidence level in the next
actuarial valuation.
Although sufficient detailed data for pensioners was received, the information used for
active employees was only approx. 7% of the total. (after discarding erroneous data).
However, we have sufficient confidence in the results based on existing data as we
used aggregate information as a base, such as aggregate pension payout of Rs.
11.996 billion for the year 2007-08 and aggregate number of active employees of
831,186 (extracted from information of total sanctioned posts). The sample data was
merely used to construct different distributions.
1.3 Valuation & Cash-flow Projection Assumptions Actuarial Assumptions are an enterprise’s best estimates of the variables that will
determine the cost of providing post-employment benefits. Actuarial Assumptions
generally comprise of financial assumptions and demographic assumptions.
Financial assumptions about future economic variables have an effect on the real value of
money. The key components, for an actuarial valuation conducted to determine the
financial implication to fund a Pension scheme, are:
MAIN REPORT Chapter 1: Government of Punjab Pension Scheme
Page 36 of 135
Actuarial Assessment of Pension and General Provident Fund Liabilities (as per contract with PRMP, Government of Punjab, under TA – Loan No. 2386)
o Net Rate of Return on the Fund
o Expected Increase in Eligible Salary
o Expected Increase in Pension
o Expenses of Management of Pension Scheme/Fund
Demographic assumptions about future characteristics of current and former employees
(and their dependants) those are eligible for benefits. The key components of
demographic assumptions are:
o Mortality assumptions
o Employee turnover, disability and early retirement assumptions
For the purposes of the actuarial valuation of Punjab Government pension Scheme, the
following assumptions have been used:
i. Net Rate of Return on the Pension Fund
The assets of a Pension Fund are invested in secure instruments to ensure future
benefit payments when they fall due. The instruments, available for the
investment of employee benefit funds as at the valuation date, were generally
yielding 9% – 13% per annum.
Taking into account the volatility of economic environment prevailing as at June
30, 2009, it had been assumed that the average long term net rate of return on the
proposed Fund (inclusive of both the invested and the un-invested portions) will
be 12% per annum (compounded).
ii. Expected Increase in Eligible (Pensionable) Salary
An estimate of future salary increases takes account of inflation, seniority,
promotion and other relevant factors, such as supply and demand in the

MAIN REPORT Chapter 1: Government of Punjab Pension Scheme
Page 37 of 135
Actuarial Assessment of Pension and General Provident Fund Liabilities (as per contract with PRMP, Government of Punjab, under TA – Loan No. 2386)
employment market. It had been assumed that salaries would increase at 11% per
annum in future.
The net rate of return on the Fund and the rate of increase in the Eligible Salary
are usually inter-related since during periods of inflation, both tend to rise in
conformity with each other. From an actuarial costing point of view, it is the
difference between these two rates that matters, and not their individual values in
isolation.
Thus a difference of 1% between the long-term rate of return on the proposed
Fund assets (i.e. 12%) and the long-term rate of increase in Eligible Salary (i.e.
11%) had been considered appropriate. Such an assumption was within the
internationally and locally recognised norms.
iii. Pension Indexation
The indexation of pension has been assumed as the rate of 8% per annum. This
was based upon past history of indexation provided by the government from time
to time and future expectations based upon increased inflation expectation.
iv. Rate of Inflation
Future long-term Rate of Inflation has been assumed at 8% per annum.
v. Expenses of Management
It had been assumed that the expenses for management of Pension Scheme/Fund
would be borne by Punjab Government, and the valuation accordingly did not
make any provision for them.
vi. Expected Mortality Experience
It had been assumed that the mortality of the employees in active service and
pensioners will be according to LIC 96-98a Mortality Table.

MAIN REPORT Chapter 1: Government of Punjab Pension Scheme
Page 38 of 135
Actuarial Assessment of Pension and General Provident Fund Liabilities (as per contract with PRMP, Government of Punjab, under TA – Loan No. 2386)
vii. Expected rates of Withdrawal/Ill-health/Retirement
The Employee Turnover, Disability and Early Retirement Rates are based on the
experience of public-sector employee benefit schemes in Pakistan. (as given in
Appendix V of the Report). These rates were used in the valuation conducted in
year 2007.
For the current valuation, the Early Retirement Rates have been assumed as NIL,
while Employee Turnover and Disability have not been changed. The rationale
behind using NIL assumption is as follows:
a. The estimated pension and commutation outflows for the years 2007-08 and
2008-09, based on NIL assumption matches with the actual payouts for the
same period. The figures are overestimated if the NIL assumption is
withdrawn.
b. The Finance Department highlighted that there have been practically no early
retirements in the last couple of years.
c. Early Retirements in earlier years had been unusually higher on account of the
expectation that the Government would soon withdraw commutation benefit.
d. The current recessionary environment will force the number of Early
Retirements downwards.
However, if the economic conditions return to normalcy, the early retirements
may pick up again and the early retirement rates used in 2007 valuation would
become more valid. Therefore, two set of results have been provided for the
valuation of accrued liability, based on NIL early retirement rates and 2007 early
retirement rates.
viii. Nature of Group
Cash-flow projections have been conducted based upon an open group.
MAIN REPORT Chapter 1: Government of Punjab Pension Scheme
Page 39 of 135
Actuarial Assessment of Pension and General Provident Fund Liabilities (as per contract with PRMP, Government of Punjab, under TA – Loan No. 2386)
Total population of active employees has been assumed to increase by 1% every
year. This assumption is based on the factor that the human resource requirements
of Punjab Government would remain the same. Consequently the employee
strength of the Government would remain in the existing range or increase at a
nominal rate in future.
New entrants are assumed to enter the workforce uniformly every year, at ages 21
to 30.
Total number of new entrants are determined using the following formula:
“1%*( Total population of active employees at the beginning of the year) + (total
number of decrements)”
ix. Benefit Structure It has been assumed that the current benefit structure will not change for the
period for which the cash-flow projections have been made.
1.4 Actuarial Valuation Method The basic purpose of an Actuarial Valuation is to project the likely level of the emerging
liabilities under a Pension Scheme and to recommend a plan for contributions that will
enable the Pension Fund to accumulate sufficient assets for meeting these liabilities. The
solvency level of a Pension Fund is generally monitored on a regular basis, particularly if
the economic parameters controlling the financial health of the Fund change over time.
The liabilities of a Pension Scheme are long term, consequently the funds required to
meet these liabilities can be accumulated over a longer period. In assessing the adequacy
of the contribution rate, it is necessary to make projections to determine the levels of the
liabilities and the accumulating assets.

MAIN REPORT Chapter 1: Government of Punjab Pension Scheme
Page 40 of 135
Actuarial Assessment of Pension and General Provident Fund Liabilities (as per contract with PRMP, Government of Punjab, under TA – Loan No. 2386)
To assess the expected liabilities of the Pension Scheme of Punjab Government, the
Projected Unit Credit Method has been used.
Projected Unit Credit Method The Projected Unit Credit (PUC) method is considered as an appropriate actuarial
technique to determine the post-employment benefits (such as pension schemes) for large
(open) groups in which employees exist and enter on regular basis. PUC is a mandated
actuarial technique under International Public Sector Accounting Standard 25 (IPSAS
25). This method determines the liabilities by projecting service/salaries of the employees
and then discounting the relevant costs as at the valuation date. Past service cost is
calculated by associating the portion of total liability attributable to the service rendered
on a pro-rata basis. The regular annual cost (called normal cost) is the liability
attributable to one year determined on similar lines.
In a Pension Fund, the required contribution by the employer is dependent upon the age
and service profile of the employees. As the time of ultimate benefit payoff comes closer,
these factors increase in proportion to each other.
The funding of a Pension Scheme is divided into Past Service Cost and Future Service
Cost. The Past Service Cost can be met either by making one lump sum payment to the
Scheme or by amortising them over a certain specified period (a fixed number of years or
the future working lifetime of the employees). The Future Service Cost is met by way of
contributions, as a percentage of pay, to the Scheme. For new employees becoming
members of the Scheme, there is no Past Service Cost, and contribution rate is specified
such that it is adequate to finance the future benefits payable to such employees.

MAIN REPORT Chapter 1: Government of Punjab Pension Scheme
Page 41 of 135
Actuarial Assessment of Pension and General Provident Fund Liabilities (as per contract with PRMP, Government of Punjab, under TA – Loan No. 2386)
1.5 Methodology Used for Data Preparation This section explains the methodology used to prepare the data for calculation of the total
accrued pension liability and cash flow projections.
For active employees, at every integer age from 20 to 59 (inclusive) total annual salary
and average past service were required for the total population.
For pensioners, at every age, total annual pension amounts for each category were
required.
The data provided was a sample of the total population of active employees and
pensioners. To estimate the total cash flows and accrued liability of the Pension Fund,
this data was mapped on to the total population using the following assumptions and
methodology:
Active Employees Total number of sanctioned posts in the Punjab province as provided by the Government
of Punjab stands at 1,029,646. However, the exact number of employees actually hired
was not available with the Govt. of Punjab. For this purpose, the number of actual
employees were estimated from a similar piece of information provided to us for the
earlier exercise conducted in 2003 (see attached Appendix II). The ratio of actual
employees to sanctioned posts in 2003 was around 0.86:1 and the same ratio was applied
on the current sanctioned posts to estimate the actual number of employees as in 2009.
This estimate came out to be 885,496.
A further reduction was applied to account for the contract employees (who are not
eligible for pension benefits). Contract employees are assumed to form 6% of the total
active employees, this comes out to 54,609. The figure of 6% was derived from the
information provided by Finance Department for 2007 exercise.

MAIN REPORT Chapter 1: Government of Punjab Pension Scheme
Page 42 of 135
Actuarial Assessment of Pension and General Provident Fund Liabilities (as per contract with PRMP, Government of Punjab, under TA – Loan No. 2386)
The remaining estimate of 831,186 active employees, with their total annual salary of
Rs. 83,662,117,968 was used for the purpose of this Report.
Age-wise distribution of the sample was calculated and assuming that the sample is a true
representative of the total population, the same distribution was applied to the above
estimate of active population to attain the total number of employees at each age.
Similar exercise was repeated to estimate the past service and average annual salary at
each age.
Pensioners To estimate the pension liability and cash flow projections, the total annual pension
payout by age for each category was required. The pension amounts given in sample data
were those as calculated at the time of retirement of the pensioner or the death of the
employee, rather than the current pension payments (as per the indexation increases
announced by GoPb from time to time). An indexation table was used to calculate factors
to determine the pension amount being received by the pensioner as at 30.06.09. The
table was developed using the information from previous indexations announced by
GoPb and is provided in Appendix III of the Report.
After conversion of the pension amounts, the total pension payout for the sample came
out to be Rs.216,398,244. As stated earlier, total pension payout in the year 2007-08 was
provided as Rs.11.996 billion. Using this pension payout, total payout in the year 2008-
09 was estimated. The pension indexation announced by the Government for the year
2008-09 was 20%. This increase announced for 2009-10 is 20% for pensioners retiring
before 1999 and 15% retiring after 1999. The effective increase was about 18%-19%.
MAIN REPORT Chapter 1: Government of Punjab Pension Scheme
Page 43 of 135
Actuarial Assessment of Pension and General Provident Fund Liabilities (as per contract with PRMP, Government of Punjab, under TA – Loan No. 2386)
The ratio of the total pension payout in 2008-09 and the total of the sample data were
then calculated. This ratio was then multiplied with the total pension calculated for each
age after indexation to calculate the total pension payout for each age.

MAIN REPORT Chapter 1: Government of Punjab Pension Scheme
Page 44 of 135
Actuarial Assessment of Pension and General Provident Fund Liabilities (as per contract with PRMP, Government of Punjab, under TA – Loan No. 2386)
1.6 Valuation Results Results – Assuming NIL Early Retirements
The valuation results based on the methodology applied, NIL early retirement
assumption and other assumptions as stated earlier are as follows:
Valuation Result (Rs. billion) Accrued Liability on account of : a) Active Employees 391.7 b) Pensioners 206.0 Total Liability as at 30.06.2009 597.6 Required Contribution Rate, as %age of Eligible Salaries, to fund Future Accrual of Benefits
24.40%
The results reflect that the past service accrued Pension liability of in-service active
employees is Rs.391.7 billion and the present value of future Pension payments to
existing Pensioners works out to Rs.206.0 billion as at 30.06.2009. The total accrued
liability of Government of Punjab Pension Fund is Rs.597.6 billion as at June 30th 2009.
The rate of contribution required to fund only the future accrual of Pension benefits of
active employees is 24.4% of Pensionable Salary. This means that the Pension liability in
future (say next year) would increase with interest on the existing accrued liability of
Rs.597.6 billion and an amount equal to 24.4% of annual Pensionable Salary.

MAIN REPORT Chapter 1: Government of Punjab Pension Scheme
Page 45 of 135
Actuarial Assessment of Pension and General Provident Fund Liabilities (as per contract with PRMP, Government of Punjab, under TA – Loan No. 2386)
Results – Assuming Early Retirements based on Historical Pattern:
The valuation results based on the methodology explained, and rates for 2007 early
retirement assumption and other parameters as stated earlier are as follows:
Valuation Result (Rs. billion) Accrued Liability on account of : a) Active Employees 430.3 b) Pensioners 206.0 Total Liability as at 30.06.2009 636.3 Required Contribution Rate, as %age of Eligible Salaries, to fund Future Accrual of Benefits
27.10%
The above results reveal that early retirements have significant impact on the accrued
Pension liability of the in-service active employees. The accrued liability of active
employees, based on early retirement rates used in 2007 actuarial valuation, increases by
9.9% (from Rs.391.7 billion to Rs.430.3 billion). The rate required to fund only the future
accrual of Pension benefits increases from 24.4% to 27.1% of Pensionable Salary
reflecting an increase of 11.1%.
This above sensitivity analysis shows that the accrued and future Pension liability of
active employees of Punjab Government is significantly sensitive to early retirement
pattern of the employees. The reason is that employee can retire after completing 25
years of service and entitled an unreduced Pension payable immediately and can
commute up to a maximum of 35% of his/her Pension at a significantly higher
commutation rate as compared to normal retirement factor. Thus, it would be advisable to
monitor the pattern of early retirements in future and modify the valuation results
accordingly (if required).

MAIN REPORT Chapter 1: Government of Punjab Pension Scheme
Page 46 of 135
Actuarial Assessment of Pension and General Provident Fund Liabilities (as per contract with PRMP, Government of Punjab, under TA – Loan No. 2386)
1.7 Cash Flow Projections The expected pension payments split by regular pension and commutation over the next
30 years under Punjab Government Pension Scheme have been estimated on a combined
basis for both active employees in conjunction with existing pensioners.
The following table shows the cash-flow projections on a real and nominal basis
assuming NIL early retirements:
Total Expense on Nominal Basis on Real Basis
Year Expected Pension
Expected Commutation Expense Y to Y %
Increase Expense Y to Y % Increase
2009 - 10 16.4 4.8 21.2 13% 20.0 7%2010 - 11 18.2 5.2 23.4 10% 20.4 2%2011 - 12 20.3 6.3 26.6 14% 21.6 6%2012 - 13 22.7 7.4 30 13% 22.6 5%2013 - 14 25.7 9.6 35.3 18% 24.7 9%2014 - 15 28.7 9.9 38.5 9% 25.0 1%2015 - 16 32.9 13.6 46.6 21% 28.1 12%2016 - 17 36.9 13.9 50.8 9% 28.3 1%2017 - 18 42.1 17.3 59.4 17% 30.8 9%2018 - 19 47.7 19.5 67.2 13% 32.3 5%2019 - 20 54.4 23.1 77.5 15% 34.6 7%2020 - 21 62.2 27.2 89.4 15% 37.0 7%2021 - 22 70.9 30.6 101.5 14% 39.0 5%2022 - 23 81.5 37.2 118.7 17% 42.3 8%2023 - 24 92.2 38.6 130.8 10% 43.1 2%2024 - 25 106.2 48.1 154.3 18% 47.3 10%2025 - 26 121.8 55.4 177.2 15% 50.4 7%2026 - 27 137.9 58.1 196.1 11% 51.7 3%2027 - 28 156.2 63.4 219.5 12% 53.6 4%2028 - 29 177.4 72.2 249.5 14% 56.5 5%2029 - 30 196.8 67.1 263.8 6% 55.2 -2%

MAIN REPORT Chapter 1: Government of Punjab Pension Scheme
Page 47 of 135
Actuarial Assessment of Pension and General Provident Fund Liabilities (as per contract with PRMP, Government of Punjab, under TA – Loan No. 2386)
Year Expected Pension
Expected Commutation Expense Y to Y %
Increase Expense Y to Y % Increase
2030 - 31 216.3 61.6 277.9 5% 53.7 -3% 2031 - 32 238.6 64.5 303 9% 54.3 1% 2032 - 33 259.9 59.4 319.3 5% 52.9 -3% 2033 - 34 283.3 60.3 343.6 8% 52.7 0% 2034 - 35 307.3 59 366.3 7% 52 -1% 2035 - 36 331.9 57.3 389.3 6% 51.1 -2% 2036 - 37 358 57.9 415.9 7% 50.6 -1% 2037 - 38 385.6 60.2 445.8 7% 50.3 -1% 2038 - 39 415 63.7 478.7 7% 50 0% 2039 - 40 450.5 82.2 532.7 11% 51.8 3%
The expected nominal pension cash flows increase by around 14% over the next 20 years.
The following gives a graphical representation of cash flow projections over the next 30
years.

MAIN REPORT Chapter 1: Government of Punjab Pension Scheme
Page 48 of 135
Actuarial Assessment of Pension and General Provident Fund Liabilities (as per contract with PRMP, Government of Punjab, under TA – Loan No. 2386)
It can be seen that there are no visible jumps in the total expected cash-flows in any year
(under both nominal and real bases) and the amounts have a relatively smooth
progression over time.
The commutation payments over the next 30 years do have sudden changes on nominal
basis. For example in the year 2013-14 commutation increases by 31%, then there is a
decline in percentage increase to 3% in 2014-15 and then again there is an increase of
39% in 2015-16. Commutation payments are one time expense and this pattern in
percentage increases is mostly due to the distribution of the active employees determined
from the given data (resulting in varying patterns of retirements in different years).
It needs to be noted that while there is significant jump in pension outgoes over the years
on nominal basis, the increase on real basis is much slower, with pension amount
increasing by around 6% per annum for the next 17 years and remaining virtually static
thereafter.

MAIN REPORT Chapter 2: Government of Punjab General Provident Fund Scheme
Page 49 of 135
Actuarial Assessment of Pension and General Provident Fund Liabilities (as per contract with PRMP, Government of Punjab, under TA – Loan No. 2386)
CHAPTER 2 Government of Punjab General Provident Fund Scheme
2.1 Introduction General Provident (GP) Fund Scheme of Punjab Government is a defined contribution
scheme in which employees are the sole contributors to their account balances according
to the prescribed subscription rate which are based on pay scales of the employees. GoPb
deducts these contributions from salaries and utilizes the amounts in meeting its
expenditures. GoPb maintains a book entry for contribution by employees which is
credited with an interest rate announced by the Government on an annual basis. The
account balances are paid to employees at the time of cessation of their service. The
Government does not provide a benefit as such to the employees and the money paid to
the employees at the end of service is merely the payment of loan or debt based on the
announced interest rates for various years.
This chapter gives details on the accrued liability of Government of Punjab General
Provident Fund Scheme and the related expected future cash-outflows. Details of the
sources of data, data analysis and suggestive measures to remove anomalies are also part
of this chapter.
2.2 Data
2.2.1 Data Sources
Data / information for estimating the accrued GP Fund liability and future cash outflows
was provided by the Accountant General (AG) Office. The following are the details of
the data / information obtained:

MAIN REPORT Chapter 2: Government of Punjab General Provident Fund Scheme
Page 50 of 135
Actuarial Assessment of Pension and General Provident Fund Liabilities (as per contract with PRMP, Government of Punjab, under TA – Loan No. 2386)
Grade-wise Subscription Rates and Year-wise Interest Rates:
The information pertaining to grade-wise rate of subscription of GP Fund and year-wise
rate of interests for the period from 1953 to 2007 was provided by the Accountant
General (AG) Office. This information is summarised in the following tables:
Rates of subscription towards General Provident Fund effective from 1st
September, 2008 vide circular letter no. Fdsr.1-2-1/95 dated 23-08-2008
Scale Minimum Maximum Mean Rate of monthly
Subscription (Amount in Rs.)
Remarks
1 2 3 4 5 6 B-1 2970 5670 4320 130 Minimum rates of subscription B-2 3035 6035 4535 230 (on mean) will be as under:- B-3 3140 6740 4940 250 BPS Subscription B-4 3240 7440 5340 270 B-1 3.00% B-5 3340 8140 5740 290 B-2-11 5% B-6 3430 8680 6055 305 BS-12-22 8% B-7 3530 9230 6380 320 B-8 3665 9965 6815 340 B-9 3820 10720 7270 365 B-10 3955 11755 7855 395 B-11 4115 12365 8240 415 B-12 4355 13655 9005 720 B-13 4645 14845 9745 780 B-14 4920 16320 10620 850 B-15 5220 17820 11520 925 B-16 6060 20160 13110 1050 B-17 9850 24650 17250 1380 B-18 12910 31510 22210 1780 B-19 19680 39080 29380 2350 B-20 23345 44485 33915 2715 B-21 25880 49680 37780 3025 B-22 27680 55470 41575 3330

MAIN REPORT Chapter 2: Government of Punjab General Provident Fund Scheme
Page 51 of 135
Actuarial Assessment of Pension and General Provident Fund Liabilities (as per contract with PRMP, Government of Punjab, under TA – Loan No. 2386)
Year-wise Interest Rates announced by the Government on GP Fund Balances
Year Interest Rate %
Bonus % Year Interest Rate
% Bonus
% 1953-1954 4.00 Nil 1981-1982 13.00 Nil 1954-1955 4.00 Nil 1982-1983 13.20 Nil 1955-1956 4.00 Nil 1983-1984 14.00 Nil 1956-1957 4.00 Nil 1984-1985 14.60 Nil 1957-1958 4.00 Nil 1985-1986 14.72 Nil 1958-1959 4.00 Nil 1986-1987 14.66 30 1959-1960 4.00 Nil 1987-1988 14.00 30 1960-1961 4.00 Nil 1988-1989 14.84 30 1961-1962 4.00 Nil 1989-1990 15.93 30 1962-1963 4.00 Nil 1990-1991 15.93 30 1963-1964 4.00 Nil 1991-1992 15.93 30 1964-1965 5.00 Nil 1992-1993 15.93 30 1965-1966 5.25 Nil 1993-1994 15.54 30 1966-1967 6.00 Nil 1994-1995 15.44 30 1967-1968 6.00 Nil 1995-1996 15.49 30 1968-1969 6.25 Nil 1996-1997 16.76 30 1969-1970 6.25 Nil 1997-1998 17.51 30 1970-1971 6.25 Nil 1998-1999 17.53 30 1971-1972 6.50 Nil 1999-2000 16.11 30 1972-1973 7.25 Nil 2000-2001 15.00 Nil 1973-1974 8.25 Nil 2001-2002 15.00 Nil 1974-1975 10.25 Nil 2002-2003 14.50 Nil 1975-1976 10.50 Nil 2003-2004 13.50 Nil 1976-1977 10.75 Nil 2004-2005 12.00 Nil 1977-1978 11.75 Nil 2005-2006 10.50 Nil 1978-1979 12.00 Nil 2006-2007 11.00 Nil 1979-1980 12.50 Nil 2007-2008 12.50 Nil 1980-1981 13.00 Nil

MAIN REPORT Chapter 2: Government of Punjab General Provident Fund Scheme
Page 52 of 135
Actuarial Assessment of Pension and General Provident Fund Liabilities (as per contract with PRMP, Government of Punjab, under TA – Loan No. 2386)
Initially AG office provided “Balances” and “Advances” of GP Fund of the employees of
Lahore district (separately for Provincial and District Government employees):
GP Fund Balances (Lahore District)
The following table shows the total number of records for GP Fund Balances having
details of Net GPF Balances from SAP/R3 made available for Provincial and District
Government employees:
Number of EmployeesProvincial Government 85,075 District Government 25,658 Total 110,733
GP Fund Advances (Lahore District)
The following table shows the total number of records for GP Fund Advances against GP
Fund balances made available for Provincial and District Government employees:
Number of EmployeesProvincial Government 36,867 District Government 13,818 Total 50,685

MAIN REPORT Chapter 2: Government of Punjab General Provident Fund Scheme
Page 53 of 135
Actuarial Assessment of Pension and General Provident Fund Liabilities (as per contract with PRMP, Government of Punjab, under TA – Loan No. 2386)
GP Fund Balances and Advances (Other Districts):
Subsequently, the following additional employee information was received from AG
office for 8 districts:
Personal #
BPS
Opening GPF balance
Monthly Subscription
Adjustment in Advances
Advances
Advances Recovered
Permanent Advances
Closing GPF balances
However, there was no information of date of birth, date of appointment and Salary etc.
2.2.2 Data Analysis
The data received was analysed to check for any anomalies. Details of analysis and
anomalies found in each data source are as follows:
GP Fund Balances (Lahore District):
Information of 3,988 employees was discarded from GP Fund Balance records because of
the following reasons:
Discarded due to Number of Records Duplicate Records 3,987 No name and Nil Balance 1 Total: 3,988
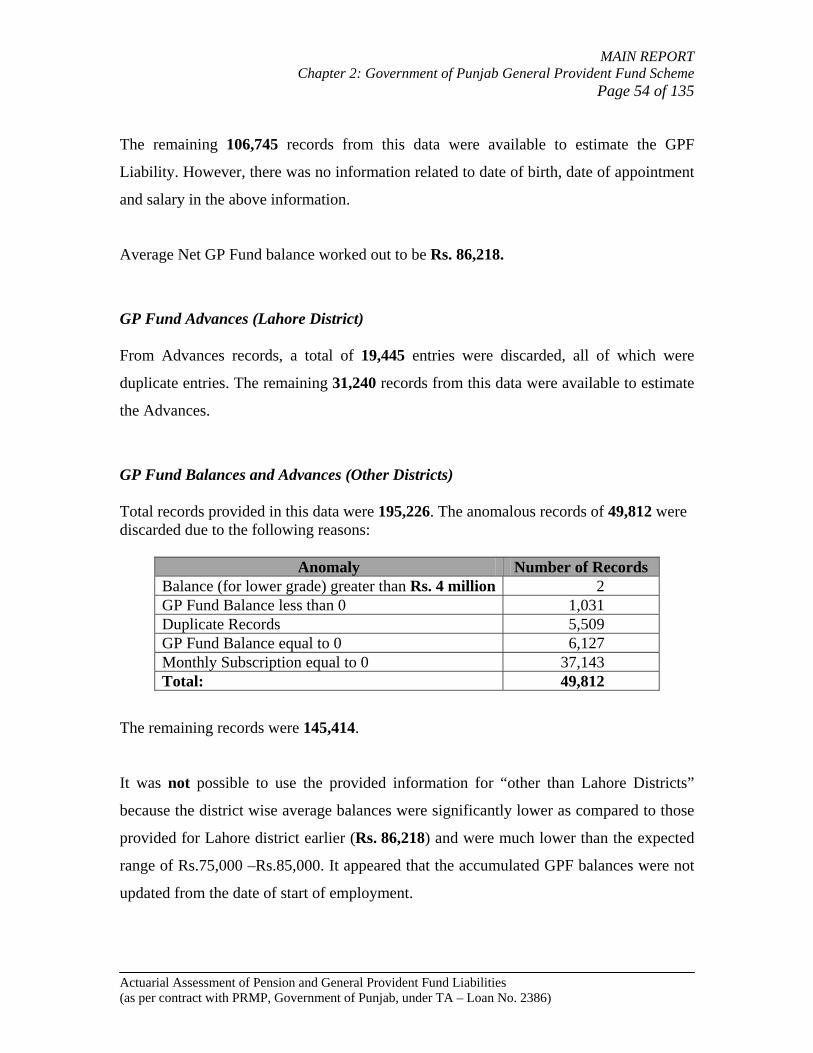
MAIN REPORT Chapter 2: Government of Punjab General Provident Fund Scheme
Page 54 of 135
Actuarial Assessment of Pension and General Provident Fund Liabilities (as per contract with PRMP, Government of Punjab, under TA – Loan No. 2386)
The remaining 106,745 records from this data were available to estimate the GPF
Liability. However, there was no information related to date of birth, date of appointment
and salary in the above information.
Average Net GP Fund balance worked out to be Rs. 86,218.
GP Fund Advances (Lahore District) From Advances records, a total of 19,445 entries were discarded, all of which were
duplicate entries. The remaining 31,240 records from this data were available to estimate
the Advances.
GP Fund Balances and Advances (Other Districts) Total records provided in this data were 195,226. The anomalous records of 49,812 were discarded due to the following reasons:
Anomaly Number of Records Balance (for lower grade) greater than Rs. 4 million 2 GP Fund Balance less than 0 1,031 Duplicate Records 5,509 GP Fund Balance equal to 0 6,127 Monthly Subscription equal to 0 37,143 Total: 49,812
The remaining records were 145,414.
It was not possible to use the provided information for “other than Lahore Districts”
because the district wise average balances were significantly lower as compared to those
provided for Lahore district earlier (Rs. 86,218) and were much lower than the expected
range of Rs.75,000 –Rs.85,000. It appeared that the accumulated GPF balances were not
updated from the date of start of employment.
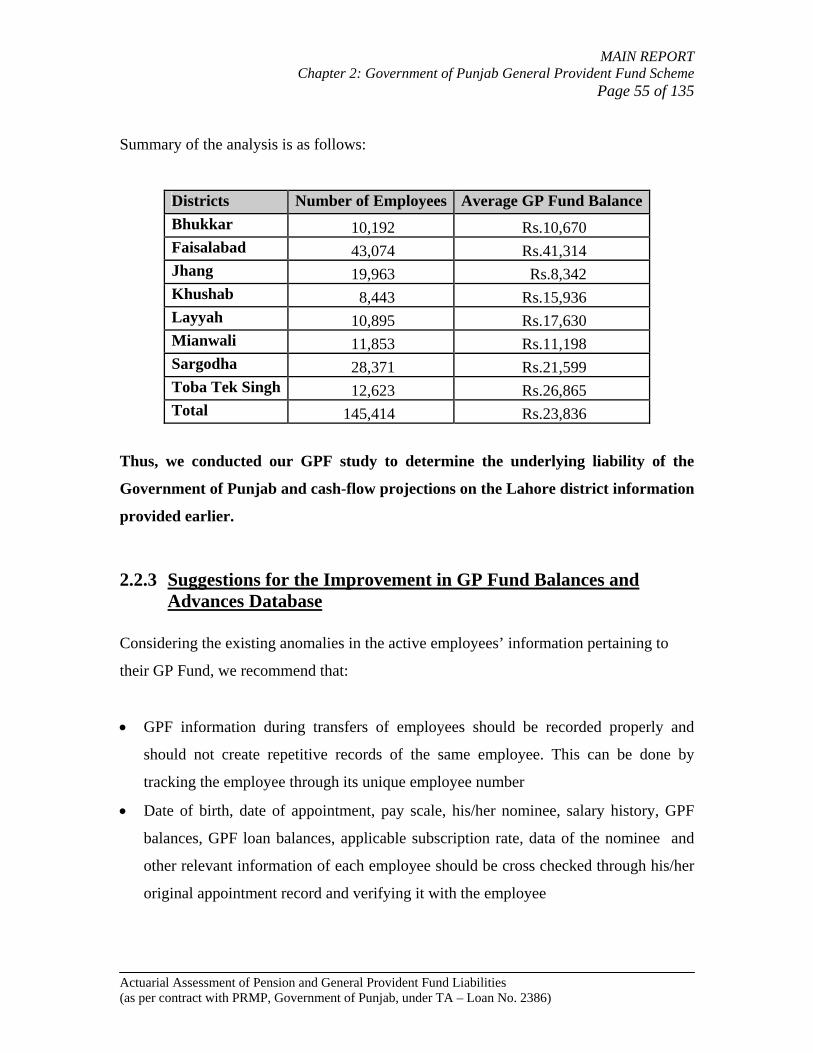
MAIN REPORT Chapter 2: Government of Punjab General Provident Fund Scheme
Page 55 of 135
Actuarial Assessment of Pension and General Provident Fund Liabilities (as per contract with PRMP, Government of Punjab, under TA – Loan No. 2386)
Summary of the analysis is as follows:
Districts Number of Employees Average GP Fund Balance Bhukkar 10,192 Rs.10,670 Faisalabad 43,074 Rs.41,314 Jhang 19,963 Rs.8,342 Khushab 8,443 Rs.15,936 Layyah 10,895 Rs.17,630 Mianwali 11,853 Rs.11,198 Sargodha 28,371 Rs.21,599 Toba Tek Singh 12,623 Rs.26,865 Total 145,414 Rs.23,836
Thus, we conducted our GPF study to determine the underlying liability of the
Government of Punjab and cash-flow projections on the Lahore district information
provided earlier.
2.2.3 Suggestions for the Improvement in GP Fund Balances and Advances Database
Considering the existing anomalies in the active employees’ information pertaining to
their GP Fund, we recommend that:
• GPF information during transfers of employees should be recorded properly and
should not create repetitive records of the same employee. This can be done by
tracking the employee through its unique employee number
• Date of birth, date of appointment, pay scale, his/her nominee, salary history, GPF
balances, GPF loan balances, applicable subscription rate, data of the nominee and
other relevant information of each employee should be cross checked through his/her
original appointment record and verifying it with the employee

MAIN REPORT Chapter 2: Government of Punjab General Provident Fund Scheme
Page 56 of 135
Actuarial Assessment of Pension and General Provident Fund Liabilities (as per contract with PRMP, Government of Punjab, under TA – Loan No. 2386)
• Dummy entries should be avoided because they may cause significant problems at the
time of settlement of GP Fund benefits
• A proper and efficient networking/communication system is required among various
districts of Punjab Government to maintain GP Fund information of employees
It is strongly recommended that various data checks should be applied on the database
after feeding in the information related to the GP Fund of employees. For instance:
• Age of an employee should not be greater than 60 years
• Age of an employee should not be less than 18 years
• Date of Birth should be earlier than Date of Appointment
• Salary of an employee should not be less than the minimum salary for his/her relevant
Pay Scale
• GPF subscription rate of employee should be consistent with Pay Scale
• GPF balance should be consistent with Pay Scale of the employee
• GPF balance should be consistent with service of the employee
• GPF balance or loan amounts should not be significantly high

MAIN REPORT Chapter 2: Government of Punjab General Provident Fund Scheme
Page 57 of 135
Actuarial Assessment of Pension and General Provident Fund Liabilities (as per contract with PRMP, Government of Punjab, under TA – Loan No. 2386)
2.3 Valuation Methodology & Assumptions Methodology used for Data Preparation
For purposes of estimating the Net GPF Liability, the ratio of Net GPF Balance to Basic
Salary of each employee was required. Since the information for Basic Salary was not
available in the GPF data, the following methodology was adopted to prepare the data.
The Net GPF Balance information was matched with the 59,769 records of active
employees (obtained for pension liability calculations). 2,223 records in the active
employee data did not match with the GPF records and were therefore discarded. Thus,
the remaining 57,546 records were available to calculate Net GPF Balance to Basic
Salary ratio.
The liability was estimated using the following assumptions:
the average pay for each past service band in the sample of 57,546 will remain the
same for the total population of active employees 817,624.
the population will have the same percentage of loans from their GP Fund
Balance as that of the sample.
The average GP Fund balances of 57,546 employees were enhanced such that their
average balance works out to Rs. 86,218 (i.e. the average for the total 106,745 employee
records).
For purpose of estimating the Advances, the ratio of Advances to Basic Salary of each
employee was required. On similar lines as above, the Advances information was
matched with the 59,769 records of active employees (obtained for pension calculations).
The advances were estimated assuming that the population will have the same ratio of
Advances to Basic Salary as that of the sample.

MAIN REPORT Chapter 2: Government of Punjab General Provident Fund Scheme
Page 58 of 135
Actuarial Assessment of Pension and General Provident Fund Liabilities (as per contract with PRMP, Government of Punjab, under TA – Loan No. 2386)
Since the 2 primary factors impacting the GP Fund Balance are the Basic Salary and Past
Service, service-wise distribution of 57,546 employees with respect to their Basic Pay
and total GPF Balance was prepared. The ratio of total Net GPF Balance and total Basic
Salary was then determined for each service band of the distribution.
Similarly, the 2 primary factors impacting Advances are the Basic Salary and Past
Service. As such, service-wise distribution of 57,546 employees with respect to their
Basic Pay and total Advances was prepared. The ratio of Advances to Basic Salary was
then determined for each service band of the distribution.
The resulting distribution and ratios are provided in the tables below:

MAIN REPORT Chapter 2: Government of Punjab General Provident Fund Scheme
Page 59 of 135
Actuarial Assessment of Pension and General Provident Fund Liabilities (as per contract with PRMP, Government of Punjab, under TA – Loan No. 2386)
Sample Data Distribution
Years of Service
Number of Employees
Total Basic Salary
GPF/Basic Salary Ratio
Years of Service
Number of Employees
Total Basic
Salary
GPF/Basic Salary Ratio
> 0 & <= 1 125 488,695 0.39 > 23 & <= 24 1,527 18,225,445 13.97
> 1 & <= 2 2,382 8,971,885 0.51 > 24 & <= 25 1,304 15,586,815 14.07
> 2 & <= 3 4,916 22,474,350 1.44 > 25 & <= 26 1,069 12,592,330 13.84
> 3 & <= 4 2,522 10,275,820 2.23 > 26 & <= 27 766 9,971,770 14.55
> 4 & <= 5 2,364 10,305,150 3.41 > 27 & <= 28 798 9,904,780 16.60
> 5 & <= 6 2,782 17,418,137 11.02 > 28 & <= 29 762 9,987,620 17.19
> 6 & <= 7 961 4,618,210 4.01 > 29 & <= 30 470 6,650,450 19.10
> 7 & <= 8 1,119 5,940,925 4.24 > 30 & <= 31 463 6,911,200 16.67
> 8 & <= 9 1,289 7,399,725 6.00 > 31 & <= 32 351 5,527,010 19.85
> 9 & <= 10 2,238 13,144,335 7.34 > 32 & <= 33 573 8,813,955 22.12
> 10 & <= 11 595 4,350,125 7.76 > 33 & <= 34 457 7,866,708 23.78
> 11 & <= 12 3,068 22,232,190 8.90 > 34 & <= 35 323 5,366,500 25.98
> 12 & <= 13 1,183 10,161,715 8.10 > 35 & <= 36 195 3,394,640 24.22
> 13 & <= 14 2,282 16,159,158 9.25 > 36 & <= 37 158 2,858,640 23.26
> 14 & <= 15 633 6,356,028 11.69 > 37 & <= 38 96 1,730,335 20.42
> 15 & <= 16 5,038 36,139,635 9.88 > 38 & <= 39 32 418,055 27.26
> 16 & <= 17 750 6,532,215 9.63 > 39 & <= 40 34 490,460 20.00
> 17 & <= 18 916 9,084,230 12.15 > 40 & <= 41 33 516,255 23.94
> 18 & <= 19 5,203 42,776,819 11.17 > 41 & <= 42 1 12,170 84.24
> 19 & <= 20 1,791 19,718,055 11.86 > 42 & <= 43 - - 0.00
> 20 & <= 21 1,534 17,153,780 12.29 > 43 & <= 44 1 7,980 67.37
> 21 & <= 22 2,903 32,007,470 14.24 > 44 & <= 45 - - 0.00
> 22 & <= 23 1,539 17,104,425 13.73 TOTAL: 57,546 467,646,195

MAIN REPORT Chapter 2: Government of Punjab General Provident Fund Scheme
Page 60 of 135
Actuarial Assessment of Pension and General Provident Fund Liabilities (as per contract with PRMP, Government of Punjab, under TA – Loan No. 2386)
Future Interest Rate on GP Fund Balances
For determining the future cash-flow projections related to GP Fund of Punjab
Government employees, it has been assumed that average interest rate credited by the
Government to GP Fund balances would be 12% per annum.
Growth Rate of Monthly GP Fund Subscription
Rate of Increase in Monthly GP Fund Subscription, for future cash-flow projections, has
been assumed at the rate of 8% per annum.
Other Economic and Demographic Assumptions
For GP Fund cash-flow projections, all other economic and demographic assumptions
such as rate of increase of future salaries, mortality and withdrawals rates etc. are same as
used for Pension liability valuation and described in the previous Chapter.

MAIN REPORT Chapter 2: Government of Punjab General Provident Fund Scheme
Page 61 of 135
Actuarial Assessment of Pension and General Provident Fund Liabilities (as per contract with PRMP, Government of Punjab, under TA – Loan No. 2386)
2.4 Valuation Results
The following table shows the resulting Net GP Fund liability after applying the
methodology explained earlier and the assumptions used:
Sample Data Distribution Total Population Years of Service
Number of Employees
Total Basic Salary
GPF/Basic Salary Ratio Total Basic Pay Total Net GPF Liability
> 0 & <= 1 125 488,695 0.39 7,199,422 2,826,298 > 1 & <= 2 2,382 8,971,885 0.51 132,173,202 67,299,035 > 2 & <= 3 4,916 22,474,350 1.44 331,090,602 477,444,876 > 3 & <= 4 2,522 10,275,820 2.23 151,382,684 338,170,915 > 4 & <= 5 2,364 10,305,150 3.41 151,814,772 516,958,221 > 5 & <= 6 2,782 17,418,137 11.02 256,602,815 2,828,869,130 > 6 & <= 7 961 4,618,210 4.01 68,035,157 272,577,944 > 7 & <= 8 1,119 5,940,925 4.24 87,521,305 370,770,552 > 8 & <= 9 1,289 7,399,725 6.00 109,012,248 654,117,623 > 9 & <= 10 2,238 13,144,335 7.34 193,641,453 1,420,500,619
> 10 & <= 11 595 4,350,125 7.76 64,085,747 497,102,844 > 11 & <= 12 3,068 22,232,190 8.90 327,523,117 2,916,563,542 > 12 & <= 13 1,183 10,161,715 8.10 149,701,698 1,213,264,283 > 13 & <= 14 2,282 16,159,158 9.25 238,055,614 2,201,338,584 > 14 & <= 15 633 6,356,028 11.69 93,636,574 1,094,285,535 > 15 & <= 16 5,038 36,139,635 9.88 532,406,656 5,262,466,703 > 16 & <= 17 750 6,532,215 9.63 96,232,149 926,435,017 > 17 & <= 18 916 9,084,230 12.15 133,828,261 1,626,533,526 > 18 & <= 19 5,203 42,776,819 11.17 630,185,201 7,037,418,838 > 19 & <= 20 1,791 19,718,055 11.86 290,485,051 3,443,879,922 > 20 & <= 21 1,534 17,153,780 12.29 252,708,326 3,105,894,884 > 21 & <= 22 2,903 32,007,470 14.24 471,531,880 6,716,605,065 > 22 & <= 23 1,539 17,104,425 13.73 251,981,231 3,460,501,991 > 23 & <= 24 1,527 18,225,445 13.97 268,496,021 3,750,034,327
> 24 & <= 25 1,304 15,586,815 14.07 229,623,903 3,229,797,030 > 25 & <= 26 1,069 12,592,330 13.84 185,509,353 2,568,186,945 > 26 & <= 27 766 9,971,770 14.55 146,903,440 2,137,093,304 > 27 & <= 28 798 9,904,780 16.60 145,916,548 2,422,572,491 > 28 & <= 29 762 9,987,620 17.19 147,136,942 2,529,693,916 > 29 & <= 30 470 6,650,450 19.10 97,973,979 1,871,083,395 > 30 & <= 31 463 6,911,200 16.67 101,815,331 1,696,818,870 > 31 & <= 32 351 5,527,010 19.85 81,423,537 1,616,388,934 > 32 & <= 33 573 8,813,955 22.12 129,846,588 2,872,561,170 > 33 & <= 34 457 7,866,708 23.78 115,891,810 2,756,456,638

MAIN REPORT Chapter 2: Government of Punjab General Provident Fund Scheme
Page 62 of 135
Actuarial Assessment of Pension and General Provident Fund Liabilities (as per contract with PRMP, Government of Punjab, under TA – Loan No. 2386)
Sample Data Distribution Total Population Years of Service
Number of Employees
Total Basic Salary
GPF/Basic Salary Ratio Total Basic Pay Total Net GPF Liability
> 34 & <= 35 323 5,366,500 25.98 79,058,914 2,054,038,710 > 35 & <= 36 195 3,394,640 24.22 50,009,607 1,211,073,996 > 36 & <= 37 158 2,858,640 23.26 42,113,291 979,664,715 > 37 & <= 38 96 1,730,335 20.42 25,491,180 520,412,394 > 38 & <= 39 32 418,055 27.26 6,158,758 167,882,393 > 39 & <= 40 34 490,460 20.00 7,225,424 144,479,493 > 40 & <= 41 33 516,255 23.94 7,605,433 182,104,148 > 41 & <= 42 1 12,170 84.24 179,288 15,103,119 > 42 & <= 43 - - 0.00 - - > 43 & <= 44 1 7,980 67.37 117,561 7,920,065 > 44 & <= 45 - - 0.00 - - TOTAL: 57,546 467,646,195 6,889,332,073 79,185,192,000
The estimate of total Net GP Fund Liability as at June 30, 2009 is Rs.79.185 billion.
The growth in GP Fund balances (i.e. liability), assuming future interest credited is 12%
per annum, for the next 30 years at 5 year intervals on nominal and real basis (assuming
2008-09 as the base year) is given the following table:
Year Estimated GPF
Liability at fiscal year End (Nominal Basis)
Estimated GPF Liability at fiscal year
End (Real Basis)
2009 – 10 89.8 77.8 2013 – 14 148.6 96.4 2018 – 19 260.3 117.4 2023 – 24 408.6 128.0 2028 – 29 571.8 124.6 2033 – 34 873.1 131.8 2037 – 38 1305.8 146.3 2039 – 40 1597.5 154.1

MAIN REPORT Chapter 2: Government of Punjab General Provident Fund Scheme
Page 63 of 135
Actuarial Assessment of Pension and General Provident Fund Liabilities (as per contract with PRMP, Government of Punjab, under TA – Loan No. 2386)
The above table shows that the amount of GP Fund liability on nominal basis would
increase from Rs. 89.8 billion in 2009-10 to Rs. 1,597.5 billion in 2039-40. The liability
is estimated to increase to 154.1 billion in real terms in 2039-40.
An important fact to note is that the government is expected to consume
approximately Rs. 5.0 billion of employees’ money in 2009-10, which is projected to
escalate over time.
The growth in GPF balances on nominal and real bases can be gauged from the following
graphs:

MAIN REPORT Chapter 2: Government of Punjab General Provident Fund Scheme
Page 64 of 135
Actuarial Assessment of Pension and General Provident Fund Liabilities (as per contract with PRMP, Government of Punjab, under TA – Loan No. 2386)
Although, GP Fund liability tends to increase constantly on a nominal basis, but on a real
basis it tends to stabilize and then slightly decline during the years 2023-24 to 2029-30.
Keeping in view the estimated GP Fund liability on the Punjab Government and its rapid
growth in future (liability of Rs. 1,597.5 billion in 2039-40), it is strongly recommended
that the Government devise a proper strategy to fund this debt. The ideal methodology is
to contribute all future subscriptions regularly to the recently set up GP Fund and devise
an amortization schedule to fund past service GP Fund liability.

MAIN REPORT Chapter 2: Government of Punjab General Provident Fund Scheme
Page 65 of 135
Actuarial Assessment of Pension and General Provident Fund Liabilities (as per contract with PRMP, Government of Punjab, under TA – Loan No. 2386)
2.5 Cash Flow Projections
The following table shows the cash flow projections of the GP Fund over the next 30
years on a nominal and real basis:
Total Expense on Nominal Basis on Real Basis
Year Expense Y to Y % Increase Expense
Y to Y % Increase
2009 - 10 4.2 14% 3.9 15% 2010 - 11 4.1 -2% 3.7 -5% 2011 - 12 4.9 20% 4.0 8% 2012 - 13 5.6 14% 4.3 8% 2013 - 14 6.8 21% 4.7 9% 2014 - 15 7.4 9% 4.9 4% 2015 - 16 9.5 28% 5.7 16% 2016 - 17 10.2 7% 5.7 0% 2017 - 18 12.7 25% 6.5 14% 2018 - 19 14.6 15% 6.8 5% 2019 - 20 17.5 20% 7.7 13% 2020 - 21 21.2 21% 8.6 12% 2021 - 22 24.2 14% 9.0 5% 2022 - 23 29.0 20% 10.1 12% 2023 - 24 32.0 10% 10.3 2% 2024 - 25 38.7 21% 11.6 13% 2025 - 26 44.6 15% 12.3 6% 2026 - 27 47.7 7% 12.2 -1% 2027 - 28 52.6 10% 12.5 2% 2028 - 29 58.1 10% 12.8 2% 2029 - 30 56.1 -3% 11.6 -9% 2030 - 31 53.6 -4% 10.3 -11% 2031 - 32 57.3 7% 10.2 -1% 2032 - 33 56.6 -1% 9.3 -9% 2033 - 34 59.3 5% 9.2 -1% 2034 - 35 62.0 5% 8.9 -3% 2035 - 36 64.3 4% 8.6 -3% 2036 - 37 67.6 5% 8.3 -3% 2037 - 38 73.1 8% 8.4 1% 2038 - 39 78.7 8% 8.6 2% 2039 - 40 87.9 12% 9.7 13%

MAIN REPORT Chapter 2: Government of Punjab General Provident Fund Scheme
Page 66 of 135
Actuarial Assessment of Pension and General Provident Fund Liabilities (as per contract with PRMP, Government of Punjab, under TA – Loan No. 2386)
The following gives a graphical representation of cash flow projections over the next 32
years.
The above graphs show increase in GP Fund payments over the presented period of 32
years. There is a visibly rapid increase in GP Fund payments on nominal basis after
which the payments have sudden dip in years 2029-30. Overall, even on real basis, the
increase in GP Fund cash outflows is more significant than the increase in pension
outgoes.

MAIN REPORT Chapter 3: Funding Options
Page 67 of 135
Actuarial Assessment of Pension and General Provident Fund Liabilities (as per contract with PRMP, Government of Punjab, under TA – Loan No. 2386)
CHAPTER 3 Funding Options
3.1 Introduction The main objective of this chapter is to examine different funding options for the Govt. of
Punjab Pension Fund and General Provident (GP) Fund. Keeping in view the accrued
liabilities of the two Funds and expected future cash-outflows for these benefit schemes,
it discusses various related issues and suggests options to fund them.
On March 7, 2007, Government of Punjab setup a Pension Fund under the Punjab
Pension Fund Act, 2007 (after approval from the Provincial Legislature). Funding of the
Pension Fund is to be made through budgetary allocations. As at 30.06.09, the assets of
the Pension Fund amount to Rs. 3 billion. In addition, the Government has recently
approved the legislation to set up a General Provident (GP) Fund. The funding options
discussed are made on the assumption that the Pension Fund will have Rs. 12 billion by
the end of fiscal year 2009-10.
The amount of GP Fund payment of an employee is the accumulated contributions with
interest deducted from his/her salaries during the service. GP Fund is in the process of
being established and the required legislation has been enacted.
Punjab Government is contemplating various possibilities of capital injections into the
Funds. It is, however, extremely important to determine adequacy of capital injections
versus objectives to be achieved by these contributions. Government can then decide
whether it needs to make a change in proposed capital contribution amount and/or
objectives of funding.
This chapter of the Report is divided into the following sections, each discussing various
issues as highlighted above:

MAIN REPORT Chapter 3: Funding Options
Page 68 of 135
Actuarial Assessment of Pension and General Provident Fund Liabilities (as per contract with PRMP, Government of Punjab, under TA – Loan No. 2386)
i. Assumptions
ii. Different Options for Funding of Pension and GP Fund Liabilities
iii. Optimal Funding Strategy for Pension Benefits and GP Fund
iv. The attached appendices VIII and IX will be used as supportive documents.
3.2 Assumptions
i. Punjab Government Revenue: Punjab Government Revenue for the year 2008-2009 is assumed to be Rs.315
billion.
ii. Growth Rate of Punjab Government Revenue:
Punjab Government Revenue is assumed to grow at 10% per annum.
iii. Revenue Surplus:
The amount of Revenue Surpluses, provided by Finance Department (FD) for the
years 2009-10 and 2010-11 is provided in the table below:
Year Revenue Surplus
(Rs. billion) 2009-10 154 2010-11 162

MAIN REPORT Chapter 3: Funding Options
Page 69 of 135
Actuarial Assessment of Pension and General Provident Fund Liabilities (as per contract with PRMP, Government of Punjab, under TA – Loan No. 2386)
iv. Growth Rate of Revenue Surplus: It has been assumed, as per the input from Finance Department that Revenue
Surplus will increase at the rate of 10% per annum from 2011-12 onwards.
v. Growth Rate of Monthly GP Fund Subscription:
Rate of Increase in Monthly GP Fund Subscription of 8% per annum has been
assumed.
vi. Return on Investments: Capital Injections/ contributions in the Fund are assumed to draw a return of 12%
per annum.
vii. Comparison of nominal versus real assumptions
Assumption Nominal Real (in excess of inflation)
Pension Indexation Rate 8% 0% Salary Increase Rate 11% 3% Growth Rate of Punjab Government Revenue
10% 2%
Growth Rate of Revenue Surplus
10% 2%
Growth Rate of Monthly GP Fund Subscription
8% 0%
Return on Investments 12% 4%

MAIN REPORT Chapter 3: Funding Options
Page 70 of 135
Actuarial Assessment of Pension and General Provident Fund Liabilities (as per contract with PRMP, Government of Punjab, under TA – Loan No. 2386)
3.3 Different Options for Funding of Pension and GP Fund Liabilities This section provides some of the more viable funding options that may be considered to
fund the GP Fund and Pension liabilities. These and other funding options that were
considered are provided in detail in Appendices VIII and X.
Punjab Government is contemplating various possibilities of capital injections into the
Fund. It is, however, extremely important to determine adequacy of capital injections
versus objectives to be achieved by these contributions. Government can then decide
whether it needs to make a change in proposed capital contribution amount and/or
objectives of funding.
The most appropriate Funding approach in case of a GP Fund can be that Government
should start making contributions deducted from the salaries of the employees to the
General Provident Fund on regular basis and amortize the existing accrued liability over a
period of 10, 20 and 30 years. For example if Government starts making contributions
(deducted from employees) to GP Fund from 2010-11 and amortize the accumulated GP
Fund liability of Rs.89.8 billion projected at 30.06.2010, the annual instalment for
liability (apart from regular contribution) for different durations would be as follows:
Amortization Period Annual Instalment payable at the middle of the Year
10 Years 15.0 billion 20 Years 11.4 billion 30 Years 10.5 billion
A suggested funding option for GP Fund is as follows:
• annual GP Fund contributions deducted from the salaries of the employees are
contributed to the GP Fund; and
• expected past service GP Fund liability of Rs.89.8 million is amortized over 30
years with increasing instalments;

MAIN REPORT Chapter 3: Funding Options
Page 71 of 135
Actuarial Assessment of Pension and General Provident Fund Liabilities (as per contract with PRMP, Government of Punjab, under TA – Loan No. 2386)
The GP Fund contributions for next 30 years would be as follows:
Rs. Billion
Year
Past Liability Amortization
Instalment
Annual Regular Contribution deducted
from Salaries
Total Amount of Contribution to
GP Fund 2010 - 11 2.0 5.6 7.6 2011 - 12 2.0 6.2 8.2 2012 - 13 3.0 6.8 9.8 2013 - 14 3.0 7.5 10.5 2014 - 15 4.0 8.3 12.3 2015 - 16 5.1 9.2 14.3 2020 - 21 11.6 14.8 26.4 2025 - 26 20.7 22.8 43.5 2030 - 31 33.3 33.6 66.9 2035 - 36 50.8 51.5 102.0 2039 - 40 69.6 74.6 144.0
The year-wise GP Fund contributions, if past service liability is amortized over 30 years,
20 years and 10 years are given in Example A, Example B and Example C of Appendix
VIII respectively.
In case of past liability amortization, the Government can start with lower amount and
increase it over time.
For Pension Fund, it is very important to define the short and long term objectives before
deciding on a funding strategy as a multitude of routes can be taken.
Examples of some of the objectives for Pension Fund are as follows:
i. Pension Fund is accumulated at a relatively low rate in the first few years (say 5-
10 years) and then earnings from the Fund are used to make payments in excess
of expectations (if any) to make pension payments a smooth percentage of the
revenue of Government of Punjab. For instance, if the pension payments during a
fiscal year are in excess of 6% of Revenue due to relatively high retirement of the
employees, the additional payments may partially or fully funded by the Pension

MAIN REPORT Chapter 3: Funding Options
Page 72 of 135
Actuarial Assessment of Pension and General Provident Fund Liabilities (as per contract with PRMP, Government of Punjab, under TA – Loan No. 2386)
Fund assets. Alternatively, if the Government revenue is reasonably short of
target, or expenses are required in some other priority area, the interest earnings
on the Fund can meet partial pension expenditure to create fiscal space.
ii. Earnings from the Fund are used to make payments in excess of 6% of the
revenue of Government of Punjab each year for a period of 10 years.
iii. Earnings from the Fund are used to make 30% of payments of the total pension
expense; the remaining 70% are met by the Government of Punjab each year for a
period of 10 years.
iv. Earnings from the Fund are used to make payments 50% of the payments in
excess of Rs.16 billion each year for a period of 10 years.
v. Earnings from the Fund are used to make payments in excess of 10% or 20% of
Revenue Surplus each year for a period of 10 years.
However, it is important that any funding strategy for the Pension Fund should be
finalized keeping in view the current and projected relatively low share of future public
resources committed to pension expenditure (i.e. the IPD) as compared to other countries.
Implicit Pension Debt (IPD) is the value of pension commitment of the Government for
future pension payouts and therefore has some characteristics in common with
conventional public-sector debt. The accrued pension liability is the commonly accepted
value used to represent the IPD.
The ratio between IPD and current GDP is an important indicator of the share of future
public resources committed to pension expenditure. The larger the ratio, the higher the
risk that if GDP growth is not adequate to cover future pension liabilities, certain changes
in fiscal or benefit changes will be required.

MAIN REPORT Chapter 3: Funding Options
Page 73 of 135
Actuarial Assessment of Pension and General Provident Fund Liabilities (as per contract with PRMP, Government of Punjab, under TA – Loan No. 2386)
The IPD ratio for Government of Punjab pension scheme is estimated to be in range
between 11-12%. The following table summarizes the IPD ratios for some comparable
economies from across the world. These economies have Pay As You Go (PAYG) (i.e.
unfunded) civil service and national pension schemes.
Year Civil Service National Schemes for
Private Sector Employees)
Brazil 1998 92% 284% Iran 2001 38% 64% Korea 1995 7% 33% Philippines 1997 17% 90% Turkey 1997 75% 71%
Central Civil Employees
State Civil Employees
India (2004) 13% 43%
It should be noted that accrued pension liability and therefore the IPD ratios are sensitive
to economic and demographic assumptions used.
The above comparison shows that the IPD ratio for Government of Punjab employees’
pension scheme is not excessive when compared with other countries.
Besides comparing the IPD ratio with other countries, it may be useful to work out the
growth of Pension payment expense as % of annual Revenue over the next 30 years if it
grows at the assumed rate of 10% per annum or varies by 2% in either direction. The
results at quinquennial years are as follows:

MAIN REPORT Chapter 3: Funding Options
Page 74 of 135
Actuarial Assessment of Pension and General Provident Fund Liabilities (as per contract with PRMP, Government of Punjab, under TA – Loan No. 2386)
Pension Expense as %age of Annual Revenue
Year Revenue
Growth @ 8%
Revenue Growth @
10%
Revenue Growth @
12% 2010 - 11 6% 6% 6% 2015 - 16 8% 8% 7% 2020 - 21 11% 9% 8% 2025 - 26 15% 11% 8% 2030 - 31 16% 11% 8% 2035 - 36 15% 9% 6% 2039 - 40 15% 9% 5%
Year-wise split is provided in Appendix VII.
The following is the graphical representation of pension expenditure as a percentage of
projected revenue with different growth rates.
Pension Expense as % of Projected Revenue
0%
2%
4%
6%
8%
10%
12%
14%
16%
18%
2010
- 11
2012
- 13
2014
- 15
2016
- 17
2018
- 19
2020
- 21
2022
- 23
2024
- 25
2026
- 27
2028
- 29
2030
- 31
2032
- 33
2034
- 35
2036
- 37
2038
- 39
RevenueGrowth @ 8%
RevenueGrowth @ 10%
RevenueGrowth @ 12%

MAIN REPORT Chapter 3: Funding Options
Page 75 of 135
Actuarial Assessment of Pension and General Provident Fund Liabilities (as per contract with PRMP, Government of Punjab, under TA – Loan No. 2386)
The above figures show that Pension expense remains within 8% of Revenue if it (i.e.
Revenue) grows at the rate of 12% per annum. It goes up to 12% and 16% of Revenue if
it grows at 10% and 8% per annum respectively.
In view of existing factors such as:
• revenue crunch,
• priority for spending in other areas,
• relatively low Implicit Pension Debt of Punjab Government, and
• higher priority to fund GP Fund liability,
it would be advisable to build the Pension Fund gradually in the first few (5-10) years and
treat it as a buffer in case of:
• any unexpected pension outgoes,
• Government revenue shortfall,
• or to fulfil the need of spending in other areas (i.e. funds as per the objective
given in (i) above).
The Government can revisit the objective and consequently come up with some specific
long term funding strategy after the initial few years.
Two such examples are given below:
Example 1:
o annual contribution of Rs.5 billion is made to the Pension Fund say from the year
2010-11 to 2014-15 (i.e. the next 5 years); and
o after accumulation period, 5% of Basic Salaries is contributed annually to the
Fund;

MAIN REPORT Chapter 3: Funding Options
Page 76 of 135
Actuarial Assessment of Pension and General Provident Fund Liabilities (as per contract with PRMP, Government of Punjab, under TA – Loan No. 2386)
The table below summarizes the buffer available in each year (Fiscal Space B), provided
that the fund is not used to finance the pension expense in previous years (assuming
Pension Fund assets of Rs.12 billion on June 30, 2010.
Year Pension Expense
Contribution to the Fund
Fiscal Space (A)
Fiscal Space (B)
2010 - 11 23.4 5.0 1.4 1.4 2011 - 12 26.6 5.0 2.2 3.6 2012 - 13 30.0 5.0 3.1 6.7 2013 - 14 35.3 5.0 4.0 10.7 2014 - 15 38.5 5.0 5.1 15.8 2015 - 16 46.6 6.9 6.3 22.1 2016 - 17 50.8 7.5 7.9 30.0 2017 - 18 59.4 8.2 9.8 39.8 2018 - 19 67.2 8.9 11.9 51.7 2019 - 20 77.5 9.7 14.4 66.1 2020 - 21 89.4 10.5 17.3 83.4
Fiscal Space (A): if income from fund is used to finance pension expense each year. Fiscal Space (B): accumulated income from capital injections in any one year, assuming Fiscal Space (A) is not consumed in earlier years.
As can be seen, the Fund creates buffer of Rs. 15.8 billion by year 5 and Rs. 51.7 billion
by year 8, which can be utilized to meet pension outgoes in one or a number of years.
Option C in Appendix IX (which details various funding options outlined in earlier
communication) gives a specific example of using the buffer (Fiscal Space B) in 6th year
and interest earning from the fund are used to finance the pension expense thereon.
Example 2:
o annual contribution of Rs.2 billion each during 2010-11 & 2011-12, Rs.3 billion
each during 2012-13 & 2013-14, Rs. 4 billion during 2014-15 is made to the
Pension Fund (i.e. the next 5 years); and
o after accumulation period, 5% of Basic Salaries is contributed annually to the
Fund;

MAIN REPORT Chapter 3: Funding Options
Page 77 of 135
Actuarial Assessment of Pension and General Provident Fund Liabilities (as per contract with PRMP, Government of Punjab, under TA – Loan No. 2386)
The table below summarizes the buffer available in each year (Fiscal Space B), provided
that the fund is not used to finance the pension expense in previous years (assuming
Pension Fund assets of Rs. 12 billion as June 30, 2010).
Year Pension Expense
Contribution to the Fund
Fiscal Space (A)
Fiscal Space (B)
2010 - 11 23.4 2.0 1.4 1.4 2011 - 12 26.6 2.0 1.9 3.3 2012 - 13 30.0 3.0 2.3 5.6 2013 - 14 35.3 3.0 3.0 8.6 2014 - 15 38.5 4.0 3.7 12.3 2015 - 16 46.6 6.9 4.6 16.9 2016 - 17 50.8 7.5 6.0 22.9 2017 - 18 59.4 8.2 7.6 30.5 2018 - 19 67.2 8.9 9.5 40.0 2019 - 20 77.5 9.7 11.7 51.7 2020 - 21 89.4 10.5 14.2 65.9
Fiscal Space (A): if income from fund is used to finance pension expense each year. Fiscal Space (B): accumulated income from capital injections in any one year, assuming Fiscal Space (A) is not consumed in earlier years.
In view of the lower contributions, this approach creates lesser fiscal space. As can be
seen, the Fund creates buffer of Rs. 12.3 billion by year 5 and Rs. 40.0 billion by year 8,
which can be utilized to meet pension outgoes in one or a number of years.
Option D in Appendix IX of the document gives a specific example of using the buffer
(Fiscal Space B) in 6th year and interest earning from the fund are used to finance the
pension expense thereon.

MAIN REPORT Chapter 3: Funding Options
Page 78 of 135
Actuarial Assessment of Pension and General Provident Fund Liabilities (as per contract with PRMP, Government of Punjab, under TA – Loan No. 2386)
3.4 Optimal Funding Strategy for Pension Benefits and GP Fund Keeping in view:
• any expected and unexpected jumps in pension benefit payouts due to various
economic (such as inflation) and demographic factors (such as early retirements
resulting high cash outgoes due to commutation),
• relatively low share of future public resources committed to pension expenditure,
i.e. the IPD, and relatively lower growth on real basis,
• the estimated GP Fund liability of Rs.89.8 billion as at 30th June 2010, all of
which constitutes of contributions fully made by employees and interest thereon,
and
• current revenue constraints of the Government and high priorities for other areas
such development projects, law and order etc.
It may be prudent to start funding of both employee benefit schemes at the same time
with higher priority attached to GP Fund with relatively low contributions for financing
accrued GP Fund liability and meeting pension expenses in the first few years.
A couple of suggested funding options are provided in Appendix IX as Option C and D.
This strategy will help Government of Punjab building-up:
a. reasonable Pension Fund assets during next 5-10 years so that it can graduate pension
benefit payments from the fiscal budget by smoothing its percentage portion of
revenue by paying any expected and unexpected jumps in pension payouts through
the Pension Fund earnings, and/or creating fiscal space to meet partial pension outgo,
if needed,
b. GP Fund for future benefit accrual and funding past liability

MAIN REPORT Chapter 3: Funding Options
Page 79 of 135
Actuarial Assessment of Pension and General Provident Fund Liabilities (as per contract with PRMP, Government of Punjab, under TA – Loan No. 2386)
Thus, it may be advisable that in 2010-11, the funding of Rs.9.6 billion be split by
apportioning Rs.7.6 billion towards GP Fund and remaining Rs.2.0 billion to Pension
Fund and thereafter the allocation to Pension Fund is increased gradually.
It is considered by Finance Department of GoPb that Option D provides the optimal
funding approach.
The following table illustrates the total contributions in each GP and Pension Fund for the
next 30 years using a combination of GPF funding and Option D for Pension Fund as
described above.
Year
Annual Regular Contribution
deducted from Salaries
Past GP Fund Liability
Amortization Instalment
Total Amount of Pension Fund Contribution (Option D)
Total Contribution
2010 - 11 5.6 2.0 2.0 9.6 2011 - 12 6.2 3.0 3.0 12.2 2012 - 13 6.8 3.0 3.0 12.8 2013 - 14 7.5 4.0 4.0 15.5 2014 - 15 8.3 5.0 5.7 19.0 2015 - 16 9.2 6.1 6.3 21.6 2016 - 17 10.1 7.3 6.9 24.3 2017 - 18 11.1 8.5 7.5 27.1 2018 - 19 12.3 9.7 8.2 30.2 2023 - 24 19.3 16.8 12.3 48.4 2028 - 29 28.8 25.5 18.2 72.5 2039 - 40 74.6 69.6 58.2 202.4
This funding approach should be reviewed in future for a longer time horizon.

MAIN REPORT Chapter 4:IPSAS25 for Punjab Government Pension
and General Provident Fund Schemes Page 80 of 135
Actuarial Assessment of Pension and General Provident Fund Liabilities (as per contract with PRMP, Government of Punjab, under TA – Loan No. 2386)
CHAPTER 4 International Public Sector Accounting Standard 25
for Punjab Government Pension & General Provident Fund Schemes
4.1 Objective The International Public Sector Accounting Standard 25 (IPSAS 25) prescribes the
accounting and disclosures by public sector entities for employee benefits.
The Standard requires an entity to recognize:
a liability, when an employee has provided service in exchange for employee
benefits to be paid in the future; and
an expense, when the entity consumes the economic benefits or service potential
arising from service provided by an employee in exchange for employee benefits.
This chapter presents accounting and disclosures for Punjab Government Pension and
General Provident Fund Schemes required as per the Standard.
4.2 Scope
International Public Sector Accounting Standards are applicable on all entities preparing
and presenting financial statements under the accrual basis of accounting. These entities
are therefore necessarily required to comply with IPSAS 25 for all employee benefits
(both short term and long term), except share based transactions.
Punjab Government Pension Scheme
The Punjab Government Pension Scheme is a defined benefit scheme since the pension
benefits are formula based. The final pension benefit is calculated on the last drawn
salary and service rendered by the employee. The benefit under this scheme thus falls

MAIN REPORT Chapter 4:IPSAS25 for Punjab Government Pension
and General Provident Fund Schemes Page 81 of 135
Actuarial Assessment of Pension and General Provident Fund Liabilities (as per contract with PRMP, Government of Punjab, under TA – Loan No. 2386)
under the “post-employment benefits – defined benefit plans” definition/provision given
in the Standard.
The reporting and disclosures of the scheme have been prepared as per the relevant
paragraphs and provisions of IPSAS 25.
General Provident Fund (GPF) Scheme
The Punjab Government Provident Fund (GPF) Scheme is a contributory scheme where
the employees are the sole contributors towards their GPF notional accounts. The
contributions are deducted by the Government from employees’ salaries, using
subscription rates which are dependant on the pay scales of employees. The GPF notional
accounts thus created are credited with interest income based on interest rates announced
by the Government on an annual basis. The account balances are paid to employees at the
time of cessation of their service. The monies collected through employee contributions
are utilized to meet other provincial expenditures rather than being added to a separate
Fund.
For the GPF Scheme, the Punjab Government does not provide a benefit to the
employees either by contributing towards the notional accounts or at the time of final
settlement of benefit. As such, the money paid to the employees at the end of service is
merely the payment of loan or debt based on the announced interest rates for various
years.
As per the:
o definitions given in paragraph 10 of the Standard, Employee Benefits are all
forms of consideration given by an entity in exchange for service rendered by
employees;
o introduction note IN1 of the Standard, benefits that are not consideration in
exchange for service rendered by employees or past employees of reporting
entities are not within the scope of this Standard; and

MAIN REPORT Chapter 4:IPSAS25 for Punjab Government Pension
and General Provident Fund Schemes Page 82 of 135
Actuarial Assessment of Pension and General Provident Fund Liabilities (as per contract with PRMP, Government of Punjab, under TA – Loan No. 2386)
o paragraph 28 of the Standard, for a post retirement benefit plan to be classified
as a defined contribution plan, the entity must pay fixed contributions into a
separate entity.
Keeping in view the above paragraphs of IPSAS-25 and the nature of the Punjab
Government General Provident Fund Scheme explained above, it is interpreted that
reporting of this scheme does not fall under this Standard.
Moreover, for a defined contribution plan, employer contribution is considered as
expense for the period (paragraph 57. of the Standard). In case of GPF, there is no
expense of Government of Punjab and consequently, there will be no liability as per the
Standard.
In view of the above restrictions given in the Standard, this chapter provides the best
possible disclosures for the year 2008-09 that can be reflected by Government of Punjab
in respect of GPF Scheme, if it is considered as a defined benefit plan (i.e. not a defined
contribution plan).

MAIN REPORT Chapter 4:IPSAS25 for Punjab Government Pension
and General Provident Fund Schemes Page 83 of 135
Actuarial Assessment of Pension and General Provident Fund Liabilities (as per contract with PRMP, Government of Punjab, under TA – Loan No. 2386)
4.3 Definitions, Assumptions & Methodology
Based on the provisions of IPSAS 25, definitions of various terms used in this chapter,
assumptions derived and valuation methodology adopted are as follows:
4.3.1 Definitions
Present Value of Defined Benefit Obligation
The present value of a defined benefit obligation is the present value, without deducting
any plan assets, of expected future payments required to settle the obligation resulting
from employee service in the current and prior periods.
Current Service Cost
Current service cost is the increase in present value of defined benefit obligation resulting
from employee service in the current period.
Defined Benefit Plans
Defined benefit plans are post-employment benefit plans other than defined contribution
plans.
Defined Contribution Plans
Defined contribution plans are post-employment benefit plans under which an entity pays
fixed contributions into a separate entity (a fund) and will have no legal or constructive
obligation to pay further contributions if the fund does not hold sufficient assets to pay all
employee benefits relating to employee service in the current and prior periods.

MAIN REPORT Chapter 4:IPSAS25 for Punjab Government Pension
and General Provident Fund Schemes Page 84 of 135
Actuarial Assessment of Pension and General Provident Fund Liabilities (as per contract with PRMP, Government of Punjab, under TA – Loan No. 2386)
Employee Benefits
Employee benefits are all forms of consideration given by an entity in exchange for
service rendered by employees.
Interest Cost
Interest cost is the increase during a period in the present value of a defined benefit
obligation which arises because the benefits are one period closer to settlement.
Plan Assets Plan assets comprise:
o Assets held by a long-term employee benefit fund; and
o Qualifying insurance policies.
Return on Plan Assets
The return on plan assets is interest, dividends and other revenue derived from the plan
assets, together with realized and unrealized gains or losses on the plan assets, less any
costs of administering the plan and less any tax payable by the plan itself.
Post-employment Benefits
Post-employment benefits are employee benefits (other than termination benefits) which
are payable after the completion of employment.
Post-employment Benefit Plan
Post-employment benefit plans are formal or informal arrangements under which an
entity provides post-employment benefits for one or more employees.

MAIN REPORT Chapter 4:IPSAS25 for Punjab Government Pension
and General Provident Fund Schemes Page 85 of 135
Actuarial Assessment of Pension and General Provident Fund Liabilities (as per contract with PRMP, Government of Punjab, under TA – Loan No. 2386)
Vested/Non-Vested Past Service Cost
Past service cost is the increase in the present value of defined benefit obligation for
employee service in prior periods, resulting in the current period from the introduction of,
or changes to, post-employment benefits or other long-term employee benefits. Past
service cost may be either positive or negative.
Vested employee benefits are employee benefits that are not conditional on future
employment.
Paragraph 113 states that
“Past service cost arises when an entity introduces a defined benefit plan or changes the
benefits payable under an existing defined benefit plan. Such changes are in return for
employee service over the period until the benefits concerned are vested. Therefore, past
service cost is recognized over that period, regardless of the fact that the cost refers to
employee service in previous periods.”
Paragraph 112 states that
“In measuring its defined benefit liability, an entity shall recognize past service cost as an
expense on a straight-line basis over the average period until the benefits become vested.
To the extent that the benefits are already vested immediately following the introduction
of, or changes to, a defined benefit plan, an entity shall recognize past service cost
immediately.”
Under the Punjab Government Pension Scheme, benefits become vested after
completing 25 years of service. The liability of pensioners is a vested liability.

MAIN REPORT Chapter 4:IPSAS25 for Punjab Government Pension
and General Provident Fund Schemes Page 86 of 135
Actuarial Assessment of Pension and General Provident Fund Liabilities (as per contract with PRMP, Government of Punjab, under TA – Loan No. 2386)
However, the employees are not required to render more service at any point of time to
become entitled to GPF benefit. Therefore, there is no service requirement for vesting
of GPF benefit and consequently all GPF liability is vested.
Non-vested Past Service Cost (paragraphs 112-117) as at the date of first time of adoption
has been determined assuming that the pension benefit has been introduced as at
01.07.2008 and amortized over the remaining period to vesting calculated as at
01.07.2008.
The average remaining years to vesting of employees with less than 25 years of service
works out to 16 years for the Government of Punjab. Thus, the non-vested benefit
obligation calculated as at adoption of IPSAS-25 (i.e. 01.07.2008) is spread equally over
a period of 16 years.
4.3.2 Assumptions Assumptions used for Punjab Government Pension Scheme
o Discount Rate According to paragraph 91 of the Standard, discount rate shall reflect the time
value of money. The currency and term of the financial instrument selected to
reflect the time value of money shall be consistent with the currency and
estimated term of the post-employment benefit obligations.
The discount rate is determined by reference to market yields (at the balance sheet
date) on long-term government bonds. The term of the assumed yield of such
bonds is approximately consistent with the estimated term of the post-
employment benefit obligations. The rate on 20-years PIB’s have been taken as
benchmark and consequently the discount rate assumption is 12%.

MAIN REPORT Chapter 4:IPSAS25 for Punjab Government Pension
and General Provident Fund Schemes Page 87 of 135
Actuarial Assessment of Pension and General Provident Fund Liabilities (as per contract with PRMP, Government of Punjab, under TA – Loan No. 2386)
o Rate of Increase in Pensionable Salary According to paragraphs 96-97, an estimate of future salary increases should take
account of inflation, seniority, promotion and other relevant factors, such as
supply and demand in the employment market. It had been assumed that
pensionable salaries would increase at 11% per annum in future.
It may be stated that the assumption regarding the discount rate and the rate of
increase in pensionable pay are intimately connected. During periods of inflation,
both tend to rise in conformity with each other. From an actuarial costing point of
view, it is the difference between these two rates (i.e. discount rate and
pensionable pay increase) that matters, and not their individual values in isolation.
Thus a difference of 1% between the discount rate (i.e. 12%) and the rate of
increase in Pensionable Salary (i.e. 11%) has been considered appropriate. This
1% difference is within the locally and internationally recognised norms.
o Pension Indexation
The indexation of pension has been assumed as the rate of 8% per annum. This
was based upon past history of indexation provided by the government from time
to time and future expectations based upon increased inflation expectation.
o Expected Mortality Experience
It had been assumed that the mortality of active employees and pensioners will be
according to LIC 96-98a Mortality Table. (Mortality Table is given in Appendix-
V of the Report).
o Expected rates of Withdrawal/Ill-health/Retirement
The Employee Turnover, Disability rates used in the valuation were based on the
experience of public-sector employee benefit schemes in Pakistan in conjunction
with the pensioners’ information provided (The table showing these rates is given
in Appendix-V of the Report).

MAIN REPORT Chapter 4:IPSAS25 for Punjab Government Pension
and General Provident Fund Schemes Page 88 of 135
Actuarial Assessment of Pension and General Provident Fund Liabilities (as per contract with PRMP, Government of Punjab, under TA – Loan No. 2386)
It has been assumed that there will be no early retirements. This assumption has
been based upon the recent experience of Punjab Government employees with
regards to early retirements. Reasons have been explained in detail in the earlier
section of the report under “Assumptions” section of “Pension Scheme” chapter.
o Fair Value of Plan Assets
Fair Value of Plan Assets has been determined according to paragraphs 118-120
of the Standard.
Paragraph 118 states:
“The fair value of any plan assets is deducted in determining the amount
recognized in the statement of financial position under paragraph 65. When no
market price is available, the fair value of plan assets is estimated; for example,
by discounting expected future cash flows using a discount rate that reflects both
the risk associated with the plan assets and the maturity or expected disposal date
of those assets (or, if they have no maturity, the expected period until the
settlement of the related obligation).”
Paragraph 119 states:
“Plan assets exclude unpaid contributions due from the reporting entity to the
fund, as well as any non-transferable financial instruments issued by the entity
and held by the fund. Plan assets are reduced by any liabilities of the fund that do
not relate to employee benefits, for example, trade and other payables and
liabilities resulting from derivative financial instruments.”
All assets of the Pension Fund are currently invested in Bank of Punjab Deposit
Scheme. Its Fair Value has been taken as the amount of investment i.e. Rs.3.0
billion.

MAIN REPORT Chapter 4:IPSAS25 for Punjab Government Pension
and General Provident Fund Schemes Page 89 of 135
Actuarial Assessment of Pension and General Provident Fund Liabilities (as per contract with PRMP, Government of Punjab, under TA – Loan No. 2386)
o Expected Return on Plan Assets
Paragraph 126 states that:
“The expected return on plan assets is based on market expectations, at the
beginning of the period, for returns over the entire life of the related obligation.
The expected return on plan assets reflects changes in the fair value of plan assets
held during the period as a result of actual contributions paid into the fund and
actual benefits paid out of the fund.”
Keeping in view the market expectations of the existing and available
instruments for the investment of Punjab Government Pension Fund assets
as at the beginning of the reporting period (i.e. July 1st 2008), it has been
assumed that the expected return on plan assets would be 12% per annum
(which is same as discount rate).
o First Time Adoption of the Standard
It has been assumed that the year of first time adoption of this Standard would be
2008-09. Therefore, the date of first time adoption has been considered as
01.07.2008 (i.e. beginning of the fiscal year). The accounting and disclosures for
the year 2008-09 have been prepared as per the requirements/provisions of the
Standard. The Standard exempts a number of required disclosures in the first year
of adoption of the standard (these disclosures are generally comparisons related to
past years).
o Actuarial Gains and Losses Actuarial gains & losses can occur on account of:
• Actual experience being different than assumed; and/or
• Effects of changes in actuarial assumptions.

MAIN REPORT Chapter 4:IPSAS25 for Punjab Government Pension
and General Provident Fund Schemes Page 90 of 135
Actuarial Assessment of Pension and General Provident Fund Liabilities (as per contract with PRMP, Government of Punjab, under TA – Loan No. 2386)
The standard prescribes a minimum basis to recognize a portion of this gain or
loss into the annual cost. The minimum amount is determined by calculating the
greater of 10% of present value of defined benefit obligation OR 10% of fair
value of plan assets & dividing it by future working lifetime of employees.
However, an entity can opt for a faster recognition if it so desires. In this case, the
recognition policy has to be applied consistently from period to period.
Since the Standard is being adopted for the first time in 2008-09, the
credit/charge for gains or losses will apply from the year 2009-10 onwards.
For Punjab Government Pension Scheme, the minimum recognition
approach (as specified by the Standard) will be adopted.
o Average Remaining Working Lifetime of Active Employees
The average remaining working lifetime of all employees (i.e. vested & non-
vested) is determined as follows:
• The expected remaining lifetime of each employee (in the sample) is
determined after taking into account his/her possibility of leaving service due
to retirement, death or invalid retirement.
• The average of remaining working lifetime of all employees is then
determined to calculate the average remaining working lifetime of the group
of employees.
The average remaining working lifetime of employees of Government of Punjab
works out to 17 years as at 30.06.2009

MAIN REPORT Chapter 4:IPSAS25 for Punjab Government Pension
and General Provident Fund Schemes Page 91 of 135
Actuarial Assessment of Pension and General Provident Fund Liabilities (as per contract with PRMP, Government of Punjab, under TA – Loan No. 2386)
Assumptions used for Punjab Government General Provident Fund Scheme
o Interest Cost Interest cost on the accumulated GPF account balances as at July 1st 2008 for the
year 2008-09 has been assumed at the rate of 12%.
o First Time Adoption of the Standard
It has been assumed that the year of first time adoption of this Standard would be
2008-09. Therefore, the date of first time adoption has been considered as
01.07.2008 (i.e. beginning of the fiscal year). The accounting and disclosures for
the year 2008-09 have been prepared accordingly.
o Actuarial Gains and Losses
Owing to the nature of the GPF Scheme, no actuarial gains and losses arise for
this employee benefit scheme.
4.3.3 Methodology
Actuarial Valuation Method used for Pension Scheme
Projected Unit Credit (PUC) Actuarial Cost Method was used for calculating the Present
Value of Defined Benefit Obligation and Current Service Cost for the Pension Scheme.
This method is mandated under IPSAS-25 under paragraph 77 of the Standard which
states:
“An entity shall use the Projected Unit Credit Method to determine the present value of
its defined benefit obligations and the related current service cost and, where applicable,
past service cost.”

MAIN REPORT Chapter 4:IPSAS25 for Punjab Government Pension
and General Provident Fund Schemes Page 92 of 135
Actuarial Assessment of Pension and General Provident Fund Liabilities (as per contract with PRMP, Government of Punjab, under TA – Loan No. 2386)
4.4 Reporting of Punjab Government Pension Scheme as per IPSAS 25
4.4.1 First Time Adoption of IPSAS 25 for Punjab Government Pension Scheme under Paragraph 166.
Initial Liability as at 1st July 2008 under Paragraph 166. Rupees in ‘000 Present Value of Defined Benefit Obligations as at 1st July 2008 515,406,161 Less Fair Value of Plan Assets (3,000,000) Less any Past Service Cost to be recognised in later periods (156,834,521) Initial Liability as at 1st July 2008 355,571,640 Liability recognised as at 01.07.2008 under the entity’s previous
accounting policy Nil
Increase in Liability due to first time adoption of IPSAS 25 355,571,640** Paragraph 167 states: If the initial liability determined in accordance with paragraph 166 is more or less than the liability that would have been recognized at the same date under the entity’s previous accounting policy, the entity shall recognize that increase/decrease in opening accumulated surpluses or deficits.

MAIN REPORT Chapter 4:IPSAS25 for Punjab Government Pension
and General Provident Fund Schemes Page 93 of 135
Actuarial Assessment of Pension and General Provident Fund Liabilities (as per contract with PRMP, Government of Punjab, under TA – Loan No. 2386)
4.4.2 Statement of Financial Position for Punjab Government Pension Scheme under Paragraph 65. of IPSAS 25
Statement of Financial Position as at 30th June 2009 Rupees in ‘000 Present Value of Defined Benefit Obligation 597,622,375 Plus Actuarial Gains/Less Actuarial Losses not yet recognised (14,208,481) Minus Past Service Cost not yet recognised (147,032,363) Less unrecognised Transitional Liability to be recognised in later periods Nil Minus fair value of Plan Assets (3,000,000) Statement of Financial Position as at 30th June 2009 433,381,531
4.4.3 Statement of Financial Performance for Punjab Government Pension Scheme under Paragraph 74 of IPSAS 25
Expense Recognized in the Statement of Financial Performance for 2008-09 Rupees in ‘000 Current Service Cost 25,173,434 Interest Cost 61,848,739 Expected Return on Plan Assets (360,000) Actuarial Gains and Losses Nil Past Service Cost* 9,802,158 Total Expense Recognized in the Statement of Financial
Performance 96,464,331
* The past service cost recognized as expense is calculated as per paragraph 112. of the Standard which mandates to recognize (non-vested) past service cost as an expense on a straight-line basis over the average period until the benefits become vested. The average remaining years to vesting worked out as at July 1st 2008 is 16 years. Thus the amount of past service cost recognized as expense during 2008-09 is calculated by dividing the non-vested past service cost of Rs.156.834 billion by the average years to vesting of 16 years.

MAIN REPORT Chapter 4:IPSAS25 for Punjab Government Pension
and General Provident Fund Schemes Page 94 of 135
Actuarial Assessment of Pension and General Provident Fund Liabilities (as per contract with PRMP, Government of Punjab, under TA – Loan No. 2386)
4.4.4 Disclosures for Punjab Government Pension Scheme under Paragraph 141. of IPSAS 25
Various disclosures required under paragraph 141. of the Standard, apart from Statement
of Financial Position & Statement of Financial Performance, are presented as follows:
Accounting Policy for Recognizing Actuarial Gains & Losses [141.(a)] As stated earlier, we have assumed that Government of Punjab will adopt the minimum
10% corridor approach for the recognition of actuarial gains and losses in respect of its
Pension Scheme. Since there are no accumulated actuarial gains and losses at the end of
previous financial year (i.e. uptil 30.06.2008), therefore, no portion of actuarial gains losses
has been recognized during 2008-09.
General Description of the Type of the Plan [141.(b)] Punjab Government Pension Scheme is a defined benefit scheme based on pension
calculation formula comprising of pension accrual rate related to service rendered and last
drawn pensionable salary. The benefit structure of the Scheme is described in Appendix VI
of the Report.
Reconciliation of Present Value of Defined Benefit Obligation [141.(c)] Rupees in ‘000 Present Value of Defined Benefit Obligation as at 1st July 2008 515,406,161 Current Service Cost 25,173,434 Interest Cost* 61,848,739 Benefits paid (18,654,440) Actuarial gains and losses 13,848,481 Present Value of Defined Benefit Obligation as at 30th June 2009 597,622,375 * According to paragraph 95. of the Standard, interest cost is computed by multiplying the discount rate as determined at the start of the period (which is 12%) with the present value of the defined benefit obligation throughout that period, taking account of any material changes in the obligation. {0.12 x Rs.515,406,161,000}

MAIN REPORT Chapter 4:IPSAS25 for Punjab Government Pension
and General Provident Fund Schemes Page 95 of 135
Actuarial Assessment of Pension and General Provident Fund Liabilities (as per contract with PRMP, Government of Punjab, under TA – Loan No. 2386)
Reconciliation of Fair Value of Plan Assets [141.(e)] Rupees in ‘000 Fair Value of Plan Assets as at 1st July 2008 3,000,000 Contributions by the employer Nil Expected return on plan assets* 360,000 Benefits paid Nil Actuarial gains and losses (360,000) Fair value of plan assets as at 30th June 2009 3,000,000 * Expected return on plan assets is obtained by multiplying expected return on plan assets (which is 12% for 2008-09) with the fair value of plan assets as at the beginning of the reporting period. {0.12 x Rs.3,000,000,000} Reconciliation of Actuarial Gains and Losses Rupees in ‘000 Unrecognised Actuarial Gains/(Losses) as at 1st July 2008 Nil Actuarial Gains/(Losses) arising during the year (14,208,481) Actuarial (Gains)/Losses recognized in the Statement of Financial
Performance during the year Nil
Unrecognised Actuarial Gains/(Losses) as at 30th June 2009 (14,208,481)
Category of Plan Assets [141.(j)] Rupees in ‘000 Cash at Bank 3,000,000 Actual Return on Plan Assets [141.(m)] Rupees in ‘000 Expected Return on Plan Assets for the year 360,000 Actuarial gain/ (loss) on assets in the year (360,000) Actual Return on Plan Assets Nil

MAIN REPORT Chapter 4:IPSAS25 for Punjab Government Pension
and General Provident Fund Schemes Page 96 of 135
Actuarial Assessment of Pension and General Provident Fund Liabilities (as per contract with PRMP, Government of Punjab, under TA – Loan No. 2386)
Principal Actuarial Assumptions used as at 30th June 2009 [141.(n)] Discount rate 12% per annum Basis on which discount rate has been determined Explained above under
Section 4.3 Expected rates of salary increase 11% per annum Expected rates of return on plan assets 12% per annum Average remaining years to vesting 16 years Average remaining working lifetime 17 years Rate of Increase in Pension amounts (Indexation rate) 8% per annum Surplus (Deficit) in the Plan [141.(p)(i)] Rupees in ‘000 Rupees in ‘000 2009 2008 Present Value of Defined Benefit Obligation as
at June 30th of the year 597,622,375 515,406,161
Fair Value of Plan Assets at year end 3,000,000 3,000,000 Surplus/ (Deficit) in the Plan (594,622,375) (512,406,161) Experience Adjustments [141.(p)(ii)] Rupees in ‘000 Experience adjustment arising on plan liabilities (gains)/losses 13,848,481 Experience adjustment arising on plan assets (gain)/losses 360,000 Total Experience adjustment (i.e. total actuarial loss) 14,208,481

MAIN REPORT Chapter 4:IPSAS25 for Punjab Government Pension
and General Provident Fund Schemes Page 97 of 135
Actuarial Assessment of Pension and General Provident Fund Liabilities (as per contract with PRMP, Government of Punjab, under TA – Loan No. 2386)
Estimated Contribution to be paid to the Plan during 2009-10 [141.(q)]
Rupees in ‘000 Estimated Contribution to be paid by the Government of Punjab to its Pension Fund 9,000,000
Corroboration of Results Rupees in ‘000 Statement of Financial Position as at 30th June 2008 Nil Total Expense Recognized in the Statement of Financial Performance 96,464,331 Benefit Payments made during the Year (18,654,440) Initial Liability charged to opening accumulated Surpluses/Deficits due to
First Time Adoption of IPSAS 25 355,571,640
Statement of Financial Position as at 30th June 2009 433,381,531

MAIN REPORT Chapter 4:IPSAS25 for Punjab Government Pension
and General Provident Fund Schemes Page 98 of 135
Actuarial Assessment of Pension and General Provident Fund Liabilities (as per contract with PRMP, Government of Punjab, under TA – Loan No. 2386)
4.5 Reporting of Punjab Government General Provident Scheme as per IPSAS 25
4.5.1 First Time Adoption of IPSAS 25 for Punjab Government General Provident Fund Scheme under Paragraph 166.
Initial Liability as at 1st July 2008 under Paragraph 166. Rupees in ‘000 Present Value of Defined Benefit Obligations as at 1st July 2008 (GP
Fund Loan Balance on GOPB as at 01.07.2008) 69,275,369
Less Fair Value of Plan Assets Nil Less any Past Service Cost to be recognised in later periods Nil
Initial Liability as at 1st July 2008 69,275,369 Liability recognised as at 01.07.2008 under the entity’s previous
accounting policy Nil
Increase in Liability due to first time adoption of IPSAS 25 69,275,369
4.5.2 Statement of Financial Position for Punjab Government General Provident Fund Scheme under Paragraph 65. of IPSAS 25
Statement of Financial Position as at 30th June 2009 Rupees in ‘000 Present Value of Defined Benefit Obligation (GP Fund Loan Balance on
GOPB as at 30.06.2009) 79,185,192
Plus Actuarial Gains/Less Actuarial Losses not yet recognised Nil Minus Past Service Cost not yet recognised Nil Less unrecognised Transitional Liability to be recognised in later
periods Nil
Minus fair value of Plan Assets Nil
Statement of Financial Position as at 30th June 2009 79,185,192

MAIN REPORT Chapter 4:IPSAS25 for Punjab Government Pension
and General Provident Fund Schemes Page 99 of 135
Actuarial Assessment of Pension and General Provident Fund Liabilities (as per contract with PRMP, Government of Punjab, under TA – Loan No. 2386)
4.5.3 Statement of Financial Performance for Punjab Government General Provident Fund Scheme under Paragraph 74. of IPSAS 25
Expense Recognized in the Statement of Financial Performance for 2008-09 Rupees in ‘000 Current Service Cost Nil Interest Cost* 8,615,641 Expected Return on Plan Assets Nil Total Expense Recognized in the Statement of Financial
Performance 8,615,641
*Interest Credited by the Government during the period has been assumed at the rate of 12%.
4.5.4 Disclosures for Punjab Government General Provident Fund Scheme under Paragraph 141. of IPSAS 25
Various disclosures required under paragraph 141. of the Standard, apart from Statement
of Financial Position & Statement of Financial Performance, are presented as follows:
Accounting Policy for Recognizing Actuarial Gains & Losses [141.(a)] No actuarial technique is involved in determining the GPF balances. Interest cost is the
amount credited by the Government during the period. There is no current service cost
because Government does not contribute to the GP Fund. Thus, no actuarial gains and
losses arise for the underlying GP Fund Scheme.
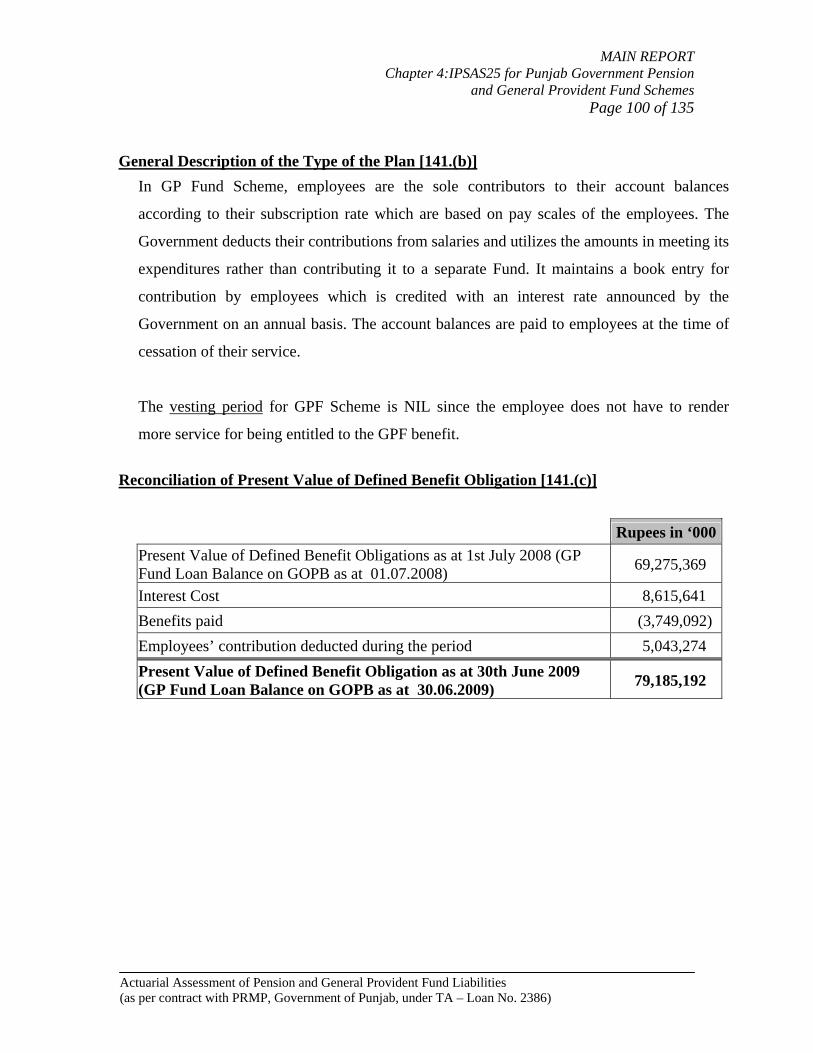
MAIN REPORT Chapter 4:IPSAS25 for Punjab Government Pension
and General Provident Fund Schemes Page 100 of 135
Actuarial Assessment of Pension and General Provident Fund Liabilities (as per contract with PRMP, Government of Punjab, under TA – Loan No. 2386)
General Description of the Type of the Plan [141.(b)] In GP Fund Scheme, employees are the sole contributors to their account balances
according to their subscription rate which are based on pay scales of the employees. The
Government deducts their contributions from salaries and utilizes the amounts in meeting its
expenditures rather than contributing it to a separate Fund. It maintains a book entry for
contribution by employees which is credited with an interest rate announced by the
Government on an annual basis. The account balances are paid to employees at the time of
cessation of their service.
The vesting period for GPF Scheme is NIL since the employee does not have to render
more service for being entitled to the GPF benefit.
Reconciliation of Present Value of Defined Benefit Obligation [141.(c)] Rupees in ‘000 Present Value of Defined Benefit Obligations as at 1st July 2008 (GP
Fund Loan Balance on GOPB as at 01.07.2008) 69,275,369
Interest Cost 8,615,641 Benefits paid (3,749,092) Employees’ contribution deducted during the period 5,043,274 Present Value of Defined Benefit Obligation as at 30th June 2009
(GP Fund Loan Balance on GOPB as at 30.06.2009) 79,185,192

MAIN REPORT Chapter 4:IPSAS25 for Punjab Government Pension
and General Provident Fund Schemes Page 101 of 135
Actuarial Assessment of Pension and General Provident Fund Liabilities (as per contract with PRMP, Government of Punjab, under TA – Loan No. 2386)
Reconciliation of Fair Value of Plan Assets [141.(e)] Rupees in ‘000 Fair Value of Plan Assets as at 1st July 2008 Nil Contributions by the employer Nil Expected return on plan assets Nil Benefits paid Nil
Fair value of plan assets as at 30th June 2009 Nil Actual Return on Plan Assets [141.(m)] Rupees in ‘000 Expected Return on Plan Assets for the year Nil Actuarial gain/ (loss) on assets in the year Nil Actual Return on Plan Assets Nil Principal Actuarial Assumptions used as at 30th June 2009 [141.(n)] Discount rate Nil Basis on which discount rate has been determined Nil Expected rates of salary increase Nil Expected rates of return on plan assets Nil Average remaining years to vesting Nil Average remaining working lifetime 17 years

MAIN REPORT Chapter 4:IPSAS25 for Punjab Government Pension
and General Provident Fund Schemes Page 102 of 135
Actuarial Assessment of Pension and General Provident Fund Liabilities (as per contract with PRMP, Government of Punjab, under TA – Loan No. 2386)
Surplus (Deficit) in the Plan [141.(p)(i)] Rupees in ‘000 Rupees in ‘000 2009 2008 Present Value of Defined Benefit Obligation as
at June 30th of the year 79,185,192 69,275,369
Fair Value of Plan Assets at year end Nil Nil Surplus/ (Deficit) in the Plan (79,185,192) (69,275,369) Experience Adjustments [141.(p)(ii)] Rupees in ‘000 Experience adjustment arising on plan liabilities (gains)/losses Nil Experience adjustment arising on plan assets (gain)/losses Nil Estimated Contribution to be paid to the Plan during 2009-10 [141.(q)] Rupees in ‘000 Estimated Contribution to be paid by the Government of Punjab to its Pension Fund Nil
Corroboration of Results Rupees in ‘000 Statement of Financial Position as at 30th June 2008 Nil Total Expense Recognized in the Statement of Financial Performance 8,615,641 Benefit Payments made during the Year (3,749,092) Contributions deducted from employees during the year 5,043,274 Initial Liability charged to opening accumulated Surpluses/Deficits due to
First Time Adoption of IPSAS 25 69,275,369
Statement of Financial Position as at 30th June 2009 79,185,192
MAIN REPORT Chapter 4:IPSAS25 for Punjab Government Pension
and General Provident Fund Schemes Page 103 of 135
Actuarial Assessment of Pension and General Provident Fund Liabilities (as per contract with PRMP, Government of Punjab, under TA – Loan No. 2386)
4.6 Commentary on IPSAS 25 Application to Government of Punjab Pension and GP Fund Schemes
1. IPSAS 25 is applicable to all public sector employee benefits and is being applied to
Punjab Govt. Pension and GP Fund Schemes for the first time in the year 2008-09.
2. It is debatable whether IPSAS 25 is applicable to GP Fund Scheme since this does not
constitute an employee benefit as defined in the Standard.
3. The Standard prescribes the accounting and disclosure requirements of public sector
employee benefit schemes. However, it gives exemptions to some disclosures in the
year of adoption.
4. Considering that this is a new concept for the Government, its usefulness will start to
emerge gradually over the future.
5. The reconciliations of various items (such as present value of defined benefit pension
obligations, fair value of Plan assets etc.) will emerge as powerful tools for the Govt.
in understanding the liabilities and assets of the Schemes AND various components
of each item.
6. Additionally, the emergence and movement of gains and losses for Pension Scheme
will make the Govt. focus on the areas which impact the Scheme’s health negatively
or positively.
7. It is important to differentiate the accrued (or funding) pension liability from
IPSAS 25 liability.

MAIN REPORT Chapter 4:IPSAS25 for Punjab Government Pension
and General Provident Fund Schemes Page 104 of 135
Actuarial Assessment of Pension and General Provident Fund Liabilities (as per contract with PRMP, Government of Punjab, under TA – Loan No. 2386)
One key difference is that IPSAS 25 spreads non-vested liability over the average
period to vesting. As such, while the accrued (or funding) liability of Punjab Govt.
Pension Scheme is Rs.515.4 billion on 01.07.08, the initial liability as per IPSAS 25
is Rs.355.6 billion on the same date (assuming the Pension Scheme is introduced as at
the date of adoption of the Standard).
Another important difference is accrued pension liability recognizes 100% of
actuarial gains and losses whereas the minimum approach under IPSAS 25 recognizes
a relatively small portion. The effect of this difference will start to appear from the
year 2009-10 onwards.
8. The Standard requires calculation of following 2 parameters :
i. Statement of Financial Position; and
ii. Statement of Financial Performance.
These act as useful benchmarks for comparison of assets vs. liabilities AND scheme
cost vs. contributions during the accounting period.
9. The Standard requires narrative description of the basis used to determine the overall
expected return on assets.
This has not been done for 2008-09 as all assets are invested with Bank of Punjab and
are relatively nominal in amount. An expected return on assets of 12% has been
assumed.
NAUMAN A. CHEEMA Actuary Fellow of Society of Actuaries (USA) Fellow of Pakistan Society of Actuaries

APPENDIX I Page 105 of 135
Actuarial Assessment of Pension and General Provident Fund Liabilities (as per contract with PRMP, Government of Punjab, under TA – Loan No. 2386)
APPENDIX I Summary of Sample of Active Employees of Government of Punjab Age-wise Distribution
Age Total
Number Total Monthly
Salary Avg. Monthly
Salary Avg. PS Distribution
18 2 6,840 3,420 0.7 0.0% 19 32 110,060 3,439 1.1 0.1% 20 185 665,180 3,596 1.4 0.3% 21 524 1,927,255 3,678 1.8 0.9% 22 990 3,783,590 3,822 2.4 1.7% 23 1,378 5,472,195 3,971 2.6 2.3% 24 1,854 7,743,665 4,177 2.8 3.1% 25 2,204 9,482,650 4,302 3.0 3.7% 26 2,542 11,133,705 4,380 3.3 4.3% 27 2,396 10,704,125 4,467 3.6 4.0% 28 1,593 7,055,505 4,429 4.9 2.7% 29 1,440 6,964,855 4,837 5.9 2.4% 30 1,349 6,511,055 4,827 7.0 2.3% 31 1,345 6,830,340 5,078 7.9 2.3% 32 1,364 7,337,100 5,379 9.0 2.3% 33 1,477 8,063,000 5,459 9.9 2.5% 34 1,580 9,274,465 5,870 10.7 2.6% 35 1,679 10,581,110 6,302 11.9 2.8% 36 1,768 11,586,905 6,554 12.3 3.0% 37 2,021 14,114,858 6,984 13.4 3.4% 38 2,013 14,927,340 7,415 15.3 3.4% 39 2,358 18,067,215 7,662 15.7 3.9% 40 2,650 21,575,100 8,142 16.3 4.4% 41 2,508 20,755,269 8,276 17.3 4.2% 42 2,382 20,949,102 8,795 17.7 4.0% 43 2,433 22,042,915 9,060 18.4 4.1% 44 2,184 20,976,145 9,604 19.1 3.7% 45 1,824 18,270,298 10,017 19.8 3.1% 46 1,799 19,335,505 10,748 20.7 3.0% 47 1,546 17,346,730 11,220 21.2 2.6% 48 1,409 16,920,975 12,009 21.7 2.4% 49 1,250 15,690,515 12,552 22.3 2.1% 50 1,149 14,455,595 12,581 22.8 1.9% 51 1,083 14,154,325 13,070 24.9 1.8% 52 907 12,261,050 13,518 26.2 1.5% 53 926 13,498,243 14,577 26.7 1.5% 54 703 10,337,280 14,705 26.9 1.2% 55 742 11,310,120 15,243 28.0 1.2% 56 570 9,244,920 16,219 28.6 1.0% 57 503 8,698,605 17,293 29.3 0.8% 58 426 7,744,945 18,181 30.6 0.7% 59 391 7,936,335 20,298 32.0 0.7% 60 290 6,202,530 21,388 32.7 0.5%

APPENDIX I Page 106 of 135
Actuarial Assessment of Pension and General Provident Fund Liabilities (as per contract with PRMP, Government of Punjab, under TA – Loan No. 2386)
Grade-wise Distribution
Grade Number in Grade
Total Monthly Salary
Avg. Monthly Salary
Avg. AGE PS Distribution
1 318 1,037,952 3,264 29 5 0.5% 2 6,622 30,030,770 4,535 39 15 11.1% 3 1,204 6,411,300 5,325 44 19 2.0% 4 637 3,274,817 5,141 39 14 1.1% 5 23,444 119,118,964 5,081 33 10 39.2% 6 808 5,450,768 6,746 43 19 1.4% 7 6,722 45,440,720 6,760 40 16 11.2% 8 307 2,420,695 7,885 45 20 0.5% 9 3,780 29,518,020 7,809 41 18 6.3%
10 490 4,908,820 10,018 49 26 0.8% 11 534 4,683,180 8,770 43 19 0.9% 12 779 6,769,510 8,690 39 15 1.3% 13 88 832,040 9,455 41 17 0.1% 14 5,129 43,242,599 8,431 36 12 8.6% 15 761 9,527,720 12,520 44 20 1.3% 16 2,383 31,836,880 13,360 45 21 4.0% 17 3,100 59,501,400 19,194 45 18 5.2% 18 1,733 45,681,880 26,360 49 22 2.9% 19 673 22,116,126 32,862 52 26 1.1% 20 218 8,398,886 38,527 54 26 0.4% 21 36 1,673,352 46,482 56 28 0.1% 22 3 162,441 54,147 60 32 0.0%

APPENDIX I Page 107 of 135
Actuarial Assessment of Pension and General Provident Fund Liabilities (as per contract with PRMP, Government of Punjab, under TA – Loan No. 2386)
Consolidated Data used for Valuation
Age Total Number Distribution Total Monthly
(Adjusted) Salary
Avg. Monthly (Adjusted)
Salary
Avg. PS
Final Total Number
Final Total Monthly Salary
18 2 0.0% 7,114 3,557 0.7 28 99,596 19 32 0.1% 114,462 3,577 1.1 445 1,591,765 20 185 0.3% 691,787 3,739 1.4 2,573 9,620,447 21 524 0.9% 2,004,345 3,825 1.8 7,287 27,872,775 22 990 1.7% 3,934,934 3,975 2.4 13,768 54,727,800 23 1378 2.3% 5,691,083 4,130 2.6 19,163 79,143,190 24 1854 3.1% 8,053,412 4,344 2.8 25,783 112,001,352 25 2204 3.7% 9,861,956 4,475 3.0 30,650 137,158,750 26 2542 4.3% 11,579,053 4,555 3.3 35,351 161,023,805 27 2396 4.0% 11,132,290 4,646 3.6 33,320 154,804,720 28 1593 2.7% 7,337,725 4,606 4.9 22,153 102,036,718 29 1440 2.4% 7,243,449 5,030 5.9 20,026 100,730,780 30 1349 2.3% 6,771,497 5,020 7.0 18,760 94,175,200 31 1345 2.3% 7,103,554 5,281 7.9 18,704 98,775,824 32 1364 2.3% 7,630,584 5,594 9.0 18,969 106,112,586 33 1477 2.5% 8,385,520 5,677 9.9 20,540 116,605,580 34 1580 2.6% 9,645,444 6,105 10.7 21,972 134,139,060 35 1679 2.8% 11,004,354 6,554 11.9 23,349 153,029,346 36 1768 3.0% 12,050,381 6,816 12.3 24,587 167,584,992 37 2021 3.4% 14,679,452 7,263 13.4 28,105 204,126,615 38 2013 3.4% 15,524,434 7,712 15.3 27,994 215,889,728 39 2358 3.9% 18,789,904 7,969 15.7 32,792 261,319,448 40 2650 4.4% 22,438,104 8,467 16.3 36,853 312,034,351 41 2508 4.2% 21,585,480 8,607 17.3 34,878 300,194,946 42 2382 4.0% 21,787,066 9,147 17.7 33,126 303,003,522 43 2433 4.1% 22,924,632 9,422 18.4 33,835 318,793,370 44 2184 3.7% 21,815,191 9,989 19.1 30,372 303,385,908 45 1824 3.1% 19,001,110 10,417 19.8 25,366 264,237,622 46 1799 3.0% 20,108,925 11,178 20.7 25,018 279,651,204 47 1546 2.6% 18,040,599 11,669 21.2 21,500 250,883,500 48 1409 2.4% 17,597,814 12,490 21.7 19,594 244,729,060 49 1250 2.1% 16,318,136 13,055 22.3 17,383 226,935,065 50 1149 1.9% 15,033,819 13,084 22.8 15,979 209,069,236 51 1083 1.8% 14,720,498 13,592 24.9 15,061 204,709,112 52 907 1.5% 12,751,492 14,059 26.2 12,613 177,326,167 53 926 1.5% 14,038,173 15,160 26.7 12,878 195,230,480 54 703 1.2% 10,750,771 15,293 26.9 9,776 149,504,368 55 742 1.2% 11,762,525 15,852 28.0 10,319 163,576,788 56 570 1.0% 9,614,717 16,868 28.6 7,927 133,712,636 57 503 0.8% 9,046,549 17,985 29.3 6,995 125,805,075 58 426 0.7% 8,054,743 18,908 30.6 5,924 112,010,992 59 391 0.7% 8,253,788 21,109 32.0 5,437 114,769,633 60 290 0.5% 6,450,631 22,244 32.7 4,033 89,710,052
Total 59,769 831,186 6,971,843,164

APPENDIX II Page 108 of 135
Actuarial Assessment of Pension and General Provident Fund Liabilities (as per contract with PRMP, Government of Punjab, under TA – Loan No. 2386)
APPENDIX II SANCTIONED POSTS BREAK-UP FOR 2009-10
BASIC SCALE PROVINCIAL DISTRICT TOTAL 1 61,567 115,727 177,294 2 11,321 42,682 54,003 3 8,949 1,139 10,088 4 5,555 8,429 13,984 5 144,610 28,454 173,064 6 4,983 21,402 26,385 7 34,540 151,017 185,557 8 382 4,460 4,842 9 18,796 119,409 138,205 10 635 7,095 7,730 11 5,661 8,787 14,448 12 3,688 7,735 11,423 13 501 281 782 14 24,910 30,988 55,898 15 1,255 4,727 5,982 16 12,139 41,097 53,236 17 18,951 22,522 41,473 18 10,208 5,767 15,975 19 2,704 2,381 5,085 20 741 169 910 21 82 1 83 22 5 - 5
Special Grade 992 32,202 33,194 Total: 373,175 656,471 1,029,646

Appendix III Page 109 of 135
Actuarial Assessment of Pension and General Provident Fund Liabilities (as per contract with PRMP, Government of Punjab, under TA – Loan No. 2386)
APPENDIX III
Indexation

Appendix IV Page 110 of 135
Actuarial Assessment of Pension and General Provident Fund Liabilities (as per contract with PRMP, Government of Punjab, under TA – Loan No. 2386)
APPENDIX IV Age wise Distribution of Pensioners
Number of Pensioners Number of Pensioners
Age Family Early
Retirement Invalid Retiree
Normal Retirement Age Family
Early Retirement
Invalid Retiree
Normal Retirement
34 34 0 0 0 68 2349 5097 136 6005 35 59 0 0 0 69 2298 5072 144 5436 36 93 0 0 0 70 2341 4181 68 6183 37 68 0 0 0 71 2332 3791 102 4775 38 102 0 0 0 72 2324 4054 68 4631 39 229 0 0 0 73 2553 2341 59 4249 40 322 229 102 0 74 2324 2451 51 3910 41 297 348 136 0 75 2290 1866 76 4877 42 424 416 119 0 76 2290 1645 34 3978 43 585 424 297 0 77 1985 1264 8 2867 44 670 585 382 0 78 1942 1001 34 2655 45 755 687 280 0 79 2052 933 17 2756 46 746 857 441 0 80 2247 916 8 2587 47 721 1001 288 0 81 1840 712 8 1628 48 933 1281 390 0 82 1806 577 0 1170 49 746 1781 331 0 83 1756 628 0 1332 50 950 2731 424 0 84 1866 483 8 1391 51 992 4224 390 0 85 1705 636 0 1272 52 1315 5614 517 0 86 1560 356 0 1128 53 1187 6700 356 0 87 1043 246 0 797 54 1281 7438 509 0 88 1086 119 0 797 55 1103 7149 483 0 89 941 76 0 526 56 1416 7998 466 0 90 712 237 0 93 57 1264 7090 348 0 91 543 93 0 25 58 1382 7438 348 0 92 594 110 0 25 59 1357 6980 305 0 93 560 127 0 8 60 1535 7132 407 1613 94 407 51 0 8 61 1594 7845 322 2434 95 364 42 0 16 62 1654 6988 254 3172 96 433 50 0 0 63 1815 7879 280 5513 97 221 42 0 0 64 1917 8159 356 5436 98 204 0 8 8 65 1874 6598 339 6675 99 178 8 0 8 66 1908 6751 221 7311 100 238 0 0 0 67 2103 5046 93 6123

Appendix V Page 111 of 135
Actuarial Assessment of Pension and General Provident Fund Liabilities (as per contract with PRMP, Government of Punjab, under TA – Loan No. 2386)
APPENDIX V Mortality Rates The following table shows the age-based mortality rates used for the purpose of valuation. The rates are those of the LIC96-98a mortality table (Indian Mortality Table) used for actuarial work in Pakistan.
Age Mortality Rates Age Mortality Rates 20 0.919 53 6.058 21 0.961 54 6.730 22 0.999 55 7.401 23 1.033 56 8.069 24 1.063 57 8.710 25 1.090 58 9.397 26 1.113 59 10.130 27 1.132 60 10.907 28 1.147 61 11.721 29 1.159 62 11.750 30 1.166 63 12.120 31 1.170 64 12.833 32 1.170 65 13.889 33 1.171 66 15.286 34 1.201 67 17.026 35 1.246 68 19.109 36 1.308 69 21.534 37 1.387 70 24.301 38 1.482 71 27.410 39 1.593 72 30.862 40 1.721 73 34.656 41 1.865 74 38.793 42 2.053 75 43.272 43 2.247 76 48.093 44 2.418 77 53.257 45 2.602 78 58.763 46 2.832 79 64.611 47 3.110 80 70.802 48 3.438 81 77.335 49 3.816 82 84.210 50 4.243 83 91.428 51 4.719 84 98.988 52 5.386 85 106.891
Note: All rates are per 1000

Appendix V Page 112 of 135
Actuarial Assessment of Pension and General Provident Fund Liabilities (as per contract with PRMP, Government of Punjab, under TA – Loan No. 2386)
Turnover, Disability and Early Retirement Rates The employee turnover, disability and early retirement rates used in the valuation are shown in the table below. The rates are based on the experience of public-sector employee benefit schemes in Pakistan.
Age Withdrawal Rates Disability Rates Early Retirement Rates 20 125.00 - - 21 85.70 - - 22 96.80 - - 23 65.30 - - 24 44.00 - - 25 29.70 - - 26 47.90 - - 27 31.10 - - 28 20.40 - - 29 13.50 - - 30 9.00 0.50 - 31 6.00 0.55 - 32 15.00 0.59 - 33 9.40 0.64 - 34 6.00 0.69 - 35 3.90 0.74 - 36 2.60 0.78 - 37 1.70 0.83 - 38 7.30 0.88 - 39 4.50 0.92 - 40 2.80 0.97 - 41 1.80 1.02 - 42 1.20 1.06 - 43 0.80 1.11 - 44 0.50 1.16 - 45 0.40 1.21 10.00 46 0.20 1.25 10.00 47 0.10 1.30 10.00 48 0.10 2.10 10.00 49 0.10 2.10 14.70 50 - 2.20 19.40 51 - 2.20 24.10 52 - 2.30 28.80 53 - 2.30 33.50 54 - 2.40 38.20 55 - 2.40 42.90 56 - 2.50 47.60 57 - 2.50 52.30 58 - 2.60 57.00 59 - 2.60 61.70 60 - - - Note: All rates are per 1000

Appendix VI Page 113 of 135
Actuarial Assessment of Pension and General Provident Fund Liabilities (as per contract with PRMP, Government of Punjab, under TA – Loan No. 2386)
APPENDIX VI
Summary of the Benefit Structure of Punjab Government Pension Scheme
The Pension Scheme Members of Punjab Government were entitled to the following pension benefits on normal and early retirement, death and disability as at June 30, 2009:
Normal Retirement Pension
The normal retirement age is 60 years.
If service is less than 5 years:
• Nil Benefit
If service is greater than 5 and less than 10 years:
• A lump sum gratuity is payable. The rate of gratuity is calculated as per the following formula:
Gratuity = Last Drawn Pensionable Salary x Pensionable Service
If service is greater than 10 years:
• The rate of pension at normal retirement age is (7/300) 2.33% of the last drawn pensionable salary for each year of service subject to a maximum service period of 30 years. The maximum pension amount is thus limited to 70% of the last drawn pensionable salary
The employees can surrender up to a maximum of 35% of the gross pension in lieu of a lumpsum-commuted value. The commuted value at age 60 shall be calculated as per the following formula:
Commuted Value = 12.37 x amount of pension surrendered x 12
Early Retirement Pension
Early retirement is applicable on the completion of 25 years of continuous service.
• The rate of pension at early retirement age is 2.33% of the last drawn pensionable salary for each year of service subject to a maximum service period of 30 years. The maximum pension amount is thus limited to 70% of the last drawn pensionable salary
The employees can surrender up to a maximum of 35% of the gross pension in lieu of a lumpsum-commuted value.

Appendix VI Page 114 of 135
Actuarial Assessment of Pension and General Provident Fund Liabilities (as per contract with PRMP, Government of Punjab, under TA – Loan No. 2386)
Death in Service
If service is less than 5 years:
• Nil
If service is greater than 5 and less than 10 years:
• A lump sum gratuity is payable. The rate of gratuity is calculated as per the following formula:
Gratuity = 1.5 x Last Drawn Pensionable Salary x Service
If service is greater than 10 years:
• The basic pension shall be 2.33% of the last drawn pensionable salary for each year of service subject to a maximum service period of 30 years
Widow’s Pension = 50% x basic pension
Widow’s pension is paid to eligible children in case of death of the widow. Eligible children are defined as legal male child under the age of 21 years and legal unmarried daughter
In addition to the above, the widow is entitled to 25% of the commuted value of gross pension. The age based commutation factors are set out in the table (later in the section)
Death after Retirement In case of death after retirement, the widow is entitled to receive 50% of the pension being received by the retiree.
Widow’s pension is paid to eligible children in case of death of the widow. Eligible children are defined as legal male child under the age of 21 years and legal unmarried daughter. In the absence of widow and eligible children, the pension is payable to the dependents (such as parents, widow daughter etc.) for the remaining guaranteed period
Ill-health Pension
If service is less than 5 years:
• Nil
If service is greater than 5 and less than 10 years:
• A lump sum gratuity is payable. The rate of gratuity is calculated as per the following formula:
Gratuity = 1.5 x Last Drawn Pensionable Salary x Service

Appendix VI Page 115 of 135
Actuarial Assessment of Pension and General Provident Fund Liabilities (as per contract with PRMP, Government of Punjab, under TA – Loan No. 2386)
If service is greater than 10 years:
• The basic pension is 2.33% of the last drawn pensionable salary for each year of service subject to a maximum service period of 30 years.
The employees can surrender up to a maximum of 35% of the gross pension in lieu of a lumpsum-commuted value. Following is the age – based commutation table showing commutation factors at ages 20 – 60.
Age Commutation Factors
Age Commutation Factors
Age Commutation Factors
20 40.5043 36 28.3362 52 17.0050 21 39.7341 37 27.5908 53 16.3710 22 38.9653 38 26.8482 54 15.7517 23 38.1974 39 26.1009 55 15.1478 24 37.4307 40 25.3728 56 14.5602 25 36.6651 41 24.6406 57 13.9888 26 35.9006 42 23.9126 58 13.4340 27 35.1372 43 23.1840 59 12.8953 28 34.3750 44 22.4713 60 12.3719 29 33.6143 45 21.7592 30 32.8071 46 21.0538 31 32.0974 47 20.3555 32 31.3412 48 19.6653 33 30.5869 49 18.9841 34 29.8343 50 18.3129 35 29.0841 51 17.6526

Appendix VII Page 116 of 135
Actuarial Assessment of Pension and General Provident Fund Liabilities (as per contract with PRMP, Government of Punjab, under TA – Loan No. 2386)
APPENDIX VII PROJECTED PENSION EXPENSE AS PERCENTAGE OF REVENUE The projected Pension payment expense as % of annual Revenue over the next 30 years if it grows at the rate of 8%, 10% or 12% per annum would be as follows:
Year
Projected Revenue @ 8% growth
Total Pension Expense
Pension Expense as % of Revenue
Projected Revenue @ 10% growth
Total Pension Expense
Pension Expense as % of Revenue
Projected Revenue @ 12% growth
Total Pension Expense
Pension Expense as % of Revenue
2010 - 11 381.2 23.4 6% 381.2 23.4 6% 381.2 23.4 6%
2011 - 12 411.70 26.6 6% 419.32 26.6 6% 426.94 26.6 6%
2012 - 13 444.63 30.0 7% 461.25 30.0 7% 478.18 30.0 6%
2013 - 14 480.20 35.3 7% 507.38 35.3 7% 535.56 35.3 7%
2014 - 15 518.62 38.5 7% 558.11 38.5 7% 599.83 38.5 6%
2015 - 16 560.11 46.6 8% 613.93 46.6 8% 671.80 46.6 7%
2016 - 17 604.92 50.8 8% 675.32 50.8 8% 752.42 50.8 7%
2017 - 18 653.31 59.4 9% 742.85 59.4 8% 842.71 59.4 7%
2018 - 19 705.57 67.2 10% 817.14 67.2 8% 943.84 67.2 7%
2019 - 20 762.02 77.5 10% 898.85 77.5 9% 1,057.10 77.5 7%
2020 - 21 822.98 89.4 11% 988.73 89.4 9% 1,183.95 89.4 8%
2021 - 22 888.82 101.5 11% 1,087.61 101.5 9% 1,326.02 101.5 8%
2022 - 23 959.93 118.7 12% 1,196.37 118.7 10% 1,485.15 118.7 8%
2023 - 24 1,036.72 130.8 13% 1,316.01 130.8 10% 1,663.36 130.8 8%
2024 - 25 1,119.66 154.3 14% 1,447.61 154.3 11% 1,862.97 154.3 8%
2025 - 26 1,209.23 177.2 15% 1,592.37 177.2 11% 2,086.52 177.2 8%
2026 - 27 1,305.97 196.1 15% 1,751.60 196.1 11% 2,336.91 196.1 8%
2027 - 28 1,410.45 219.5 16% 1,926.76 219.5 11% 2,617.33 219.5 8%
2028 - 29 1,523.28 249.5 16% 2,119.44 249.5 12% 2,931.41 249.5 9%
2029 - 30 1,645.15 263.8 16% 2,331.38 263.8 11% 3,283.18 263.8 8%
2030 - 31 1,776.76 277.9 16% 2,564.52 277.9 11% 3,677.17 277.9 8%
2031 - 32 1,918.90 303.0 16% 2,820.98 303.0 11% 4,118.43 303.0 7%
2032 - 33 2,072.41 319.3 15% 3,103.07 319.3 10% 4,612.64 319.3 7%
2033 - 34 2,238.20 343.6 15% 3,413.38 343.6 10% 5,166.15 343.6 7%
2034 - 35 2,417.26 366.3 15% 3,754.72 366.3 10% 5,786.09 366.3 6%
2035 - 36 2,610.64 389.3 15% 4,130.19 389.3 9% 6,480.42 389.3 6%
2036 - 37 2,819.49 415.9 15% 4,543.21 415.9 9% 7,258.08 415.9 6%
2037 - 38 3,045.05 445.8 15% 4,997.53 445.8 9% 8,129.04 445.8 5%
2038 - 39 3,288.65 478.7 15% 5,497.28 478.7 9% 9,104.53 478.7 5%
2039 - 40 3,551.75 532.7 15% 6,047.01 532.7 9% 10,197.07 532.7 5%

Appendix VIII Page 117 of 135
Actuarial Assessment of Pension and General Provident Fund Liabilities (as per contract with PRMP, Government of Punjab, under TA – Loan No. 2386)
APPENDIX VIII FUNDING OPTIONS FOR GP FUND The amount of General Provident Fund payment of an employee is the accumulated contributions with interest deducted from his/her salaries during the service. There are no GP Fund assets as present and the amount of total accumulated balances works out to Rs.89.8 billion as at the end of fiscal year 2009-10. The growth in GP Fund balances on both nominal and real basis is as follows: Nominal Basis
Year Total Annual Contribution
Total Interest Income
Estimated GPF Liability at year End
2009 - 10 89.8 2010 - 11 5.6 11.1 102.4 2011 - 12 6.2 12.6 116.3 2012 - 13 6.8 14.3 131.8 2013 - 14 7.5 16.1 148.6 2014 - 15 8.3 18.1 167.6 2015 - 16 9.2 20.4 187.7 2016 - 17 10.1 22.8 210.4 2017 - 18 11.1 25.5 234.3 2018 - 19 12.3 28.3 260.3 2019 - 20 13.5 31.4 287.7 2020 - 21 14.8 34.7 316.0 2021 - 22 16.2 38.0 346.0 2022 - 23 17.7 41.5 376.2 2023 - 24 19.3 45.1 408.6 2024 - 25 20.9 48.8 439.6 2025 - 26 22.8 52.5 470.3 2026 - 27 24.7 56.0 503.3 2027 - 28 26.7 59.9 537.3 2028 - 29 28.8 63.8 571.8 2029 - 30 31.2 67.8 614.7 2030 - 31 33.6 72.9 667.6 2031 - 32 36.5 79.1 725.9 2032 - 33 39.7 86.0 795.0 2033 - 34 43.2 94.2 873.1 2034 - 35 47.1 103.5 961.7 2035 - 36 51.5 114.0 1062.9 2036 - 37 56.3 126.0 1177.6 2037 - 38 61.7 139.6 1305.8 2038 - 39 67.8 154.8 1448.4 2039 - 40 74.6 171.7 1597.5

Appendix VIII Page 118 of 135
Actuarial Assessment of Pension and General Provident Fund Liabilities (as per contract with PRMP, Government of Punjab, under TA – Loan No. 2386)
Real Basis (assuming 2009-10 as the base year)
Year
Total Annual
Contribution
Total Interest Income
Estimated GPF Liability at year
End 2009 - 10 77.8 2010 - 11 5.2 3.2 82.5 2011 - 12 5.3 3.4 87.2 2012 - 13 5.4 3.6 91.9 2013 - 14 5.5 3.7 96.4 2014 - 15 5.7 3.9 101.1 2015 - 16 5.8 4.1 105.3 2016 - 17 5.9 4.2 109.7 2017 - 18 6.0 4.4 113.6 2018 - 19 6.1 4.5 117.4 2019 - 20 6.2 4.7 120.6 2020 - 21 6.3 4.8 123.1 2021 - 22 6.4 4.9 125.4 2022 - 23 6.5 4.9 126.7 2023 - 24 6.6 5.0 128.0 2024 - 25 6.6 5.0 128.0 2025 - 26 6.7 5.0 127.4 2026 - 27 6.7 4.9 126.8 2027 - 28 6.7 4.9 125.9 2028 - 29 6.7 4.8 124.6 2029 - 30 6.7 4.8 124.5 2030 - 31 6.7 4.8 125.7 2031 - 32 6.7 4.8 127.0 2032 - 33 6.8 4.8 129.3 2033 - 34 6.8 4.9 131.8 2034 - 35 6.9 5.0 134.8 2035 - 36 7.0 5.1 138.3 2036 - 37 7.0 5.2 142.2 2037 - 38 7.2 5.3 146.3 2038 - 39 7.3 5.5 150.6 2039 - 40 7.4 5.6 154.1

Appendix VIII Page 119 of 135
Actuarial Assessment of Pension and General Provident Fund Liabilities (as per contract with PRMP, Government of Punjab, under TA – Loan No. 2386)
The most appropriate Funding approach in case of a GP Fund is that the Government starts making contributions deducted from the salaries of the employees to the Fund on regular basis and amortize the accrued liability over a period of 10, 20 or 30 years. In such case, the interest amount credited to the GP Fund balances would be based on the actual yield of the Fund assets. For example if Government starts making contributions (deducted from employees) to GP Fund from 2010-11 and amortize the accumulated GP Fund liability of Rs.89.8 billion, the annual instalment for liability (apart from regular contribution) for different durations would be as follows:
Amortization Period
Annual Instalment payable at the middle of the Year
5 Years 23.5 billion 10 Years 15.0 billion 15 Years 12.5 billion 20 Years 11.4 billion 25 Years 10.8 billion 30 Years 10.5 billion
Example A If it is assumed that:
• past service GP Fund liability of Rs.89.8 billion is amortized over 30 years with increasing instalments; and
• annual GP Fund contributions deducted from the salaries of the employees are
contributed to the GP Fund;

Appendix VIII Page 120 of 135
Actuarial Assessment of Pension and General Provident Fund Liabilities (as per contract with PRMP, Government of Punjab, under TA – Loan No. 2386)
the GP Fund contributions for next 30 years would be as follows:
Year
Past Liability Amortization
Instalment
Annual Regular Contribution deducted
from Salaries
Total Amount of Contribution
to GP Fund 2010 - 11 2.0 5.6 7.6 2011 - 12 2.0 6.2 8.2 2012 - 13 3.0 6.8 9.8 2013 - 14 3.0 7.5 10.5 2014 - 15 4.0 8.3 12.3 2015 - 16 5.1 9.2 14.3 2016 - 17 6.2 10.1 16.3 2017 - 18 7.4 11.1 18.5 2018 - 19 8.7 12.3 21.0 2019 - 20 10.1 13.5 23.6 2020 - 21 11.6 14.8 26.4 2021 - 22 13.2 16.2 29.4 2022 - 23 14.9 17.7 32.6 2023 - 24 16.7 19.3 36.0 2024 - 25 18.6 20.9 39.5 2025 - 26 20.7 22.8 43.5 2026 - 27 22.9 24.7 47.6 2027 - 28 25.2 26.7 51.9 2028 - 29 27.7 28.8 56.5 2029 - 30 30.4 31.2 61.6 2030 - 31 33.3 33.6 66.9 2031 - 32 36.3 36.5 72.8 2032 - 33 39.6 39.7 79.3 2033 - 34 43.1 43.2 86.3 2034 - 35 46.8 47.1 93.9 2035 - 36 50.8 51.5 102.3 2036 - 37 55.1 56.3 111.4 2037 - 38 59.6 61.7 121.3 2038 - 39 64.4 67.8 132.2 2039 - 40 69.6 74.6 144.2

Appendix VIII Page 121 of 135
Actuarial Assessment of Pension and General Provident Fund Liabilities (as per contract with PRMP, Government of Punjab, under TA – Loan No. 2386)
Example B If it is assumed that:
• past service GP Fund liability of Rs.89.8 billion is amortized over 20 years with increasing instalments; and
• annual GP Fund contributions deducted from the salaries of the employees are
contributed to the GP Fund; the GP Fund contributions for next 30 years would be as follows:
Year
Past Liability Amortization
Instalment
Annual Regular Contribution deducted
from Salaries
Total Amount of Contribution to
GP Fund 2010 - 11 2.0 5.6 7.6 2011 - 12 2.0 6.2 8.2 2012 - 13 3.0 6.8 9.8 2013 - 14 3.0 7.5 10.5 2014 - 15 4.0 8.3 12.3 2015 - 16 5.7 9.2 14.9 2016 - 17 7.5 10.1 17.6 2017 - 18 9.5 11.1 20.6 2018 - 19 11.7 12.3 24.0 2019 - 20 14.2 13.5 27.7 2020 - 21 16.9 14.8 31.7 2021 - 22 19.9 16.2 36.1 2022 - 23 23.3 17.7 41.0 2023 - 24 26.9 19.3 46.2 2024 - 25 31.0 20.9 51.9 2025 - 26 35.5 22.8 58.3 2026 - 27 40.5 24.7 65.2 2027 - 28 46.0 26.7 72.7 2028 - 29 52.1 28.8 80.9 2029 - 30 58.8 31.2 90.0 2030 - 31 33.6 33.6 2031 - 32 36.5 36.5 2032 - 33 39.7 39.7 2033 - 34 43.2 43.2 2034 - 35 47.1 47.1 2035 - 36 51.5 51.5 2036 - 37 56.3 56.3 2037 - 38 61.7 61.7 2038 - 39 67.8 67.8 2039 - 40 74.6 74.6

Appendix VIII Page 122 of 135
Actuarial Assessment of Pension and General Provident Fund Liabilities (as per contract with PRMP, Government of Punjab, under TA – Loan No. 2386)
Example C If it is assumed that:
• past service GP Fund liability of Rs.89.8 billion is amortized over 10 years with increasing instalments; and
• annual GP Fund contributions deducted from the salaries of the employees are
contributed to the GP Fund; the GP Fund contributions for next 30 years would be as follows:
Year
Past Liability Amortization
Instalment
Annual Regular Contribution deducted
from Salaries
Total Amount of Contribution to
GP Fund 2010 - 11 2.0 5.6 7.6 2011 - 12 3.4 6.2 9.6 2012 - 13 5.2 6.8 12.0 2013 - 14 7.8 7.5 15.3 2014 - 15 11.2 8.3 19.5 2015 - 16 15.9 9.2 25.1 2016 - 17 22.4 10.1 32.5 2017 - 18 31.1 11.1 42.2 2018 - 19 43.1 12.3 55.4 2019 - 20 59.4 13.5 72.9 2020 - 21 14.8 14.8 2021 - 22 16.2 16.2 2022 - 23 17.7 17.7 2023 - 24 19.3 19.3 2024 - 25 20.9 20.9 2025 - 26 22.8 22.8 2026 - 27 24.7 24.7 2027 - 28 26.7 26.7 2028 - 29 28.8 28.8 2029 - 30 31.2 31.2 2030 - 31 33.6 33.6 2031 - 32 36.5 36.5 2032 - 33 39.7 39.7 2033 - 34 43.2 43.2 2034 - 35 47.1 47.1 2035 - 36 51.5 51.5 2036 - 37 56.3 56.3 2037 - 38 61.7 61.7 2038 - 39 67.8 67.8 2039 - 40 74.6 74.6

Appendix IX Page 123 of 135
Actuarial Assessment of Pension and General Provident Fund Liabilities (as per contract with PRMP, Government of Punjab, under TA – Loan No. 2386)
APPENDIX IX FUNDING OPTIONS FOR PENSION FUND In view of the expected increase in annual pension benefit payments, Punjab Government has set up a Pension Fund so that a portion of pension payments can be financed directly from the Fund and the burden on provincial revenue can be reduced. The Punjab Pension Fund Act, 2007 was officially enacted (after approval from the Provincial Legislature) on March 7, 2007. Funding of the Pension Fund is to be made through budgetary allocations. Punjab Government is contemplating various possibilities of capital injections into the Fund. It is, however, extremely important to determine adequacy of capital injections versus objectives to be achieved by these contributions. Government can then decide whether it needs to make a change in proposed capital contribution amount and/or objectives of funding. Examples of some of the objectives are as follows:
i. Pension Fund is accumulated at a relatively low rate in first few (say 5) years and then earnings from the Fund are used to make payments in excess of expectations (if any) to make pension payments a smooth % of the revenue of Government of Punjab. For instance, the pension payments during a fiscal year are approximately 6% of the Revenue. If pension payments during any fiscal year is significantly in excess of 6% of Revenue due to high turnover of the employees, the additional payments may partially or fully funded by the Pension Fund assets.
ii. Alternately, if there is revenue shortfall or expenditure required by the Govt. on
some other priority area, the fiscal space generated by the Fund can be used to bridge this gap.
iii. Earnings from the Fund are used to make payments in excess of 6% of the
revenue of Government of Punjab each year for a period of 10 years. iv. Earnings from the Fund are used to make 30% of payments of the total pension
expense; the remaining 70% are met by the Government of Punjab each year for a period of 10 years.
v. Earnings from the Fund are used to make payments 50% of the payments in
excess of Rs.16 billion each year for a period of 10 years. vi. Earnings from the Fund are used to make payments in excess of 10% or 20% of
Revenue Surplus each year for a period of 10 years.

Appendix IX Page 124 of 135
Actuarial Assessment of Pension and General Provident Fund Liabilities (as per contract with PRMP, Government of Punjab, under TA – Loan No. 2386)
Based on these options, Initial lump-sum Capital required to meet the payments for the next 10 years are as follows:
Options
Initial lump-sum Capital Required
(Rs. Billion) In excess of 6% of Revenue 57.38 In excess of 7% of Revenue 21.64 In excess of 8% of Revenue 3.61 20% of total expected pension expense 67.09 25% of total expected pension expense 83.86 30% of total expected pension expense 100.63 30% in excess of Rs. 16 billion 60.63 40% in excess of Rs. 16 billion 80.84 50% in excess of Rs. 16 billion 101.05 In excess of 10% of Revenue Surplus 172.37 In excess of 20% of Revenue Surplus 21.64
Moreover, if let’s say Punjab Govt. meets the ALL cash flows for next 5 or 7 years (and builds up the capital in the Pension Fund during the period), then minimum capital required in the Fund at the end of 5 or 7 years, so that its earnings meet the cash flows for next 10 years, is provided in the table below:
(Rs. billion)
Options Capital Required after 5 years Deferral
Capital Required after 7 years Deferral
In excess of 6% of Revenue 211.35 320.59 In excess of 7% of Revenue 136.71 230.28 In excess of 8% of Revenue 69.31 139.99 20% of total expected pension expense 131.84 172.49 25% of total expected pension expense 164.80 215.62 30% of total expected pension expense 197.75 258.74 30% in excess of Rs. 16 billion 157.75 218.74 40% in excess of Rs. 16 billion 210.34 291.65 50% in excess of Rs. 16 billion 262.92 364.57 In excess of 10% of Revenue Surplus 397.00 545.23 In excess of 20% of Revenue Surplus 136.71 230.28
As can be seen, the capital requirement builds up rapidly over time since pension cash flows increase at a high rate of 14% per year. If the Fund intends to meet its objective of “50% in excess of 16 billion” starting immediately (i.e. with no deferral period), capital required is lower than the amount required for “30% of total expected pension expense”. However, if capital injection is made with a deferral period of 5 or 7 years, the situation changes significantly and less capital is required under the later objective.

Appendix IX Page 125 of 135
Actuarial Assessment of Pension and General Provident Fund Liabilities (as per contract with PRMP, Government of Punjab, under TA – Loan No. 2386)
It is, therefore, important to define objectives of the Fund clearly and accordingly work out the required capital injections to ensure that capital of the Fund does not deplete over time. In reality, it will be difficult to inject large amounts of capital in one go, therefore the Fund can set an objective of accumulating a specified amount of capital over a defined number of years with equal payments every year,
i. with the Fund starting to meet target pension benefit payments after 5, 7 or 10 years;
Given that Fund already has Rs.12 billion, annual capital contribution in the Fund required to accumulate capital of Rs.100 billion at the end of 5, 7 or 10 years are as follows:
End of year 5 7 10 Capital Required (Rs. billion) 12.41 7.28 3.57
ii. with the Fund starting to meet target pension benefit obligations immediately;
Given that Fund already has Rs.12 billion at its disposal, annual contribution required in the Fund to meet the payouts from the Fund from earnings for a period of 10 years under the following options of payouts are:
(Rs. Billion)
Type of payout to be met by the Fund
Annual Contribution Required
Total Capital at End of year 10
In excess of 6% of Revenue 12.66 138.58 25% of total expected pension expense
20.05 212.47
30% in excess of Rs. 16 billion 13.57 147.67 In excess of 10% of Revenue Surplus 44.74 459.38 In excess of 20% of Revenue Surplus 21.99 231.93
As can be seen, the target capital amount at the end of 10 years is approximately equal to the capital contributed over the 10 year period. From the tables above, it can be gauged that capital required is largely dependent upon objective of the Fund and time at which the Fund intends to begin meeting its targeted objective. Two different options for funding Pension Fund and fiscal space generated from their interest income were analyzed. The results are presented as follows:

Appendix IX Page 126 of 135
Actuarial Assessment of Pension and General Provident Fund Liabilities (as per contract with PRMP, Government of Punjab, under TA – Loan No. 2386)
Option A Assuming:
• annual contribution of Rs.10 billion is made to the Fund from the year 2010-11 to 2015-16 (i.e. the next 7 years);
• no payments are made from the Fund during the accumulation period of 7 year;
and
• after accumulation period, the Fund begins to meet pension payments from investment income on the accumulated capital at the end of 7 years;
the percentage of pension cash flows met is given in the following table:

Appendix IX Page 127 of 135
Actuarial Assessment of Pension and General Provident Fund Liabilities (as per contract with PRMP, Government of Punjab, under TA – Loan No. 2386)
(Rs. Billion)
Year Pension Expense
Contribution to the Fund
Return on Pension
Fund OR
Fiscal Space generated
Cumulative Contribution
Payment from the
Fund
Payment of Pension Liability
met by the Govt.
%age of Pension Liability
covered by Fund
2010 - 11 23.4 10.0 1.4 23.4 Nil 23.4 Nil 2011 - 12 26.6 10.0 2.8 36.3 Nil 26.6 Nil 2012 - 13 30.0 10.0 4.4 50.6 Nil 30.0 Nil 2013 - 14 35.3 10.0 6.1 66.7 Nil 35.3 Nil 2014 - 15 38.5 10.0 8.0 84.7 Nil 38.5 Nil 2015 - 16 46.6 10.0 10.2 104.8 Nil 46.6 Nil 2016 - 17 50.8 10.0 12.6 127.4 Nil 50.8 Nil 2017 - 18 59.4 - 15.3 127.4 15.3 44.1 26% 2018 - 19 67.2 - 15.3 127.4 15.3 51.9 23% 2019 - 20 77.5 - 15.3 127.4 15.3 62.2 20% 2020 - 21 89.4 - 15.3 127.4 15.3 74.1 17% 2021 - 22 101.5 - 15.3 127.4 15.3 86.2 15% 2022 - 23 118.7 - 15.3 127.4 15.3 103.4 13% 2023 - 24 130.8 - 15.3 127.4 15.3 115.5 12% 2024 - 25 154.3 - 15.3 127.4 15.3 139.0 10% 2025 - 26 177.2 - 15.3 127.4 15.3 161.9 9% 2026 - 27 196.1 - 15.3 127.4 15.3 180.8 8% 2027 - 28 219.5 - 15.3 127.4 15.3 204.2 7% 2028 - 29 249.5 - 15.3 127.4 15.3 234.2 6% 2029 - 30 263.8 - 15.3 127.4 15.3 248.5 6% 2030 - 31 277.9 - 15.3 127.4 15.3 262.6 6% 2031 - 32 303.0 - 15.3 127.4 15.3 287.7 5% 2032 - 33 319.3 - 15.3 127.4 15.3 304.0 5% 2033 - 34 343.6 - 15.3 127.4 15.3 328.3 4% 2034 - 35 366.3 - 15.3 127.4 15.3 351.0 4% 2035 - 36 389.3 - 15.3 127.4 15.3 374.0 4% 2036 - 37 415.9 - 15.3 127.4 15.3 400.6 4% 2037 - 38 445.8 - 15.3 127.4 15.3 430.5 3% 2038 - 39 478.7 - 15.3 127.4 15.3 463.4 3% 2039 - 40 532.7 - 15.3 127.4 15.3 517.4 3%
After 7 years (i.e. in 2016-17), the Fund generates a fiscal space of Rs. 15.3 billion and this amount stays constant thereafter. In real terms fiscal space generated is declining because other expenses would increase in future years due to inflation, whereas this fiscal space remains constant, resulting in a net decline in the real value of fiscal space. In the year 2016-17, the expected percentage of pension expense met by the Fund is 25% and declines to 3% in the year 2038-39. This is because, the Fund maintains its capital whereas the pension outgo keeps increasing, leading to a decline in the percentage of pension liability met by the Fund. This can be seen from the graphs below:

Appendix IX Page 128 of 135
Actuarial Assessment of Pension and General Provident Fund Liabilities (as per contract with PRMP, Government of Punjab, under TA – Loan No. 2386)
-50.0
100.0150.0200.0250.0300.0350.0400.0450.0500.0550.0
2017
2019
2021
2023
2025
2027
2029
2031
2033
2035
2037
2039
PensionExpense
FiscalSpace
Pension Expense Covered by the Fund
%age of Pension Expense Covered by the Fund
0%
5%
10%
15%
20%
25%
30%
2017
2019
2021
2023
2025
2027
2029
2031
2033
2035
2037
2039
It can be seen from the above graphs that the gap between the total pension liability and fiscal space generated increase significantly over the 30 year period and hence reduces the percentage of pension liability covered by the Fund.

Appendix IX Page 129 of 135
Actuarial Assessment of Pension and General Provident Fund Liabilities (as per contract with PRMP, Government of Punjab, under TA – Loan No. 2386)
Option B Assuming:
• annual contribution of Rs.10 billion is made to the Pension Fund say from the year 2010-11 to 2014-15 (i.e. the next 5 years);
• no payments are made from the Fund during the accumulation period; • after accumulation period, 10% of Basic Salaries is contributed annually to the
Fund; and • the Fund begins to meet pension payments from the investment income earned on
the accumulated capital and annual contributions; the percentage of pension cash flows met is given in the following table:
(Rs. Billion)
Year Pension Expense
Contribution to the Fund
Return on Pension
Fund OR
Fiscal Space generated
Cumulative Contribution
Payment from the
Fund
Payment of Pension
Liability met by the Govt.
%age of Pension Liability
covered by Fund
2010 - 11 23.4 10.0 1.4 23.4 Nil 23.4 Nil 2011 - 12 26.6 10.0 2.8 36.3 Nil 26.6 Nil 2012 - 13 30.0 10.0 4.4 50.6 Nil 30.0 Nil 2013 - 14 35.3 10.0 6.1 66.7 Nil 35.3 Nil 2014 - 15 38.5 10.0 8.0 84.7 Nil 38.5 Nil 2015 - 16 46.6 13.7 10.2 98.4 10.2 36.4 22% 2016 - 17 50.8 15.0 11.8 113.4 11.8 38.9 23% 2017 - 18 59.4 16.3 13.6 129.7 13.6 45.8 23% 2018 - 19 67.2 17.8 15.6 147.5 15.6 51.6 23% 2019 - 20 77.5 19.4 17.7 166.9 17.7 59.8 23% 2020 - 21 89.4 21.0 20.0 187.9 20.0 69.4 22% 2021 - 22 101.5 22.8 22.5 210.7 22.5 79.0 22% 2022 - 23 118.7 24.7 25.3 235.4 25.3 93.4 21% 2023 - 24 130.8 26.7 28.2 262.0 28.2 102.5 22% 2024 - 25 154.3 28.9 31.4 291.0 31.4 122.9 20% 2025 - 26 177.2 31.2 34.9 322.2 34.9 142.3 20% 2026 - 27 196.1 33.7 38.7 355.9 38.7 157.4 20% 2027 - 28 219.5 36.5 42.7 392.4 42.7 176.8 19% 2028 - 29 249.5 39.5 47.1 431.8 47.1 202.4 19% 2029 - 30 263.8 42.7 51.8 474.6 51.8 212.0 20% 2030 - 31 277.9 46.6 56.9 521.1 56.9 220.9 20% 2031 - 32 303.0 51.0 62.5 572.1 62.5 240.5 21% 2032 - 33 319.3 56.0 68.7 628.1 68.7 250.6 22% 2033 - 34 343.6 61.8 75.4 689.9 75.4 268.2 22% 2034 - 35 366.3 68.3 82.8 758.2 82.8 283.5 23% 2035 - 36 389.3 75.7 91.0 833.9 91.0 298.3 23% 2036 - 37 415.9 84.2 100.1 918.0 100.1 315.8 24% 2037 - 38 445.8 93.6 110.2 1,011.7 110.2 335.6 25% 2038 - 39 478.7 104.3 121.4 1,116.0 121.4 357.3 25% 2039 - 40 532.7 116.4 133.9 1,232.4 133.9 398.7 25%

Appendix IX Page 130 of 135
Actuarial Assessment of Pension and General Provident Fund Liabilities (as per contract with PRMP, Government of Punjab, under TA – Loan No. 2386)
After 5 years (i.e. the year 2015-16), fiscal space of Rs. 10.2 billion is generated, which continues to increase as the pension liability increases. This can be seen from the graph presented below:
-
50.0
100.0
150.0
200.0
250.0
300.0
350.0
400.0
450.0
500.0
2015
2017
2019
2021
2023
2025
2027
2029
2031
2033
2035
2037
2039
PensionExpense
FiscalSpace
Pension Expense Covered by the Fund
Although, the gap between the total pension liability and fiscal space increases, the regular contributions of a fixed percentage of basic salary assist to increase the fiscal space. Percentage of pension liability covered by the Fund remains in the range of 19% to 25%, but shows a tendency to increase after the end of the year 2038-39. This can be seen from the graph below:

Appendix IX Page 131 of 135
Actuarial Assessment of Pension and General Provident Fund Liabilities (as per contract with PRMP, Government of Punjab, under TA – Loan No. 2386)
%age of Pension Expense Covered by the Fund
0%
5%
10%
15%
20%
25%
30%
2015
2017
2019
2021
2023
2025
2027
2029
2031
2033
2035
2037
2039
It can be clearly seen from the graph above that without regular contributions to the Fund, the Fund is unable to adequately increase the fiscal space and percentage of total pension liability decreases with time. The above also reflect that it is unpractical to have the objective of accumulating sufficient assets in the Fund to make pension outgoes a completely off-budget item. Keeping in view the above options of funding methodology the Govt. needs to determine the route it wishes to adapt. Finance Department was interested to have percentage of pension payments determined if the reverse situation was taken and contributions to the Pension Fund were defined upfront that are considered to be more in the affordable range. Therefore, two additional funding options were taken into account for Punjab Government Pension Fund, which accumulates reasonable assets so that interest income on the assets can be used to smooth Pension payments as % of Revenue. The results are as follows:

Appendix IX Page 132 of 135
Actuarial Assessment of Pension and General Provident Fund Liabilities (as per contract with PRMP, Government of Punjab, under TA – Loan No. 2386)
Option C Assuming:
• annual contribution of Rs.5 billion is made to the Pension Fund say from the year 2010-11 to 2014-15 (i.e. the next 5 years);
• no payments are made from the Fund during the accumulation period; • after accumulation period, 5% of Basic Salaries is contributed annually to the
Fund; and • the Fund begins to meet pension payments from the total investment income
earned on the accumulated capital from year 2015-16 onwards; the percentage of pension cash flows met is given in the following table:
(Rs. Billion)
Year Pension Expense
Contribution to the Fund
Return on Pension
Fund OR
Fiscal Space generated
Cumulative Contribution
Payment from the
Fund
Payment of Pension
Liability met by the Govt.
%age of Pension Liability
covered by Fund
2010 - 11 23.4 5.0 1.4 18.4 Nil 23.4 Nil 2011 - 12 26.6 5.0 2.2 25.7 Nil 26.6 Nil 2012 - 13 30.0 5.0 3.1 33.7 Nil 30.0 Nil 2013 - 14 35.3 5.0 4.0 42.8 Nil 35.3 Nil 2014 - 15 38.5 5.0 5.1 52.9 Nil 38.5 Nil 2015 - 16 46.6 6.9 6.3 43.9 22.3 24.3 48% 2016 - 17 50.8 7.5 5.3 51.4 5.3 45.5 10% 2017 - 18 59.4 8.2 6.2 59.5 6.2 53.2 10% 2018 - 19 67.2 8.9 7.1 68.4 7.1 60.0 11% 2019 - 20 77.5 9.7 8.2 78.1 8.2 69.3 11% 2020 - 21 89.4 10.5 9.4 88.6 9.4 80.0 10% 2021 - 22 101.5 11.4 10.6 100.0 10.6 90.9 10% 2022 - 23 118.7 12.3 12.0 112.3 12.0 106.7 10% 2023 - 24 130.8 13.3 13.5 125.7 13.5 117.3 10% 2024 - 25 154.3 14.5 15.1 140.1 15.1 139.2 10% 2025 - 26 177.2 15.6 16.8 155.8 16.8 160.4 9% 2026 - 27 196.1 16.9 18.7 172.6 18.7 177.4 10% 2027 - 28 219.5 18.2 20.7 190.8 20.7 198.8 9% 2028 - 29 249.5 19.7 22.9 210.6 22.9 226.6 9% 2029 - 30 263.8 21.4 25.3 231.9 25.3 238.6 10% 2030 - 31 277.9 23.3 27.8 255.2 27.8 250.0 10% 2031 - 32 303.0 25.5 30.6 280.7 30.6 272.4 10% 2032 - 33 319.3 28.0 33.7 308.7 33.7 285.6 11% 2033 - 34 343.6 30.9 37.0 339.6 37.0 306.5 11% 2034 - 35 366.3 34.1 40.8 373.7 40.8 325.5 11% 2035 - 36 389.3 37.9 44.8 411.6 44.8 344.4 12% 2036 - 37 415.9 42.1 49.4 453.7 49.4 366.5 12% 2037 - 38 445.8 46.8 54.4 500.5 54.4 391.4 12% 2038 - 39 478.7 52.2 60.1 552.7 60.1 418.7 13% 2039 - 40 532.7 58.2 66.3 610.9 66.3 466.3 12%

Appendix IX Page 133 of 135
Actuarial Assessment of Pension and General Provident Fund Liabilities (as per contract with PRMP, Government of Punjab, under TA – Loan No. 2386)
After 5 years (i.e. the year 2015-16), fiscal space (based on accumulated interest on capital/contributions) of Rs. 22.3 billion is generated which pertains to 48% of the total Pension expense of 2015-16. The fiscal space generated from 2016-17 and onwards covers 9% to 13% of the expense during the next 25 years. The results can be seen from the graphs presented below:
-
100.0
200.0
300.0
400.0
500.0
600.0
2015
2017
2019
2021
2023
2025
2027
2029
2031
2033
2035
2037
2039
PensionExpense
FiscalSpace
Pension Expense Covered by the Fund
%age of Pension Expense Covered by the Fund
0%
10%
20%
30%
40%
50%
60%
2015
2017
2019
2021
2023
2025
2027
2029
2031
2033
2035
2037
2039
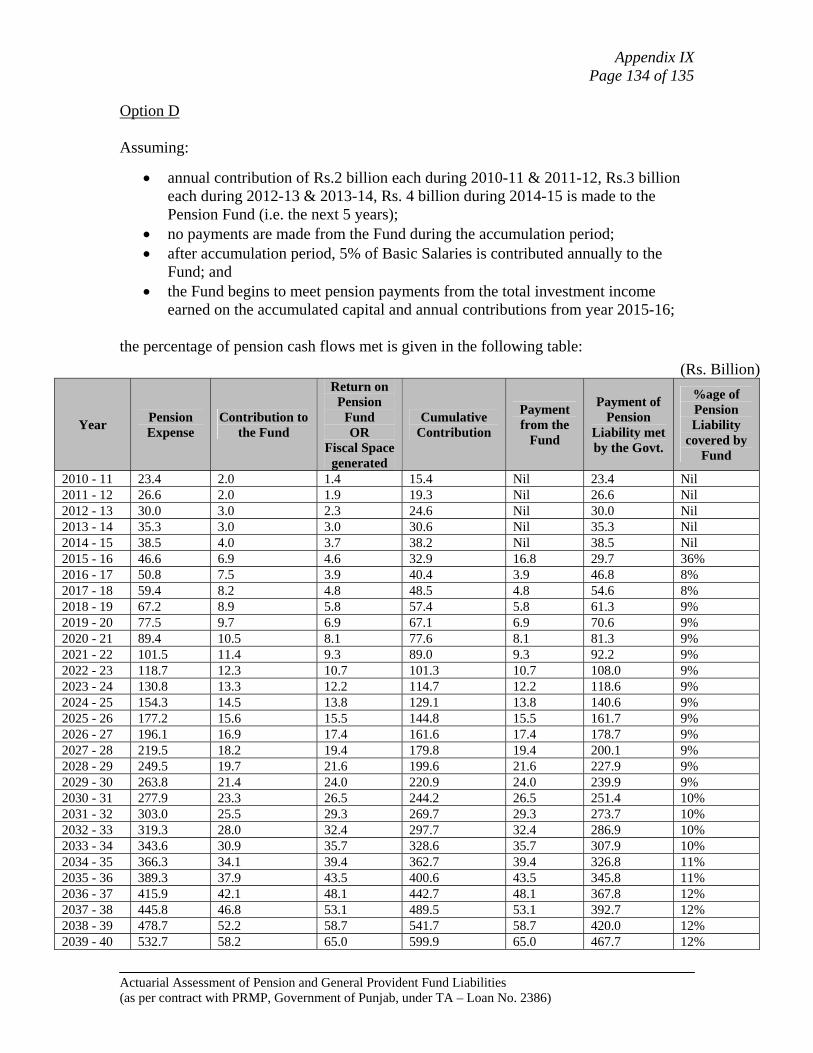
Appendix IX Page 134 of 135
Actuarial Assessment of Pension and General Provident Fund Liabilities (as per contract with PRMP, Government of Punjab, under TA – Loan No. 2386)
Option D Assuming:
• annual contribution of Rs.2 billion each during 2010-11 & 2011-12, Rs.3 billion each during 2012-13 & 2013-14, Rs. 4 billion during 2014-15 is made to the Pension Fund (i.e. the next 5 years);
• no payments are made from the Fund during the accumulation period; • after accumulation period, 5% of Basic Salaries is contributed annually to the
Fund; and • the Fund begins to meet pension payments from the total investment income
earned on the accumulated capital and annual contributions from year 2015-16; the percentage of pension cash flows met is given in the following table:
(Rs. Billion)
Year Pension Expense
Contribution to the Fund
Return on Pension
Fund OR
Fiscal Space generated
Cumulative Contribution
Payment from the
Fund
Payment of Pension
Liability met by the Govt.
%age of Pension Liability
covered by Fund
2010 - 11 23.4 2.0 1.4 15.4 Nil 23.4 Nil 2011 - 12 26.6 2.0 1.9 19.3 Nil 26.6 Nil 2012 - 13 30.0 3.0 2.3 24.6 Nil 30.0 Nil 2013 - 14 35.3 3.0 3.0 30.6 Nil 35.3 Nil 2014 - 15 38.5 4.0 3.7 38.2 Nil 38.5 Nil 2015 - 16 46.6 6.9 4.6 32.9 16.8 29.7 36% 2016 - 17 50.8 7.5 3.9 40.4 3.9 46.8 8% 2017 - 18 59.4 8.2 4.8 48.5 4.8 54.6 8% 2018 - 19 67.2 8.9 5.8 57.4 5.8 61.3 9% 2019 - 20 77.5 9.7 6.9 67.1 6.9 70.6 9% 2020 - 21 89.4 10.5 8.1 77.6 8.1 81.3 9% 2021 - 22 101.5 11.4 9.3 89.0 9.3 92.2 9% 2022 - 23 118.7 12.3 10.7 101.3 10.7 108.0 9% 2023 - 24 130.8 13.3 12.2 114.7 12.2 118.6 9% 2024 - 25 154.3 14.5 13.8 129.1 13.8 140.6 9% 2025 - 26 177.2 15.6 15.5 144.8 15.5 161.7 9% 2026 - 27 196.1 16.9 17.4 161.6 17.4 178.7 9% 2027 - 28 219.5 18.2 19.4 179.8 19.4 200.1 9% 2028 - 29 249.5 19.7 21.6 199.6 21.6 227.9 9% 2029 - 30 263.8 21.4 24.0 220.9 24.0 239.9 9% 2030 - 31 277.9 23.3 26.5 244.2 26.5 251.4 10% 2031 - 32 303.0 25.5 29.3 269.7 29.3 273.7 10% 2032 - 33 319.3 28.0 32.4 297.7 32.4 286.9 10% 2033 - 34 343.6 30.9 35.7 328.6 35.7 307.9 10% 2034 - 35 366.3 34.1 39.4 362.7 39.4 326.8 11% 2035 - 36 389.3 37.9 43.5 400.6 43.5 345.8 11% 2036 - 37 415.9 42.1 48.1 442.7 48.1 367.8 12% 2037 - 38 445.8 46.8 53.1 489.5 53.1 392.7 12% 2038 - 39 478.7 52.2 58.7 541.7 58.7 420.0 12% 2039 - 40 532.7 58.2 65.0 599.9 65.0 467.7 12%
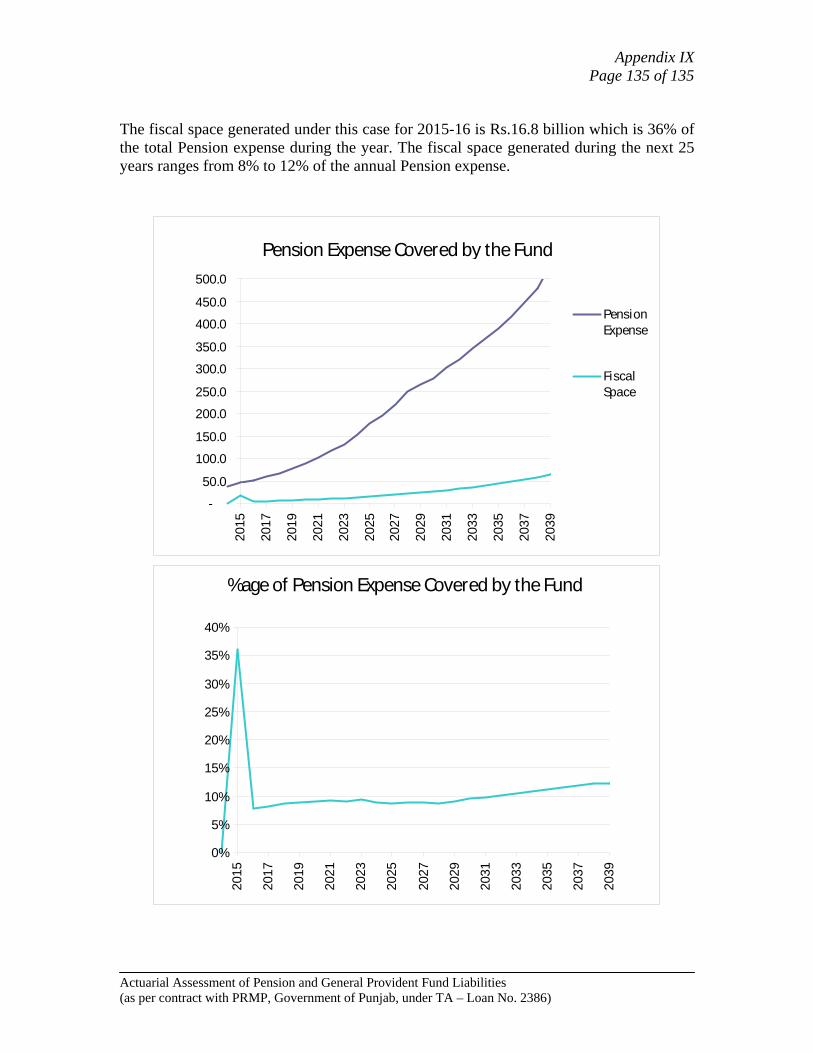
Appendix IX Page 135 of 135
Actuarial Assessment of Pension and General Provident Fund Liabilities (as per contract with PRMP, Government of Punjab, under TA – Loan No. 2386)
The fiscal space generated under this case for 2015-16 is Rs.16.8 billion which is 36% of the total Pension expense during the year. The fiscal space generated during the next 25 years ranges from 8% to 12% of the annual Pension expense.
-
50.0
100.0
150.0
200.0
250.0
300.0
350.0
400.0
450.0
500.0
2015
2017
2019
2021
2023
2025
2027
2029
2031
2033
2035
2037
2039
PensionExpense
FiscalSpace
Pension Expense Covered by the Fund
%age of Pension Expense Covered by the Fund
0%
5%
10%
15%
20%
25%
30%
35%
40%
2015
2017
2019
2021
2023
2025
2027
2029
2031
2033
2035
2037
2039