actuarial report on pension insurance 2012
TRANSCRIPT
Actuarial Report
on Pension Insurance
2012
MLSA
Social Insurance Department
2
Content
Introduction ............................................................................................................... 6
Basic Information about the Pension System ................................................. 7
Description of the System ................................................................................................................. 7
Legislative Changes Adopted since January 2008 ......................................................................... 10
Introduction of the Pension Savings System (2nd Pillar) ............................................................... 17
Saving Phase ................................................................................................................................. 17
Disbursement Phase .................................................................................................................... 20
Organization and Administration of the Pension Insurance System ........................................... 22
Statistics .................................................................................................................... 24
Revenues and Expenditure of the System ..................................................................................... 24
Number of Pensioners and Pensions ............................................................................................. 26
Amount of Pensions ......................................................................................................................... 33
Reduction of Pensions due to Early Retirement............................................................................ 41
Differentiation of Pensions by the Amount of Pension ................................................................. 42
International Comparison .................................................................................. 45
Statutory Retirement Age ............................................................................................................... 45
Effective Retirement Age (Leaving the Labour Market) ............................................................... 48
Pension-Drawing Time .................................................................................................................... 50
Adequacy of Pensions ...................................................................................................................... 51
Measure of Solidarity (Redistribution) .......................................................................................... 52
Costs .................................................................................................................................................. 53
International Commitments of the Czech Republic ................................... 54
Old-age Pension ............................................................................................................................... 54
Class 3 Disability Pension................................................................................................................ 56
Survivors’ Pensions ......................................................................................................................... 57
Analysis of the Development of the Pension System ................................. 59
Dynamic Micro-Simulation Model .................................................................................................. 59
Demographic Framework ............................................................................................................... 60
Fertility ......................................................................................................................................... 61
Mortality ....................................................................................................................................... 63
Age Structure ................................................................................................................................ 66
Economic Framework ..................................................................................................................... 68
3
Labour Market .............................................................................................................................. 68
Employment ............................................................................................................................. 70
Unemployment ......................................................................................................................... 75
Economic Performance ............................................................................................................... 79
Labour Productivity and Wages ............................................................................................. 79
GDP ............................................................................................................................................ 82
Rates of Return ............................................................................................................................. 83
Development of Pension System Indicators .................................................................................. 83
Principal Aggregate Indicators ................................................................................................... 83
Revenues from Contributions ................................................................................................. 83
Pension Expenditure ............................................................................................................... 84
Balance of Revenues from Contributions and Pension Expenditure ................................... 85
Cumulative Balance and Implicit Debt ................................................................................... 86
Amount of Pensions ................................................................................................................. 89
Analytical Indicators .................................................................................................................... 93
Pension Expenditure ............................................................................................................... 93
Numbers of Pensioners ........................................................................................................... 95
Implicit Debt ........................................................................................................................... 100
Amount of Pensions ............................................................................................................... 101
Insurance Period .................................................................................................................... 102
Contributions Payment Period ............................................................................................. 105
Effects of Temporary Changes in the Indexing of Pensions ....................................................... 107
Analysis of the Entry to the Second Pillar .................................................................................... 110
Methodology of Assessment ..................................................................................................... 110
Effects of the Age ........................................................................................................................ 111
Entire Population ................................................................................................................... 111
Men and Women .................................................................................................................... 112
Effects of Earnings, Insurance Period, Decision when to Retire, Contributions Payment
Period and Excluded Period ...................................................................................................... 113
Amount of Earnings ............................................................................................................... 114
Entire Population ............................................................................................................... 114
Men and Women ................................................................................................................ 117
Insurance Period .................................................................................................................... 120
Entire Population ............................................................................................................... 120
4
Men and Women ................................................................................................................ 122
Decision when to Retire ........................................................................................................ 122
Entire Population ............................................................................................................... 122
Men and Women ................................................................................................................ 124
Contributions Payment Period ............................................................................................. 124
Entire Population ............................................................................................................... 124
Men and Women ................................................................................................................ 126
Excluded Period ..................................................................................................................... 127
Entire Population ............................................................................................................... 127
Men and Women ................................................................................................................ 128
Summary .................................................................................................................................... 129
Conclusion .............................................................................................................. 130
Appendix 1- Example of Old-Age Pension Calculation ............................ 133
Example .......................................................................................................................................... 133
Calculation ...................................................................................................................................... 133
Determining Retirement Age .................................................................................................... 133
Determining the Insurance Period Acquired Up Until Becoming Entitled to Old-Age Pension
..................................................................................................................................................... 133
Determining the Reference Period ........................................................................................... 133
Determining the Yearly Assessment Bases for Individual Years of the Reference Period .. 133
Setting the Personal Assessment Base ..................................................................................... 134
Setting the Calculation Base ...................................................................................................... 135
Setting the Percentage Amount of Pension.............................................................................. 135
Increased Percentage Amount by the Period of Gainful Activity Carried out After
Entitlement to the Old-Age Pension ......................................................................................... 135
Setting the Basic Amount of the Old-Age Pension ................................................................... 136
Total Amount of the Old-Age Pension ...................................................................................... 136
Appendix 2 – Overview of Main Measures Adopted Since 1990 .......... 137
Period 1990 to 1996 ...................................................................................................................... 137
Period 1997 to 2008 ...................................................................................................................... 138
2010 ................................................................................................................................................ 139
2011 ................................................................................................................................................ 140
Appendix 3 – Description of the Dynamic Micro-Simulation Model .. 142
Modelled objects – model points .................................................................................................. 142
5
Model Calculations ......................................................................................................................... 142
Events ......................................................................................................................................... 142
Career Paths ............................................................................................................................... 143
Family Relations ........................................................................................................................ 144
Cash Flows .................................................................................................................................. 144
Wage Modelling.......................................................................................................................... 145
Fund Pillar Modelling ................................................................................................................ 145
Model Assumptions ....................................................................................................................... 146
Macroeconomic Assumptions ................................................................................................... 146
Assumptions for the Fund Pillar ............................................................................................... 146
Main Output Variables of the Model ............................................................................................. 147
Inputs of the Dynamic Micro-Simulation Model ......................................................................... 148
Model Points ............................................................................................................................... 148
Decision-Making Processes ....................................................................................................... 148
Sources of Data for Model Points .................................................................................................. 149
Probabilities of Transfer between Working Statuses ............................................................. 151
Data Sources for the Decision-Making Processes ....................................................................... 152
Appendix 4 – Increase in Retirement Age ................................................... 154
Appendix 5 – List of Abbreviations ................................................................ 155
List of Charts .......................................................................................................... 156
List of Tables ......................................................................................................... 160
List of Figures ........................................................................................................ 161

6
Introduction
Since 2002, the Ministry of Labour and Social Affairs has been publishing periodical Actuarial Reports
to inform the broad professional community and the general public about anticipated developments
in the field of social insurance. The last of them was published in 2008; the reason why the next one
is published only in 2012 (and not in 2010, as its regular two-year interval would otherwise dictate)
consists in fairly dynamic developments and many changes in the field of pension insurance,
particularly in 2010 and 2011. We believe the postponement will benefit the publication, enhancing
the contribution it brings and its topical nature.
Another major change is a narrower focus of the report; it now concentrates only on pension
insurance rather than on the whole area of social insurance. The aim is to distinguish between short-
term (sickness insurance) and long-term (pension insurance) segments. Although both of them are
parts of the social insurance system, we believe they are so different that each of them merits a
separate analysis of its own – you can also interpret the above statement as an announcement of a
monothematic report devoted solely to sickness insurance, which should be published shortly.
The last important change we would like to draw the readers’ attention to in the very beginning of
the report is the use of outputs produced by a qualitatively new tool – a dynamic micro-simulation
model. The Ministry of Labour and Social Affairs thus ranks among just a few institutions that can use
such an advanced tool to model developments of the pension system. We would like to make use of
this opportunity to thank Deloitte Advisory, the company which helped the Ministry of Labour and
Social Affairs develop and implement the model.
The first two parts of the Actuarial Report describe the current state of the pension system from
legislative and statistical viewpoints. The legislative part briefly describes the changes made since
2008. The statistical part quantifies the present state of the pension system. Next comes a part
setting the Czech Republic’s pension system into the international context. The body of the report
consists of analytical chapters, which contain a description and analysis of demographic and
economic factors influencing the pension system. Their impacts are summarized in the final part,
which presents a projection of the pension system development in the next almost seventy years.
The present Actuarial Report is the fifth of its kind and concludes a decade (2002 – 2012) of efforts of
the Social Insurance Department to provide good and objective information on the state and
development of the pension system in the Czech Republic. We believe the fairly voluminous report
will become a valuable source of information about our pension system and we will appreciate any
suggestions and comments which will help improve the content of its successors.
We wish you a pleasant reading.
7
Basic Information about the Pension System
Description of the System The roots of the Czech pension system date back to the early 1990s, which marked the beginning of
step-by-step reforms culminating in the adoption of Act No. 155/1995 Coll., on pension insurance
(hereinafter “the Pension Insurance Act”), which came into effect on January 1, 1996. Between then
and now, however, there have been many additional reform steps taken while the Act has been in
effect.
The basic pension insurance system is based on several general principles, including social solidarity,
pay-as-you-go financing, mandatory participation of all economically active individuals (subject to
certain conditions), defined-benefit pensions, uniformity and dynamic character (with many
elements in the calculation formula undergoing annual “automatic” modifications based on and
taking into account economic developments).
The pension system provides a compensation of income in the event of old age (old-age pension),
disability (disability pension) or death of the provider (widow’s, widower’s and orphan’s pension).
The pension comprises two components and is calculated using the following formula:
, where
NP – new pension
BA – basic amount
PA – percentage amount
The basic amount represents the solidarity element in the pension calculation formula. Every
pensioner is entitled to an identical basic amount, which is equal to 9 % of the general assessment
base (GAB)1.
The percentage amount depends on the length of the insurance period and the calculation base,
which is in turn derived from the earnings of the individual during his or her productive career2. It is
calculated using the following formula:
, where
PA – percentage amount
BPCB – basic percentage of the calculation base
CB – calculation base
The basic percentage of the calculation base is a product of the insurance period and the percentage
rate per year of insurance. The insurance period results from payments of insurance contributions, or
can be granted in the form of covered non-contributory insurance period. The latter applies to
1 The General assessment base is in fact the average salary applying to the year in which the pension is
calculated, and is stipulated by a regulation of the Ministry of Labour and Social Affairs. 2 The approach is different in the case of survivors’ benefits (so-called derived pensions), which are calculated
as a percentage of the pension of the deceased (50% for widow’s and widower’s pensions, 40% for orphan’s pensions).
8
certain defined social situations which may occur during an individual’s working career, including
care of children or unemployment. As to disability pensions, a so-called additional period is added to
the insurance period the individual in question is entitled to, which is the difference between the
time the disability pension is granted and the retirement age applying to men of the same date of
birth.
The basic percentage of the calculation base is calculated as follows:
(
) , where
IP1 – 100% covered insurance period
IP2 – 80% covered insurance period
PR – percentage rate per year of insurance
The period of gainful activities (establishing the participation in the pension insurance system) is
always included in full; the same applies to some non-contributory insurance periods (care of a child
below four years of age, care of a person dependent on another person’s care and falling into a
specific dependence category, compulsory military service). Only 80% of the period for the remaining
non-contributory insurance periods is credited. The total insurance period is important not only from
the viewpoint of the calculation of the pension, but also for the decision whether there exists a right
to a pension or not. The Pension Insurance Act specifies minimum insurance periods needed to
establish a right to a pension.
The total insurance period in days is divided by 365 to obtain the insurance period in years; every
year of the total insurance period is assigned an appropriate percentage of the calculation base.
The percentage rate per year of insurance is 1.5 for old-age pensions and class 3 disability pensions.
It is 0.75 and 0.5 for class 2 and class 1 disability pensions, respectively.
The other element playing an important role in the calculation of the percentage amount is the
assessment base (earnings) of the insured person during the reference period3. All assessment bases
are indexed to reflect the development of the general assessment base (average wage). The personal
assessment base is calculated as the average monthly earnings of the insured person during his/her
reference period. The personal assessment base is then adjusted to the calculation base using the
following formula:
( ( )) ( ) ( ( )) , where
CB – calculation base
PAB – personal assessment base
rl1, rl2 – first (44% GAB) and second (400% GAB) reduction limits
rp1, rp2 – percentages credited up to the first (100 %) and the second (26 %) reduction limits
3 The reference period covers the whole history of earnings of every insured person, but the earnings prior to
1986 are disregarded (chiefly because of insufficient quality of the data).
9
The application of the reduction limits is another element of solidarity in the pension system.
Basically, the reduction limits mean that higher earnings count less than lower earnings in the
pension calculation formula. Earnings above the second reduction limit are not taken into account at
all.
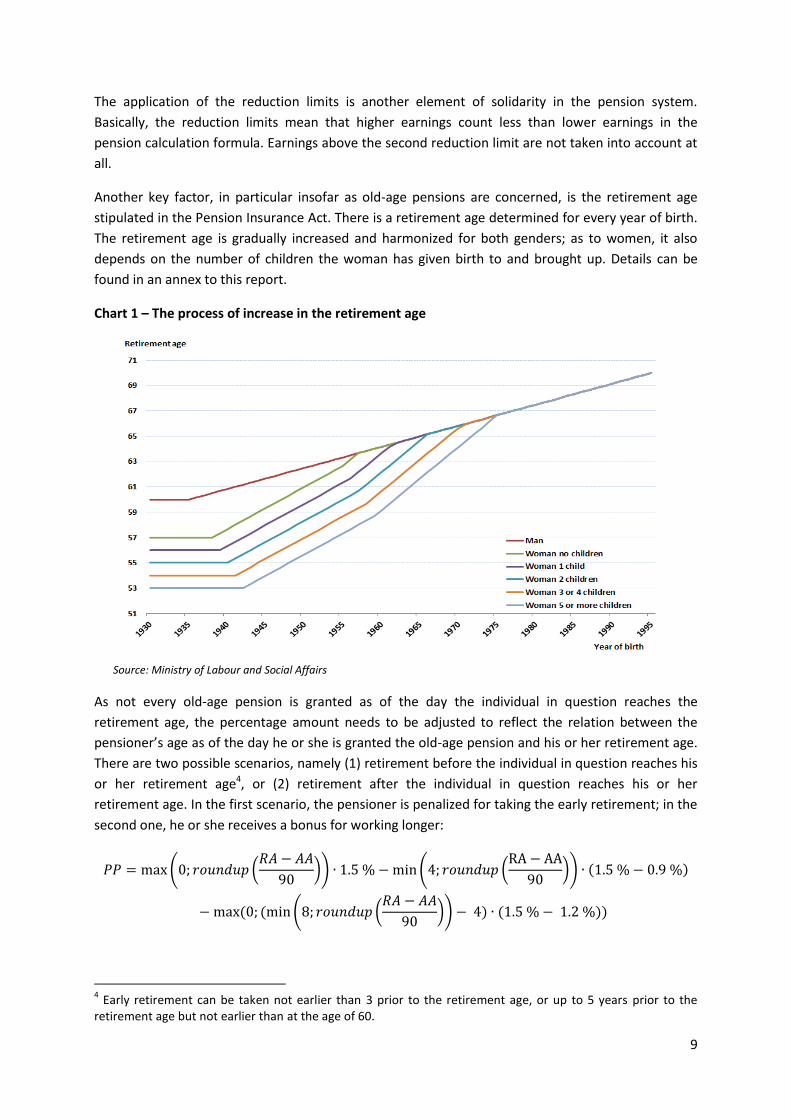
Another key factor, in particular insofar as old-age pensions are concerned, is the retirement age
stipulated in the Pension Insurance Act. There is a retirement age determined for every year of birth.
The retirement age is gradually increased and harmonized for both genders; as to women, it also
depends on the number of children the woman has given birth to and brought up. Details can be
found in an annex to this report.
Chart 1 – The process of increase in the retirement age
Source: Ministry of Labour and Social Affairs
As not every old-age pension is granted as of the day the individual in question reaches the
retirement age, the percentage amount needs to be adjusted to reflect the relation between the
pensioner’s age as of the day he or she is granted the old-age pension and his or her retirement age.
There are two possible scenarios, namely (1) retirement before the individual in question reaches his
or her retirement age4, or (2) retirement after the individual in question reaches his or her
retirement age. In the first scenario, the pensioner is penalized for taking the early retirement; in the
second one, he or she receives a bonus for working longer:
( (
)) ( (
)) ( )
( ( ( (
)) ) ( ))
4 Early retirement can be taken not earlier than 3 prior to the retirement age, or up to 5 years prior to the
retirement age but not earlier than at the age of 60.
10
( (
)) , where
PP – penalization
BO – bonus
RA – retirement age
AA– actual retirement age
The early retirement penalization depends on how prematurely the early retirement is taken. For the
first 360 days, the percentage amount is reduced by 0.9% of the calculation base for every 90-day
period (even incomplete); between days 361 and 720, the percentage amount is reduced by 1.2% of
the calculation base for every 90-day period (even incomplete); and from then until the regular
retirement age, by 1.5% of the calculation base for every 90-day period (even incomplete).
The late retirement bonus consists in an increase of the old-age percentage amount by 1.5% of the
calculation base for every 90-day period (calendar days) of gainful activities performed after the
regular retirement date without the person in question actually taking the pension.
The amount of survivors’ benefits (widow’s, widower’s and orphan’s pensions) is derived from the
percentage amount of the old-age or class 3 disability pension the deceased would have been
entitled to as of the day of his/her death.
Legislative Changes Adopted since January 2008 Government s No. 256/2007 Coll. – effective from January 1, 2008. As of January 2008, the basic
amount of pensions was raised to CZK 1,700 and the percentage amount of pensions paid out to
beneficiaries by 3%.
Government Decree No. 257/2007 Coll. – effective from January 1, 2008. The Decree set the general
assessment base for 2006 (CZK 20,050), raised the reduction limits to CZK 10,000 and CZK 24,800,
respectively, and set the conversion coefficient for adjusting the general assessment base for 2006
(1.0753).
Government Decree No. 258/2007 Coll. – effective from January 1, 2008. As of January 2008, the
supplements to pensions pursuant to Government Decree No. 622/2004 Coll., as amended, and Act
No. 357/2005 Coll., as amended, were increased by 3% of the amount of the supplement the
beneficiary was entitled to as of the day of the increase.
Act No. 261/2007 Coll. – effective from January 1, 2008. The Act has expanded the scope of persons
participating in the basic pension insurance system through non-contributory insurance periods,
adding persons taking care of a disability class 1 person below 10 years of age and dependent on
another person’s care. In connection with the introduction of the maximum assessment base
applying to contribution-paying employees, the Act stipulated the aggregate assessment base of the
insured person in a single calendar year since 2007 assessment should not be higher than the
maximum contribution assessment base.
Act No. 178/2008 Coll. – effective from May 28, 2008. The Act provided for an extraordinary increase
of pensions in the event of an increase of prices by at least 5% (until then by at least 10%). In
11
supplement, the Act stipulated that the extraordinary increase of pensions would come into effect as
of the August 2008 pension payment date, i.e. outside the regular schedule.
Government Decree No. 211/2008 Coll. – effective from August 1, 2008. As of August 2008, the basic
amount of pensions granted before August 1, 2008, was increased to CZK 2,170; the basic amounts
of pensions granted since July 31, 2008, amount to CZK 2,170 per month.
Government Decree No. 212/2008 Coll. – effective from August 1, 2008. As of August 2008, the
supplements to pensions pursuant to Government Decree No. 622/2004 Coll., as amended, and Act
No. 357/2005 Coll., as amended, were increased by 3.6% of the amount of the supplement the
beneficiary was entitled to as of the day of the increase.
Act No. 306/2008 Coll. – effective basically from January 1, 2010. The Act introduces, in particular,
measures implementing parametric changes of the basic pension insurance system.
Compared to the legislation in effect prior to the adoption of the above Act, the most important
approved changes include:
a step-by-step extension of the insurance period needed to establish a right to an old-age
pension from 25 to 35 years, including non-contributory periods, or to 30 years without non-
contributory periods,
a step-by-step reduction of non-contributory periods credited to insurance period for the
purpose of establishing a right to an old-age pension to 80%, except for the non-contributory
periods attributable to care of a child below four years of age, care of a person dependent on
another person’s care, and former compulsory military service,
a continuing step-by-step increase of the retirement age to 65 years for men and women
who have not brought up any child, or have brought up just one child, and to 62 to 64 years
(depending on the number of children) for women who have brought up at least two
children, and of the age limit establishing a right to an old-age pension in the event of a
shorter insurance period,
a step-by-step extension of the period during which the insured person can opt for an early
retirement from three to five years,
the cancellation of the condition consisting in the existence of an employment contract
concluded for a period of at least one year as a prerequisite of the right to an old-age
pension (in addition to earnings from gainful activities),
increasing the percentage amount of old-age pensions for a period of any gainful activity
performed after the individual in question becomes entitled to an old-age pension by 0.4% of
the calculation base for every 360 calendar days (if he or she takes his or her old-age pension
in full amount), or by 1.5% of the calculation base for every 180 calendar days (if he or she
takes only a half of his or her old-age pension),
a change of the full disability pension to an old-age pension in the same amount upon
reaching the age of 65,
a unification of the existing fixed age limit applying to a “permanent” right of women to a
widow’s pension (55 years) and of men to a widower’s pension (58 years) to an age limit four
years lower than the retirement age of men of the same date of birth,
12
a new definition of disability (three classes/categories of disability), with a “permanent”
protection of the amounts of existing partial disability pensions in the event of a change of
the disability classification from class 2 to class 1 (until then there were just two disability
pension types, full and partial),
a unification of the age limit in respect whereof the so-called additional credited period is
determined for the purpose of calculating the disability percentage amount for men and
women (the limit applying to both men and women is now the retirement age of women of
the same date of birth who have not brought up any child),
an increased reduction of the percentage amount in the event of an early retirement
between Day 721 and the day the individual in question reaches the regular retirement age.
Government Decree No. 363/2008 Coll. – effective from January 1, 2009. As of January 2009, the
percentage amount of pensions was increased by 4.4% of the percentage amount the individual in
question was entitled to as of the day the increase became effective.
Government Decree No. 364/2008 Coll. – effective from January 1, 2009. As of January 2009, the
supplements to pensions pursuant to Government Decree No. 622/2004 Coll., as amended, and Act
No. 357/2005 Coll., as amended, were increased by 4.4% of the amount of the supplement the
beneficiary was entitled to as of the day of the increase.
Government Decree No. 365/2008 Coll. – effective from January 1, 2009. The Decree set the general
assessment base for 2007 (CZK 21,527), raised the reduction limits to CZK 10,500 and CZK 27,000,
respectively, and set the conversion coefficient for adjusting the general assessment base for 2007
(1.0942).
Act No. 382/2008 Coll., amending Act No. 435/2004 Coll., on employment, as amended, Act No.
326/1999 Coll., on the residence of aliens in the territory of the Czech Republic, as amended, and
other related acts – effective from January 1, 2009. The change of the Pension Insurance Act consists
in the period of time during which the individual in question was registered as a job applicant by a
Labour Office, but during which he or she was not receiving any unemployment benefits or
requalification support before the age of 55 being credited as a non-contributory period only up to
one year for the purpose of calculating the pension. At the same time, the Act stipulates that the
participation of persons registered as job applicants by the Labour Office in the pension system
before the 55th year of age is judged according to legal acts regulations in force before the day the
Act came into effect, providing such persons had become entitled to an old-age pension before the
Act came into effect.
Government Decree No. 339/2009 Coll. – effective from January 1, 2010. The Decree set the general
assessment base for 2008 (CZK 23,280) and the conversion coefficient for adjusting the general
assessment base for 2008 (1.0184).
Government Decree No. 340/2009 Coll. – effective from January 1, 2010. The Decree increased, in
accordance with Section 6, Paragraph 4, of Act No. 357/2005 Coll., on the financial contribution paid
to participants in the national struggle for the formation and liberation of Czechoslovakia and some
of their survivors, on a special supplement to old-age pension of certain persons, on a one-time sum
paid to some participants in the national struggle for liberation between 1939 and 1945, and
amending some other acts, the special supplement to the pension as follows:
13
a. for the eligible persons listed in Section 5, Paragraph 1, Subparagraphs a) and c), of the Act
by CZK 176 to CZK 2,676 a month,
b. for the eligible persons listed in Section 5, Paragraph 1, Subparagraph b), of the Act, and
widows and widowers referred to in Section 5, Paragraph 2, of the Act by CZK 88 to CZK
1,338 a month.
Any special supplement to the pension granted before January 1, 2010, will be increased from the
payment of the pension with which it is paid and which is due after December 31, 2009.
Government Decree No. 281/2010 Coll. – effective from January 1, 2011. As of January 2011, the
basic amount of pensions was raised to CZK 2,230 and the percentage amount of pensions paid out
to beneficiaries by 3.9%.
Government Decree No. 282/2010 Coll. – effective from January 1, 2011. As of January 2011, the
supplements to pensions pursuant to Government Decree No. 622/2004 Coll., as amended, and Act
No. 357/2005 Coll., as amended, were increased by 3.9% of the amount of the supplement the
beneficiary was entitled to as of the day of the increase.
Government Decree No. 283/2010 Coll. – effective from January 1, 2010. The Decree set the general
assessment base for 2009 (CZK 24,091), raised the reduction limits to CZK 11,000 and CZK 28,200,
respectively, and set the conversion coefficient for adjusting the general assessment base for 2009
(1.0269).
Act No. 220/2011 Coll., amending Act No. 155/1995 Coll., on pension insurance, as amended, and
some other acts [an amendment of the Pension Insurance Act, dealing mainly with effects of a
Constitutional Court finding which repealed Section 15 of the Act] – the Constitutional Court found
Section 15 of the Pension Insurance Act, stipulating how the calculation base used to calculate the
percentage amount of the pension and the reduction limits are determined, unconstitutional
(Finding Pl. ÚS 8/07, promulgated under No. 135/2010 Coll. – hereinafter “the Constitutional Court
finding”). However, the finding did not dispute the existence of the reduction limits per se, as one of
the elements of the pension calculation formula.
The most important changes of the Pension Insurance Act directly related to the Constitutional Court
finding referred to above are as follows:
Reduction limits – clear rules on how the reduction limits used to calculate the calculation
base should be determined are now stipulated directly in the Act; they are tied to the
average wage and the objective is to have the first and second reduction limits of 44% and
400%, respectively, after 2014.
Personal assessment base amount credited with respect to the reduction limits – the target
state after 2014: 100% of the personal assessment base will be credited up to the first
reduction limit; 26% between the first and second reduction limits; and 0% above the second
reduction limit.
Basic amount of pension – the basic amount of pensions is firmly tied to the average wage,
just like in the case of reduction limits, and amount to 9% of the average wage.
Extension of the reference period– the length of the period relevant for the determination of
the personal assessment base will gradually be increased from the present target state of 30
years to the whole life; just like now, earnings prior to 1986 will not be taken into account
14
(for the purpose of calculating the pension, the time of studies will be deemed to be the so-
called excluded period in order not to dilute actual earnings achieved during the reference
period).
Other parametric changes that are expected to contribute to the financial sustainability of the basic
pension insurance system or elaborate the legislation currently in effect are as follows:
a continuing increase of the retirement age even after 65 years of age and an accelerated
unification of the retirement age both for men and women,
the increase of average pensions will match the consumer price index growth plus one third
of the growth of real wages,
a less steep scale of the percentage reduction of the percentage amount in the event of an
early old-age retirement - between Days 361 and 720, the percentage amount will reduced
by 1.2% of the calculation base for every 90-day period (even incomplete), compared to
existing 0.9%,
the payment of a one-time amount upon the extinction of the right to a widow’s/widower’s
pension on the grounds of a new marriage will be cancelled, as it does not bring the expected
effect,
the deadline for a re-established right to a widow’s/widower’s pension (subject to
compliance with legal requirements and conditions) will be reduced from five to two years
with respect to rights established after December 31, 2011.
Ordinance No. 286/2011 Coll. – effective from January 1, 2012. The Ordinance defines:
elements of the calculation formula of pensions granted in 2012, namely:
o the 2010 general assessment base in the amount of CZK 24,526,
o the 2010 conversion coefficient for adjusting the general assessment base, which is
equal to 1.0249,
o the first reduction limit applying to the calculation base, which is equal to CZK
11,061,
o the second reduction limit applying to the calculation base, which is equal to CZK
29,159,
o the third reduction limit applying to the calculation base, which is equal to CZK
100,548,
o the basic amount of old-age, disability, widow’s, widower’s and orphan’s pensions in
2012, in the amount of CZK 2,270;
pension increases in 2012. Old-age, disability, widow’s, widower’s and orphan’s pensions
granted before January 1, 2012, were increased as of the pension payment due and payable
after December 31, 2011, as follows:
o the basic amount was increased by CZK 40 to CZK 2,270, and
o the percentage amount was increased by 1.6% of the percentage amount the
beneficiary is entitled to as of the day of the increase.
Ordinance No. 287/2011 Coll. – effective from January 1, 2012. As of January 2012, the supplements
to pensions pursuant to Government Decree No. 622/2004 Coll., as amended, and Act No. 357/2005
15
Coll., as amended, were increased by 1.6% of the amount of the supplement the beneficiary was
entitled to as of the day of the increase.
Act No. 428/2011 Coll., which amends some acts in connection with the passage of the Act on
Pension Savings and Act on Supplementary Pension Savings – effective from January 1, 2013. The Act
reflects effects of the introduction of pension savings (second pillar) of the pension system by Act No.
426/2011 Coll. on the basic pension insurance system (first pillar). The most important changes in
this respect include:
the percentage amount of old-age pensions – the percentage amount of the old-age pension
of a person participating in the pension insurance system amounts to 1.5% of the calculation
base/month for each whole year of that part of the insurance period credited to the
beneficiary on the grounds of his/her gainful activities performed until the establishment of
the right to the pension during which the beneficiary did not participate in the pension
savings system; and 1.2% of the calculation base per month for each whole year of that part
of the insurance period credited to the beneficiary on the grounds of his/her gainful activities
performed until the establishment of the right to the pension during which the beneficiary
participated in the pension savings system. The lower percentage rate of 1.2% of the
calculation base for the insurance period related to the first pillar shall apply only to that part
of the insurance period based on gainful activities during which the beneficiary participated
in the pension savings system, and not to any non-contributory insurance periods (these will
be added to that part of the insurance period during which the beneficiary did not
participate in the pension savings system (i.e. the second pillar).
A class 3 disability pension beneficiary, who participates in the second pillar and whose class
3 disability pension is paid out from the first pillar, will not have his/her disability pension
“automatically” converted into an old-age pension in the same amount upon reaching the
age of 65 or the applicable retirement age, whichever occurs later; if he or she wants to
continue to receive the pension, he or she has to submit an application for
o either an old-age pension paid out from the first pillar, the percentage amount of
which will be reduced to reflect the time for which the beneficiary has participated in
the second pillar pension savings system, as the beneficiary will also be entitled, as of
the day he or she is granted a first-pillar old-age pension, to a benefit from the
second pillar; or
o an old-age pension paid out from the first pillar, in the amount equal to that of the
existing class 3 disability pension, subject to a transfer of 60% of the sum saved in the
second pillar to the state budget. The beneficiary can make use of the balance of the
sum saved in the second pillar (40%) in a standard manner, i.e. to settle a one-time
pension insurance premium to purchase a second pillar pension from the insurance
company.
a survivor’s pension resulting from the deceased’s participation in the pension savings
system – the old-age pension the deceased spouse would have been entitled to at the time
of his/her death does not take into account his/her participation in the pension savings
system; if the deceased spouse had already been granted an old-age pension prior to his/her
death, the calculation of which reflected his/her participation in the pension savings system,
the percentage amount of the widow’s/widower’s pension will be based on the percentage
16
amount of the old-age pension of the deceased spouse in the amount the deceased spouse
would have been entitled to if his/her participation in the pension savings system had not
been taken into account. The above provision applies mutatis mutandis also to orphan’s
pensions.
participation of self-employed persons in the pension savings system – as to self-employed
persons, the whole time during which the self-employed person in question performed
his/her gainful activities will be deemed to constitute the insurance period concurrent with
self-employed person’s participation in the pension savings system, subject to the time of
the self-employed person’s participation in the pension savings system covering at least a
part of the time during which the self-employed person in question performed his/her
gainful activities establishing his/her participation in the pension insurance system.
Act No. 470/2011 Coll., amending Act No. 187/2006 Coll., on sickness insurance, as amended, and
some other acts - effective from January 1, 2012.
As to the Pension Insurance Act, the most important changes include:
supplements to the range of persons eligible for pension insurance – the persons eligible for
pension insurance now include new supplements (directors of public benefit organizations
performing work for which they are remunerated, but not under an employment contract;
authorized agents of companies, whose income resulting from the performance of their
activities as authorized agents is regarded as an income from dependent activities under the
Income Act; members of collective bodies of legal entities who are remunerated for their
work in such bodies and whose income, including any emoluments, resulting from the
performance of their activities is regarded as an income from dependent activities under the
Income Act; receivers whose income resulting from the performance of their activities as
receivers is regarded as an income from dependent activities under the Income Act; heads of
organizational units of legal entities which have their seat in countries with which the Czech
Republic has not signed an international social security agreement, if the organizational unit
is registered in the Commercial Register and the permanent place of performance of work of
these managers is the Czech Republic).
a change of the definition of the person to the care of whom the orphaned child is entrusted
for the purpose of the right to an orphan’s pension – an unprovided-for child is entitled to an
orphan’s pension if the person whom the child has been entrusted to for the purpose of care
substituting the parental care on the basis of a court ruling entrusting the child to the care of
another person or to shared care of a married couple dies. If the conditions applying to the
right to an orphan’s pension before January 1, 2012, are not met solely because that the
child entrusted to care substituting the parental care on the basis of a court ruling entrusting
the child to the care of another person or to shared care of a married couple was not
prevalently dependent on the deceased with respect to being provided for as of the day of
the deceased’s death, the orphan’s pension will be granted as of January 1, 2012, subject to
all conditions stipulated by the law being met (Section 52 of the Pension Insurance Act,
including the condition that the child is unprovided for).
an alternative condition establishing the right to an orphan’s pension – the right to an
orphan’s pension will also be established if the insured person has accumulated at least a
half of the time needed to establish the right to a disability pension according to the Pension
17
Insurance Act as of the day of the insured person’s death. The amount of the orphan’s
pension will continue to be calculated in accordance with the existing legislation in effect.
The percentage amount of pension must not be lower than 40% of the minimum percentage
amount equal to CZK 770, i.e. CZK 308 (the basic amount will be paid out in full). The
approved change will also apply to cases in which the conditions needed to establish the
right to an orphan’s pension had been met before the above Act came into force; in such
cases, the right to an orphan’s pension (subject to new conditions being complied with as
well) becomes financially effective as of January 1, 2012.
Introduction of the Pension Savings System (2nd Pillar) The present pension system of the Czech Republic is characterized by an extreme measure of dominance of pensions paid out from the state pay-as-you-go pillar – pension insurance – in the overall old-age incomes. The state pensions account for almost 95% of the income of old-age pensioners. The situation makes the old-age pensioners exposed to increased risks, which was why a decision was made to introduce a new system, supplementing the state pension insurance system by a pension from a saving, fund-financed system - the so-called second pillar.
The second pillar was introduced by the adoption of Act No. 426/2011 Coll., on pension savings, enacted in December 2011 and coming into effect in a way which will make the second pillar available to clients as of January 1, 2013.
The participation in the new fund-financed pension system can be divided into two wholly different
phases – savings and disbursement.
Saving Phase
During the saving phase, the pension savings system participant accumulates funds on his/her individual account. The amounts deposited, as well as the dates and manner of payments made to the account, will be subject to the same arrangements as payments to the state pension insurance system, which means they will be tied to the participant’s earnings.
Pension companies
During the saving phase, the funds accumulated in the second pillar will be managed by pension companies. It is anticipated the pension companies will result mainly from the transformation of existing pension funds, but new companies will be able to enter the market as well. The pension companies will have to obtain a special license granted by the Czech National Bank. Every pension company will be obliged to offer four mandatory pension funds differing in their investment limits, portfolio structures and risks resulting therefrom, namely the fund of government bonds, conservative fund, balanced fund and dynamic fund. The first one will invest solely into government bonds of the Czech Republic or into accurately specified bonds of other EU or OECD countries. The other three funds will invest into a broader spectrum of instruments in accordance with so-called investment limits set by the law. In 2012, the pension funds are being transformed into pension companies and obtain licenses needed to operate the pension savings system.
Central Register of Contracts (CRC)
To make the second pillar work, it will be necessary to maintain all relevant information concerning the participation in the pension savings system, its beginning and end, individual participants and their pension savings contracts with pension companies, and pension insurance policies. To this end, a Central Register of Contracts will be established and managed by the General Directorate of Finance, the supreme body of the Finance Administration of the Czech Republic.
18
Participation in the second pillar
Any person over the age of 18, except those who have already been granted an old-age pension, will have an opportunity to decide whether to participate in the second pillar or not. Younger people will be able to join the second pillar at any time till the end of the calendar year in which they reach 35 years. If a person interested in joining the second pillar is older than 35 years at the time of the launching, he or she will have to make the decision by the end of the first half of 2013.
The rule outlined above applies for those active in the labour market in January 2013, i.e. people who pay their first pillar pension contributions themselves (self-employed) and people whose pension contributions are paid by their employers. Some people may not be able to comply with this requirement (parents on parental leave, people dwelling abroad, the unemployed); however, the expiration of the six-month period referred to above does not make them ineligible for the second pillar. As soon as such persons start paying their first pillar pension contributions after the launching of the second pillar, their six-month deadline will begin, during which they will have to decide whether they will participate in the second pillar or not.
The participation in the pension savings system will be established as of the day the first pension savings contract of the person in question is registered by the CRC.
The pension company which a client signs a pension savings contract with will be obliged to immediately submit one copy of the contract to the CRC. The Central Register of Contracts will check whether the client meets applicable requirements, i.e. whether he or she has complied with the six-month deadline and whether he or she is not drawing an old-age pension. If these conditions are met, the CRC will register the contract as of the first day of the second calendar month following after the calendar month in which it was delivered the contract. The CRC will notify the pension company and the participant of the registration date. The participant will be obliged to immediately notify its employer that pays the pension contributions on the participant’s behalf in accordance with Act No. 589/1992 Coll., on social security contributions and contributions to the state employment policy, of the date on which he or she joined the pension savings system.
Contributions paid to the second pillar
By signing the pension savings contract, the participant undertakes to surrender a part of his or her pension contributions to his or her individual account at the pension company as long as he or she is gainfully active, i.e. until he or she is granted a basic old-age pension. The part referred to above is equal to 3 percentage points of the total contribution rate, which is 28%. At the same time, the participant undertakes to pay an amount equal to extra 2 percentage points as an increased contribution, which will also be transferred to his or her individual account at the pension company. The total amount of the pension contribution will thus be 30% of the assessment base (21.5% paid by the employer, 8.5% paid by the employee), of which 25% will go to the basic pension insurance system and 5% to the pension savings system.
The participant of the second pillar will not have any other duties or obligations. His or her employer will continue to pay the increased pension contribution (8.5%) on his or her behalf to the contribution administrator; the latter will subsequently remit the sum equal to 5% (3 + 2) of the participant’s assessment base to the pension company. Any employer employing participants of the second pillar will be obliged to calculate an increased (by 2 percentage points) pension contribution for them. Similarly, self-employed persons will also continue to remit the increased pension contribution to the contribution administrator that will subsequently remit the appropriate sum to the pension company.
19
The participant will have to contribute to the second pillar only if he or she is obliged to pay the first pillar pension contributions, i.e. only when he or she is gainfully active and his or her gainful activities establish his or her participation in the first pillar. As long as he or she does not pay the first pillar pension contributions (because of unemployment, care of a child, staying abroad etc.), he or she will be neither obliged (nor able) to pay second pillar pension contributions.
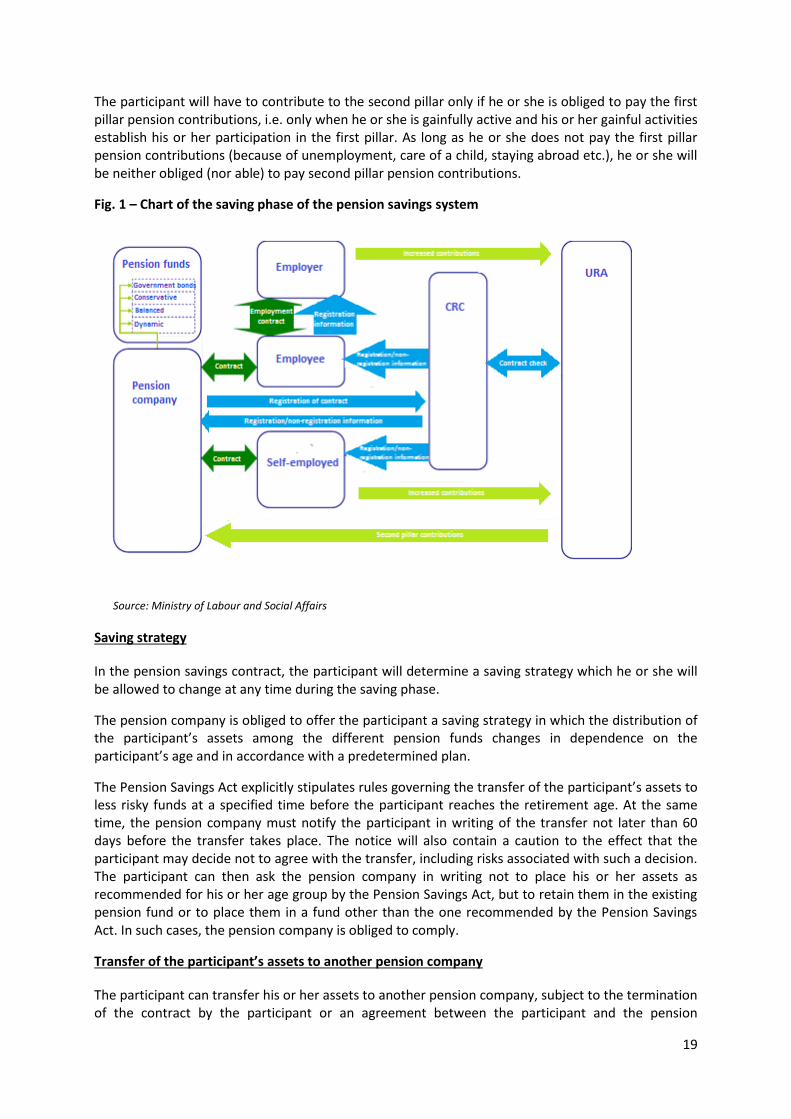
Fig. 1 – Chart of the saving phase of the pension savings system
Source: Ministry of Labour and Social Affairs
Saving strategy
In the pension savings contract, the participant will determine a saving strategy which he or she will be allowed to change at any time during the saving phase.
The pension company is obliged to offer the participant a saving strategy in which the distribution of the participant’s assets among the different pension funds changes in dependence on the participant’s age and in accordance with a predetermined plan.
The Pension Savings Act explicitly stipulates rules governing the transfer of the participant’s assets to less risky funds at a specified time before the participant reaches the retirement age. At the same time, the pension company must notify the participant in writing of the transfer not later than 60 days before the transfer takes place. The notice will also contain a caution to the effect that the participant may decide not to agree with the transfer, including risks associated with such a decision. The participant can then ask the pension company in writing not to place his or her assets as recommended for his or her age group by the Pension Savings Act, but to retain them in the existing pension fund or to place them in a fund other than the one recommended by the Pension Savings Act. In such cases, the pension company is obliged to comply.
Transfer of the participant’s assets to another pension company
The participant can transfer his or her assets to another pension company, subject to the termination of the contract by the participant or an agreement between the participant and the pension
20
company to terminate the contract and the participant entering into another pension savings contract. The latter must also be registered by the CRC.
Termination of participation in the second pillar
The participation in the pension savings system terminates either on the day of registration of a pension insurance contract between the participant and an insurance company by the CRC, or on the day the participant dies, or on the day a court ruling declaring the participant dead becomes legally effective and enforceable (hereinafter “the death”).
Death of the participant during the saving phase
In the event of the death of a participant during the saving phase, the accumulated savings will become a part of his or her estate. If the participant’s heir is a natural person who is younger than 18 years as of the day of the death of the participant, his/her inherited share of the accumulated savings of the participant will be transferred as a one-off insurance premium to an orphan’s pension insurance policy, which orphan’s pension will be paid to him/her by the insurance company. If the under-age person in question does not reach the age of 18 by the time the estate proceedings are completed, the insurance policy will be signed by his or her legal representative or guardian on his or her behalf. This means the under-age person receives his/her inherited share of the accumulated savings of the deceased participant in the form of an orphan’s pension. The orphan’s pension is paid out for a period of five years. The right to a first pillar orphan’s pension is not affected by the right to a second pillar orphan’s pension.
The participant’s heir older than 18 and participating in the pension savings system will have his/her inherited share of the accumulated savings of the deceased participant transferred to his/her account with his/her pension company. The inherited share cannot be paid out in cash, as its purpose is to provide means for the retirement of the heir. At the same time, an heir older than 18 years who does not participate in the pension savings system is given a chance to decide whether to join or not throughout the estate proceedings until their end. This procedure, however, applies only in cases when the heir is in a position to make such a decision, i.e. is under 35, the time during which he/she could have joined the second pillar has lapsed to no effect, and he/she is not drawing an old-age pension.
The only situation in which the inherited share is paid as a one-off payment in cash is when an adult heir neither participates in the pension savings system nor will (can) join it by the end of the estate proceedings.
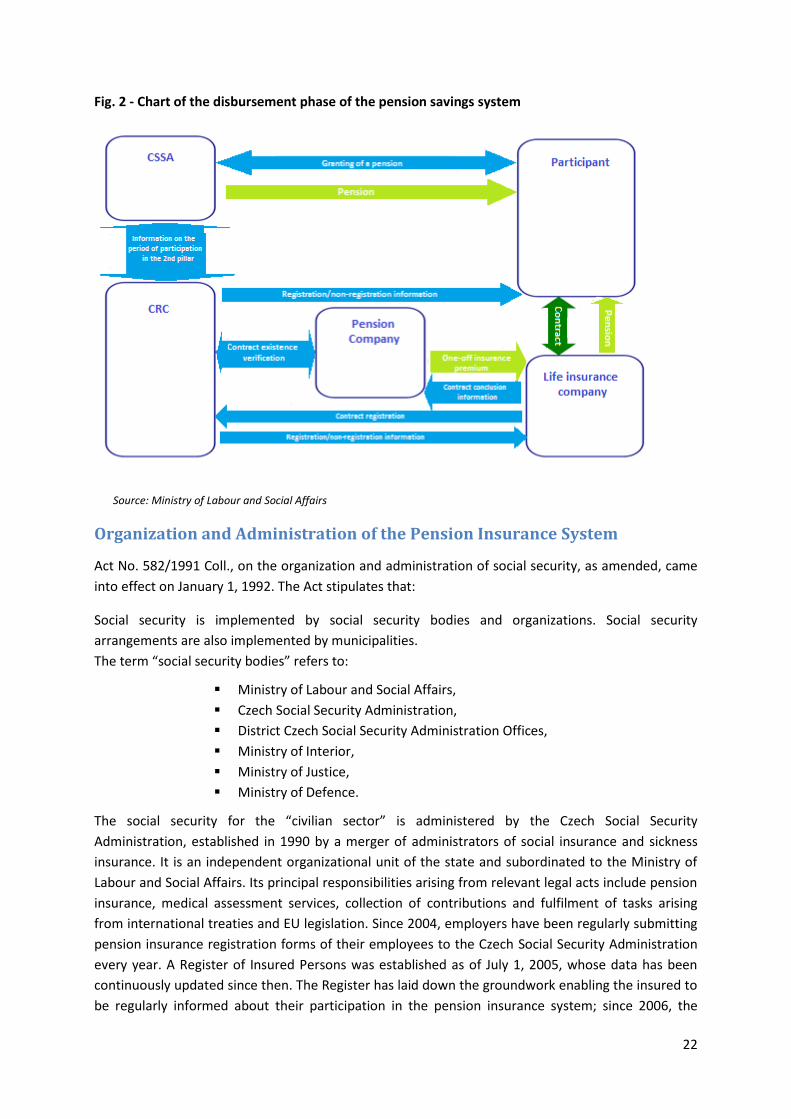
Disbursement Phase
Rights arising from the pension savings system
As of the day the participant is granted a basic (first pillar) old-age pension, he/she also becomes entitled to having his/her accumulated savings transferred as a one-off payment of the pension insurance premium arising from a pension insurance contract. This means the participant can use his/her accumulated savings for the sole purpose of purchasing a pension from a life insurance company. The term “life insurance company” as defined by the Act denotes an insurance company authorized (under the Insurance Industry Act) to operate a life insurance system in the insurance class including the life length insurance in the territory of the Czech Republic, which is governed by social insurance legislation, subject to the Act permitting the insurance company to operate the life insurance system on its own account.
The pension savings system participant will have the following options to choose from:
21
a) an old-age life annuity, or b) an old-age life annuity with agreed payments of a survivor’s pension in the same amount for
a period of 3 years, or c) an old-age pension for a period of 20 years.
As to the old-age life annuity (Subparagraph a)), the payments end upon the death of the participant; on the other hand, with the old-age life annuity referred to in Subparagraph b) the payments in the same amount continue, being remitted to the person the participant has named in the pension insurance contract (i.e. it does not have to be the same person who is entitled to a survivor’s pension under the basic pension insurance system). It should be noted that the life annuity under Subparagraph b) is lower than that under Subparagraph a), the reason being the payment of the survivor’s pension for a period of three years from the participant’s death.
With the old-age pension for a period of 20 years, the payments will end 20 years from the day they commence, including cases when the participant continues to draw the basic old-age pension (in respect whereof the payments always end upon the participant’s death). This fact should be taken into account when choosing from the above options; according to current demographic forecasts, some 50% to 60% of all people who live long enough to be entitled to an old-age pension outlive their retirement age by 20 years or more (the percentage is higher for women than for men). On the other hand, the unspent savings become a part of the estate in the event the participant dies.
The pension insurance contract between the participant and the insurance company will also have to be registered by the CRC. The second pillar (pension savings) pension will be paid out by the insurance company which the participant has signed the pension insurance contract with.
A specific situation is represented by a case in which a pension savings system participant, whose right to a class 3 disability pension paid out under the Pension Insurance Act terminates upon reaching the age of 65 or the applicable retirement age, whichever occurs later, can opt for a first pillar old-age pension in the amount of the existing class 3 disability pension (i.e. not reduced to reflect the period for which the participant has been contributing to the second pillar). In such cases, i.e. if the participant chooses this option, he or she will have to transfer a proportional amount of the savings accumulated in the second pillar (equal to 3% out of the 5% of the pension contributions surrendered to the second pillar, i.e. 60% of the total accumulated savings) to the basic pension insurance system. Upon request of the Czech Social Security Administration, the pension company is obliged to transfer the amount in question to the state budget.
The participant can make use of the balance (40%) in the standard manner, i.e. as a one-off payment of the pension insurance premium to purchase a second pillar pension.
Effects of the participation in the second pillar on first pillar pensions
The participation in the second pillar will only influence the percentage amount of first pillar old-age pensions, while other types of pensions will remain unaffected. This means that disability and survivors’ pensions will be the same, as if the insured person was not a participant in the second pillar. Insofar as first pillar old-age pensions are concerned, the beneficiary’s participation in the second pillar will be reflected in a lower percentage amount of the pension; the rate for every year of the period during which the beneficiary has been insured on the basis of his/her gainful activities and also participated in the second pillar will be 1.2% instead of 1.5%.
22
Fig. 2 - Chart of the disbursement phase of the pension savings system
Source: Ministry of Labour and Social Affairs
Organization and Administration of the Pension Insurance System
Act No. 582/1991 Coll., on the organization and administration of social security, as amended, came
into effect on January 1, 1992. The Act stipulates that:
Social security is implemented by social security bodies and organizations. Social security
arrangements are also implemented by municipalities.
The term “social security bodies” refers to:
Ministry of Labour and Social Affairs,
Czech Social Security Administration,
District Czech Social Security Administration Offices,
Ministry of Interior,
Ministry of Justice,
Ministry of Defence.
The social security for the “civilian sector” is administered by the Czech Social Security
Administration, established in 1990 by a merger of administrators of social insurance and sickness
insurance. It is an independent organizational unit of the state and subordinated to the Ministry of
Labour and Social Affairs. Its principal responsibilities arising from relevant legal acts include pension
insurance, medical assessment services, collection of contributions and fulfilment of tasks arising
from international treaties and EU legislation. Since 2004, employers have been regularly submitting
pension insurance registration forms of their employees to the Czech Social Security Administration
every year. A Register of Insured Persons was established as of July 1, 2005, whose data has been
continuously updated since then. The Register has laid down the groundwork enabling the insured to
be regularly informed about their participation in the pension insurance system; since 2006, the

23
Register has been providing this information in writing upon request. The Czech Social Security
Administration can receive electronic applications and proposals via the Internet and the Public
Administration Portal, or on memory media. Its clients can make use of several electronic forms,
including pension insurance registration forms, sickness insurance registration and deregistration
forms and the “Review of Incomes and Expenditure of Self-Employed Persons” form.
24
Statistics
The purpose of this part is to evaluate developments in the field of pension insurance expenditure,
relations between revenues and expenditure, number of pensioners and pensions, and amounts and
differentiation of pensions.
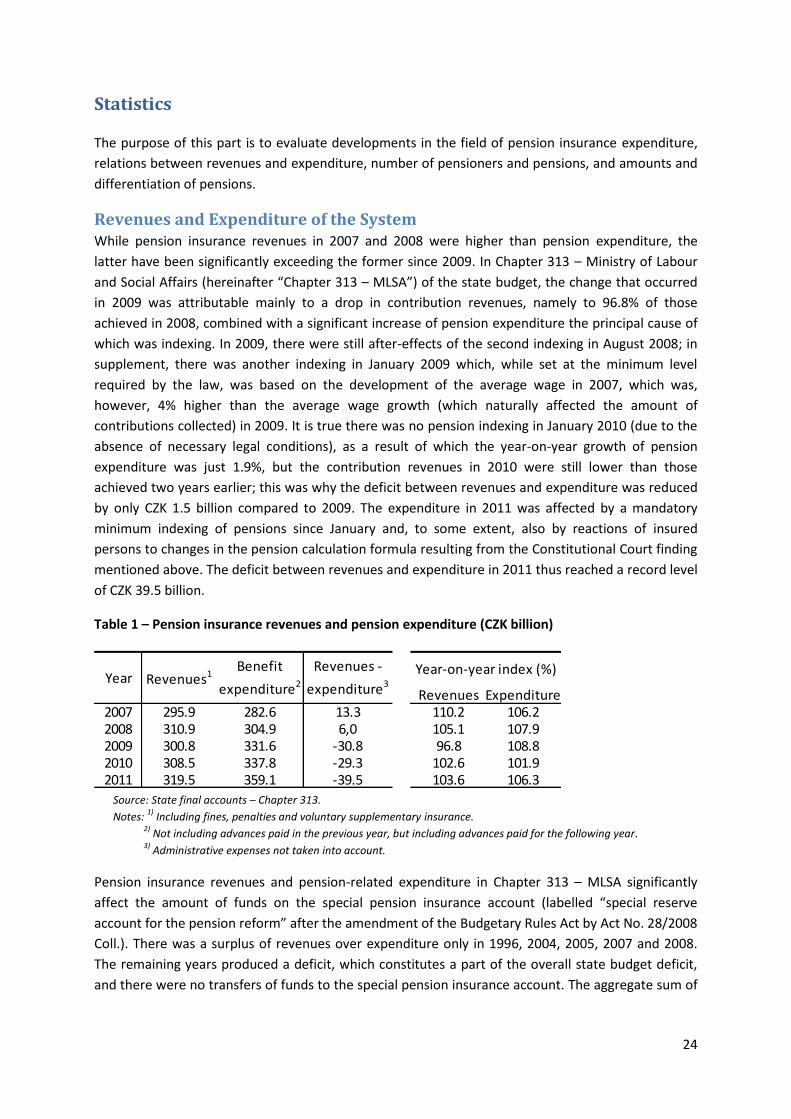
Revenues and Expenditure of the System While pension insurance revenues in 2007 and 2008 were higher than pension expenditure, the
latter have been significantly exceeding the former since 2009. In Chapter 313 – Ministry of Labour
and Social Affairs (hereinafter “Chapter 313 – MLSA”) of the state budget, the change that occurred
in 2009 was attributable mainly to a drop in contribution revenues, namely to 96.8% of those
achieved in 2008, combined with a significant increase of pension expenditure the principal cause of
which was indexing. In 2009, there were still after-effects of the second indexing in August 2008; in
supplement, there was another indexing in January 2009 which, while set at the minimum level
required by the law, was based on the development of the average wage in 2007, which was,
however, 4% higher than the average wage growth (which naturally affected the amount of
contributions collected) in 2009. It is true there was no pension indexing in January 2010 (due to the
absence of necessary legal conditions), as a result of which the year-on-year growth of pension
expenditure was just 1.9%, but the contribution revenues in 2010 were still lower than those
achieved two years earlier; this was why the deficit between revenues and expenditure was reduced
by only CZK 1.5 billion compared to 2009. The expenditure in 2011 was affected by a mandatory
minimum indexing of pensions since January and, to some extent, also by reactions of insured
persons to changes in the pension calculation formula resulting from the Constitutional Court finding
mentioned above. The deficit between revenues and expenditure in 2011 thus reached a record level
of CZK 39.5 billion.
Table 1 – Pension insurance revenues and pension expenditure (CZK billion)
Source: State final accounts – Chapter 313.
Notes: 1)
Including fines, penalties and voluntary supplementary insurance. 2)
Not including advances paid in the previous year, but including advances paid for the following year. 3)
Administrative expenses not taken into account.
Pension insurance revenues and pension-related expenditure in Chapter 313 – MLSA significantly
affect the amount of funds on the special pension insurance account (labelled “special reserve
account for the pension reform” after the amendment of the Budgetary Rules Act by Act No. 28/2008
Coll.). There was a surplus of revenues over expenditure only in 1996, 2004, 2005, 2007 and 2008.
The remaining years produced a deficit, which constitutes a part of the overall state budget deficit,
and there were no transfers of funds to the special pension insurance account. The aggregate sum of
Revenues Expenditure2007 295.9 282.6 13.3 110.2 106.22008 310.9 304.9 6,0 105.1 107.92009 300.8 331.6 -30.8 96.8 108.82010 308.5 337.8 -29.3 102.6 101.92011 319.5 359.1 -39.5 103.6 106.3
Revenues -
expenditure3
Year-on-year index (%)Year Revenues1
Benefit
expenditure2
25
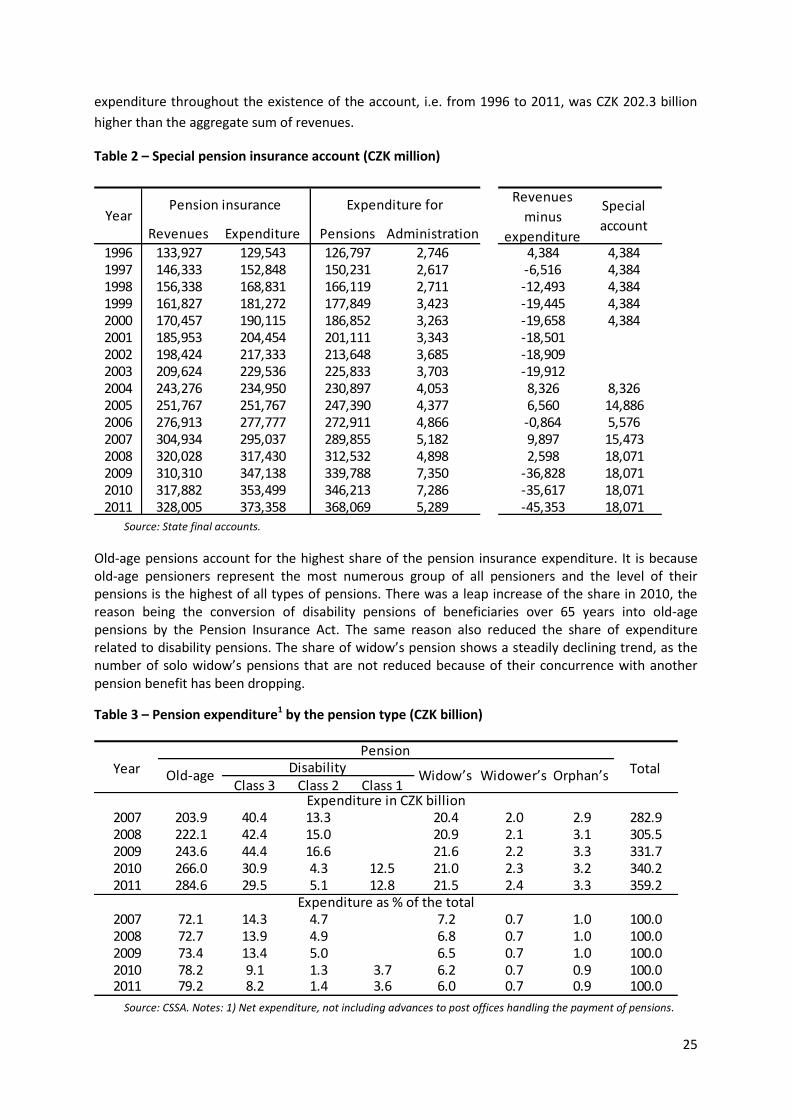
expenditure throughout the existence of the account, i.e. from 1996 to 2011, was CZK 202.3 billion
higher than the aggregate sum of revenues.
Table 2 – Special pension insurance account (CZK million)
Source: State final accounts.
Old-age pensions account for the highest share of the pension insurance expenditure. It is because old-age pensioners represent the most numerous group of all pensioners and the level of their pensions is the highest of all types of pensions. There was a leap increase of the share in 2010, the reason being the conversion of disability pensions of beneficiaries over 65 years into old-age pensions by the Pension Insurance Act. The same reason also reduced the share of expenditure related to disability pensions. The share of widow’s pension shows a steadily declining trend, as the number of solo widow’s pensions that are not reduced because of their concurrence with another pension benefit has been dropping.
Table 3 – Pension expenditure1 by the pension type (CZK billion)
Source: CSSA. Notes: 1) Net expenditure, not including advances to post offices handling the payment of pensions.
Revenues Expenditure Pensions Administration
1996 133,927 129,543 126,797 2,746 4,384 4,3841997 146,333 152,848 150,231 2,617 -6,516 4,3841998 156,338 168,831 166,119 2,711 -12,493 4,3841999 161,827 181,272 177,849 3,423 -19,445 4,3842000 170,457 190,115 186,852 3,263 -19,658 4,3842001 185,953 204,454 201,111 3,343 -18,5012002 198,424 217,333 213,648 3,685 -18,9092003 209,624 229,536 225,833 3,703 -19,9122004 243,276 234,950 230,897 4,053 8,326 8,3262005 251,767 251,767 247,390 4,377 6,560 14,8862006 276,913 277,777 272,911 4,866 -0,864 5,5762007 304,934 295,037 289,855 5,182 9,897 15,4732008 320,028 317,430 312,532 4,898 2,598 18,0712009 310,310 347,138 339,788 7,350 -36,828 18,0712010 317,882 353,499 346,213 7,286 -35,617 18,0712011 328,005 373,358 368,069 5,289 -45,353 18,071
Revenues
minus
expenditure
Special
accountYear
Pension insurance Expenditure for
Year TotalClass 3 Class 2 Class 1
2007 203.9 40.4 13.3 20.4 2.0 2.9 282.92008 222.1 42.4 15.0 20.9 2.1 3.1 305.52009 243.6 44.4 16.6 21.6 2.2 3.3 331.72010 266.0 30.9 4.3 12.5 21.0 2.3 3.2 340.22011 284.6 29.5 5.1 12.8 21.5 2.4 3.3 359.2
2007 72.1 14.3 4.7 7.2 0.7 1.0 100.02008 72.7 13.9 4.9 6.8 0.7 1.0 100.02009 73.4 13.4 5.0 6.5 0.7 1.0 100.02010 78.2 9.1 1.3 3.7 6.2 0.7 0.9 100.02011 79.2 8.2 1.4 3.6 6.0 0.7 0.9 100.0
Expenditure in CZK billion
Expenditure as % of the total
Pension
Old-ageDisability
Widow’s Widower’s Orphan’s
26
Essential parameters influencing the pension-related expenditure include the number of pensions
and pensioners and the amount of pensions, which is affected mainly by indexing.
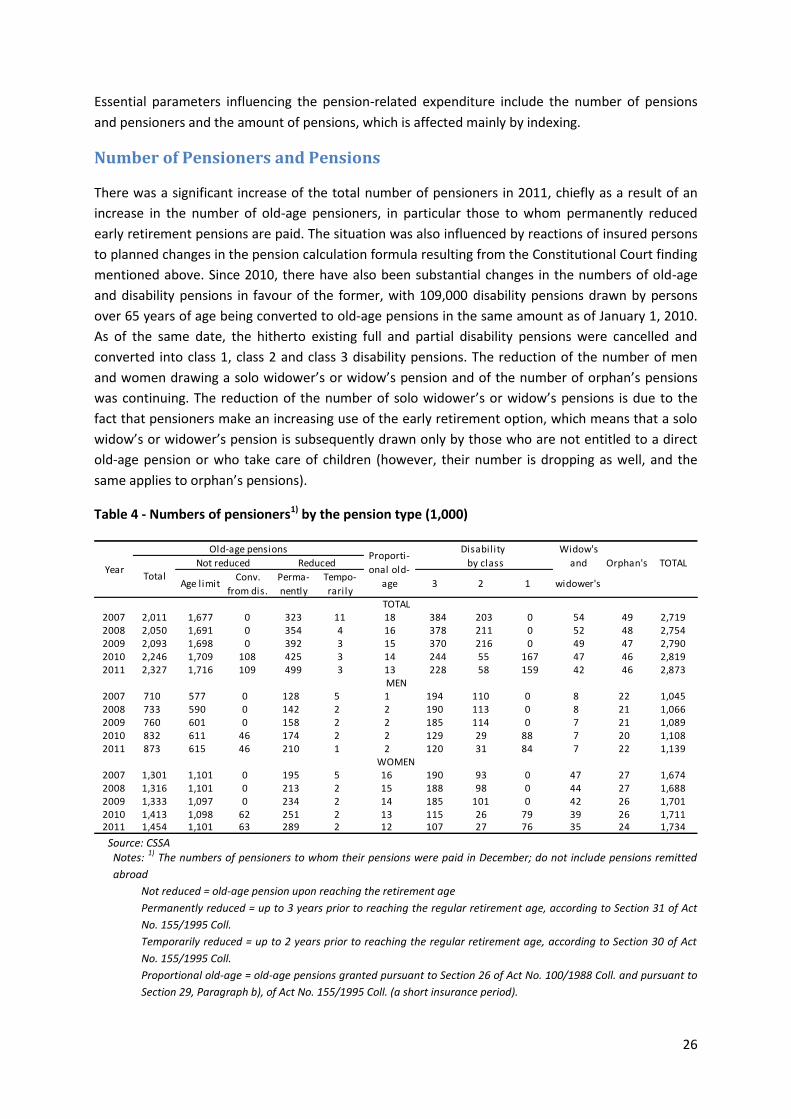
Number of Pensioners and Pensions
There was a significant increase of the total number of pensioners in 2011, chiefly as a result of an
increase in the number of old-age pensioners, in particular those to whom permanently reduced
early retirement pensions are paid. The situation was also influenced by reactions of insured persons
to planned changes in the pension calculation formula resulting from the Constitutional Court finding
mentioned above. Since 2010, there have also been substantial changes in the numbers of old-age
and disability pensions in favour of the former, with 109,000 disability pensions drawn by persons
over 65 years of age being converted to old-age pensions in the same amount as of January 1, 2010.
As of the same date, the hitherto existing full and partial disability pensions were cancelled and
converted into class 1, class 2 and class 3 disability pensions. The reduction of the number of men
and women drawing a solo widower’s or widow’s pension and of the number of orphan’s pensions
was continuing. The reduction of the number of solo widower’s or widow’s pensions is due to the
fact that pensioners make an increasing use of the early retirement option, which means that a solo
widow’s or widower’s pension is subsequently drawn only by those who are not entitled to a direct
old-age pension or who take care of children (however, their number is dropping as well, and the
same applies to orphan’s pensions).
Table 4 - Numbers of pensioners1) by the pension type (1,000)
Source: CSSA Notes:
1) The numbers of pensioners to whom their pensions were paid in December; do not include pensions remitted
abroad
Not reduced = old-age pension upon reaching the retirement age
Permanently reduced = up to 3 years prior to reaching the regular retirement age, according to Section 31 of Act
No. 155/1995 Coll.
Temporarily reduced = up to 2 years prior to reaching the regular retirement age, according to Section 30 of Act
No. 155/1995 Coll.
Proportional old-age = old-age pensions granted pursuant to Section 26 of Act No. 100/1988 Coll. and pursuant to
Section 29, Paragraph b), of Act No. 155/1995 Coll. (a short insurance period).
Widow's
and Orphan's TOTAL
Age limitConv.
from dis.
Perma-
nently
Tempo-
rarily3 2 1 widower's
2007 2,011 1,677 0 323 11 18 384 203 0 54 49 2,7192008 2,050 1,691 0 354 4 16 378 211 0 52 48 2,7542009 2,093 1,698 0 392 3 15 370 216 0 49 47 2,7902010 2,246 1,709 108 425 3 14 244 55 167 47 46 2,8192011 2,327 1,716 109 499 3 13 228 58 159 42 46 2,873
2007 710 577 0 128 5 1 194 110 0 8 22 1,0452008 733 590 0 142 2 2 190 113 0 8 21 1,0662009 760 601 0 158 2 2 185 114 0 7 21 1,0892010 832 611 46 174 2 2 129 29 88 7 20 1,1082011 873 615 46 210 1 2 120 31 84 7 22 1,139
2007 1,301 1,101 0 195 5 16 190 93 0 47 27 1,6742008 1,316 1,101 0 213 2 15 188 98 0 44 27 1,6882009 1,333 1,097 0 234 2 14 185 101 0 42 26 1,7012010 1,413 1,098 62 251 2 13 115 26 79 39 26 1,7112011 1,454 1,101 63 289 2 12 107 27 76 35 24 1,734
TOTAL
MEN
WOMEN
Year
Old-age pensionsProporti-
onal old-
age
Disability
TotalNot reduced Reduced by class
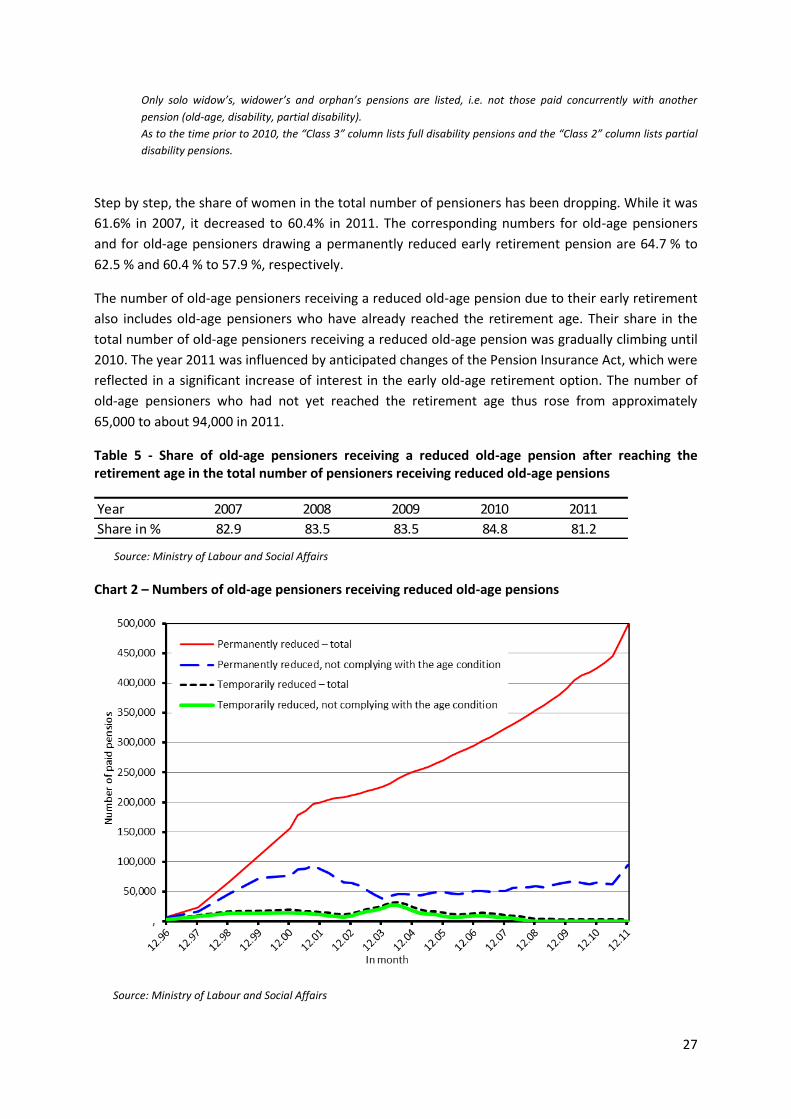
27
Only solo widow’s, widower’s and orphan’s pensions are listed, i.e. not those paid concurrently with another
pension (old-age, disability, partial disability).
As to the time prior to 2010, the “Class 3” column lists full disability pensions and the “Class 2” column lists partial
disability pensions.
Step by step, the share of women in the total number of pensioners has been dropping. While it was
61.6% in 2007, it decreased to 60.4% in 2011. The corresponding numbers for old-age pensioners
and for old-age pensioners drawing a permanently reduced early retirement pension are 64.7 % to
62.5 % and 60.4 % to 57.9 %, respectively.
The number of old-age pensioners receiving a reduced old-age pension due to their early retirement
also includes old-age pensioners who have already reached the retirement age. Their share in the
total number of old-age pensioners receiving a reduced old-age pension was gradually climbing until
2010. The year 2011 was influenced by anticipated changes of the Pension Insurance Act, which were
reflected in a significant increase of interest in the early old-age retirement option. The number of
old-age pensioners who had not yet reached the retirement age thus rose from approximately
65,000 to about 94,000 in 2011.
Table 5 - Share of old-age pensioners receiving a reduced old-age pension after reaching the retirement age in the total number of pensioners receiving reduced old-age pensions
Source: Ministry of Labour and Social Affairs
Chart 2 – Numbers of old-age pensioners receiving reduced old-age pensions
Source: Ministry of Labour and Social Affairs
Year 2007 2008 2009 2010 2011
Share in % 82.9 83.5 83.5 84.8 81.2
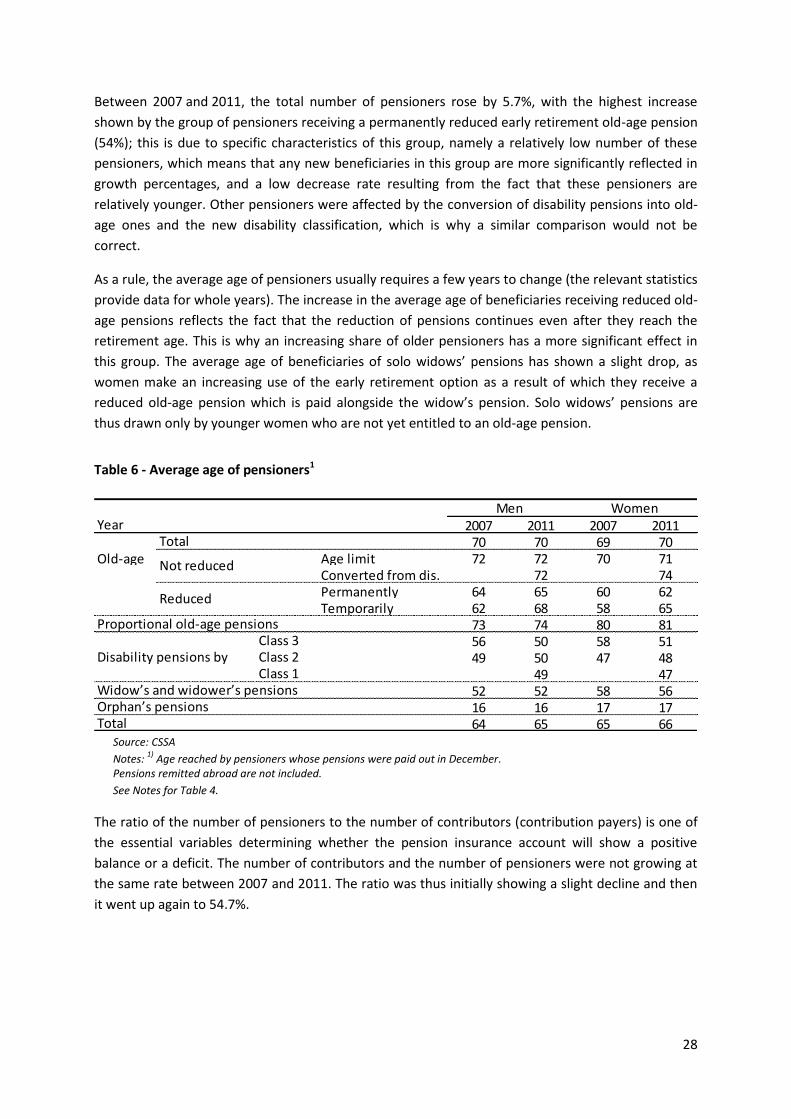
28
Between 2007 and 2011, the total number of pensioners rose by 5.7%, with the highest increase
shown by the group of pensioners receiving a permanently reduced early retirement old-age pension
(54%); this is due to specific characteristics of this group, namely a relatively low number of these
pensioners, which means that any new beneficiaries in this group are more significantly reflected in
growth percentages, and a low decrease rate resulting from the fact that these pensioners are
relatively younger. Other pensioners were affected by the conversion of disability pensions into old-
age ones and the new disability classification, which is why a similar comparison would not be
correct.
As a rule, the average age of pensioners usually requires a few years to change (the relevant statistics
provide data for whole years). The increase in the average age of beneficiaries receiving reduced old-
age pensions reflects the fact that the reduction of pensions continues even after they reach the
retirement age. This is why an increasing share of older pensioners has a more significant effect in
this group. The average age of beneficiaries of solo widows’ pensions has shown a slight drop, as
women make an increasing use of the early retirement option as a result of which they receive a
reduced old-age pension which is paid alongside the widow’s pension. Solo widows’ pensions are
thus drawn only by younger women who are not yet entitled to an old-age pension.
Table 6 - Average age of pensioners1
Source: CSSA
Notes: 1)
Age reached by pensioners whose pensions were paid out in December. Pensions remitted abroad are not included.
See Notes for Table 4.
The ratio of the number of pensioners to the number of contributors (contribution payers) is one of
the essential variables determining whether the pension insurance account will show a positive
balance or a deficit. The number of contributors and the number of pensioners were not growing at
the same rate between 2007 and 2011. The ratio was thus initially showing a slight decline and then
it went up again to 54.7%.
2007 2011 2007 201170 70 69 70
Old-age Age limit 72 72 70 71Converted from dis. 72 74Permanently 64 65 60 62Temporarily 62 68 58 65
73 74 80 8156 50 58 5149 50 47 48
49 4752 52 58 5616 16 17 1764 65 65 66
Widow’s and widower’s pensionsOrphan’s pensionsTotal
Class 2Class 1
Reduced
Proportional old-age pensions
Disability pensions by Class 3
Not reduced
YearMen Women
Total
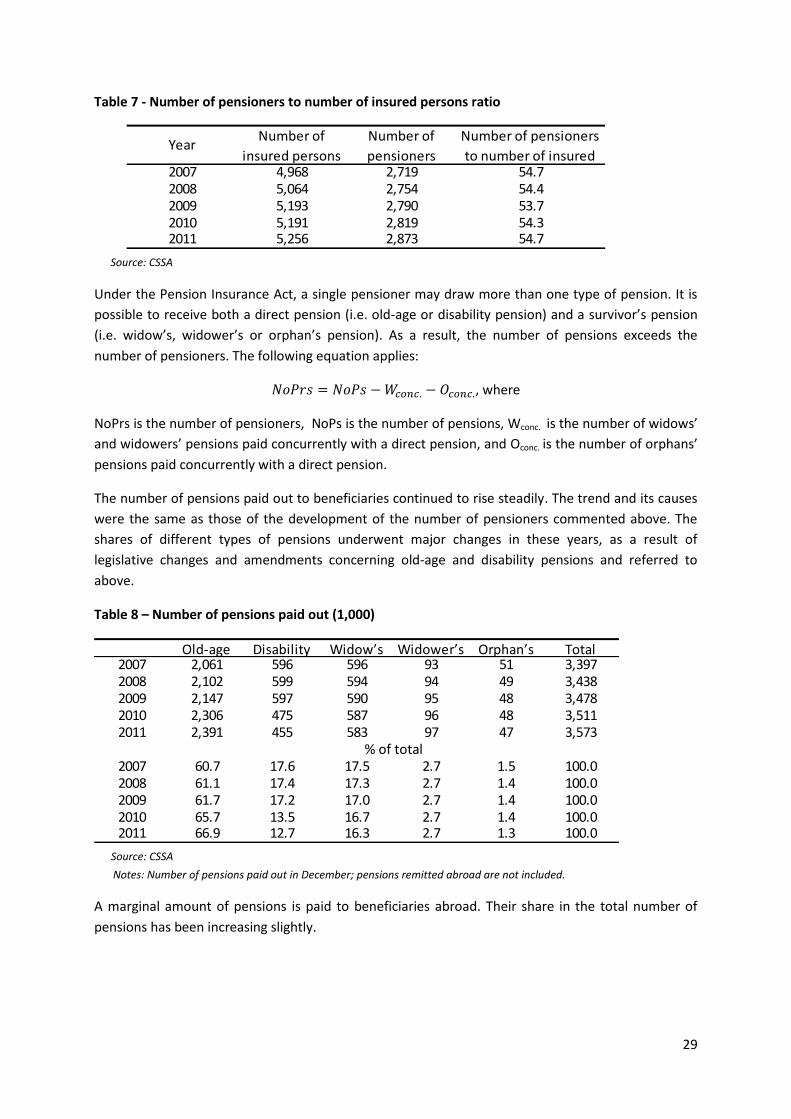
29
Table 7 - Number of pensioners to number of insured persons ratio
Source: CSSA
Under the Pension Insurance Act, a single pensioner may draw more than one type of pension. It is
possible to receive both a direct pension (i.e. old-age or disability pension) and a survivor’s pension
(i.e. widow’s, widower’s or orphan’s pension). As a result, the number of pensions exceeds the
number of pensioners. The following equation applies:
, where
NoPrs is the number of pensioners, NoPs is the number of pensions, Wconc. is the number of widows’
and widowers’ pensions paid concurrently with a direct pension, and Oconc. is the number of orphans’
pensions paid concurrently with a direct pension.
The number of pensions paid out to beneficiaries continued to rise steadily. The trend and its causes
were the same as those of the development of the number of pensioners commented above. The
shares of different types of pensions underwent major changes in these years, as a result of
legislative changes and amendments concerning old-age and disability pensions and referred to
above.
Table 8 – Number of pensions paid out (1,000)
Source: CSSA
Notes: Number of pensions paid out in December; pensions remitted abroad are not included.
A marginal amount of pensions is paid to beneficiaries abroad. Their share in the total number of
pensions has been increasing slightly.
2007 4,968 2,719 54.72008 5,064 2,754 54.42009 5,193 2,790 53.72010 5,191 2,819 54.32011 5,256 2,873 54.7
YearNumber of
pensioners
Number of pensioners
to number of insured
Number of
insured persons
Old-age Disability Widow’s Widower’s Orphan’s Total2007 2,061 596 596 93 51 3,3972008 2,102 599 594 94 49 3,4382009 2,147 597 590 95 48 3,4782010 2,306 475 587 96 48 3,5112011 2,391 455 583 97 47 3,573
2007 60.7 17.6 17.5 2.7 1.5 100.02008 61.1 17.4 17.3 2.7 1.4 100.02009 61.7 17.2 17.0 2.7 1.4 100.02010 65.7 13.5 16.7 2.7 1.4 100.02011 66.9 12.7 16.3 2.7 1.3 100.0
% of total
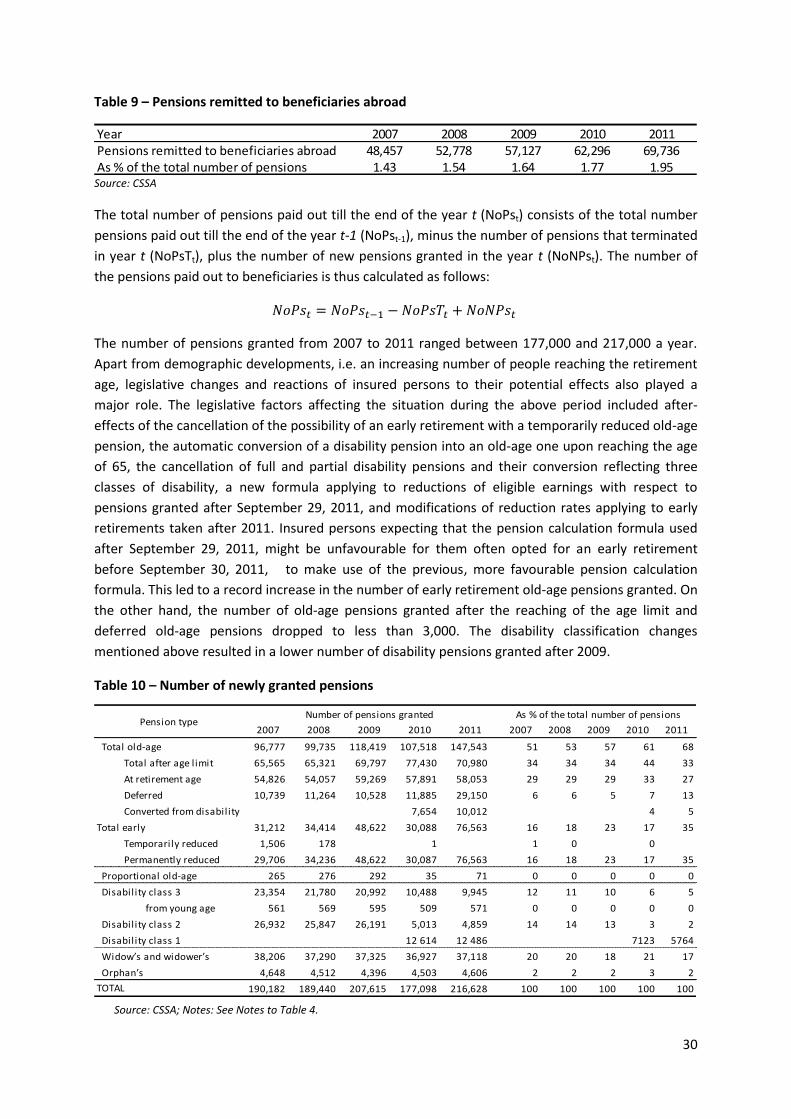
30
Table 9 – Pensions remitted to beneficiaries abroad
Source: CSSA
The total number of pensions paid out till the end of the year t (NoPst) consists of the total number
pensions paid out till the end of the year t-1 (NoPst-1), minus the number of pensions that terminated
in year t (NoPsTt), plus the number of new pensions granted in the year t (NoNPst). The number of
the pensions paid out to beneficiaries is thus calculated as follows:
The number of pensions granted from 2007 to 2011 ranged between 177,000 and 217,000 a year.
Apart from demographic developments, i.e. an increasing number of people reaching the retirement
age, legislative changes and reactions of insured persons to their potential effects also played a
major role. The legislative factors affecting the situation during the above period included after-
effects of the cancellation of the possibility of an early retirement with a temporarily reduced old-age
pension, the automatic conversion of a disability pension into an old-age one upon reaching the age
of 65, the cancellation of full and partial disability pensions and their conversion reflecting three
classes of disability, a new formula applying to reductions of eligible earnings with respect to
pensions granted after September 29, 2011, and modifications of reduction rates applying to early
retirements taken after 2011. Insured persons expecting that the pension calculation formula used
after September 29, 2011, might be unfavourable for them often opted for an early retirement
before September 30, 2011, to make use of the previous, more favourable pension calculation
formula. This led to a record increase in the number of early retirement old-age pensions granted. On
the other hand, the number of old-age pensions granted after the reaching of the age limit and
deferred old-age pensions dropped to less than 3,000. The disability classification changes
mentioned above resulted in a lower number of disability pensions granted after 2009.
Table 10 – Number of newly granted pensions
Source: CSSA; Notes: See Notes to Table 4.
Year 2007 2008 2009 2010 2011Pensions remitted to beneficiaries abroad 48,457 52,778 57,127 62,296 69,736As % of the total number of pensions 1.43 1.54 1.64 1.77 1.95
2007 2008 2009 2010 2011 2007 2008 2009 2010 2011
Total old-age 96,777 99,735 118,419 107,518 147,543 51 53 57 61 68
65,565 65,321 69,797 77,430 70,980 34 34 34 44 33
54,826 54,057 59,269 57,891 58,053 29 29 29 33 27
10,739 11,264 10,528 11,885 29,150 6 6 5 7 13
7,654 10,012 4 5
31,212 34,414 48,622 30,088 76,563 16 18 23 17 35
1,506 178 1 1 0 0
29,706 34,236 48,622 30,087 76,563 16 18 23 17 35
Proportional old-age 265 276 292 35 71 0 0 0 0 0
Disability class 3 23,354 21,780 20,992 10,488 9,945 12 11 10 6 5
561 569 595 509 571 0 0 0 0 0
Disability class 2 26,932 25,847 26,191 5,013 4,859 14 14 13 3 2
Disability class 1 12 614 12 486 7123 5764
Widow’s and widower’s 38,206 37,290 37,325 36,927 37,118 20 20 18 21 17
Orphan’s 4,648 4,512 4,396 4,503 4,606 2 2 2 3 2
190,182 189,440 207,615 177,098 216,628 100 100 100 100 100TOTAL
Pension typeAs % of the total number of pensions
Total after age limit
At retirement age
Total early
Number of pensions granted
Deferred
Converted from disability
Temporarily reduced
Permanently reduced
from young age
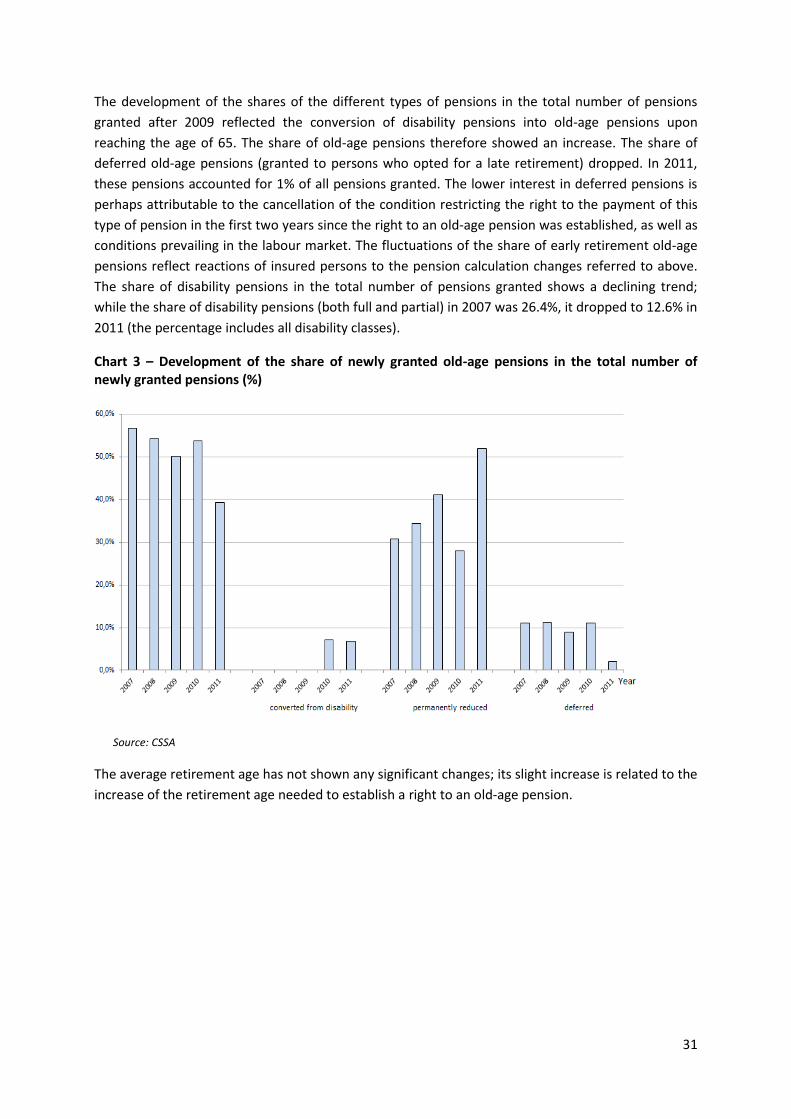
31
The development of the shares of the different types of pensions in the total number of pensions
granted after 2009 reflected the conversion of disability pensions into old-age pensions upon
reaching the age of 65. The share of old-age pensions therefore showed an increase. The share of
deferred old-age pensions (granted to persons who opted for a late retirement) dropped. In 2011,
these pensions accounted for 1% of all pensions granted. The lower interest in deferred pensions is
perhaps attributable to the cancellation of the condition restricting the right to the payment of this
type of pension in the first two years since the right to an old-age pension was established, as well as
conditions prevailing in the labour market. The fluctuations of the share of early retirement old-age
pensions reflect reactions of insured persons to the pension calculation changes referred to above.
The share of disability pensions in the total number of pensions granted shows a declining trend;
while the share of disability pensions (both full and partial) in 2007 was 26.4%, it dropped to 12.6% in
2011 (the percentage includes all disability classes).
Chart 3 – Development of the share of newly granted old-age pensions in the total number of newly granted pensions (%)
Source: CSSA
The average retirement age has not shown any significant changes; its slight increase is related to the
increase of the retirement age needed to establish a right to an old-age pension.
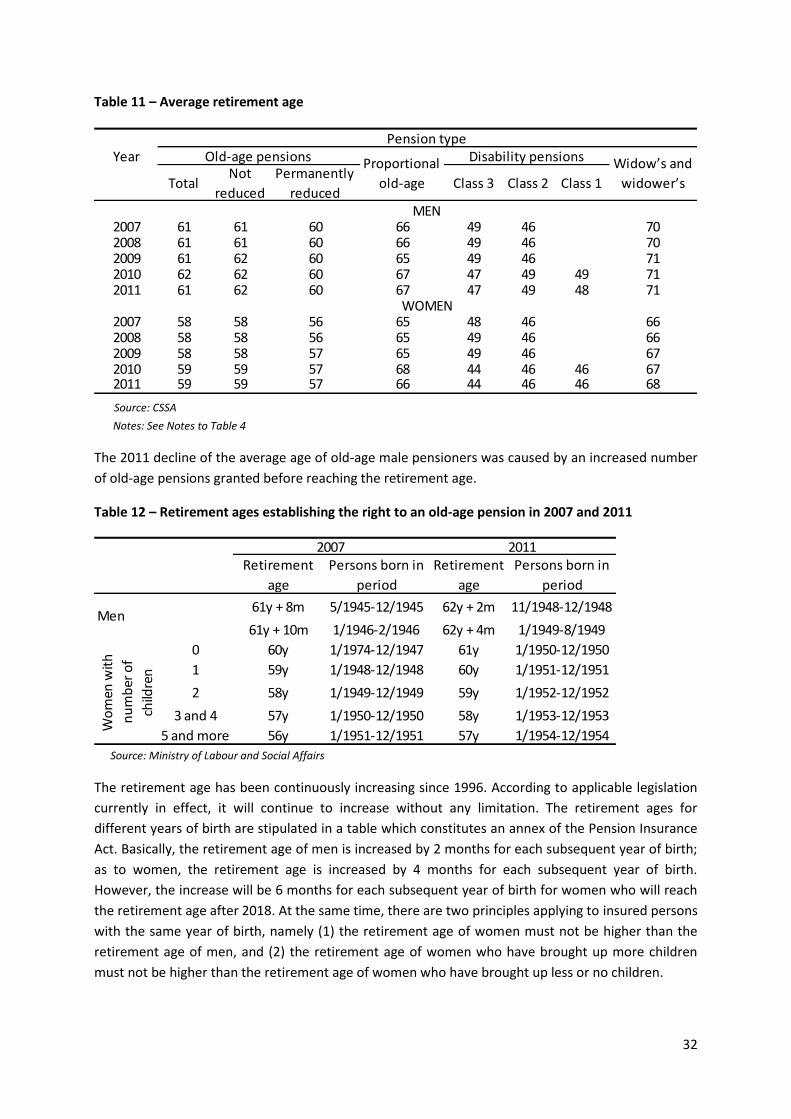
32
Table 11 – Average retirement age
Source: CSSA
Notes: See Notes to Table 4
The 2011 decline of the average age of old-age male pensioners was caused by an increased number
of old-age pensions granted before reaching the retirement age.
Table 12 – Retirement ages establishing the right to an old-age pension in 2007 and 2011
Source: Ministry of Labour and Social Affairs
The retirement age has been continuously increasing since 1996. According to applicable legislation
currently in effect, it will continue to increase without any limitation. The retirement ages for
different years of birth are stipulated in a table which constitutes an annex of the Pension Insurance
Act. Basically, the retirement age of men is increased by 2 months for each subsequent year of birth;
as to women, the retirement age is increased by 4 months for each subsequent year of birth.
However, the increase will be 6 months for each subsequent year of birth for women who will reach
the retirement age after 2018. At the same time, there are two principles applying to insured persons
with the same year of birth, namely (1) the retirement age of women must not be higher than the
retirement age of men, and (2) the retirement age of women who have brought up more children
must not be higher than the retirement age of women who have brought up less or no children.
Year
TotalNot
reduced
Permanently
reducedClass 3 Class 2 Class 1
2007 61 61 60 66 49 46 702008 61 61 60 66 49 46 702009 61 62 60 65 49 46 712010 62 62 60 67 47 49 49 712011 61 62 60 67 47 49 48 71
2007 58 58 56 65 48 46 662008 58 58 56 65 49 46 662009 58 58 57 65 49 46 672010 59 59 57 68 44 46 46 672011 59 59 57 66 44 46 46 68
WOMEN
Pension typeOld-age pensions Proportional
old-age
Disability pensions Widow’s and
widower’s
MEN
Retirement
age
Persons born in
period
Retirement
age
Persons born in
period
61y + 8m 5/1945-12/1945 62y + 2m 11/1948-12/1948
61y + 10m 1/1946-2/1946 62y + 4m 1/1949-8/1949
0 60y 1/1974-12/1947 61y 1/1950-12/1950
1 59y 1/1948-12/1948 60y 1/1951-12/1951
2 58y 1/1949-12/1949 59y 1/1952-12/1952
3 and 4 57y 1/1950-12/1950 58y 1/1953-12/1953
5 and more 56y 1/1951-12/1951 57y 1/1954-12/1954
Wo
men
wit
h
nu
mb
er o
f
child
ren
2007 2011
Men
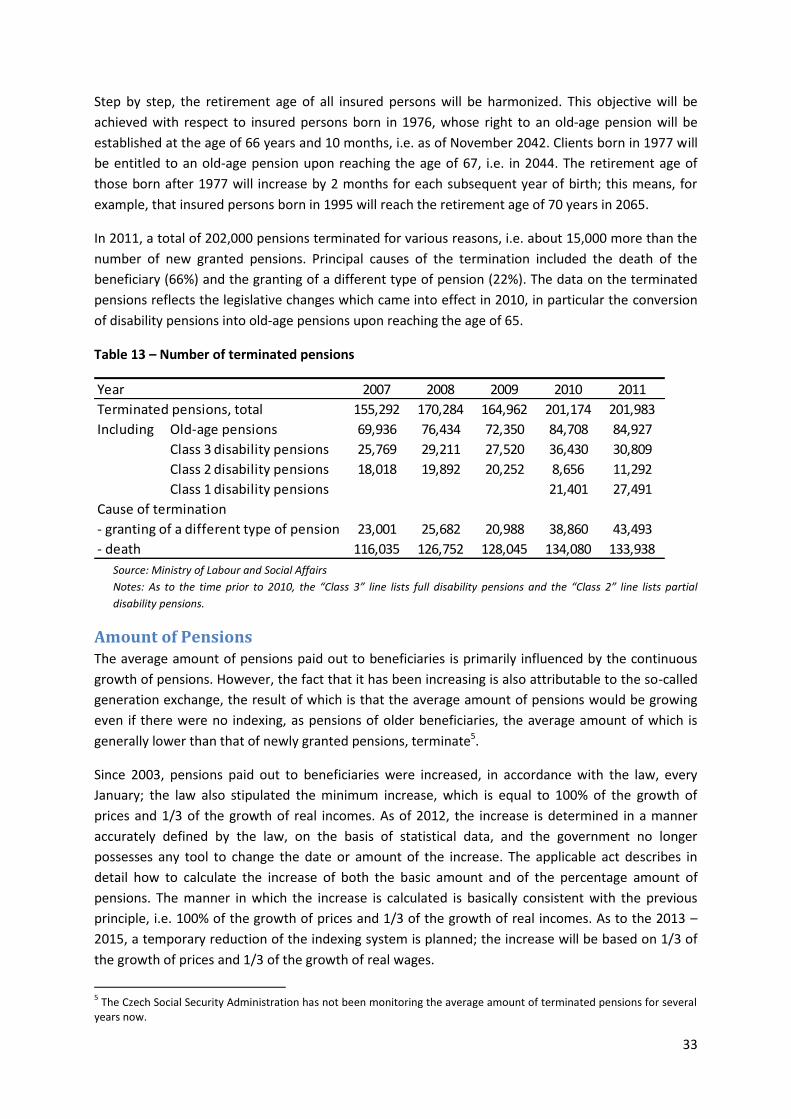
33
Step by step, the retirement age of all insured persons will be harmonized. This objective will be
achieved with respect to insured persons born in 1976, whose right to an old-age pension will be
established at the age of 66 years and 10 months, i.e. as of November 2042. Clients born in 1977 will
be entitled to an old-age pension upon reaching the age of 67, i.e. in 2044. The retirement age of
those born after 1977 will increase by 2 months for each subsequent year of birth; this means, for
example, that insured persons born in 1995 will reach the retirement age of 70 years in 2065.
In 2011, a total of 202,000 pensions terminated for various reasons, i.e. about 15,000 more than the
number of new granted pensions. Principal causes of the termination included the death of the
beneficiary (66%) and the granting of a different type of pension (22%). The data on the terminated
pensions reflects the legislative changes which came into effect in 2010, in particular the conversion
of disability pensions into old-age pensions upon reaching the age of 65.
Table 13 – Number of terminated pensions
Source: Ministry of Labour and Social Affairs
Notes: As to the time prior to 2010, the “Class 3” line lists full disability pensions and the “Class 2” line lists partial
disability pensions.
Amount of Pensions The average amount of pensions paid out to beneficiaries is primarily influenced by the continuous
growth of pensions. However, the fact that it has been increasing is also attributable to the so-called
generation exchange, the result of which is that the average amount of pensions would be growing
even if there were no indexing, as pensions of older beneficiaries, the average amount of which is
generally lower than that of newly granted pensions, terminate5.
Since 2003, pensions paid out to beneficiaries were increased, in accordance with the law, every
January; the law also stipulated the minimum increase, which is equal to 100% of the growth of
prices and 1/3 of the growth of real incomes. As of 2012, the increase is determined in a manner
accurately defined by the law, on the basis of statistical data, and the government no longer
possesses any tool to change the date or amount of the increase. The applicable act describes in
detail how to calculate the increase of both the basic amount and of the percentage amount of
pensions. The manner in which the increase is calculated is basically consistent with the previous
principle, i.e. 100% of the growth of prices and 1/3 of the growth of real incomes. As to the 2013 –
2015, a temporary reduction of the indexing system is planned; the increase will be based on 1/3 of
the growth of prices and 1/3 of the growth of real wages.
5 The Czech Social Security Administration has not been monitoring the average amount of terminated pensions for several
years now.
Year 2007 2008 2009 2010 2011
155,292 170,284 164,962 201,174 201,983
Including Old-age pensions 69,936 76,434 72,350 84,708 84,927
Class 3 disability pensions 25,769 29,211 27,520 36,430 30,809
Class 2 disability pensions 18,018 19,892 20,252 8,656 11,292
Class 1 disability pensions 21,401 27,491
23,001 25,682 20,988 38,860 43,493
- death 116,035 126,752 128,045 134,080 133,938
Terminated pensions, total
- granting of a different type of pension
Cause of termination
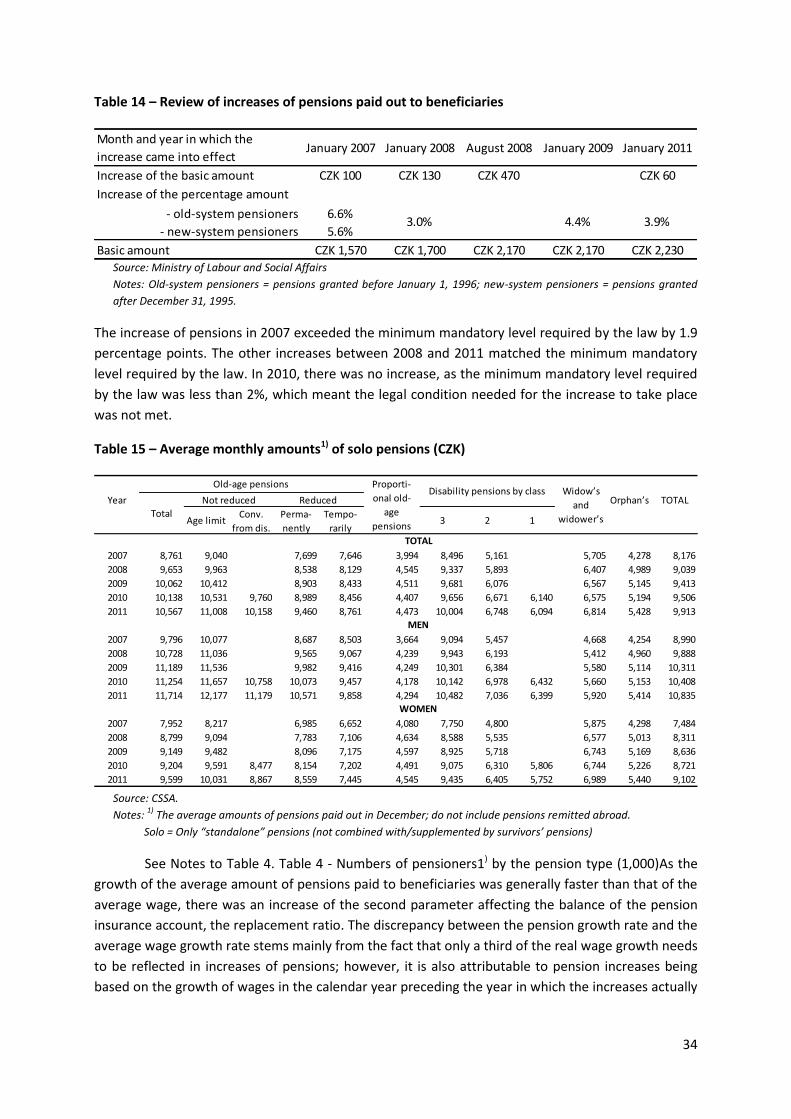
34
Table 14 – Review of increases of pensions paid out to beneficiaries
Source: Ministry of Labour and Social Affairs
Notes: Old-system pensioners = pensions granted before January 1, 1996; new-system pensioners = pensions granted
after December 31, 1995.
The increase of pensions in 2007 exceeded the minimum mandatory level required by the law by 1.9
percentage points. The other increases between 2008 and 2011 matched the minimum mandatory
level required by the law. In 2010, there was no increase, as the minimum mandatory level required
by the law was less than 2%, which meant the legal condition needed for the increase to take place
was not met.
Table 15 – Average monthly amounts1) of solo pensions (CZK)
Source: CSSA.
Notes: 1)
The average amounts of pensions paid out in December; do not include pensions remitted abroad.
Solo = Only “standalone” pensions (not combined with/supplemented by survivors’ pensions)
See Notes to Table 4. Table 4 - Numbers of pensioners1) by the pension type (1,000)As the
growth of the average amount of pensions paid to beneficiaries was generally faster than that of the
average wage, there was an increase of the second parameter affecting the balance of the pension
insurance account, the replacement ratio. The discrepancy between the pension growth rate and the
average wage growth rate stems mainly from the fact that only a third of the real wage growth needs
to be reflected in increases of pensions; however, it is also attributable to pension increases being
based on the growth of wages in the calendar year preceding the year in which the increases actually
Month and year in which the
increase came into effectJanuary 2007 January 2008 August 2008 January 2009 January 2011
Increase of the basic amount CZK 100 CZK 130 CZK 470 CZK 60
Increase of the percentage amount
- old-system pensioners 6.6%
- new-system pensioners 5.6%
Basic amount CZK 1,570 CZK 1,700 CZK 2,170 CZK 2,170 CZK 2,230
3.0% 4.4% 3.9%
Year Orphan’s TOTAL
Age limitConv.
from dis.
Perma-
nently
Tempo-
rarily3 2 1
2007 8,761 9,040 7,699 7,646 3,994 8,496 5,161 5,705 4,278 8,176
2008 9,653 9,963 8,538 8,129 4,545 9,337 5,893 6,407 4,989 9,039
2009 10,062 10,412 8,903 8,433 4,511 9,681 6,076 6,567 5,145 9,413
2010 10,138 10,531 9,760 8,989 8,456 4,407 9,656 6,671 6,140 6,575 5,194 9,506
2011 10,567 11,008 10,158 9,460 8,761 4,473 10,004 6,748 6,094 6,814 5,428 9,913
2007 9,796 10,077 8,687 8,503 3,664 9,094 5,457 4,668 4,254 8,990
2008 10,728 11,036 9,565 9,067 4,239 9,943 6,193 5,412 4,960 9,888
2009 11,189 11,536 9,982 9,416 4,249 10,301 6,384 5,580 5,114 10,311
2010 11,254 11,657 10,758 10,073 9,457 4,178 10,142 6,978 6,432 5,660 5,153 10,408
2011 11,714 12,177 11,179 10,571 9,858 4,294 10,482 7,036 6,399 5,920 5,414 10,835
2007 7,952 8,217 6,985 6,652 4,080 7,750 4,800 5,875 4,298 7,484
2008 8,799 9,094 7,783 7,106 4,634 8,588 5,535 6,577 5,013 8,311
2009 9,149 9,482 8,096 7,175 4,597 8,925 5,718 6,743 5,169 8,636
2010 9,204 9,591 8,477 8,154 7,202 4,491 9,075 6,310 5,806 6,744 5,226 8,721
2011 9,599 10,031 8,867 8,559 7,445 4,545 9,435 6,405 5,752 6,989 5,440 9,102
Widow’s
and
widower’s
TOTAL
MEN
WOMEN
Old-age pensions Proporti-
onal old-
age
pensionsTotal
Not reduced ReducedDisability pensions by class
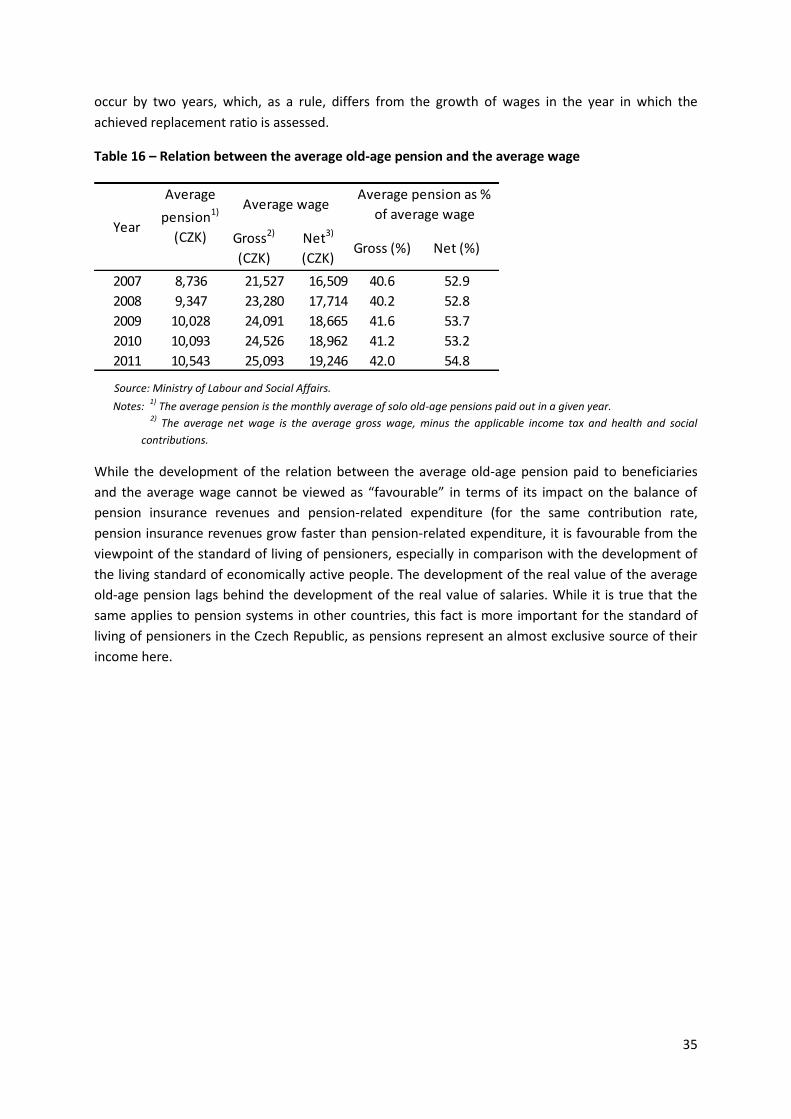
35
occur by two years, which, as a rule, differs from the growth of wages in the year in which the
achieved replacement ratio is assessed.
Table 16 – Relation between the average old-age pension and the average wage
Source: Ministry of Labour and Social Affairs. Notes:
1) The average pension is the monthly average of solo old-age pensions paid out in a given year.
2) The average net wage is the average gross wage, minus the applicable income tax and health and social
contributions.
While the development of the relation between the average old-age pension paid to beneficiaries
and the average wage cannot be viewed as “favourable” in terms of its impact on the balance of
pension insurance revenues and pension-related expenditure (for the same contribution rate,
pension insurance revenues grow faster than pension-related expenditure, it is favourable from the
viewpoint of the standard of living of pensioners, especially in comparison with the development of
the living standard of economically active people. The development of the real value of the average
old-age pension lags behind the development of the real value of salaries. While it is true that the
same applies to pension systems in other countries, this fact is more important for the standard of
living of pensioners in the Czech Republic, as pensions represent an almost exclusive source of their
income here.
Gross2)
(CZK)
Net3)
(CZK)Gross (%) Net (%)
2007 8,736 21,527 16,509 40.6 52.9
2008 9,347 23,280 17,714 40.2 52.8
2009 10,028 24,091 18,665 41.6 53.7
2010 10,093 24,526 18,962 41.2 53.2
2011 10,543 25,093 19,246 42.0 54.8
Year
Average wageAverage pension as %
of average wage
Average
pension1)
(CZK)
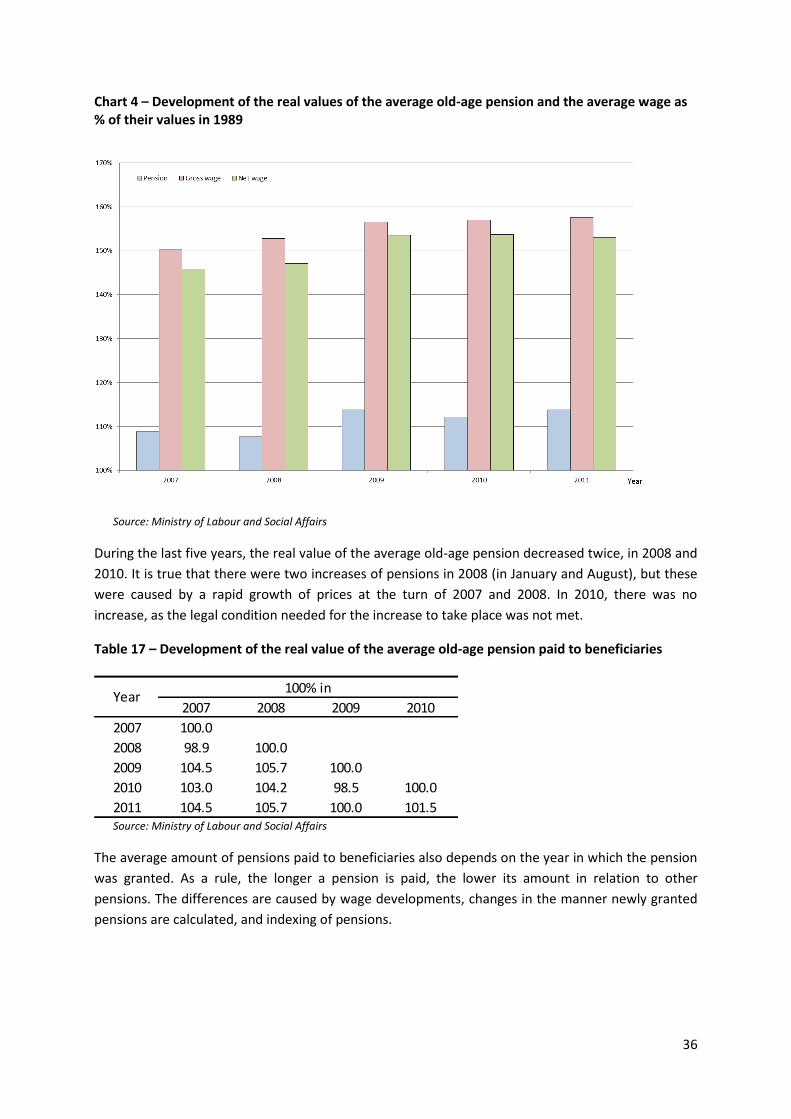
36
Chart 4 – Development of the real values of the average old-age pension and the average wage as % of their values in 1989
Source: Ministry of Labour and Social Affairs
During the last five years, the real value of the average old-age pension decreased twice, in 2008 and
2010. It is true that there were two increases of pensions in 2008 (in January and August), but these
were caused by a rapid growth of prices at the turn of 2007 and 2008. In 2010, there was no
increase, as the legal condition needed for the increase to take place was not met.
Table 17 – Development of the real value of the average old-age pension paid to beneficiaries
Source: Ministry of Labour and Social Affairs
The average amount of pensions paid to beneficiaries also depends on the year in which the pension
was granted. As a rule, the longer a pension is paid, the lower its amount in relation to other
pensions. The differences are caused by wage developments, changes in the manner newly granted
pensions are calculated, and indexing of pensions.
2007 2008 2009 2010
2007 100.0
2008 98.9 100.0
2009 104.5 105.7 100.0
2010 103.0 104.2 98.5 100.0
2011 104.5 105.7 100.0 101.5
100% inYear
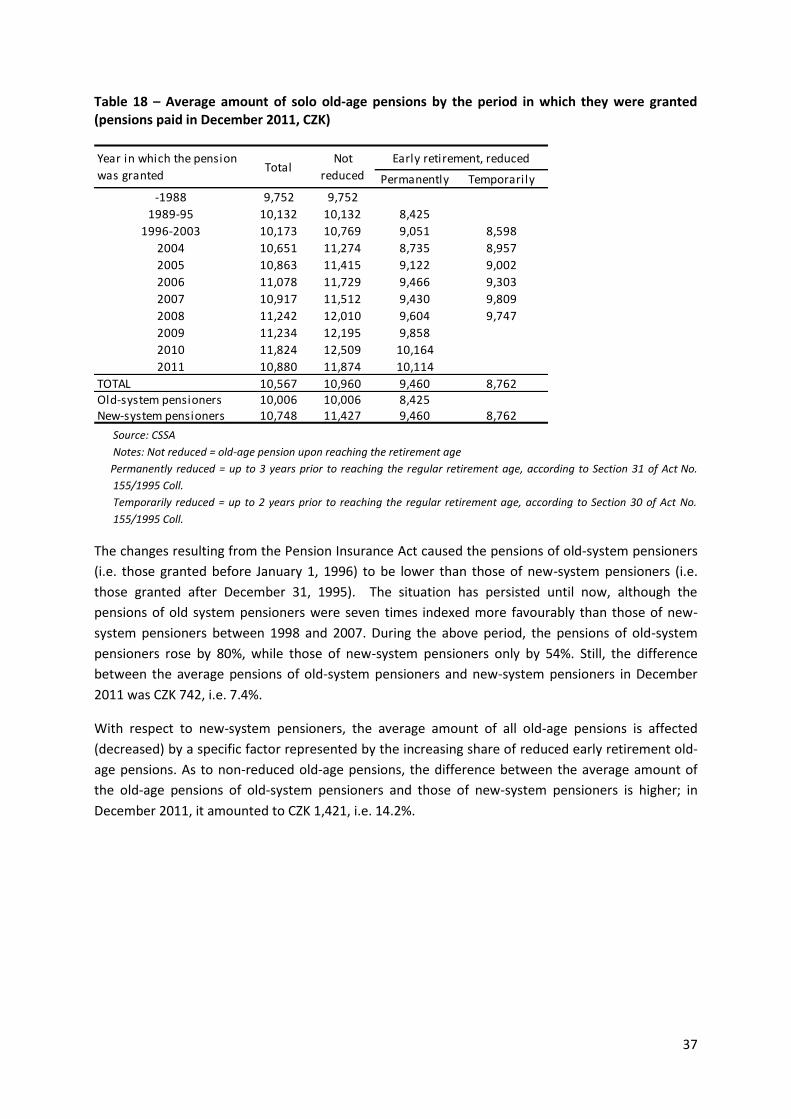
37
Table 18 – Average amount of solo old-age pensions by the period in which they were granted (pensions paid in December 2011, CZK)
Source: CSSA
Notes: Not reduced = old-age pension upon reaching the retirement age
Permanently reduced = up to 3 years prior to reaching the regular retirement age, according to Section 31 of Act No.
155/1995 Coll.
Temporarily reduced = up to 2 years prior to reaching the regular retirement age, according to Section 30 of Act No.
155/1995 Coll.
The changes resulting from the Pension Insurance Act caused the pensions of old-system pensioners
(i.e. those granted before January 1, 1996) to be lower than those of new-system pensioners (i.e.
those granted after December 31, 1995). The situation has persisted until now, although the
pensions of old system pensioners were seven times indexed more favourably than those of new-
system pensioners between 1998 and 2007. During the above period, the pensions of old-system
pensioners rose by 80%, while those of new-system pensioners only by 54%. Still, the difference
between the average pensions of old-system pensioners and new-system pensioners in December
2011 was CZK 742, i.e. 7.4%.
With respect to new-system pensioners, the average amount of all old-age pensions is affected
(decreased) by a specific factor represented by the increasing share of reduced early retirement old-
age pensions. As to non-reduced old-age pensions, the difference between the average amount of
the old-age pensions of old-system pensioners and those of new-system pensioners is higher; in
December 2011, it amounted to CZK 1,421, i.e. 14.2%.
Permanently Temporarily
-1988 9,752 9,752
1989-95 10,132 10,132 8,425
1996-2003 10,173 10,769 9,051 8,598
2004 10,651 11,274 8,735 8,957
2005 10,863 11,415 9,122 9,002
2006 11,078 11,729 9,466 9,303
2007 10,917 11,512 9,430 9,809
2008 11,242 12,010 9,604 9,747
2009 11,234 12,195 9,858
2010 11,824 12,509 10,164
2011 10,880 11,874 10,114
TOTAL 10,567 10,960 9,460 8,762Old-system pensioners 10,006 10,006 8,425New-system pensioners 10,748 11,427 9,460 8,762
Year in which the pension
was grantedTotal
Not
reduced
Early retirement, reduced
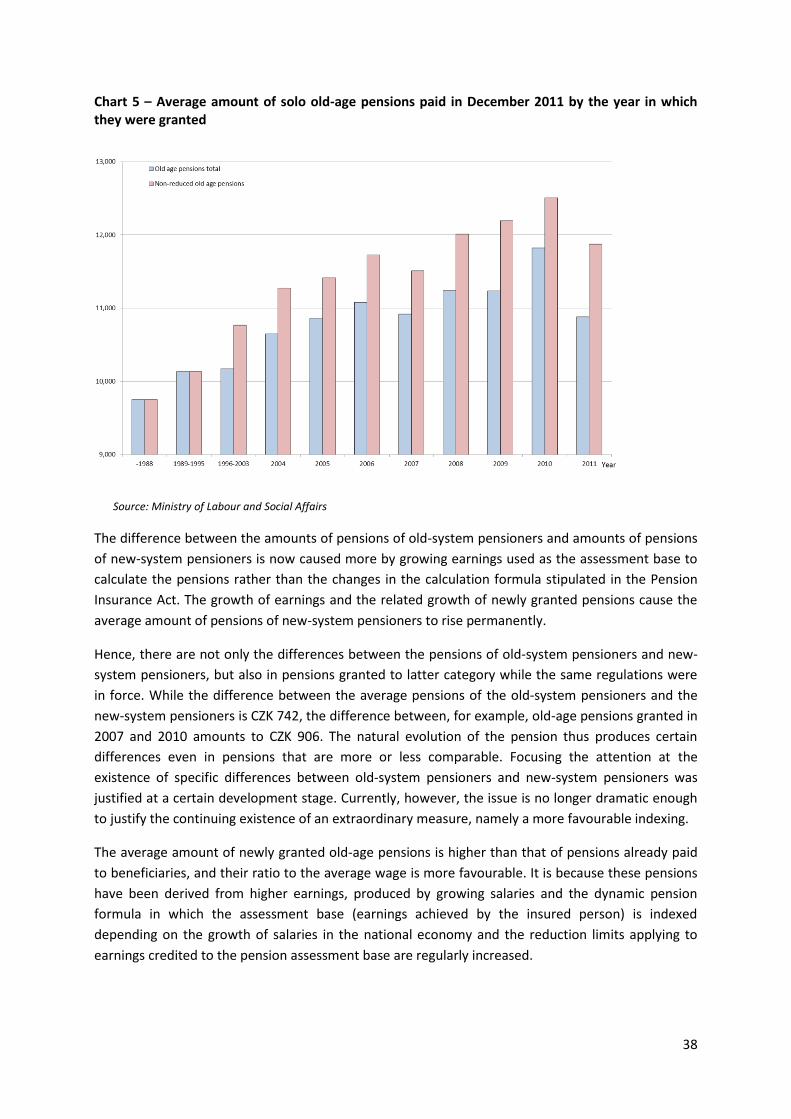
38
Chart 5 – Average amount of solo old-age pensions paid in December 2011 by the year in which they were granted
Source: Ministry of Labour and Social Affairs
The difference between the amounts of pensions of old-system pensioners and amounts of pensions
of new-system pensioners is now caused more by growing earnings used as the assessment base to
calculate the pensions rather than the changes in the calculation formula stipulated in the Pension
Insurance Act. The growth of earnings and the related growth of newly granted pensions cause the
average amount of pensions of new-system pensioners to rise permanently.
Hence, there are not only the differences between the pensions of old-system pensioners and new-
system pensioners, but also in pensions granted to latter category while the same regulations were
in force. While the difference between the average pensions of the old-system pensioners and the
new-system pensioners is CZK 742, the difference between, for example, old-age pensions granted in
2007 and 2010 amounts to CZK 906. The natural evolution of the pension thus produces certain
differences even in pensions that are more or less comparable. Focusing the attention at the
existence of specific differences between old-system pensioners and new-system pensioners was
justified at a certain development stage. Currently, however, the issue is no longer dramatic enough
to justify the continuing existence of an extraordinary measure, namely a more favourable indexing.
The average amount of newly granted old-age pensions is higher than that of pensions already paid
to beneficiaries, and their ratio to the average wage is more favourable. It is because these pensions
have been derived from higher earnings, produced by growing salaries and the dynamic pension
formula in which the assessment base (earnings achieved by the insured person) is indexed
depending on the growth of salaries in the national economy and the reduction limits applying to
earnings credited to the pension assessment base are regularly increased.
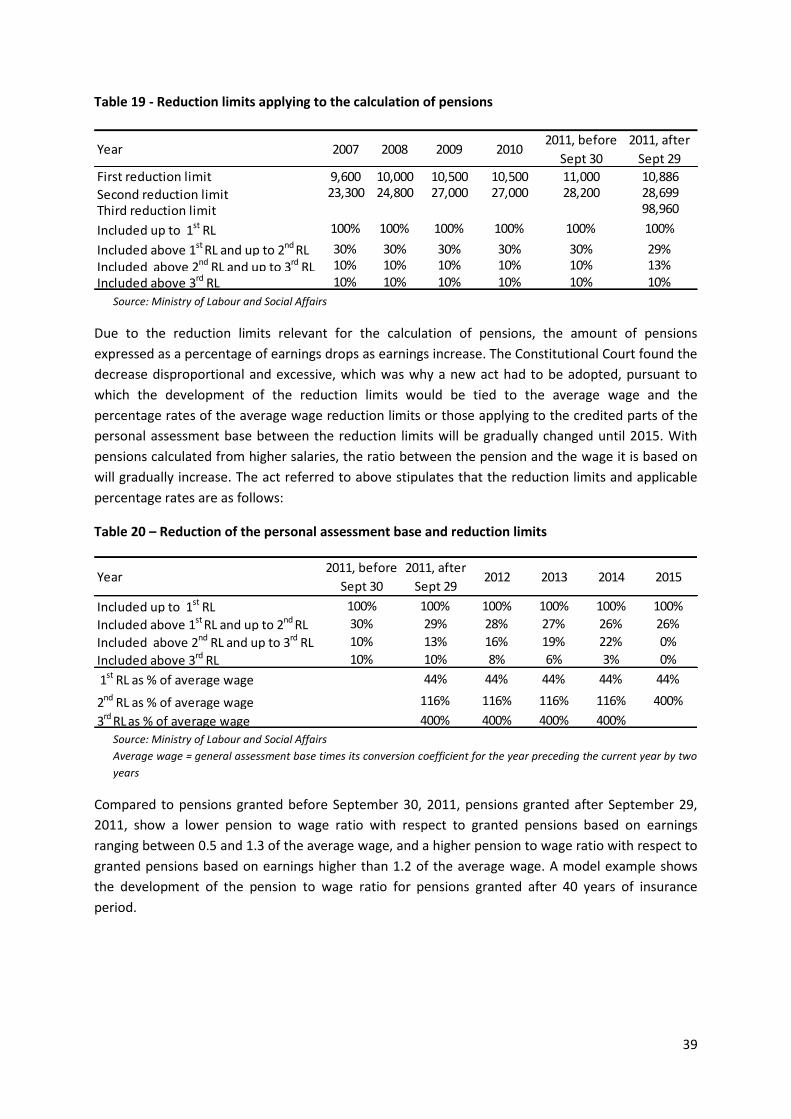
39
Table 19 - Reduction limits applying to the calculation of pensions
Source: Ministry of Labour and Social Affairs
Due to the reduction limits relevant for the calculation of pensions, the amount of pensions
expressed as a percentage of earnings drops as earnings increase. The Constitutional Court found the
decrease disproportional and excessive, which was why a new act had to be adopted, pursuant to
which the development of the reduction limits would be tied to the average wage and the
percentage rates of the average wage reduction limits or those applying to the credited parts of the
personal assessment base between the reduction limits will be gradually changed until 2015. With
pensions calculated from higher salaries, the ratio between the pension and the wage it is based on
will gradually increase. The act referred to above stipulates that the reduction limits and applicable
percentage rates are as follows:
Table 20 – Reduction of the personal assessment base and reduction limits
Source: Ministry of Labour and Social Affairs
Average wage = general assessment base times its conversion coefficient for the year preceding the current year by two
years
Compared to pensions granted before September 30, 2011, pensions granted after September 29,
2011, show a lower pension to wage ratio with respect to granted pensions based on earnings
ranging between 0.5 and 1.3 of the average wage, and a higher pension to wage ratio with respect to
granted pensions based on earnings higher than 1.2 of the average wage. A model example shows
the development of the pension to wage ratio for pensions granted after 40 years of insurance
period.
Year 2007 2008 2009 20102011, before
Sept 30
2011, after
Sept 29
First reduction limit 9,600 10,000 10,500 10,500 11,000 10,886
Second reduction limit 23,300 24,800 27,000 27,000 28,200 28,699
Third reduction limit 98,960
Included up to 1st RL 100% 100% 100% 100% 100% 100%
Included above 1st RL and up to 2nd RL 30% 30% 30% 30% 30% 29%
Included above 2nd RL and up to 3rd RL 10% 10% 10% 10% 10% 13%
Included above 3rd RL 10% 10% 10% 10% 10% 10%
Year2011, before
Sept 30
2011, after
Sept 292012 2013 2014 2015
Included up to 1st RL 100% 100% 100% 100% 100% 100%
Included above 1st RL and up to 2nd RL 30% 29% 28% 27% 26% 26%
Included above 2nd RL and up to 3rd RL 10% 13% 16% 19% 22% 0%
Included above 3rd RL 10% 10% 8% 6% 3% 0%
1st RL as % of average wage 44% 44% 44% 44% 44%
2nd RL as % of average wage 116% 116% 116% 116% 400%
3rd RL as % of average wage 400% 400% 400% 400%
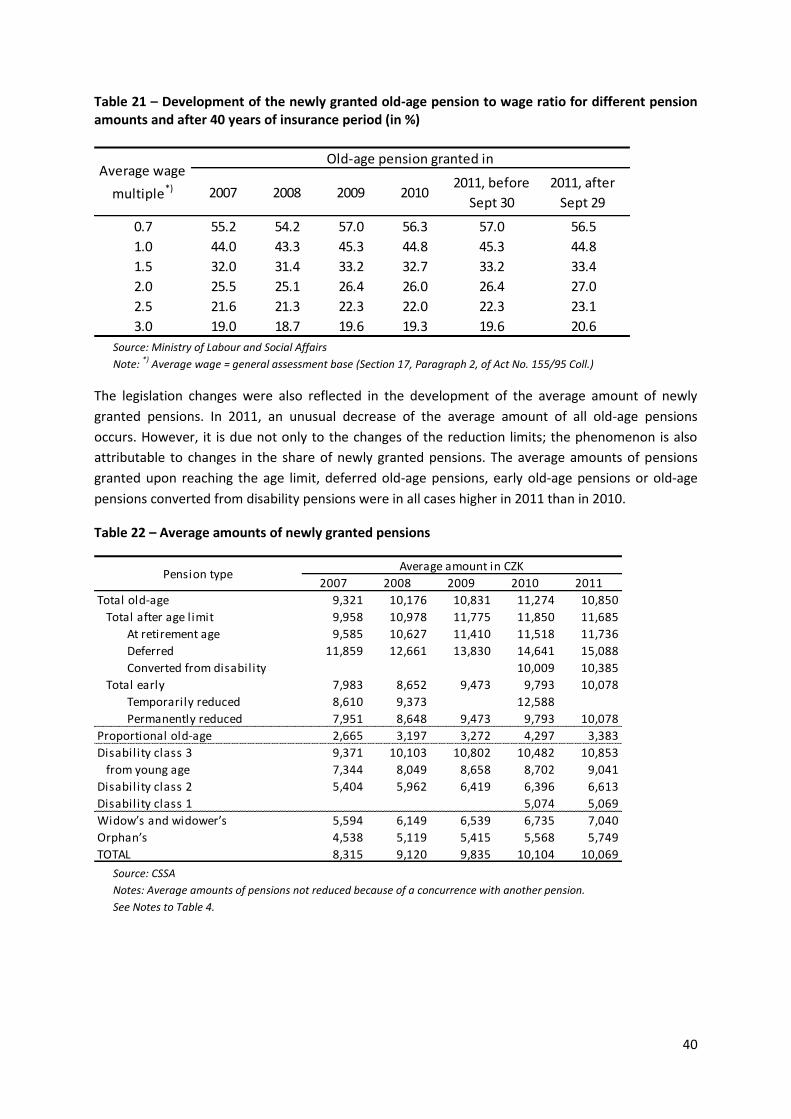
40
Table 21 – Development of the newly granted old-age pension to wage ratio for different pension amounts and after 40 years of insurance period (in %)
Source: Ministry of Labour and Social Affairs
Note: *)
Average wage = general assessment base (Section 17, Paragraph 2, of Act No. 155/95 Coll.)
The legislation changes were also reflected in the development of the average amount of newly
granted pensions. In 2011, an unusual decrease of the average amount of all old-age pensions
occurs. However, it is due not only to the changes of the reduction limits; the phenomenon is also
attributable to changes in the share of newly granted pensions. The average amounts of pensions
granted upon reaching the age limit, deferred old-age pensions, early old-age pensions or old-age
pensions converted from disability pensions were in all cases higher in 2011 than in 2010.
Table 22 – Average amounts of newly granted pensions
Source: CSSA
Notes: Average amounts of pensions not reduced because of a concurrence with another pension.
See Notes to Table 4.
2007 2008 2009 20102011, before
Sept 30
2011, after
Sept 29
0.7 55.2 54.2 57.0 56.3 57.0 56.5
1.0 44.0 43.3 45.3 44.8 45.3 44.8
1.5 32.0 31.4 33.2 32.7 33.2 33.4
2.0 25.5 25.1 26.4 26.0 26.4 27.0
2.5 21.6 21.3 22.3 22.0 22.3 23.1
3.0 19.0 18.7 19.6 19.3 19.6 20.6
Average wage
multiple*)
Old-age pension granted in
2007 2008 2009 2010 2011
9,321 10,176 10,831 11,274 10,850
9,958 10,978 11,775 11,850 11,685
At retirement age 9,585 10,627 11,410 11,518 11,736
Deferred 11,859 12,661 13,830 14,641 15,088
Converted from disability 10,009 10,385
7,983 8,652 9,473 9,793 10,078
Temporarily reduced 8,610 9,373 12,588
Permanently reduced 7,951 8,648 9,473 9,793 10,078
2,665 3,197 3,272 4,297 3,383
9,371 10,103 10,802 10,482 10,853
7,344 8,049 8,658 8,702 9,041
5,404 5,962 6,419 6,396 6,613
5,074 5,069
5,594 6,149 6,539 6,735 7,040
4,538 5,119 5,415 5,568 5,749
8,315 9,120 9,835 10,104 10,069
Widow’s and widower’s
Orphan’s
TOTAL
Pension typeAverage amount in CZK
Total old-age
Disability class 3
Total after age limit
Total early
Proportional old-age
from young age
Disability class 2
Disability class 1
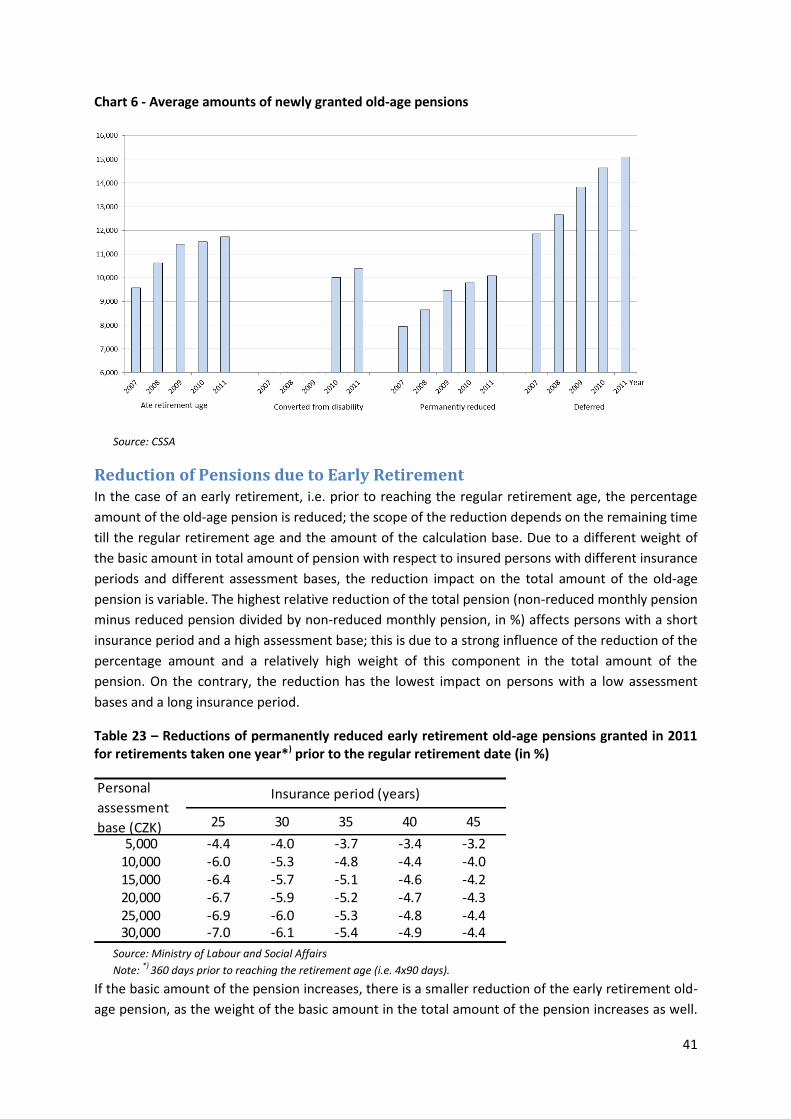
41
Chart 6 - Average amounts of newly granted old-age pensions
Source: CSSA
Reduction of Pensions due to Early Retirement In the case of an early retirement, i.e. prior to reaching the regular retirement age, the percentage
amount of the old-age pension is reduced; the scope of the reduction depends on the remaining time
till the regular retirement age and the amount of the calculation base. Due to a different weight of
the basic amount in total amount of pension with respect to insured persons with different insurance
periods and different assessment bases, the reduction impact on the total amount of the old-age
pension is variable. The highest relative reduction of the total pension (non-reduced monthly pension
minus reduced pension divided by non-reduced monthly pension, in %) affects persons with a short
insurance period and a high assessment base; this is due to a strong influence of the reduction of the
percentage amount and a relatively high weight of this component in the total amount of the
pension. On the contrary, the reduction has the lowest impact on persons with a low assessment
bases and a long insurance period.
Table 23 – Reductions of permanently reduced early retirement old-age pensions granted in 2011 for retirements taken one year*) prior to the regular retirement date (in %)
Source: Ministry of Labour and Social Affairs
Note: *)
360 days prior to reaching the retirement age (i.e. 4x90 days).
If the basic amount of the pension increases, there is a smaller reduction of the early retirement old-
age pension, as the weight of the basic amount in the total amount of the pension increases as well.
25 30 35 40 45
5,000 -4.4 -4.0 -3.7 -3.4 -3.210,000 -6.0 -5.3 -4.8 -4.4 -4.015,000 -6.4 -5.7 -5.1 -4.6 -4.220,000 -6.7 -5.9 -5.2 -4.7 -4.325,000 -6.9 -6.0 -5.3 -4.8 -4.430,000 -7.0 -6.1 -5.4 -4.9 -4.4
Personal
assessment
base (CZK)
Insurance period (years)
42
This is most significant in the case of insured persons with a low assessment base and a short
insurance period. The increase of the basic amount is also a probable cause of the fact that the ratio
between the average amount of newly granted permanently reduced early retirement old-age
pension and the average amount of non-reduced old-age pensions granted as of the date of reaching
the regular retirement age rose from 83% to 86% between 2007 and 2011.
Differentiation of Pensions by the Amount of Pension6 The differentiation of old-age pensions in terms of their amounts is affected by a number of factors.
Its level and development are influenced mainly by the following factors:
a) the development of the differentiation of newly granted old-age pensions in different years,
which shows a clearly growing trend due to dynamic elements in the pension calculation
formula;
b) differences in the differentiation of pensions due to different times when they were granted
and a decreasing percentage of pensions granted in earlier years (in respect whereof the
differentiation was lower);
c) the development of the basic amount of pension to total pension ratio;
d) indexing of pensions and a differentiation in their amounts with respect to old-system
pensioners and new-system pensioners;
e) structural differences of the groups in which the differentiation is measured due to factors not
related to the pension system.
The differentiation of pensions decreases in connection with the transition from the group
comprising all old-age pensions to separate groups comprising men and women. In the 2007 – 2011
period, it showed a slight increase, particularly as a result of a slightly faster rate of growth of higher
pensions paid to women.
6 Quantiles and the characteristics derived from them will be used for the measurement of the differentiation of old-age
pensions by their amount. A quantile is the amount of earnings (e.g. pension) which a certain percentage of pensioners receive. For example, the 10% quantile is the amount of income (earnings) indicating that 10 % of the people have earnings up to this amount. The 50% quantile is referred to as the median and in the case of a normal distribution is equal to the average. The basic characteristics will be the widths of the intervals of incomes around the median, expressed as percentages of the median, and comprising : 20 % of pensioners: the characteristic is designated ( ) ( ) ⁄ , 50 % of pensioners: the characteristic is designated ( ) ( ) ⁄ 80 % of pensioners: the characteristic is designated ( ) ( ) ⁄ where qx is the x% quantile. The greater the M(XX) numbers, i.e. the wider the interval comprising the appropriate percentage of pensioners, the larger the differentiation. The calculations made use of data on solo old-age pensions.
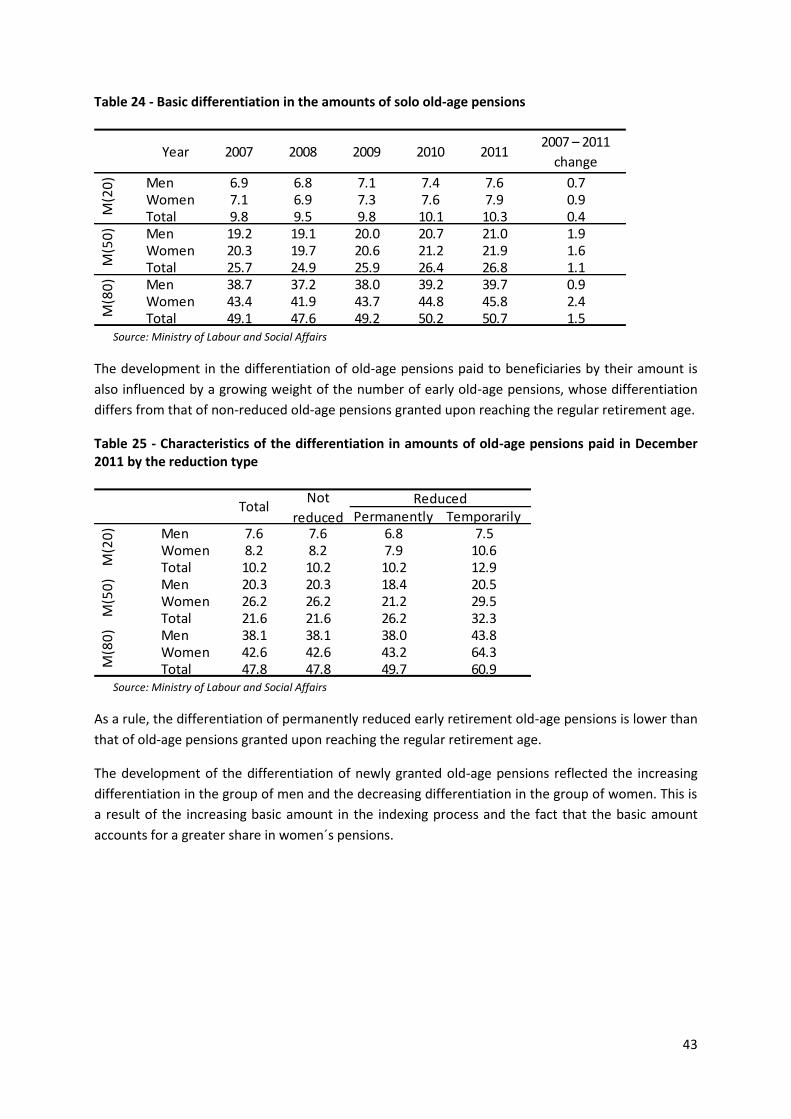
43
Table 24 - Basic differentiation in the amounts of solo old-age pensions
Source: Ministry of Labour and Social Affairs
The development in the differentiation of old-age pensions paid to beneficiaries by their amount is
also influenced by a growing weight of the number of early old-age pensions, whose differentiation
differs from that of non-reduced old-age pensions granted upon reaching the regular retirement age.
Table 25 - Characteristics of the differentiation in amounts of old-age pensions paid in December 2011 by the reduction type
Source: Ministry of Labour and Social Affairs
As a rule, the differentiation of permanently reduced early retirement old-age pensions is lower than
that of old-age pensions granted upon reaching the regular retirement age.
The development of the differentiation of newly granted old-age pensions reflected the increasing
differentiation in the group of men and the decreasing differentiation in the group of women. This is
a result of the increasing basic amount in the indexing process and the fact that the basic amount
accounts for a greater share in women´s pensions.
Year 2007 2008 2009 2010 20112007 – 2011
change
Men 6.9 6.8 7.1 7.4 7.6 0.7Women 7.1 6.9 7.3 7.6 7.9 0.9Total 9.8 9.5 9.8 10.1 10.3 0.4Men 19.2 19.1 20.0 20.7 21.0 1.9Women 20.3 19.7 20.6 21.2 21.9 1.6Total 25.7 24.9 25.9 26.4 26.8 1.1Men 38.7 37.2 38.0 39.2 39.7 0.9Women 43.4 41.9 43.7 44.8 45.8 2.4Total 49.1 47.6 49.2 50.2 50.7 1.5M
(80
)M
(50
)M
(20
)
Permanently TemporarilyMen 7.6 7.6 6.8 7.5Women 8.2 8.2 7.9 10.6Total 10.2 10.2 10.2 12.9Men 20.3 20.3 18.4 20.5Women 26.2 26.2 21.2 29.5Total 21.6 21.6 26.2 32.3Men 38.1 38.1 38.0 43.8Women 42.6 42.6 43.2 64.3Total 47.8 47.8 49.7 60.9
M(5
0)
M(8
0)
TotalNot
reduced
Reduced
M(2
0)
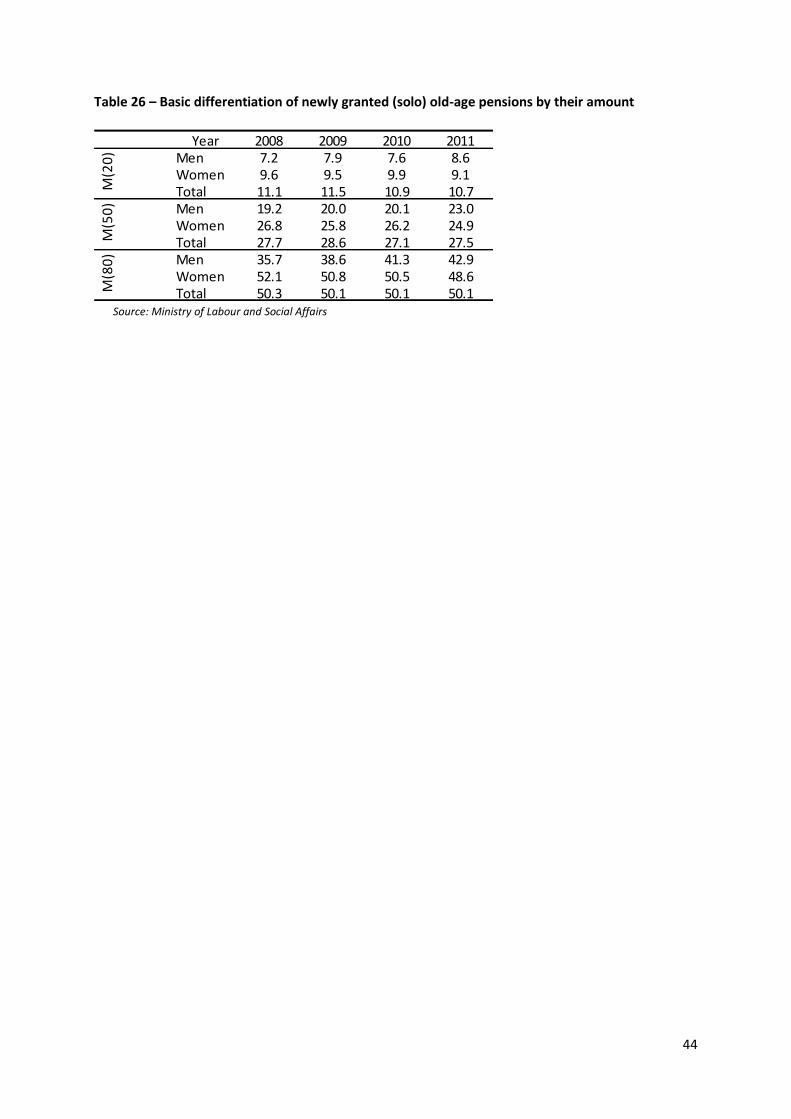
44
Table 26 – Basic differentiation of newly granted (solo) old-age pensions by their amount
Source: Ministry of Labour and Social Affairs
Year 2008 2009 2010 2011Men 7.2 7.9 7.6 8.6Women 9.6 9.5 9.9 9.1Total 11.1 11.5 10.9 10.7Men 19.2 20.0 20.1 23.0Women 26.8 25.8 26.2 24.9Total 27.7 28.6 27.1 27.5Men 35.7 38.6 41.3 42.9Women 52.1 50.8 50.5 48.6Total 50.3 50.1 50.1 50.1M
(80
)M
(20
)M
(50
)
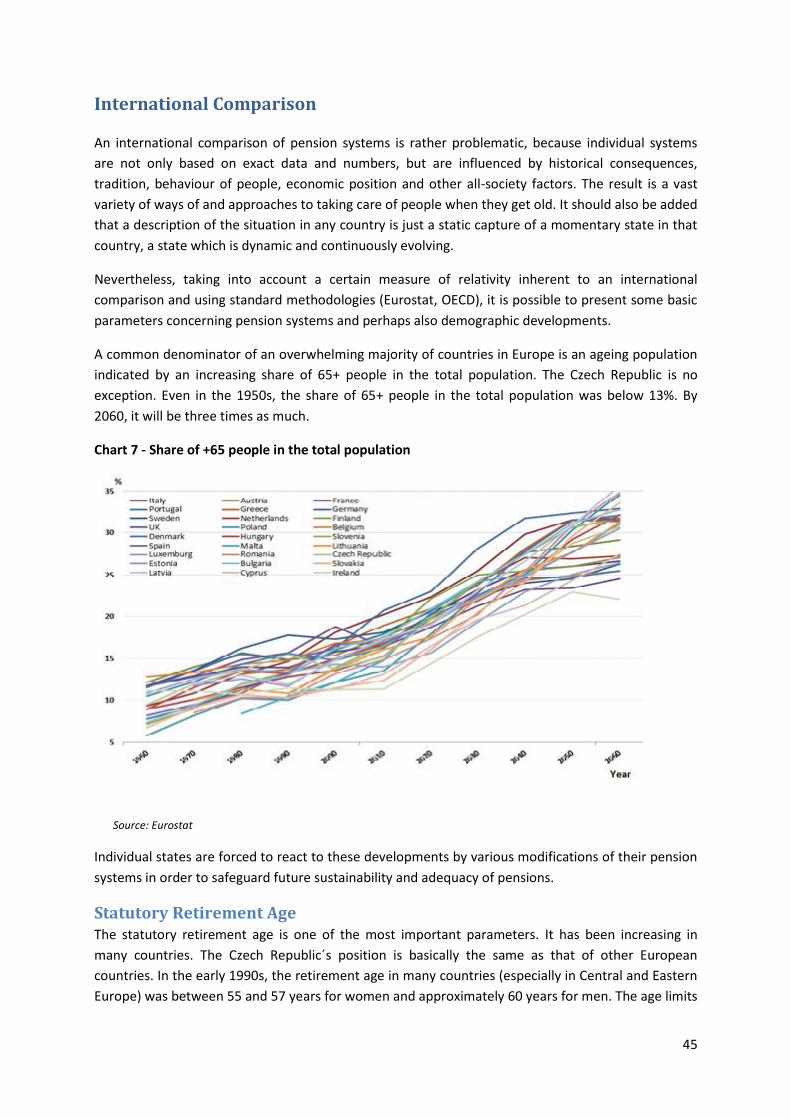
45
International Comparison
An international comparison of pension systems is rather problematic, because individual systems
are not only based on exact data and numbers, but are influenced by historical consequences,
tradition, behaviour of people, economic position and other all-society factors. The result is a vast
variety of ways of and approaches to taking care of people when they get old. It should also be added
that a description of the situation in any country is just a static capture of a momentary state in that
country, a state which is dynamic and continuously evolving.
Nevertheless, taking into account a certain measure of relativity inherent to an international
comparison and using standard methodologies (Eurostat, OECD), it is possible to present some basic
parameters concerning pension systems and perhaps also demographic developments.
A common denominator of an overwhelming majority of countries in Europe is an ageing population
indicated by an increasing share of 65+ people in the total population. The Czech Republic is no
exception. Even in the 1950s, the share of 65+ people in the total population was below 13%. By
2060, it will be three times as much.
Chart 7 - Share of +65 people in the total population
Source: Eurostat
Individual states are forced to react to these developments by various modifications of their pension
systems in order to safeguard future sustainability and adequacy of pensions.
Statutory Retirement Age The statutory retirement age is one of the most important parameters. It has been increasing in
many countries. The Czech Republic´s position is basically the same as that of other European
countries. In the early 1990s, the retirement age in many countries (especially in Central and Eastern
Europe) was between 55 and 57 years for women and approximately 60 years for men. The age limits
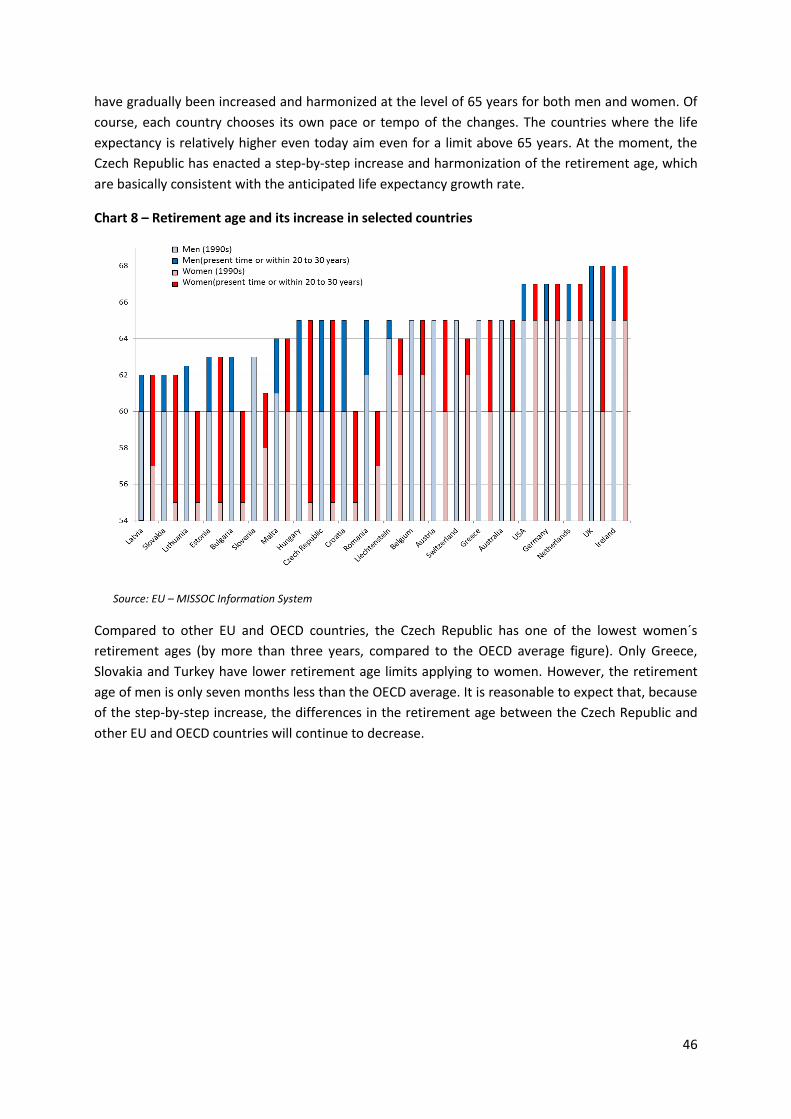
46
have gradually been increased and harmonized at the level of 65 years for both men and women. Of
course, each country chooses its own pace or tempo of the changes. The countries where the life
expectancy is relatively higher even today aim even for a limit above 65 years. At the moment, the
Czech Republic has enacted a step-by-step increase and harmonization of the retirement age, which
are basically consistent with the anticipated life expectancy growth rate.
Chart 8 – Retirement age and its increase in selected countries
Source: EU – MISSOC Information System
Compared to other EU and OECD countries, the Czech Republic has one of the lowest women´s
retirement ages (by more than three years, compared to the OECD average figure). Only Greece,
Slovakia and Turkey have lower retirement age limits applying to women. However, the retirement
age of men is only seven months less than the OECD average. It is reasonable to expect that, because
of the step-by-step increase, the differences in the retirement age between the Czech Republic and
other EU and OECD countries will continue to decrease.
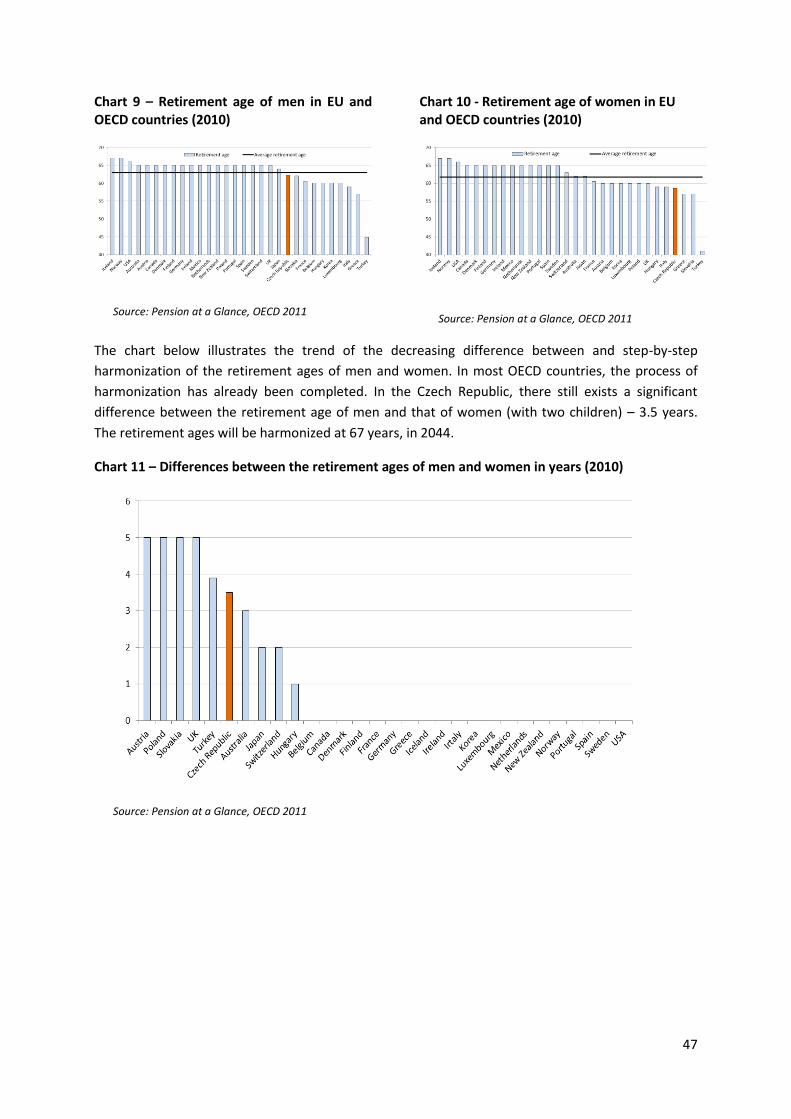
47
Chart 9 – Retirement age of men in EU and OECD countries (2010)
Source: Pension at a Glance, OECD 2011
Chart 10 - Retirement age of women in EU and OECD countries (2010)
Source: Pension at a Glance, OECD 2011
The chart below illustrates the trend of the decreasing difference between and step-by-step
harmonization of the retirement ages of men and women. In most OECD countries, the process of
harmonization has already been completed. In the Czech Republic, there still exists a significant
difference between the retirement age of men and that of women (with two children) – 3.5 years.
The retirement ages will be harmonized at 67 years, in 2044.
Chart 11 – Differences between the retirement ages of men and women in years (2010)
Source: Pension at a Glance, OECD 2011
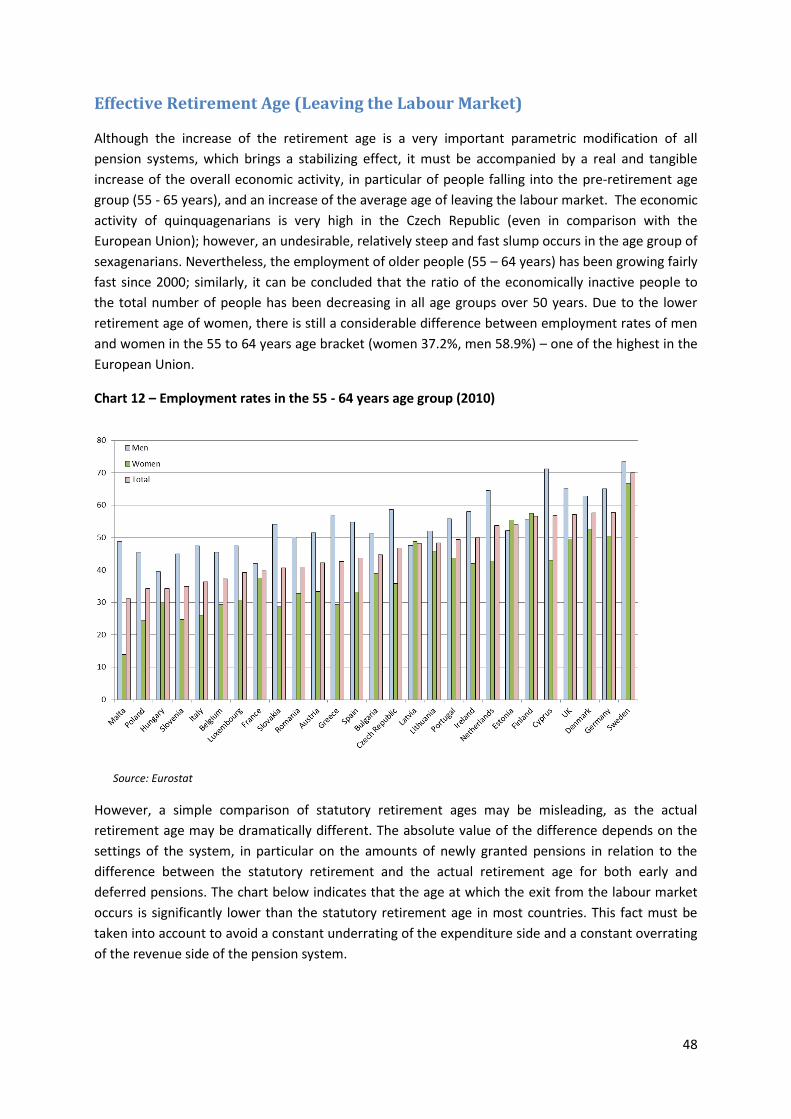
48
Effective Retirement Age (Leaving the Labour Market)
Although the increase of the retirement age is a very important parametric modification of all
pension systems, which brings a stabilizing effect, it must be accompanied by a real and tangible
increase of the overall economic activity, in particular of people falling into the pre-retirement age
group (55 - 65 years), and an increase of the average age of leaving the labour market. The economic
activity of quinquagenarians is very high in the Czech Republic (even in comparison with the
European Union); however, an undesirable, relatively steep and fast slump occurs in the age group of
sexagenarians. Nevertheless, the employment of older people (55 – 64 years) has been growing fairly
fast since 2000; similarly, it can be concluded that the ratio of the economically inactive people to
the total number of people has been decreasing in all age groups over 50 years. Due to the lower
retirement age of women, there is still a considerable difference between employment rates of men
and women in the 55 to 64 years age bracket (women 37.2%, men 58.9%) – one of the highest in the
European Union.
Chart 12 – Employment rates in the 55 - 64 years age group (2010)
Source: Eurostat
However, a simple comparison of statutory retirement ages may be misleading, as the actual
retirement age may be dramatically different. The absolute value of the difference depends on the
settings of the system, in particular on the amounts of newly granted pensions in relation to the
difference between the statutory retirement and the actual retirement age for both early and
deferred pensions. The chart below indicates that the age at which the exit from the labour market
occurs is significantly lower than the statutory retirement age in most countries. This fact must be
taken into account to avoid a constant underrating of the expenditure side and a constant overrating
of the revenue side of the pension system.
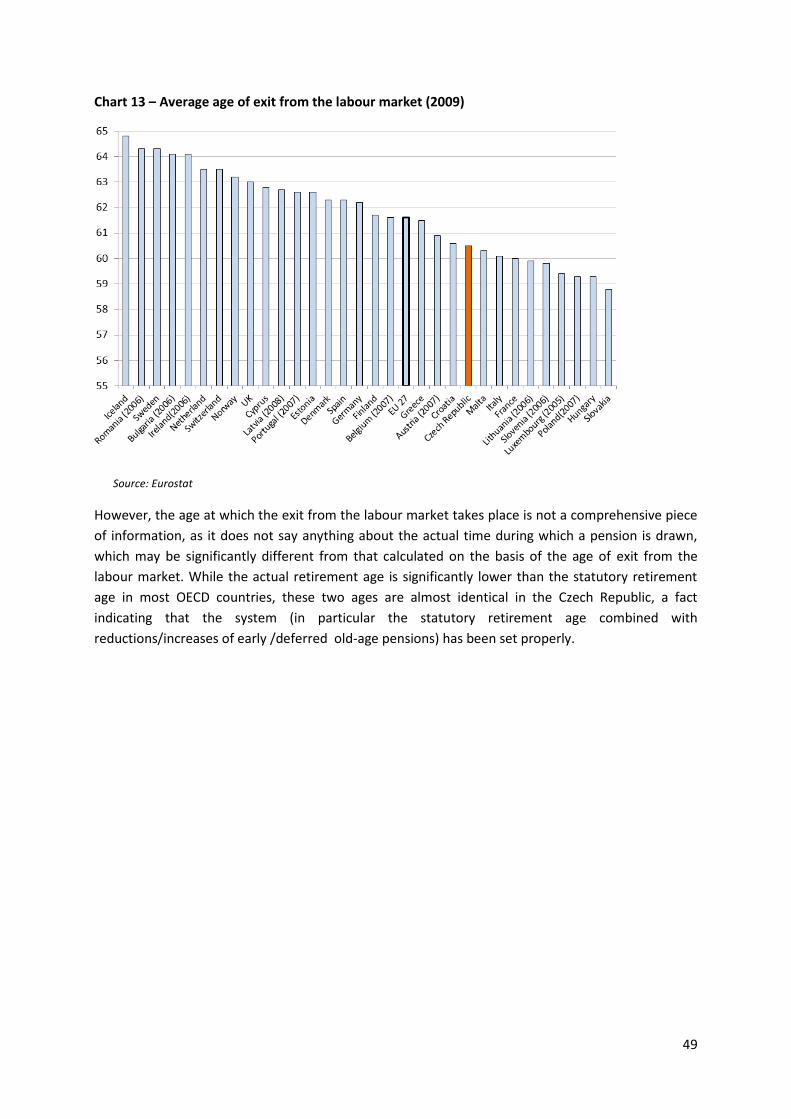
49
Chart 13 – Average age of exit from the labour market (2009)
Source: Eurostat
However, the age at which the exit from the labour market takes place is not a comprehensive piece
of information, as it does not say anything about the actual time during which a pension is drawn,
which may be significantly different from that calculated on the basis of the age of exit from the
labour market. While the actual retirement age is significantly lower than the statutory retirement
age in most OECD countries, these two ages are almost identical in the Czech Republic, a fact
indicating that the system (in particular the statutory retirement age combined with
reductions/increases of early /deferred old-age pensions) has been set properly.
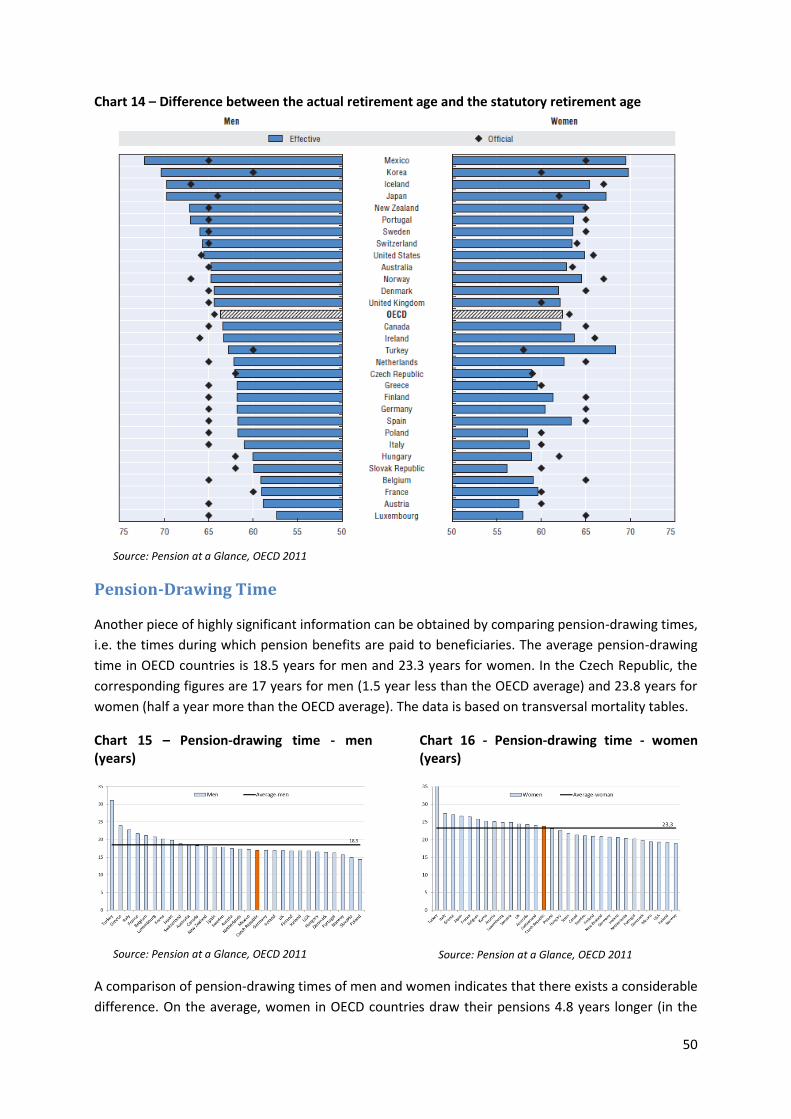
50
Chart 14 – Difference between the actual retirement age and the statutory retirement age
Source: Pension at a Glance, OECD 2011
Pension-Drawing Time
Another piece of highly significant information can be obtained by comparing pension-drawing times,
i.e. the times during which pension benefits are paid to beneficiaries. The average pension-drawing
time in OECD countries is 18.5 years for men and 23.3 years for women. In the Czech Republic, the
corresponding figures are 17 years for men (1.5 year less than the OECD average) and 23.8 years for
women (half a year more than the OECD average). The data is based on transversal mortality tables.
Chart 15 – Pension-drawing time - men (years)
Source: Pension at a Glance, OECD 2011
Chart 16 - Pension-drawing time - women (years)
Source: Pension at a Glance, OECD 2011
A comparison of pension-drawing times of men and women indicates that there exists a considerable
difference. On the average, women in OECD countries draw their pensions 4.8 years longer (in the
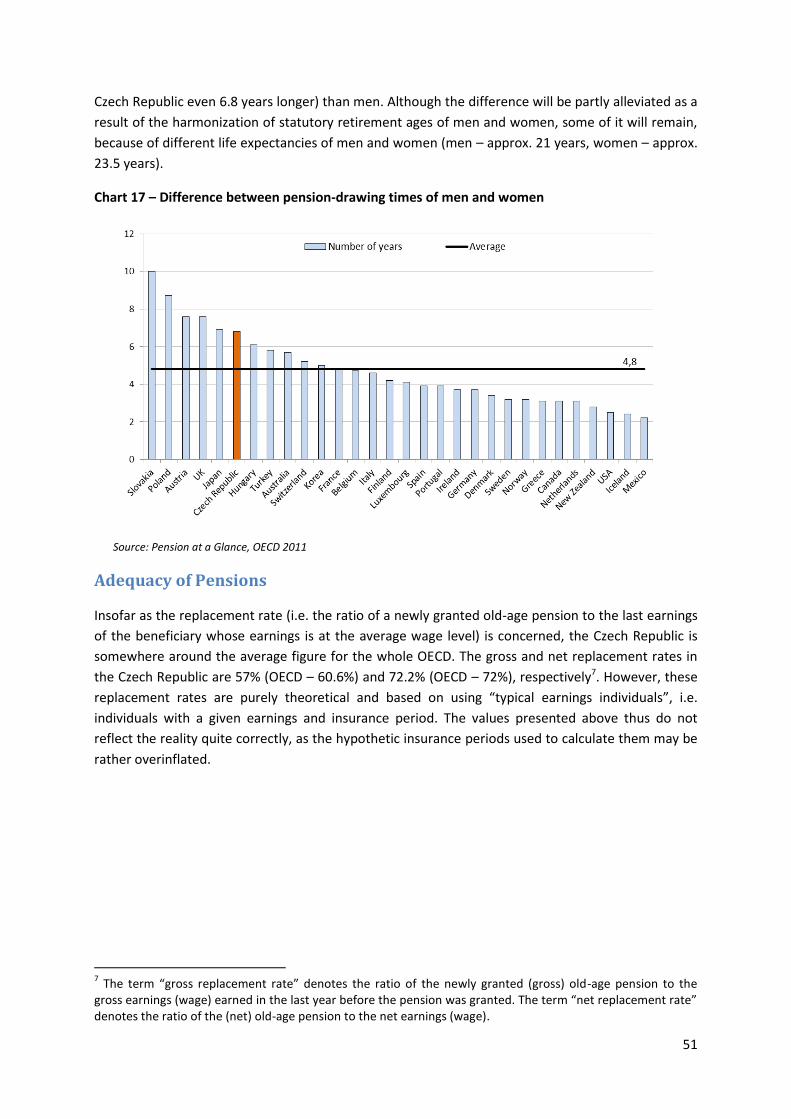
51
Czech Republic even 6.8 years longer) than men. Although the difference will be partly alleviated as a
result of the harmonization of statutory retirement ages of men and women, some of it will remain,
because of different life expectancies of men and women (men – approx. 21 years, women – approx.
23.5 years).
Chart 17 – Difference between pension-drawing times of men and women
Source: Pension at a Glance, OECD 2011
Adequacy of Pensions
Insofar as the replacement rate (i.e. the ratio of a newly granted old-age pension to the last earnings
of the beneficiary whose earnings is at the average wage level) is concerned, the Czech Republic is
somewhere around the average figure for the whole OECD. The gross and net replacement rates in
the Czech Republic are 57% (OECD – 60.6%) and 72.2% (OECD – 72%), respectively7. However, these
replacement rates are purely theoretical and based on using “typical earnings individuals”, i.e.
individuals with a given earnings and insurance period. The values presented above thus do not
reflect the reality quite correctly, as the hypothetic insurance periods used to calculate them may be
rather overinflated.
7 The term “gross replacement rate” denotes the ratio of the newly granted (gross) old-age pension to the
gross earnings (wage) earned in the last year before the pension was granted. The term “net replacement rate” denotes the ratio of the (net) old-age pension to the net earnings (wage).
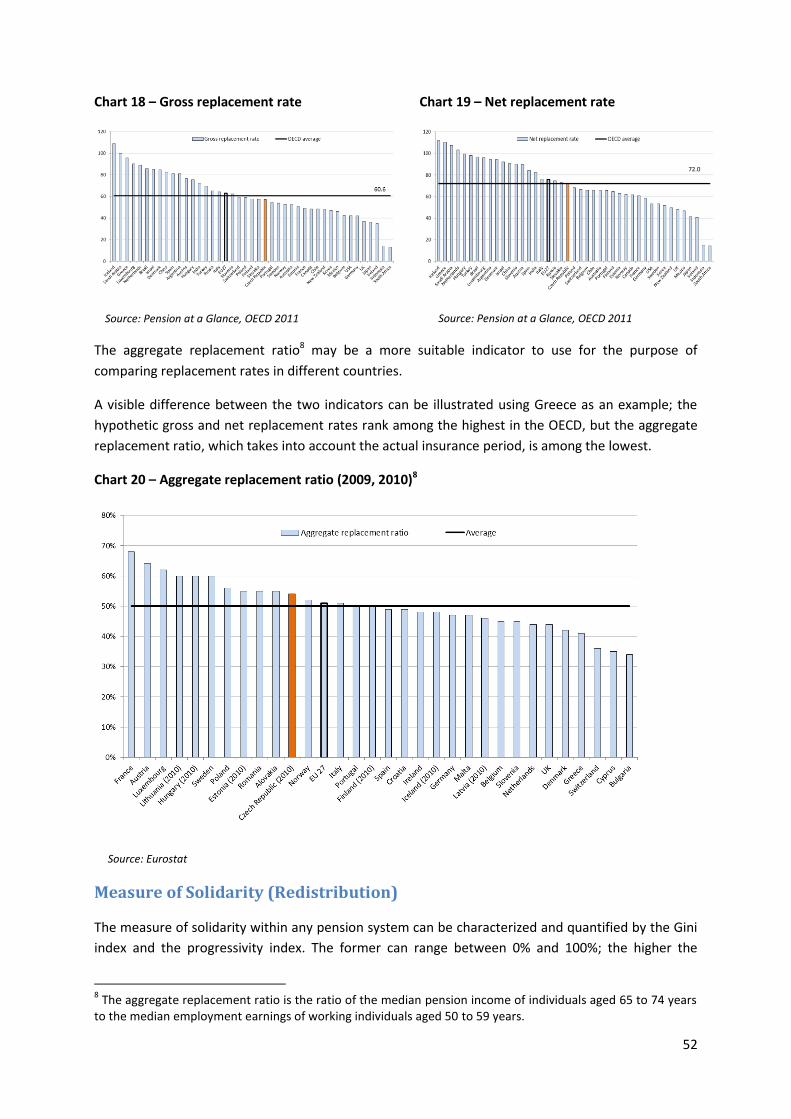
52
Chart 18 – Gross replacement rate
Source: Pension at a Glance, OECD 2011
Chart 19 – Net replacement rate
Source: Pension at a Glance, OECD 2011
The aggregate replacement ratio8 may be a more suitable indicator to use for the purpose of
comparing replacement rates in different countries.
A visible difference between the two indicators can be illustrated using Greece as an example; the
hypothetic gross and net replacement rates rank among the highest in the OECD, but the aggregate
replacement ratio, which takes into account the actual insurance period, is among the lowest.
Chart 20 – Aggregate replacement ratio (2009, 2010)8
Source: Eurostat
Measure of Solidarity (Redistribution)
The measure of solidarity within any pension system can be characterized and quantified by the Gini
index and the progressivity index. The former can range between 0% and 100%; the higher the
8 The aggregate replacement ratio is the ratio of the median pension income of individuals aged 65 to 74 years
to the median employment earnings of working individuals aged 50 to 59 years.
72.0
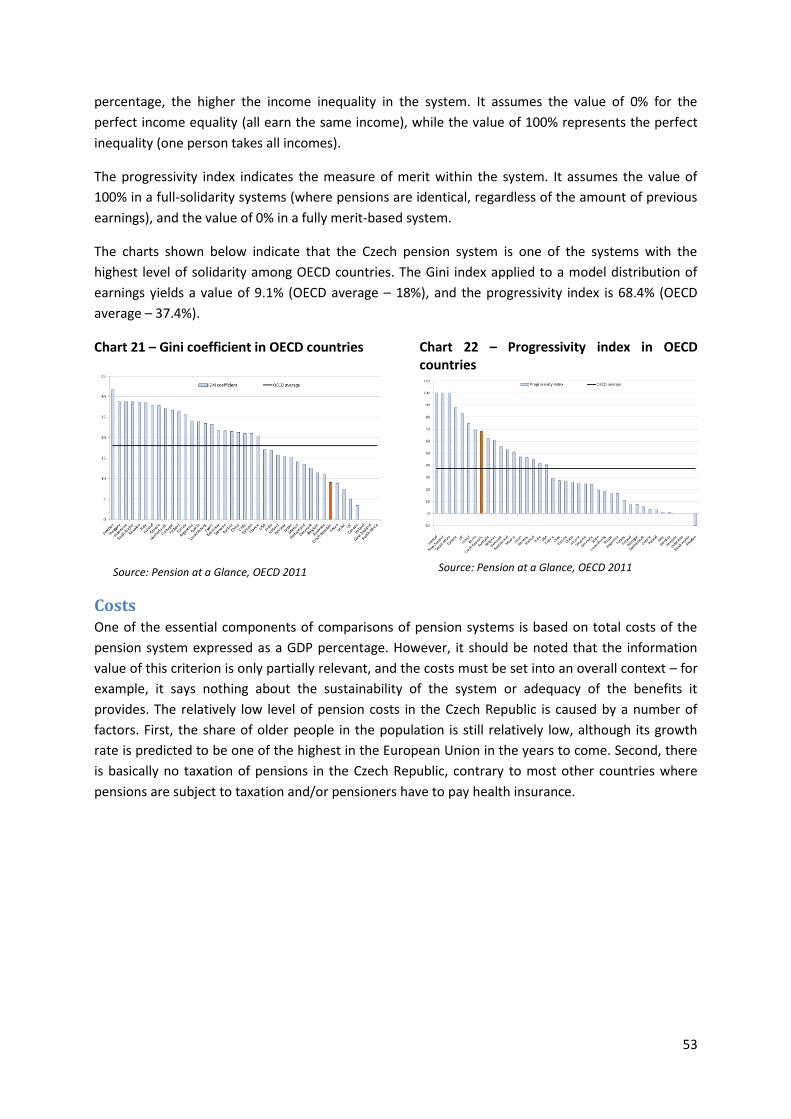
53
percentage, the higher the income inequality in the system. It assumes the value of 0% for the
perfect income equality (all earn the same income), while the value of 100% represents the perfect
inequality (one person takes all incomes).
The progressivity index indicates the measure of merit within the system. It assumes the value of
100% in a full-solidarity systems (where pensions are identical, regardless of the amount of previous
earnings), and the value of 0% in a fully merit-based system.
The charts shown below indicate that the Czech pension system is one of the systems with the
highest level of solidarity among OECD countries. The Gini index applied to a model distribution of
earnings yields a value of 9.1% (OECD average – 18%), and the progressivity index is 68.4% (OECD
average – 37.4%).
Chart 21 – Gini coefficient in OECD countries
Source: Pension at a Glance, OECD 2011
Chart 22 – Progressivity index in OECD countries
Source: Pension at a Glance, OECD 2011
Costs One of the essential components of comparisons of pension systems is based on total costs of the
pension system expressed as a GDP percentage. However, it should be noted that the information
value of this criterion is only partially relevant, and the costs must be set into an overall context – for
example, it says nothing about the sustainability of the system or adequacy of the benefits it
provides. The relatively low level of pension costs in the Czech Republic is caused by a number of
factors. First, the share of older people in the population is still relatively low, although its growth
rate is predicted to be one of the highest in the European Union in the years to come. Second, there
is basically no taxation of pensions in the Czech Republic, contrary to most other countries where
pensions are subject to taxation and/or pensioners have to pay health insurance.
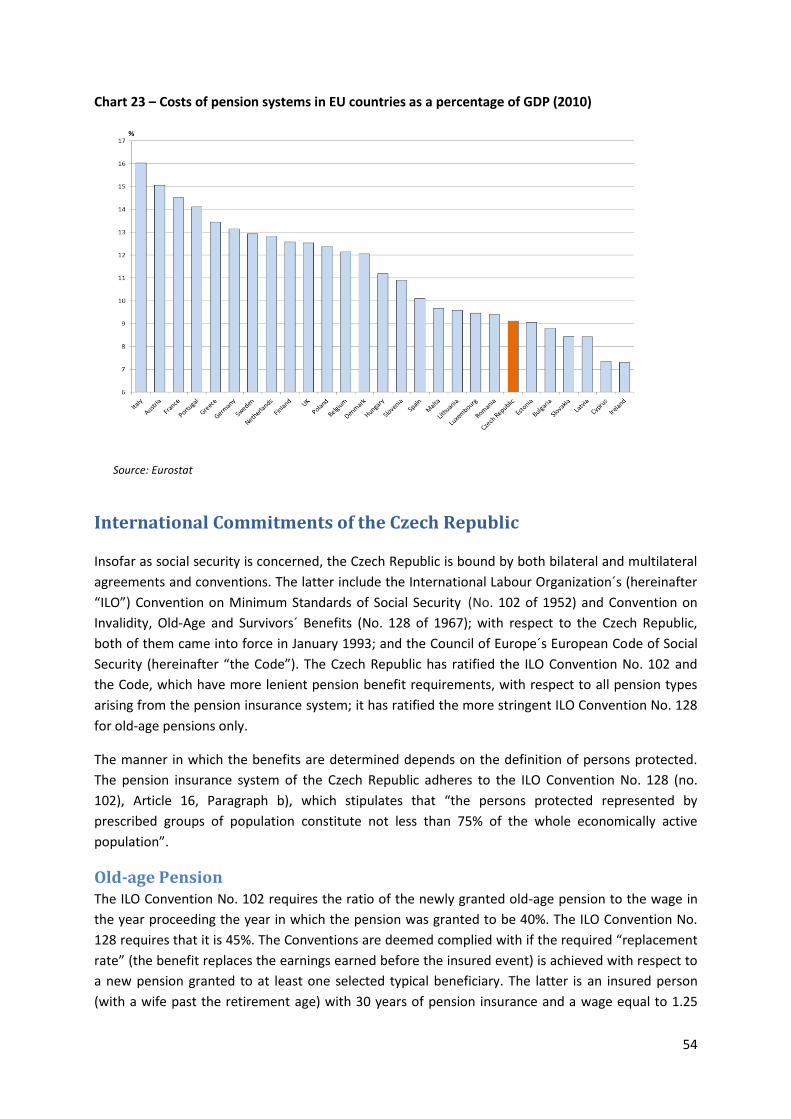
54
Chart 23 – Costs of pension systems in EU countries as a percentage of GDP (2010)
Source: Eurostat
International Commitments of the Czech Republic
Insofar as social security is concerned, the Czech Republic is bound by both bilateral and multilateral
agreements and conventions. The latter include the International Labour Organization´s (hereinafter
“ILO”) Convention on Minimum Standards of Social Security (No. 102 of 1952) and Convention on
Invalidity, Old-Age and Survivors´ Benefits (No. 128 of 1967); with respect to the Czech Republic,
both of them came into force in January 1993; and the Council of Europe´s European Code of Social
Security (hereinafter “the Code”). The Czech Republic has ratified the ILO Convention No. 102 and
the Code, which have more lenient pension benefit requirements, with respect to all pension types
arising from the pension insurance system; it has ratified the more stringent ILO Convention No. 128
for old-age pensions only.
The manner in which the benefits are determined depends on the definition of persons protected.
The pension insurance system of the Czech Republic adheres to the ILO Convention No. 128 (no.
102), Article 16, Paragraph b), which stipulates that “the persons protected represented by
prescribed groups of population constitute not less than 75% of the whole economically active
population”.
Old-age Pension The ILO Convention No. 102 requires the ratio of the newly granted old-age pension to the wage in
the year proceeding the year in which the pension was granted to be 40%. The ILO Convention No.
128 requires that it is 45%. The Conventions are deemed complied with if the required “replacement
rate” (the benefit replaces the earnings earned before the insured event) is achieved with respect to
a new pension granted to at least one selected typical beneficiary. The latter is an insured person
(with a wife past the retirement age) with 30 years of pension insurance and a wage equal to 1.25
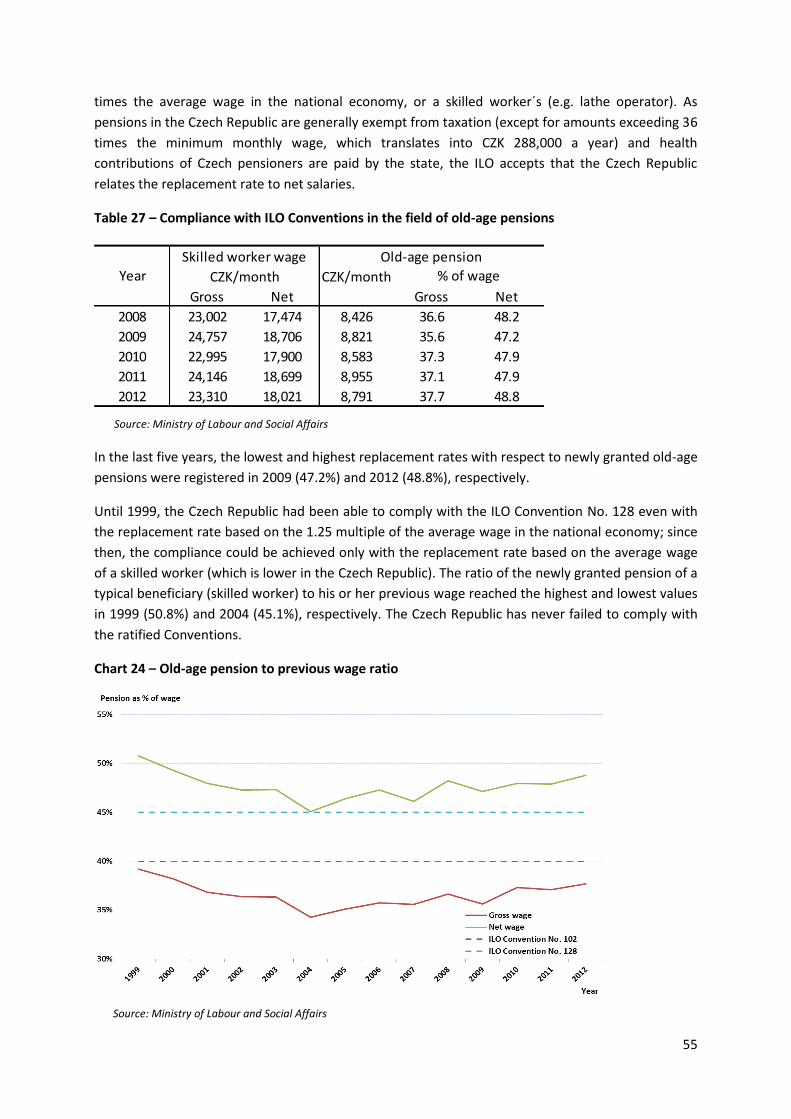
55
times the average wage in the national economy, or a skilled worker´s (e.g. lathe operator). As
pensions in the Czech Republic are generally exempt from taxation (except for amounts exceeding 36
times the minimum monthly wage, which translates into CZK 288,000 a year) and health
contributions of Czech pensioners are paid by the state, the ILO accepts that the Czech Republic
relates the replacement rate to net salaries.
Table 27 – Compliance with ILO Conventions in the field of old-age pensions
Source: Ministry of Labour and Social Affairs
In the last five years, the lowest and highest replacement rates with respect to newly granted old-age
pensions were registered in 2009 (47.2%) and 2012 (48.8%), respectively.
Until 1999, the Czech Republic had been able to comply with the ILO Convention No. 128 even with
the replacement rate based on the 1.25 multiple of the average wage in the national economy; since
then, the compliance could be achieved only with the replacement rate based on the average wage
of a skilled worker (which is lower in the Czech Republic). The ratio of the newly granted pension of a
typical beneficiary (skilled worker) to his or her previous wage reached the highest and lowest values
in 1999 (50.8%) and 2004 (45.1%), respectively. The Czech Republic has never failed to comply with
the ratified Conventions.
Chart 24 – Old-age pension to previous wage ratio
Source: Ministry of Labour and Social Affairs
CZK/month
Gross Net Gross Net
2008 23,002 17,474 8,426 36.6 48.2
2009 24,757 18,706 8,821 35.6 47.2
2010 22,995 17,900 8,583 37.3 47.9
2011 24,146 18,699 8,955 37.1 47.9
2012 23,310 18,021 8,791 37.7 48.8
Old-age pension
% of wage
Skilled worker wage
CZK/monthYear
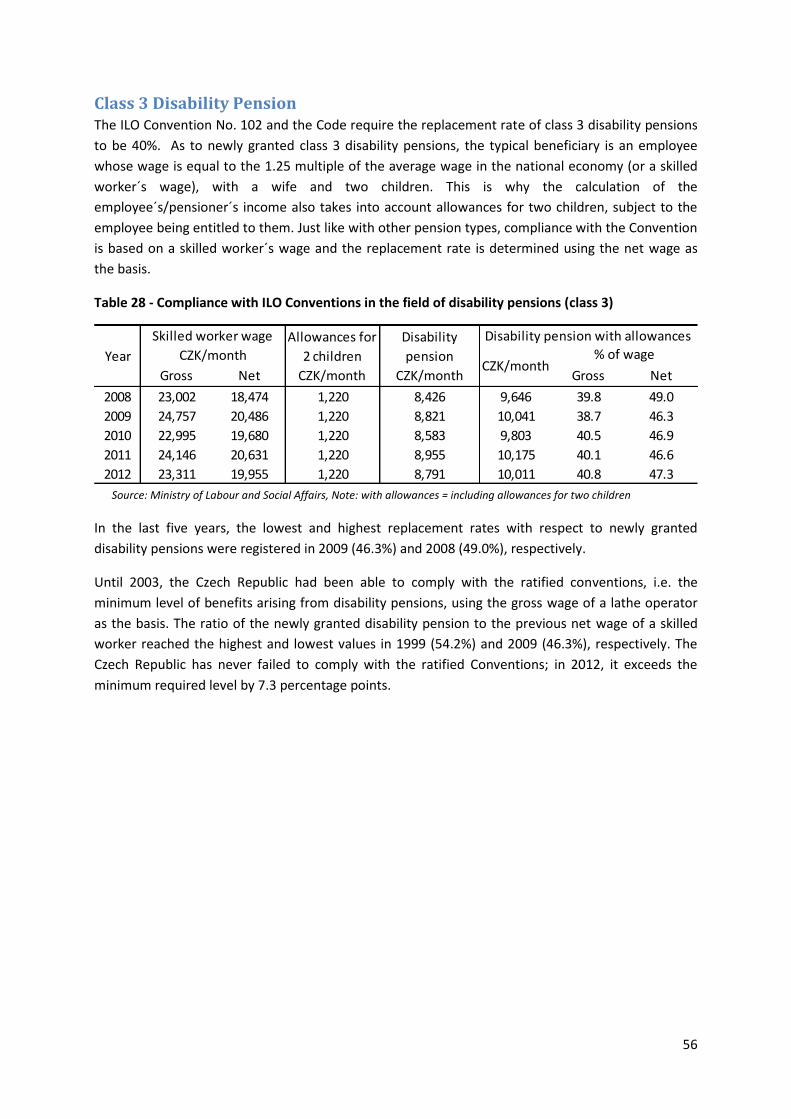
56
Class 3 Disability Pension The ILO Convention No. 102 and the Code require the replacement rate of class 3 disability pensions
to be 40%. As to newly granted class 3 disability pensions, the typical beneficiary is an employee
whose wage is equal to the 1.25 multiple of the average wage in the national economy (or a skilled
worker´s wage), with a wife and two children. This is why the calculation of the
employee´s/pensioner´s income also takes into account allowances for two children, subject to the
employee being entitled to them. Just like with other pension types, compliance with the Convention
is based on a skilled worker´s wage and the replacement rate is determined using the net wage as
the basis.
Table 28 - Compliance with ILO Conventions in the field of disability pensions (class 3)
Source: Ministry of Labour and Social Affairs, Note: with allowances = including allowances for two children
In the last five years, the lowest and highest replacement rates with respect to newly granted
disability pensions were registered in 2009 (46.3%) and 2008 (49.0%), respectively.
Until 2003, the Czech Republic had been able to comply with the ratified conventions, i.e. the
minimum level of benefits arising from disability pensions, using the gross wage of a lathe operator
as the basis. The ratio of the newly granted disability pension to the previous net wage of a skilled
worker reached the highest and lowest values in 1999 (54.2%) and 2009 (46.3%), respectively. The
Czech Republic has never failed to comply with the ratified Conventions; in 2012, it exceeds the
minimum required level by 7.3 percentage points.
Gross Net Gross Net
2008 23,002 18,474 1,220 8,426 9,646 39.8 49.0
2009 24,757 20,486 1,220 8,821 10,041 38.7 46.3
2010 22,995 19,680 1,220 8,583 9,803 40.5 46.9
2011 24,146 20,631 1,220 8,955 10,175 40.1 46.6
2012 23,311 19,955 1,220 8,791 10,011 40.8 47.3
Year
Skilled worker wage
CZK/month
Disability pension with allowances
% of wageAllowances for
2 children
CZK/month
Disability
pension
CZK/monthCZK/month
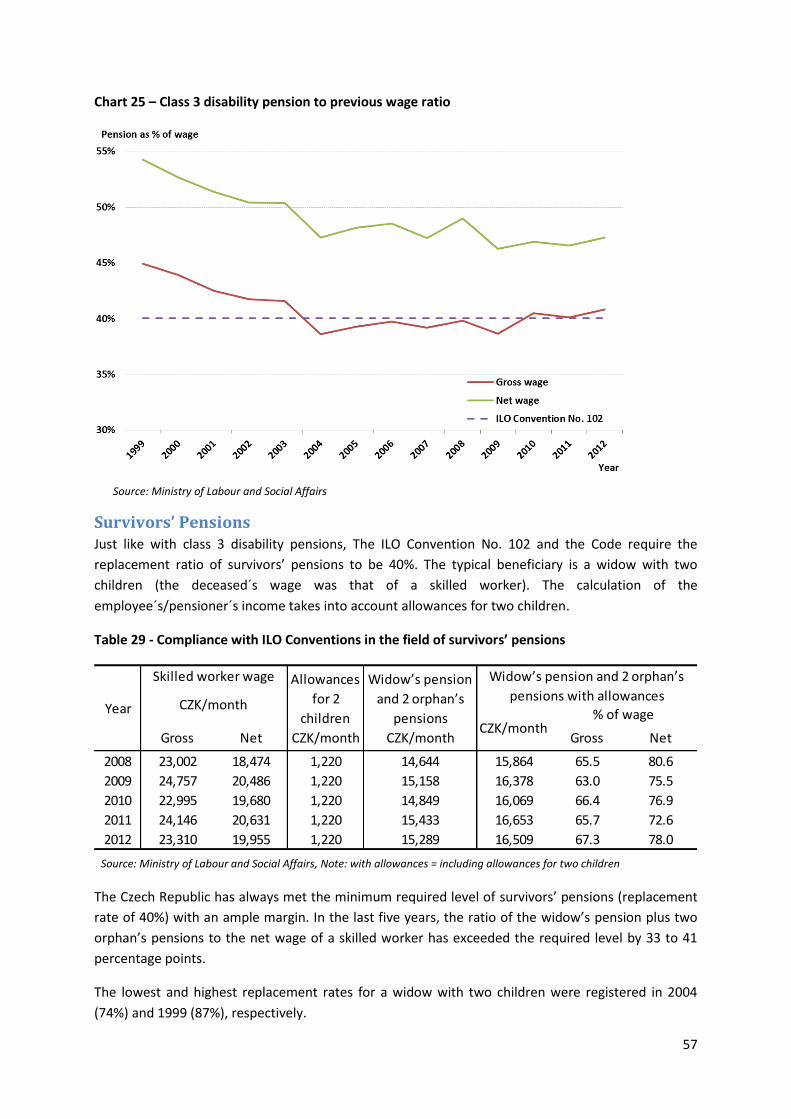
57
Chart 25 – Class 3 disability pension to previous wage ratio
Source: Ministry of Labour and Social Affairs
Survivors’ Pensions Just like with class 3 disability pensions, The ILO Convention No. 102 and the Code require the
replacement ratio of survivors’ pensions to be 40%. The typical beneficiary is a widow with two
children (the deceased´s wage was that of a skilled worker). The calculation of the
employee´s/pensioner´s income takes into account allowances for two children.
Table 29 - Compliance with ILO Conventions in the field of survivors’ pensions
Source: Ministry of Labour and Social Affairs, Note: with allowances = including allowances for two children
The Czech Republic has always met the minimum required level of survivors’ pensions (replacement
rate of 40%) with an ample margin. In the last five years, the ratio of the widow’s pension plus two
orphan’s pensions to the net wage of a skilled worker has exceeded the required level by 33 to 41
percentage points.
The lowest and highest replacement rates for a widow with two children were registered in 2004
(74%) and 1999 (87%), respectively.
Gross Net Gross Net
2008 23,002 18,474 1,220 14,644 15,864 65.5 80.6
2009 24,757 20,486 1,220 15,158 16,378 63.0 75.5
2010 22,995 19,680 1,220 14,849 16,069 66.4 76.9
2011 24,146 20,631 1,220 15,433 16,653 65.7 72.6
2012 23,310 19,955 1,220 15,289 16,509 67.3 78.0
Year
Skilled worker wage
CZK/month
Allowances
for 2
children
CZK/month
Widow’s pension
and 2 orphan’s
pensions
CZK/month
Widow’s pension and 2 orphan’s
pensions with allowances
% of wageCZK/month
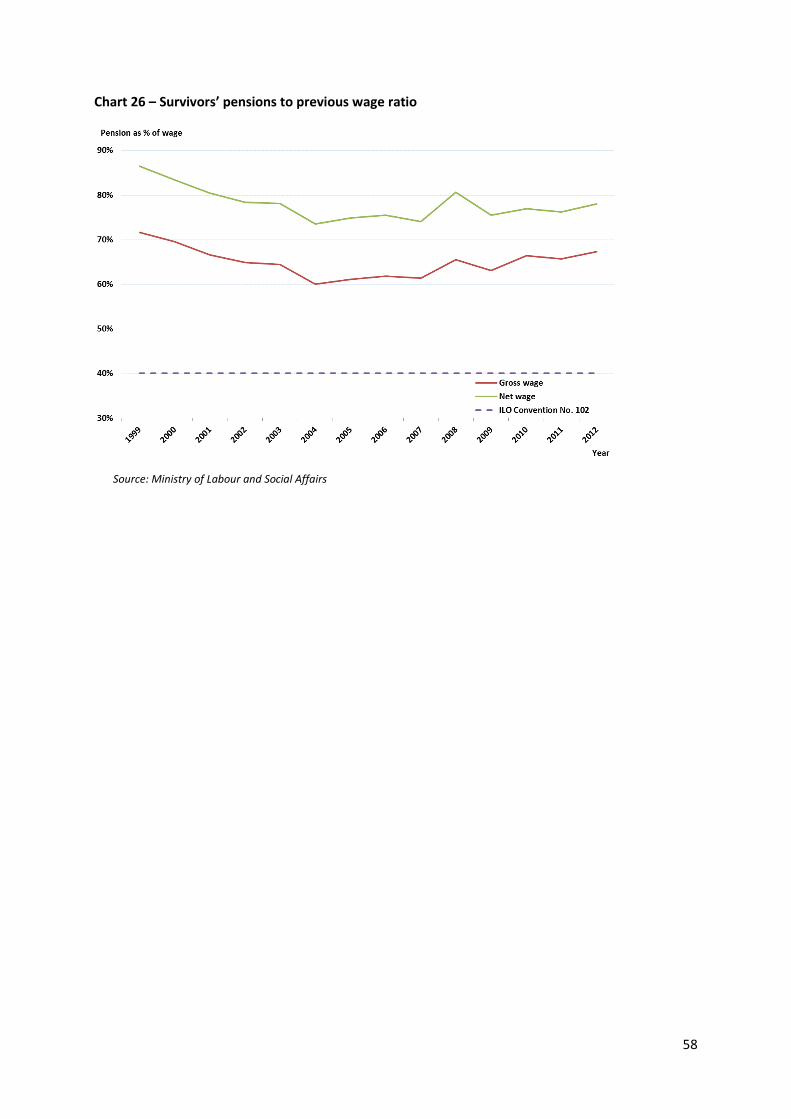
58
Chart 26 – Survivors’ pensions to previous wage ratio
Source: Ministry of Labour and Social Affairs
59
Analysis of the Development of the Pension System
Dynamic Micro-Simulation Model Until 2011, the Ministry of Labour and Social Affairs had only limited tools to model future
developments of social security systems. These tools involved a number of limitations rendering a
comprehensive analysis of the social security system impossible, particularly with respect to changes
made in different areas and segments of the system. The biggest shortfall was a low level of
consistency between macro- and micro-economic analyses, which were conducted separately and
involved many simplifying assumptions. These assumptions, together with the structure of the
models, did not permit to examine impacts of non-linearities found in formulas used to calculate
benefits in various social security systems or effects on benefits the granting and amount of which
requires the knowledge of additional information associated with social links of the applicant (e.g.
the earnings of the applicant´s spouse/partner, number and age of children etc.).
When the European Commission, namely the Directorate-General for Employment, Social Affairs and
Equal Opportunities, invited member countries to submit proposals for funding of projects focused
on developing databases and modelling tools in the field of pension policies (under File No.
VP/2009/006) in 2009, the Ministry of Labour and Social Affairs therefore proposed a dynamic micro-
simulation model project.
The main advantage of the dynamic micro-simulation model consists in its ability to model large
quantities (thousands to millions) of individuals or homogeneous groups of population with a defined
set of properties, thus providing a more detailed view of the future development of the pension
system. Initial information is based on individual personal data. The model then creates a complete
life history of each individual within the group. The output produced by the model is a detailed view
of the lifetime career of each modelled individual or group of individuals.
The model is implemented in the Prophet SW system developed by Sungard.
Calculations within the model operate with a so-called model point, which represents an individual
member of the population. As some financial flows depend not only on the life of the individual, but
also on his family, family members are also included in calculations performed for the model point
representing the individual. Each model point thus comprises a “main character” and several
additional players. Although financial flows can be calculated for some of the additional players as
well, the overall and individual results contain only the financial flows related to the main character,
as there exists a model point for every additional player, in which he or she is the main character.
Full calculations are always carried out for the main person. As to the additional players, they can be
modelled either fully, or in a simplified way. The model is set so that the main person´s partner
(spouse or a potential spouse, if the main person is single) is also modelled in full. Children are
modelled using the simplified procedure, as their full career history does not influence financial flows
pertaining to the main person. The number of persons that can be fully modelled within one model
point is a parameter that can be changed.

60
State transitions are random-modelled (random number generation – stochastic). At a given
moment, each model point has one and only one state. The transition between defined states occurs
in dependence on the value of the random number and its comparison with the probability of
transition.
One model point has one and only one random life career. As a result, the exact insurance period as
of the retirement date and other variables appearing in the pension formula are known. It is possible
to accurately model non-linearities of the pension formula in the case of extreme life careers.
To achieve stable overall results, a sufficient number of model points or simulations has to be used
(in the latter case, the result is an average across the simulations). The need of a higher number of
model points or simulations requires more computer time. On the other hand, the longer computer
time is compensated by simpler calculations, as it is not necessary to calculate all careers at a time
and then compute their average.
Due to the random element, the results do not exactly match external inputs (population projections,
macroeconomic projections etc.); however, if enough model points or simulations are used, the
match is very good.
The principal advantage of the stochastic model is a possibility to accurately model all non-linear
elements in the pension formula. The results thus also contain extreme careers and it is possible to
examine whether particular individuals are threatened by poverty. The model can comprise multiple
states and thus find a broader range of applications, for example to model other benefits
(unemployment benefits, child allowances, sickness benefits). On the other hand, the introduction of
an additional state into deterministic models is very complicated.
Some properties of the stochastic models may be unusual for the user. Some outputs, especially
those concerning transitions between states, for example number of deaths number of newly
employed people etc., are “fuzzy”. This corresponds with reality, but users are often accustomed to
“smooth” results.
A more detailed description and structure of the model are presented in an annex hereto.
Demographic Framework The age structure of the population and its development in the course of time represent an essential
factor affecting the entire pension system and necessitating its changes (reforms). The demographic
development is determined by two principal variables, fertility (i.e. how many children are born) and
mortality. The final demographic structure is also a result of migration to and from other countries,
but this factor (in the form of the net migration balance) is not very relevant for the structure of the
Czech population. The information presented below is based on published data and a demographic
forecast of the Faculty of Natural Sciences of the Charles University in Prague published in 2010.
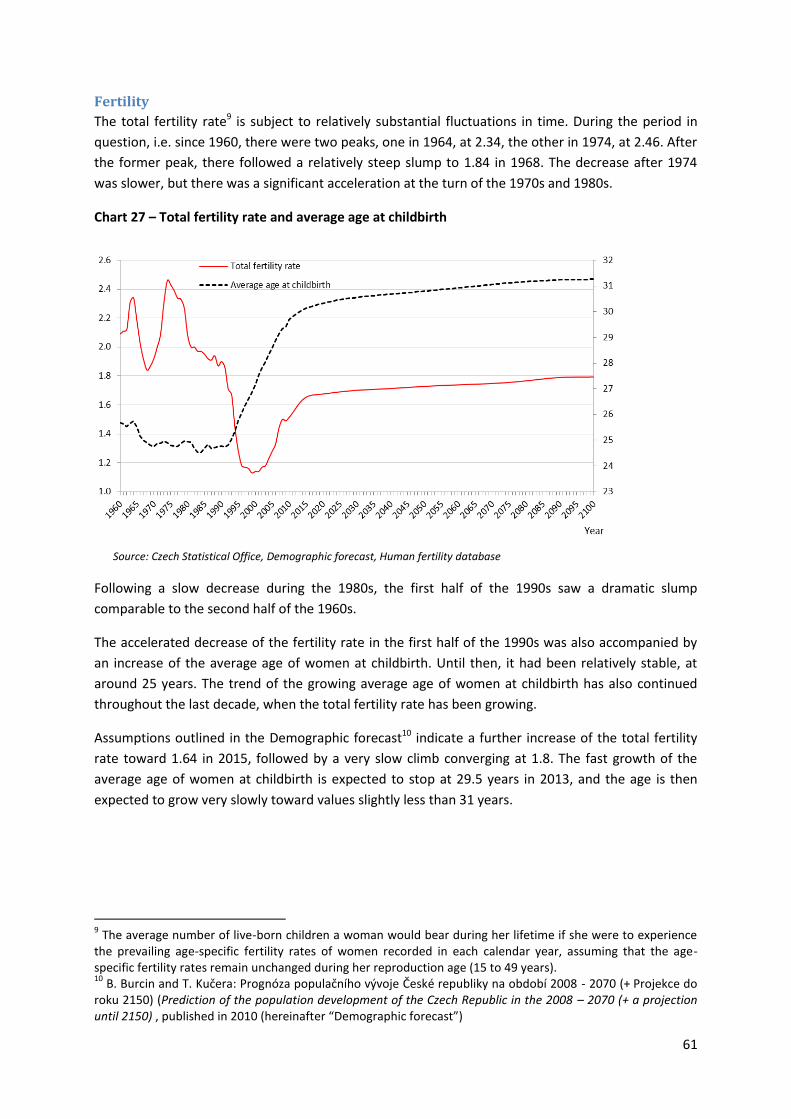
61
Fertility
The total fertility rate9 is subject to relatively substantial fluctuations in time. During the period in
question, i.e. since 1960, there were two peaks, one in 1964, at 2.34, the other in 1974, at 2.46. After
the former peak, there followed a relatively steep slump to 1.84 in 1968. The decrease after 1974
was slower, but there was a significant acceleration at the turn of the 1970s and 1980s.
Chart 27 – Total fertility rate and average age at childbirth
Source: Czech Statistical Office, Demographic forecast, Human fertility database
Following a slow decrease during the 1980s, the first half of the 1990s saw a dramatic slump
comparable to the second half of the 1960s.
The accelerated decrease of the fertility rate in the first half of the 1990s was also accompanied by
an increase of the average age of women at childbirth. Until then, it had been relatively stable, at
around 25 years. The trend of the growing average age of women at childbirth has also continued
throughout the last decade, when the total fertility rate has been growing.
Assumptions outlined in the Demographic forecast10 indicate a further increase of the total fertility
rate toward 1.64 in 2015, followed by a very slow climb converging at 1.8. The fast growth of the
average age of women at childbirth is expected to stop at 29.5 years in 2013, and the age is then
expected to grow very slowly toward values slightly less than 31 years.
9 The average number of live-born children a woman would bear during her lifetime if she were to experience
the prevailing age-specific fertility rates of women recorded in each calendar year, assuming that the age-specific fertility rates remain unchanged during her reproduction age (15 to 49 years). 10
B. Burcin and T. Kučera: Prognóza populačního vývoje České republiky na období 2008 - 2070 (+ Projekce do roku 2150) (Prediction of the population development of the Czech Republic in the 2008 – 2070 (+ a projection until 2150) , published in 2010 (hereinafter “Demographic forecast”)
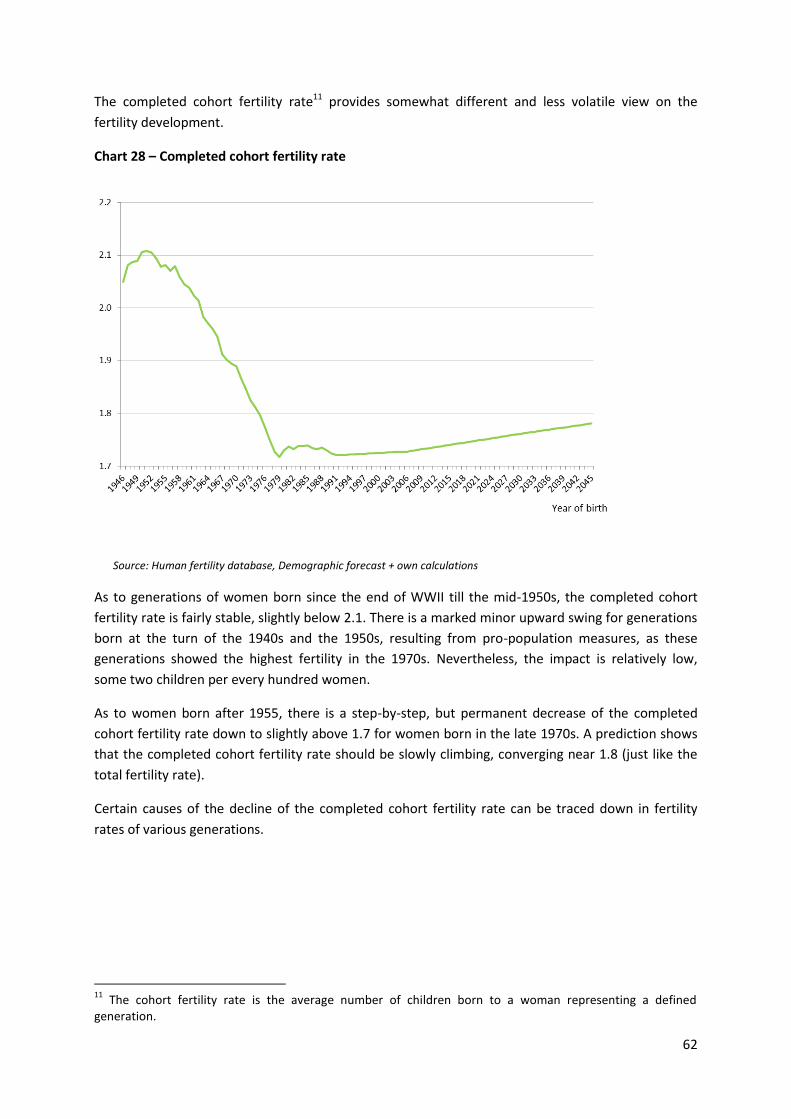
62
The completed cohort fertility rate11 provides somewhat different and less volatile view on the
fertility development.
Chart 28 – Completed cohort fertility rate
Source: Human fertility database, Demographic forecast + own calculations
As to generations of women born since the end of WWII till the mid-1950s, the completed cohort
fertility rate is fairly stable, slightly below 2.1. There is a marked minor upward swing for generations
born at the turn of the 1940s and the 1950s, resulting from pro-population measures, as these
generations showed the highest fertility in the 1970s. Nevertheless, the impact is relatively low,
some two children per every hundred women.
As to women born after 1955, there is a step-by-step, but permanent decrease of the completed
cohort fertility rate down to slightly above 1.7 for women born in the late 1970s. A prediction shows
that the completed cohort fertility rate should be slowly climbing, converging near 1.8 (just like the
total fertility rate).
Certain causes of the decline of the completed cohort fertility rate can be traced down in fertility
rates of various generations.
11
The cohort fertility rate is the average number of children born to a woman representing a defined generation.
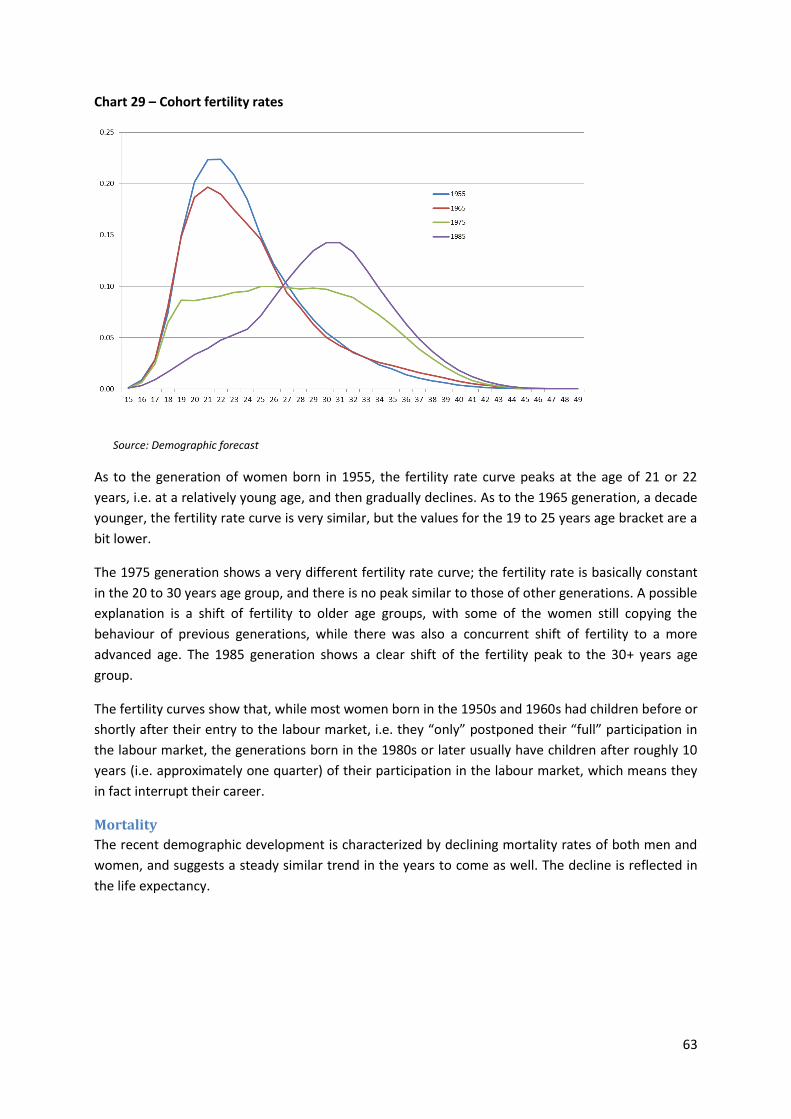
63
Chart 29 – Cohort fertility rates
Source: Demographic forecast
As to the generation of women born in 1955, the fertility rate curve peaks at the age of 21 or 22
years, i.e. at a relatively young age, and then gradually declines. As to the 1965 generation, a decade
younger, the fertility rate curve is very similar, but the values for the 19 to 25 years age bracket are a
bit lower.
The 1975 generation shows a very different fertility rate curve; the fertility rate is basically constant
in the 20 to 30 years age group, and there is no peak similar to those of other generations. A possible
explanation is a shift of fertility to older age groups, with some of the women still copying the
behaviour of previous generations, while there was also a concurrent shift of fertility to a more
advanced age. The 1985 generation shows a clear shift of the fertility peak to the 30+ years age
group.
The fertility curves show that, while most women born in the 1950s and 1960s had children before or
shortly after their entry to the labour market, i.e. they “only” postponed their “full” participation in
the labour market, the generations born in the 1980s or later usually have children after roughly 10
years (i.e. approximately one quarter) of their participation in the labour market, which means they
in fact interrupt their career.
Mortality
The recent demographic development is characterized by declining mortality rates of both men and
women, and suggests a steady similar trend in the years to come as well. The decline is reflected in
the life expectancy.
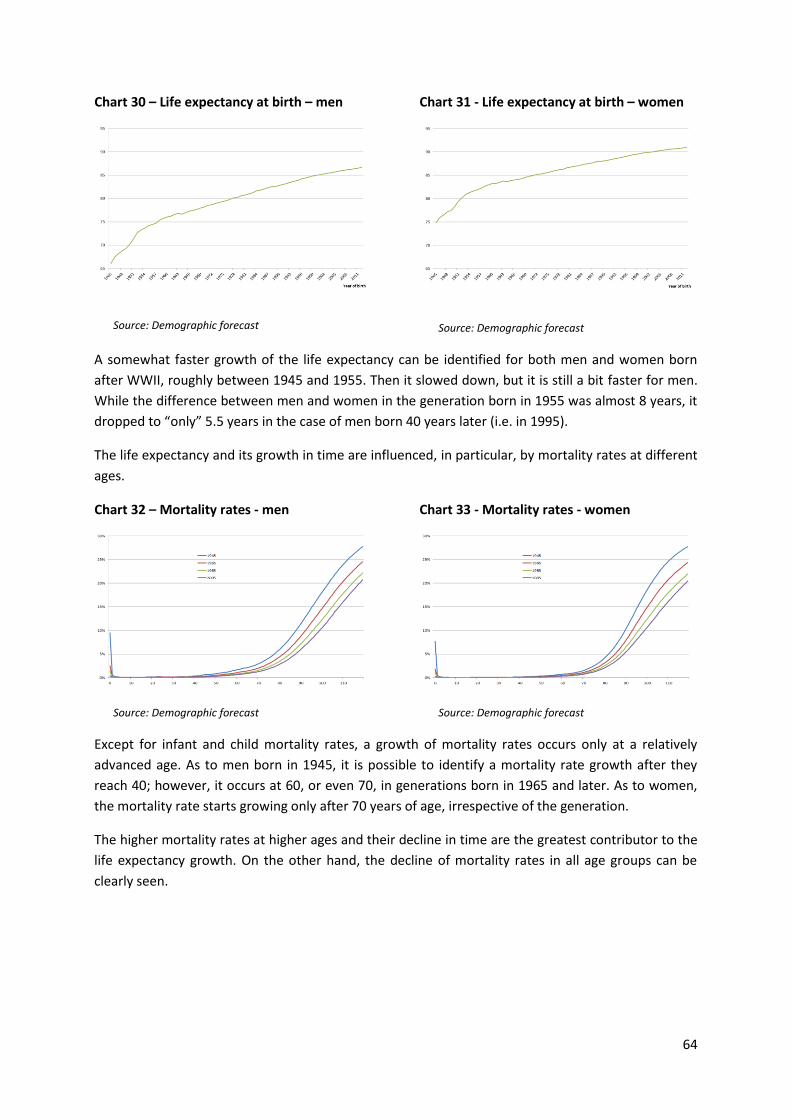
64
Chart 30 – Life expectancy at birth – men
Source: Demographic forecast
Chart 31 - Life expectancy at birth – women
Source: Demographic forecast
A somewhat faster growth of the life expectancy can be identified for both men and women born
after WWII, roughly between 1945 and 1955. Then it slowed down, but it is still a bit faster for men.
While the difference between men and women in the generation born in 1955 was almost 8 years, it
dropped to “only” 5.5 years in the case of men born 40 years later (i.e. in 1995).
The life expectancy and its growth in time are influenced, in particular, by mortality rates at different
ages.
Chart 32 – Mortality rates - men
Source: Demographic forecast
Chart 33 - Mortality rates - women
Source: Demographic forecast
Except for infant and child mortality rates, a growth of mortality rates occurs only at a relatively
advanced age. As to men born in 1945, it is possible to identify a mortality rate growth after they
reach 40; however, it occurs at 60, or even 70, in generations born in 1965 and later. As to women,
the mortality rate starts growing only after 70 years of age, irrespective of the generation.
The higher mortality rates at higher ages and their decline in time are the greatest contributor to the
life expectancy growth. On the other hand, the decline of mortality rates in all age groups can be
clearly seen.
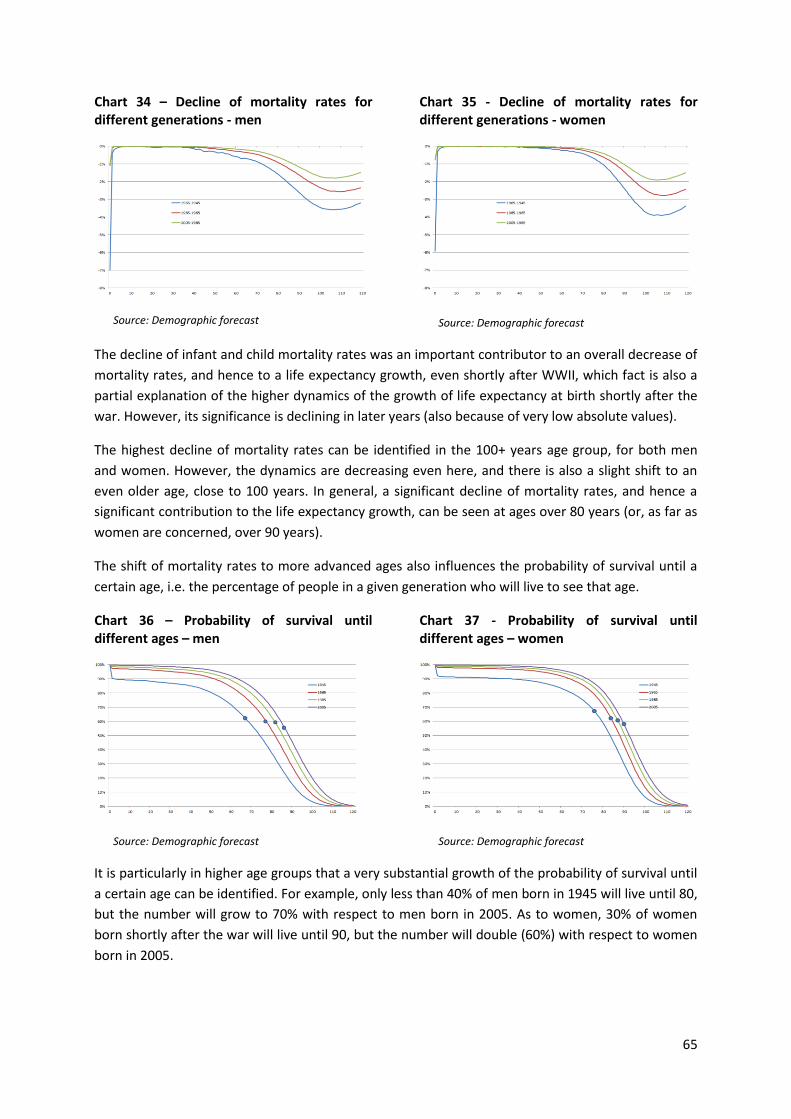
65
Chart 34 – Decline of mortality rates for different generations - men
Source: Demographic forecast
Chart 35 - Decline of mortality rates for different generations - women
Source: Demographic forecast
The decline of infant and child mortality rates was an important contributor to an overall decrease of
mortality rates, and hence to a life expectancy growth, even shortly after WWII, which fact is also a
partial explanation of the higher dynamics of the growth of life expectancy at birth shortly after the
war. However, its significance is declining in later years (also because of very low absolute values).
The highest decline of mortality rates can be identified in the 100+ years age group, for both men
and women. However, the dynamics are decreasing even here, and there is also a slight shift to an
even older age, close to 100 years. In general, a significant decline of mortality rates, and hence a
significant contribution to the life expectancy growth, can be seen at ages over 80 years (or, as far as
women are concerned, over 90 years).
The shift of mortality rates to more advanced ages also influences the probability of survival until a
certain age, i.e. the percentage of people in a given generation who will live to see that age.
Chart 36 – Probability of survival until different ages – men
Source: Demographic forecast
Chart 37 - Probability of survival until different ages – women
Source: Demographic forecast
It is particularly in higher age groups that a very substantial growth of the probability of survival until
a certain age can be identified. For example, only less than 40% of men born in 1945 will live until 80,
but the number will grow to 70% with respect to men born in 2005. As to women, 30% of women
born shortly after the war will live until 90, but the number will double (60%) with respect to women
born in 2005.
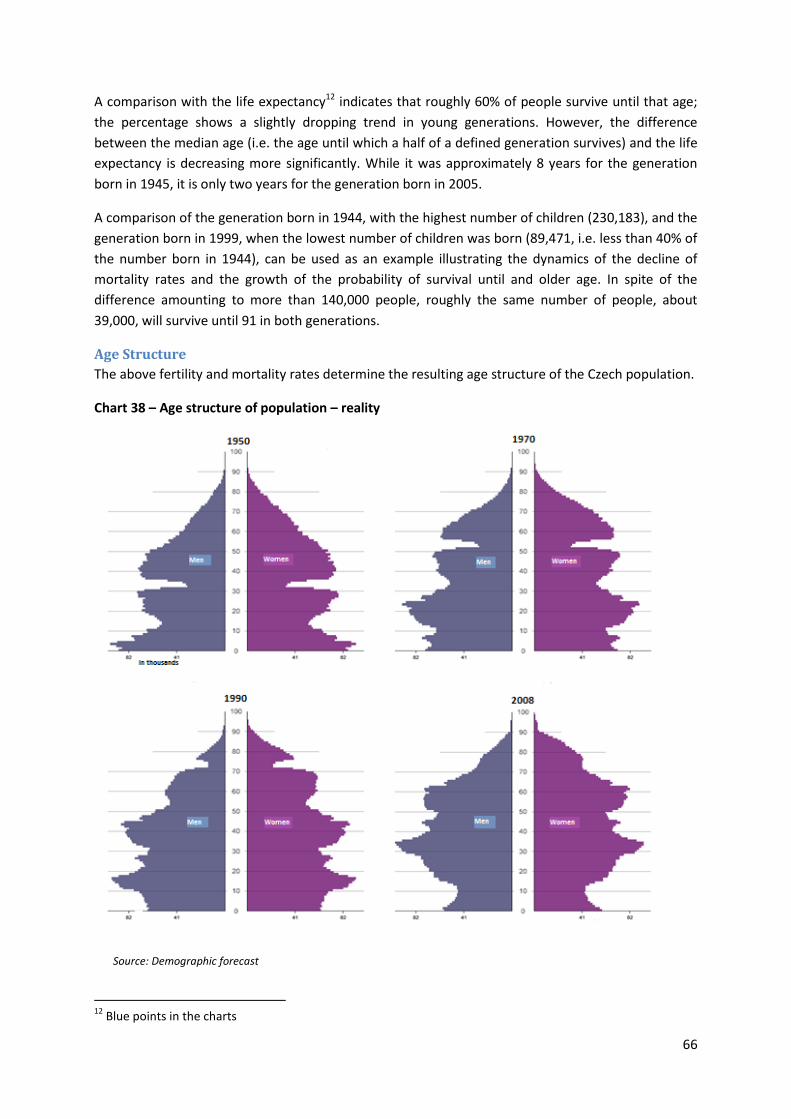
66
A comparison with the life expectancy12 indicates that roughly 60% of people survive until that age;
the percentage shows a slightly dropping trend in young generations. However, the difference
between the median age (i.e. the age until which a half of a defined generation survives) and the life
expectancy is decreasing more significantly. While it was approximately 8 years for the generation
born in 1945, it is only two years for the generation born in 2005.
A comparison of the generation born in 1944, with the highest number of children (230,183), and the
generation born in 1999, when the lowest number of children was born (89,471, i.e. less than 40% of
the number born in 1944), can be used as an example illustrating the dynamics of the decline of
mortality rates and the growth of the probability of survival until and older age. In spite of the
difference amounting to more than 140,000 people, roughly the same number of people, about
39,000, will survive until 91 in both generations.
Age Structure
The above fertility and mortality rates determine the resulting age structure of the Czech population.
Chart 38 – Age structure of population – reality
Source: Demographic forecast
12
Blue points in the charts
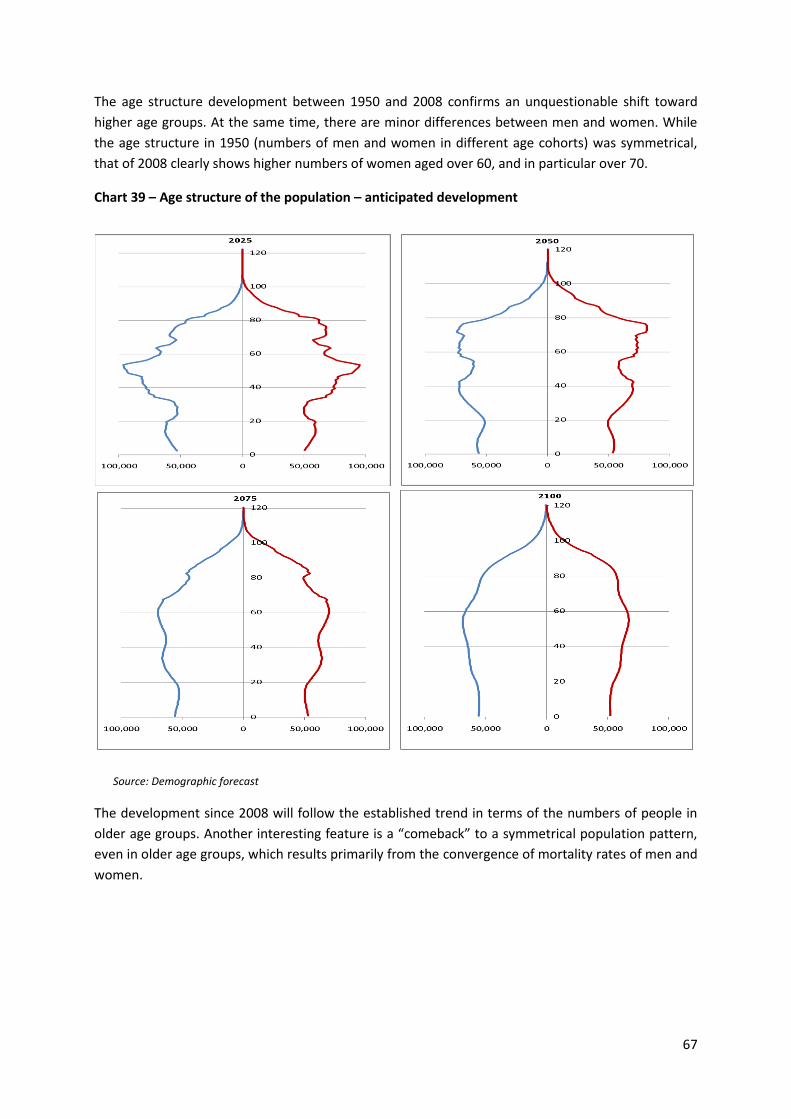
67
The age structure development between 1950 and 2008 confirms an unquestionable shift toward
higher age groups. At the same time, there are minor differences between men and women. While
the age structure in 1950 (numbers of men and women in different age cohorts) was symmetrical,
that of 2008 clearly shows higher numbers of women aged over 60, and in particular over 70.
Chart 39 – Age structure of the population – anticipated development
Source: Demographic forecast
The development since 2008 will follow the established trend in terms of the numbers of people in
older age groups. Another interesting feature is a “comeback” to a symmetrical population pattern,
even in older age groups, which results primarily from the convergence of mortality rates of men and
women.
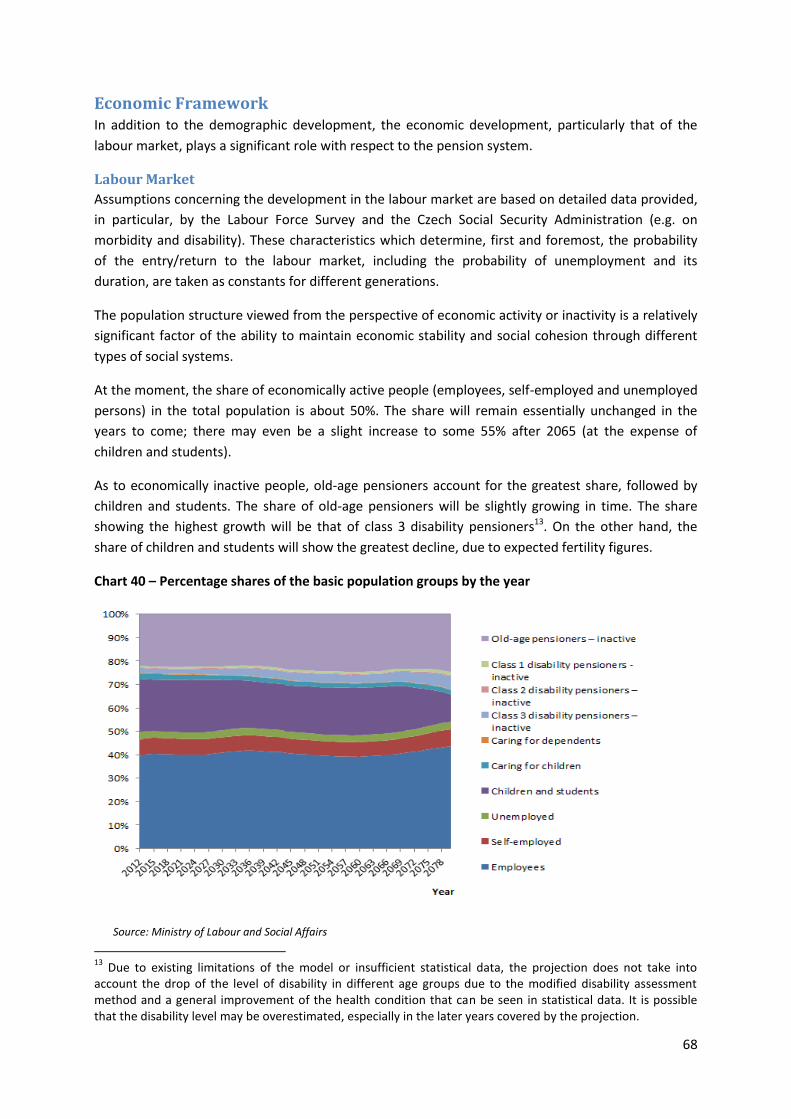
68
Economic Framework In addition to the demographic development, the economic development, particularly that of the
labour market, plays a significant role with respect to the pension system.
Labour Market
Assumptions concerning the development in the labour market are based on detailed data provided,
in particular, by the Labour Force Survey and the Czech Social Security Administration (e.g. on
morbidity and disability). These characteristics which determine, first and foremost, the probability
of the entry/return to the labour market, including the probability of unemployment and its
duration, are taken as constants for different generations.
The population structure viewed from the perspective of economic activity or inactivity is a relatively
significant factor of the ability to maintain economic stability and social cohesion through different
types of social systems.
At the moment, the share of economically active people (employees, self-employed and unemployed
persons) in the total population is about 50%. The share will remain essentially unchanged in the
years to come; there may even be a slight increase to some 55% after 2065 (at the expense of
children and students).
As to economically inactive people, old-age pensioners account for the greatest share, followed by
children and students. The share of old-age pensioners will be slightly growing in time. The share
showing the highest growth will be that of class 3 disability pensioners13. On the other hand, the
share of children and students will show the greatest decline, due to expected fertility figures.
Chart 40 – Percentage shares of the basic population groups by the year
Source: Ministry of Labour and Social Affairs
13
Due to existing limitations of the model or insufficient statistical data, the projection does not take into account the drop of the level of disability in different age groups due to the modified disability assessment method and a general improvement of the health condition that can be seen in statistical data. It is possible that the disability level may be overestimated, especially in the later years covered by the projection.
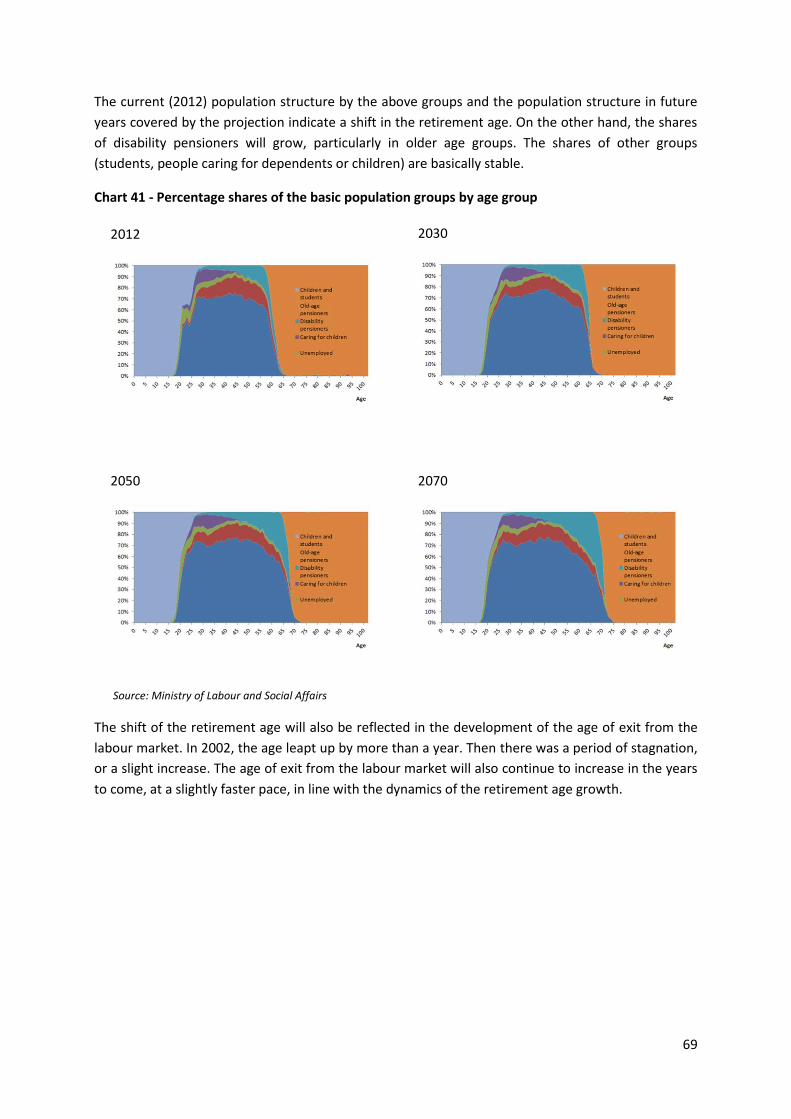
69
The current (2012) population structure by the above groups and the population structure in future
years covered by the projection indicate a shift in the retirement age. On the other hand, the shares
of disability pensioners will grow, particularly in older age groups. The shares of other groups
(students, people caring for dependents or children) are basically stable.
Chart 41 - Percentage shares of the basic population groups by age group
Source: Ministry of Labour and Social Affairs
The shift of the retirement age will also be reflected in the development of the age of exit from the
labour market. In 2002, the age leapt up by more than a year. Then there was a period of stagnation,
or a slight increase. The age of exit from the labour market will also continue to increase in the years
to come, at a slightly faster pace, in line with the dynamics of the retirement age growth.
2012
2030
2050
2070
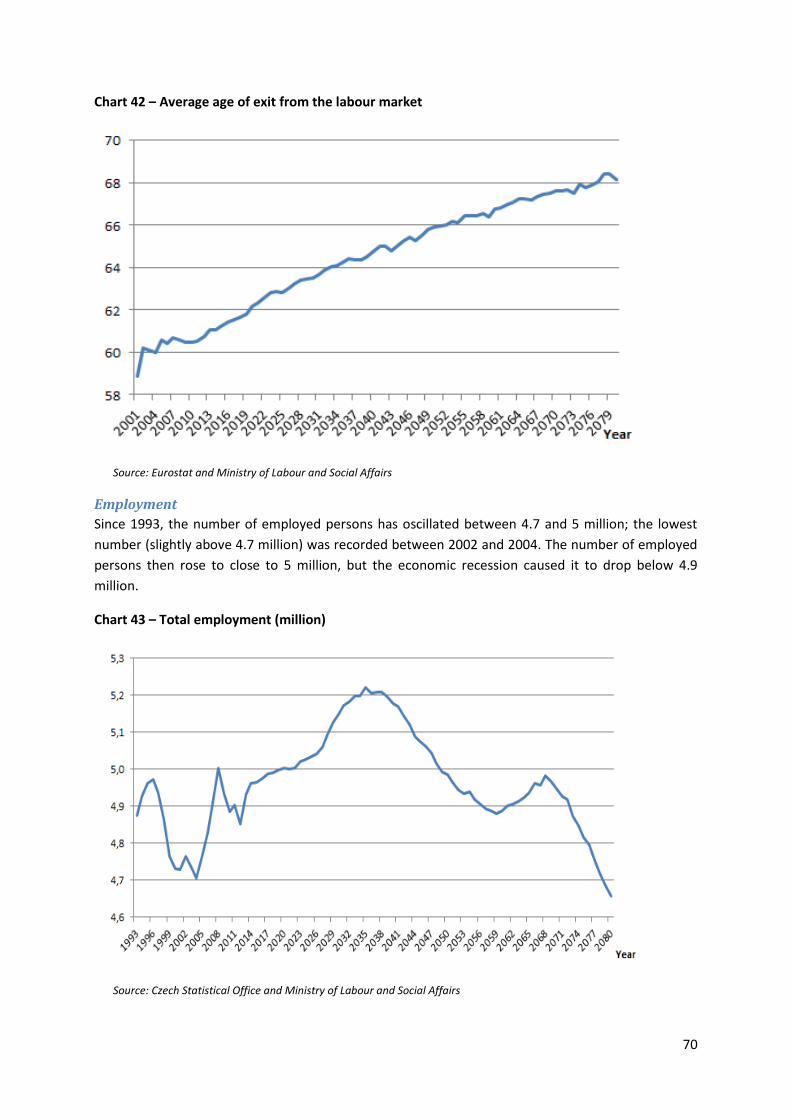
70
Chart 42 – Average age of exit from the labour market
Source: Eurostat and Ministry of Labour and Social Affairs
Employment
Since 1993, the number of employed persons has oscillated between 4.7 and 5 million; the lowest
number (slightly above 4.7 million) was recorded between 2002 and 2004. The number of employed
persons then rose to close to 5 million, but the economic recession caused it to drop below 4.9
million.
Chart 43 – Total employment (million)
Source: Czech Statistical Office and Ministry of Labour and Social Affairs
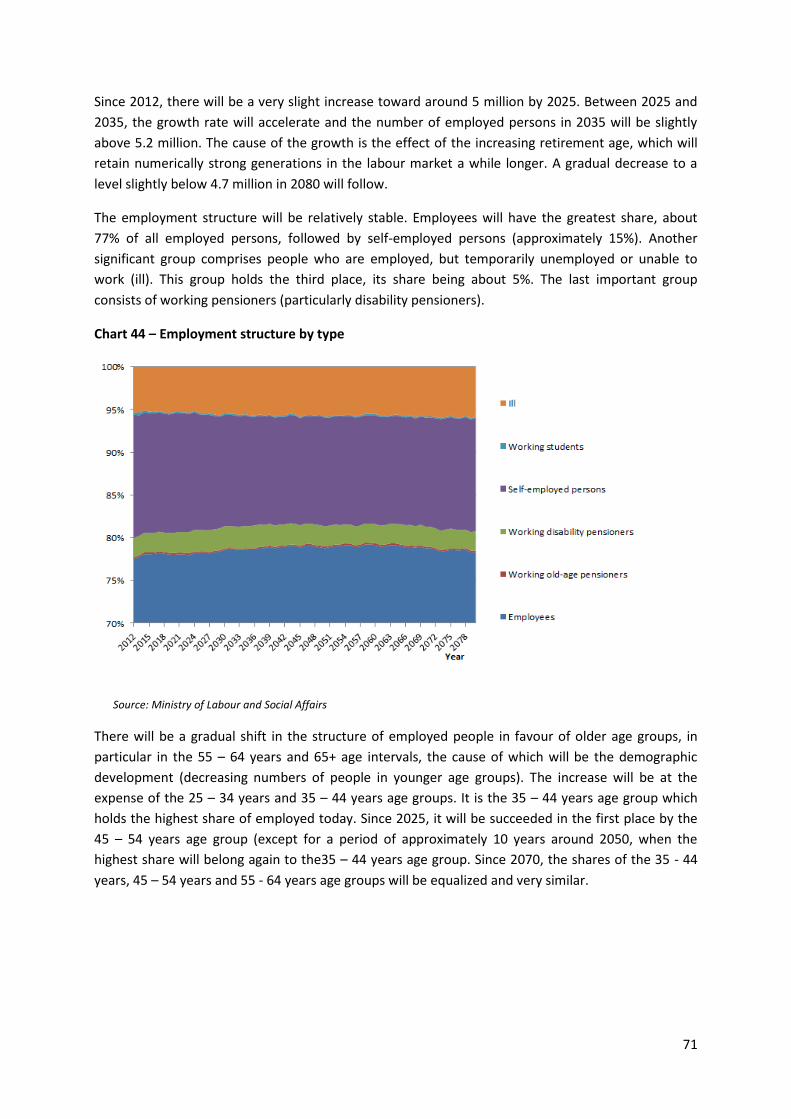
71
Since 2012, there will be a very slight increase toward around 5 million by 2025. Between 2025 and
2035, the growth rate will accelerate and the number of employed persons in 2035 will be slightly
above 5.2 million. The cause of the growth is the effect of the increasing retirement age, which will
retain numerically strong generations in the labour market a while longer. A gradual decrease to a
level slightly below 4.7 million in 2080 will follow.
The employment structure will be relatively stable. Employees will have the greatest share, about
77% of all employed persons, followed by self-employed persons (approximately 15%). Another
significant group comprises people who are employed, but temporarily unemployed or unable to
work (ill). This group holds the third place, its share being about 5%. The last important group
consists of working pensioners (particularly disability pensioners).
Chart 44 – Employment structure by type
Source: Ministry of Labour and Social Affairs
There will be a gradual shift in the structure of employed people in favour of older age groups, in
particular in the 55 – 64 years and 65+ age intervals, the cause of which will be the demographic
development (decreasing numbers of people in younger age groups). The increase will be at the
expense of the 25 – 34 years and 35 – 44 years age groups. It is the 35 – 44 years age group which
holds the highest share of employed today. Since 2025, it will be succeeded in the first place by the
45 – 54 years age group (except for a period of approximately 10 years around 2050, when the
highest share will belong again to the35 – 44 years age group. Since 2070, the shares of the 35 - 44
years, 45 – 54 years and 55 - 64 years age groups will be equalized and very similar.
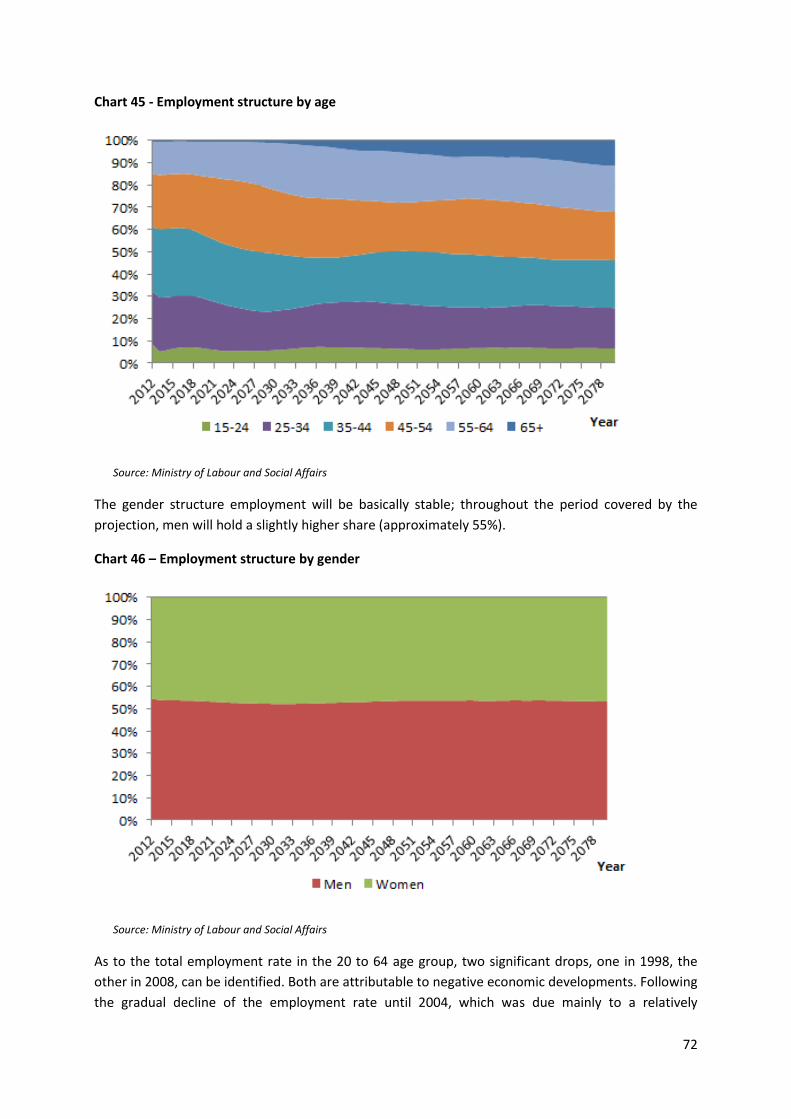
72
Chart 45 - Employment structure by age
Source: Ministry of Labour and Social Affairs
The gender structure employment will be basically stable; throughout the period covered by the
projection, men will hold a slightly higher share (approximately 55%).
Chart 46 – Employment structure by gender
Source: Ministry of Labour and Social Affairs
As to the total employment rate in the 20 to 64 age group, two significant drops, one in 1998, the
other in 2008, can be identified. Both are attributable to negative economic developments. Following
the gradual decline of the employment rate until 2004, which was due mainly to a relatively
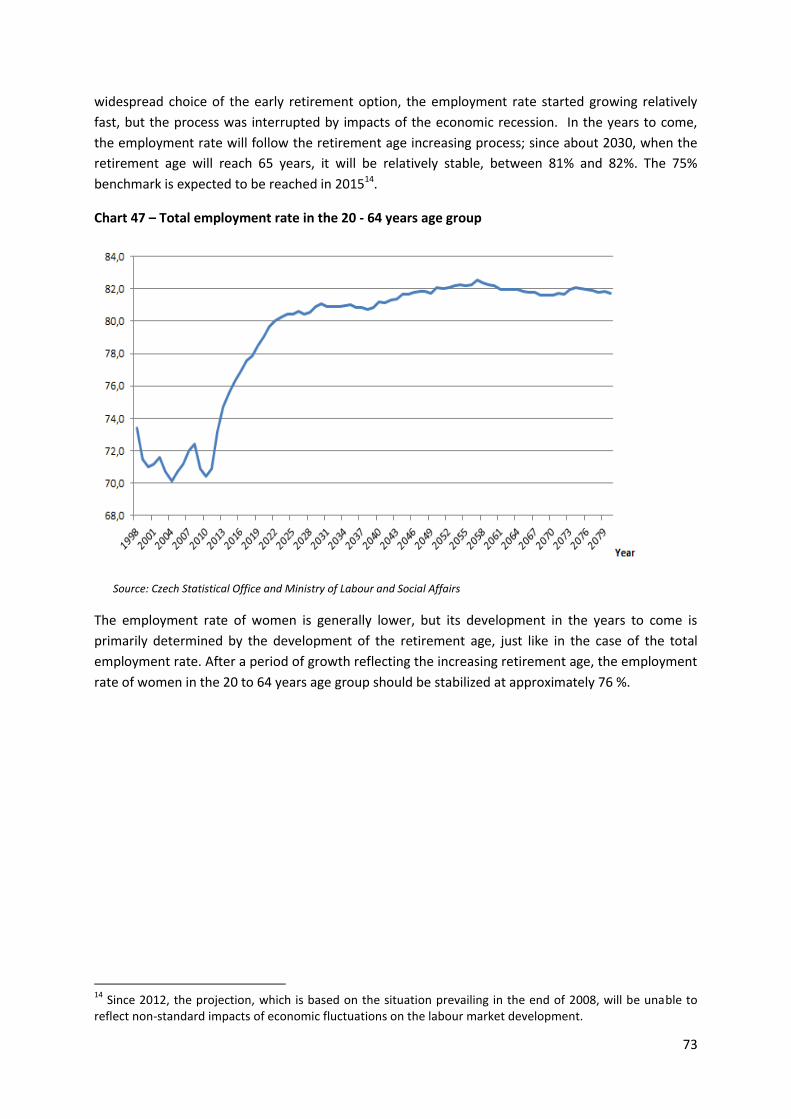
73
widespread choice of the early retirement option, the employment rate started growing relatively
fast, but the process was interrupted by impacts of the economic recession. In the years to come,
the employment rate will follow the retirement age increasing process; since about 2030, when the
retirement age will reach 65 years, it will be relatively stable, between 81% and 82%. The 75%
benchmark is expected to be reached in 201514.
Chart 47 – Total employment rate in the 20 - 64 years age group
Source: Czech Statistical Office and Ministry of Labour and Social Affairs
The employment rate of women is generally lower, but its development in the years to come is
primarily determined by the development of the retirement age, just like in the case of the total
employment rate. After a period of growth reflecting the increasing retirement age, the employment
rate of women in the 20 to 64 years age group should be stabilized at approximately 76 %.
14
Since 2012, the projection, which is based on the situation prevailing in the end of 2008, will be unable to reflect non-standard impacts of economic fluctuations on the labour market development.
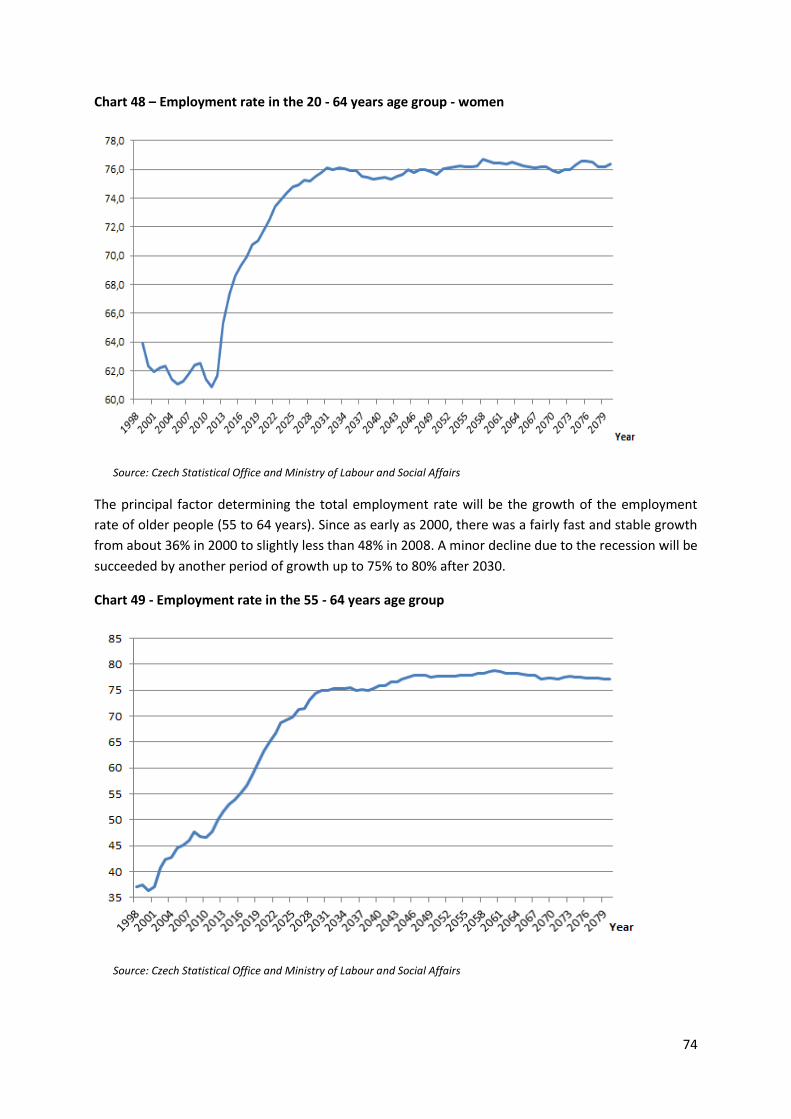
74
Chart 48 – Employment rate in the 20 - 64 years age group - women
Source: Czech Statistical Office and Ministry of Labour and Social Affairs
The principal factor determining the total employment rate will be the growth of the employment
rate of older people (55 to 64 years). Since as early as 2000, there was a fairly fast and stable growth
from about 36% in 2000 to slightly less than 48% in 2008. A minor decline due to the recession will be
succeeded by another period of growth up to 75% to 80% after 2030.
Chart 49 - Employment rate in the 55 - 64 years age group
Source: Czech Statistical Office and Ministry of Labour and Social Affairs
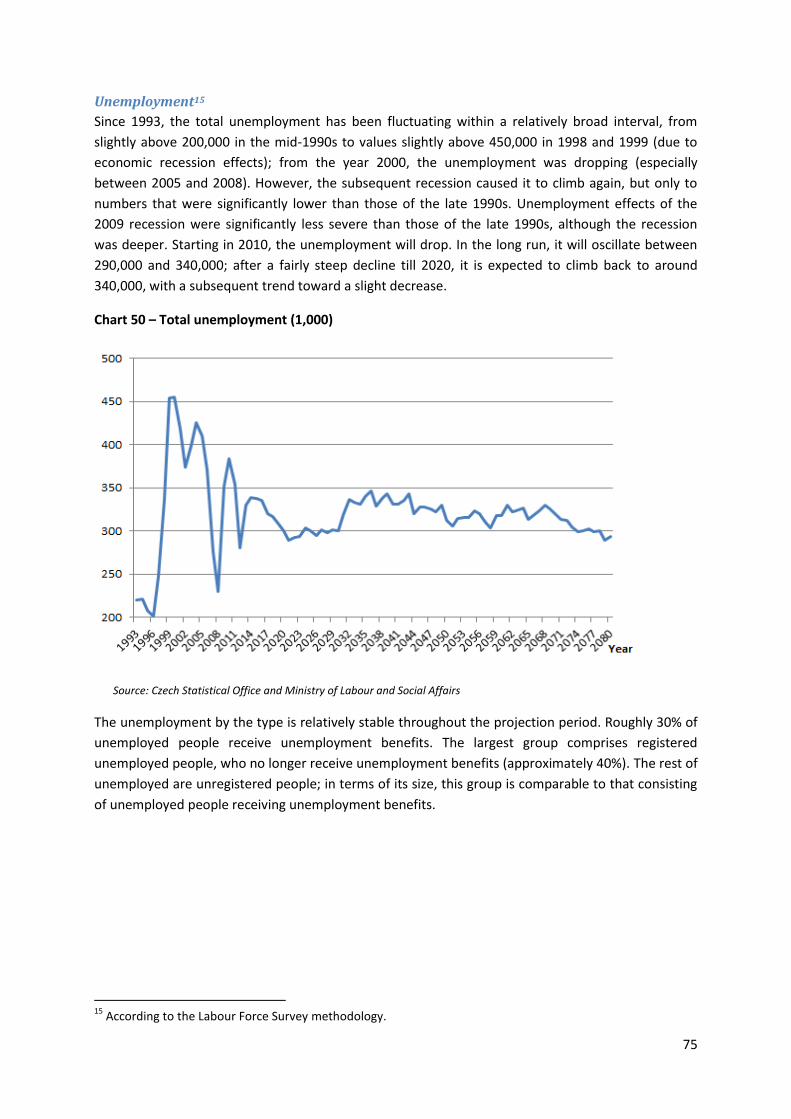
75
Unemployment15
Since 1993, the total unemployment has been fluctuating within a relatively broad interval, from
slightly above 200,000 in the mid-1990s to values slightly above 450,000 in 1998 and 1999 (due to
economic recession effects); from the year 2000, the unemployment was dropping (especially
between 2005 and 2008). However, the subsequent recession caused it to climb again, but only to
numbers that were significantly lower than those of the late 1990s. Unemployment effects of the
2009 recession were significantly less severe than those of the late 1990s, although the recession
was deeper. Starting in 2010, the unemployment will drop. In the long run, it will oscillate between
290,000 and 340,000; after a fairly steep decline till 2020, it is expected to climb back to around
340,000, with a subsequent trend toward a slight decrease.
Chart 50 – Total unemployment (1,000)
Source: Czech Statistical Office and Ministry of Labour and Social Affairs
The unemployment by the type is relatively stable throughout the projection period. Roughly 30% of
unemployed people receive unemployment benefits. The largest group comprises registered
unemployed people, who no longer receive unemployment benefits (approximately 40%). The rest of
unemployed are unregistered people; in terms of its size, this group is comparable to that consisting
of unemployed people receiving unemployment benefits.
15
According to the Labour Force Survey methodology.
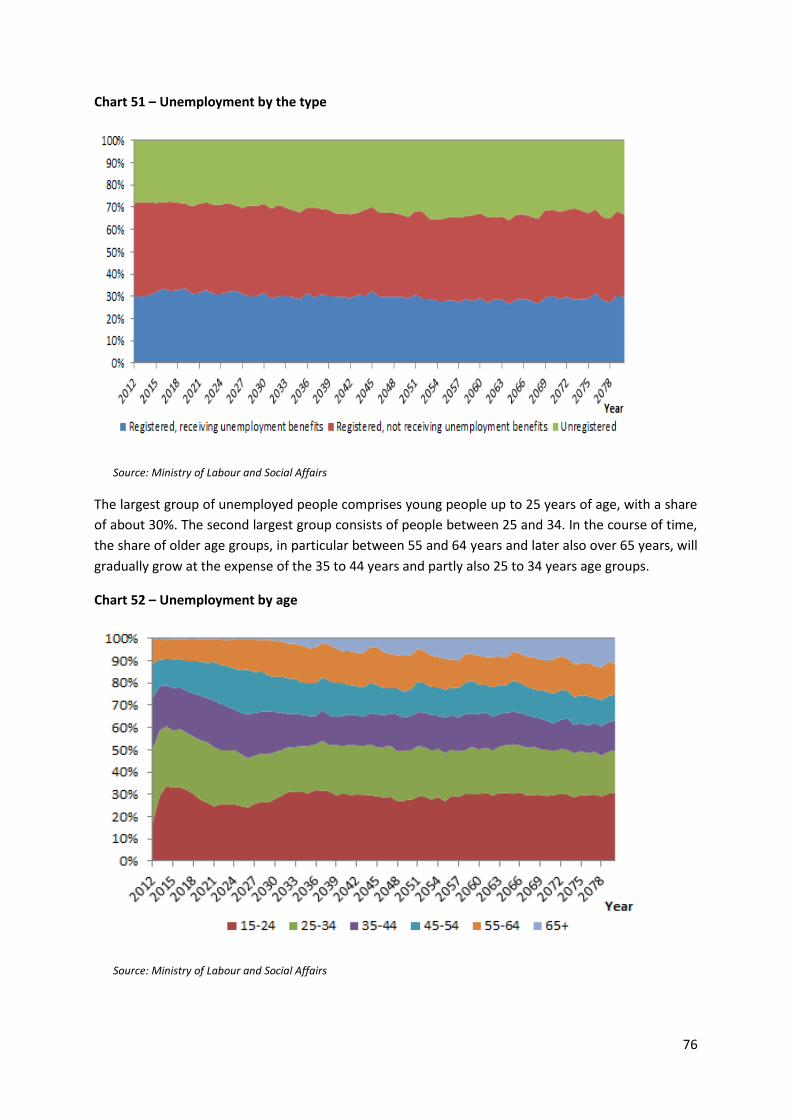
76
Chart 51 – Unemployment by the type
Source: Ministry of Labour and Social Affairs
The largest group of unemployed people comprises young people up to 25 years of age, with a share
of about 30%. The second largest group consists of people between 25 and 34. In the course of time,
the share of older age groups, in particular between 55 and 64 years and later also over 65 years, will
gradually grow at the expense of the 35 to 44 years and partly also 25 to 34 years age groups.
Chart 52 – Unemployment by age
Source: Ministry of Labour and Social Affairs
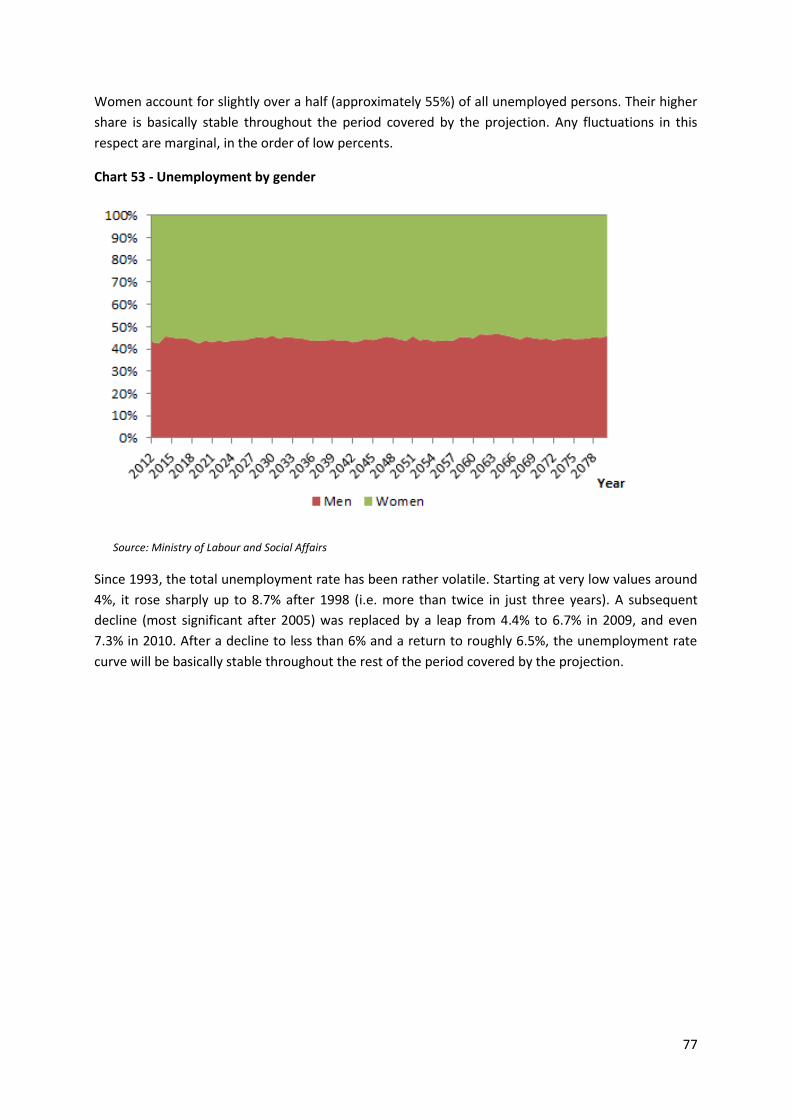
77
Women account for slightly over a half (approximately 55%) of all unemployed persons. Their higher
share is basically stable throughout the period covered by the projection. Any fluctuations in this
respect are marginal, in the order of low percents.
Chart 53 - Unemployment by gender
Source: Ministry of Labour and Social Affairs
Since 1993, the total unemployment rate has been rather volatile. Starting at very low values around
4%, it rose sharply up to 8.7% after 1998 (i.e. more than twice in just three years). A subsequent
decline (most significant after 2005) was replaced by a leap from 4.4% to 6.7% in 2009, and even
7.3% in 2010. After a decline to less than 6% and a return to roughly 6.5%, the unemployment rate
curve will be basically stable throughout the rest of the period covered by the projection.
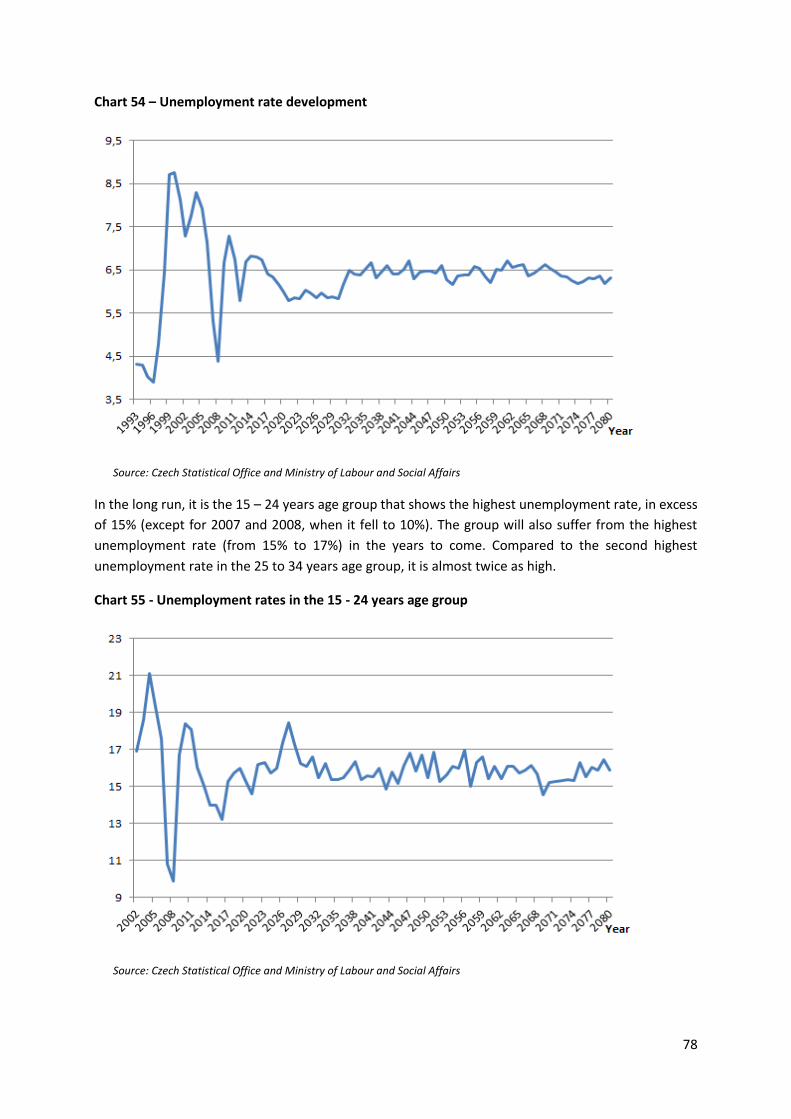
78
Chart 54 – Unemployment rate development
Source: Czech Statistical Office and Ministry of Labour and Social Affairs
In the long run, it is the 15 – 24 years age group that shows the highest unemployment rate, in excess
of 15% (except for 2007 and 2008, when it fell to 10%). The group will also suffer from the highest
unemployment rate (from 15% to 17%) in the years to come. Compared to the second highest
unemployment rate in the 25 to 34 years age group, it is almost twice as high.
Chart 55 - Unemployment rates in the 15 - 24 years age group
Source: Czech Statistical Office and Ministry of Labour and Social Affairs
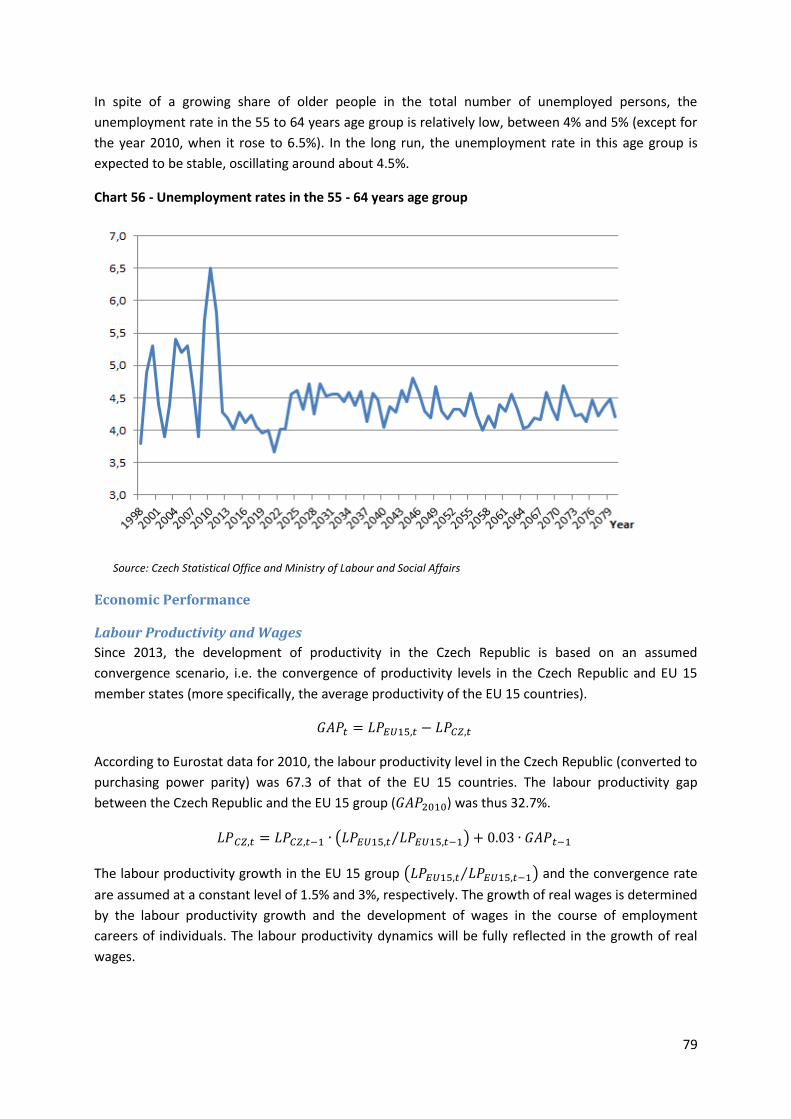
79
In spite of a growing share of older people in the total number of unemployed persons, the
unemployment rate in the 55 to 64 years age group is relatively low, between 4% and 5% (except for
the year 2010, when it rose to 6.5%). In the long run, the unemployment rate in this age group is
expected to be stable, oscillating around about 4.5%.
Chart 56 - Unemployment rates in the 55 - 64 years age group
Source: Czech Statistical Office and Ministry of Labour and Social Affairs
Economic Performance
Labour Productivity and Wages
Since 2013, the development of productivity in the Czech Republic is based on an assumed
convergence scenario, i.e. the convergence of productivity levels in the Czech Republic and EU 15
member states (more specifically, the average productivity of the EU 15 countries).
According to Eurostat data for 2010, the labour productivity level in the Czech Republic (converted to
purchasing power parity) was 67.3 of that of the EU 15 countries. The labour productivity gap
between the Czech Republic and the EU 15 group ( ) was thus 32.7%.
( ⁄ )
The labour productivity growth in the EU 15 group ( ⁄ ) and the convergence rate
are assumed at a constant level of 1.5% and 3%, respectively. The growth of real wages is determined
by the labour productivity growth and the development of wages in the course of employment
careers of individuals. The labour productivity dynamics will be fully reflected in the growth of real
wages.
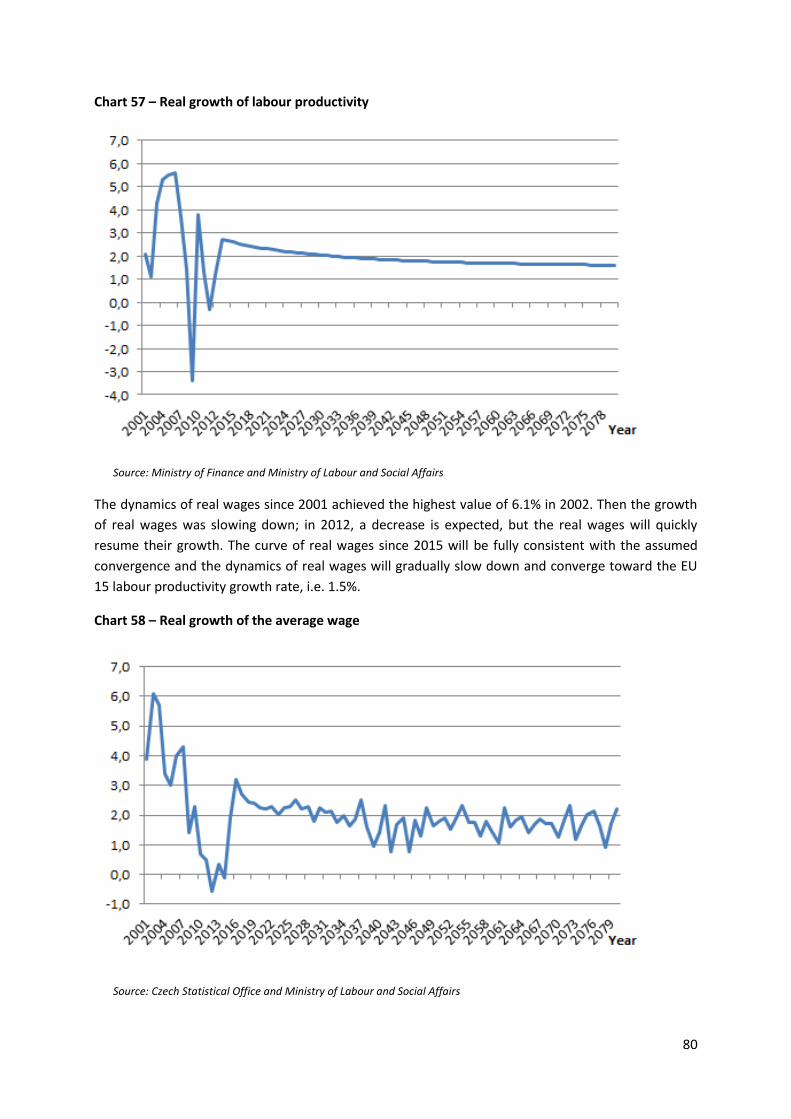
80
Chart 57 – Real growth of labour productivity
Source: Ministry of Finance and Ministry of Labour and Social Affairs
The dynamics of real wages since 2001 achieved the highest value of 6.1% in 2002. Then the growth
of real wages was slowing down; in 2012, a decrease is expected, but the real wages will quickly
resume their growth. The curve of real wages since 2015 will be fully consistent with the assumed
convergence and the dynamics of real wages will gradually slow down and converge toward the EU
15 labour productivity growth rate, i.e. 1.5%.
Chart 58 – Real growth of the average wage
Source: Czech Statistical Office and Ministry of Labour and Social Affairs
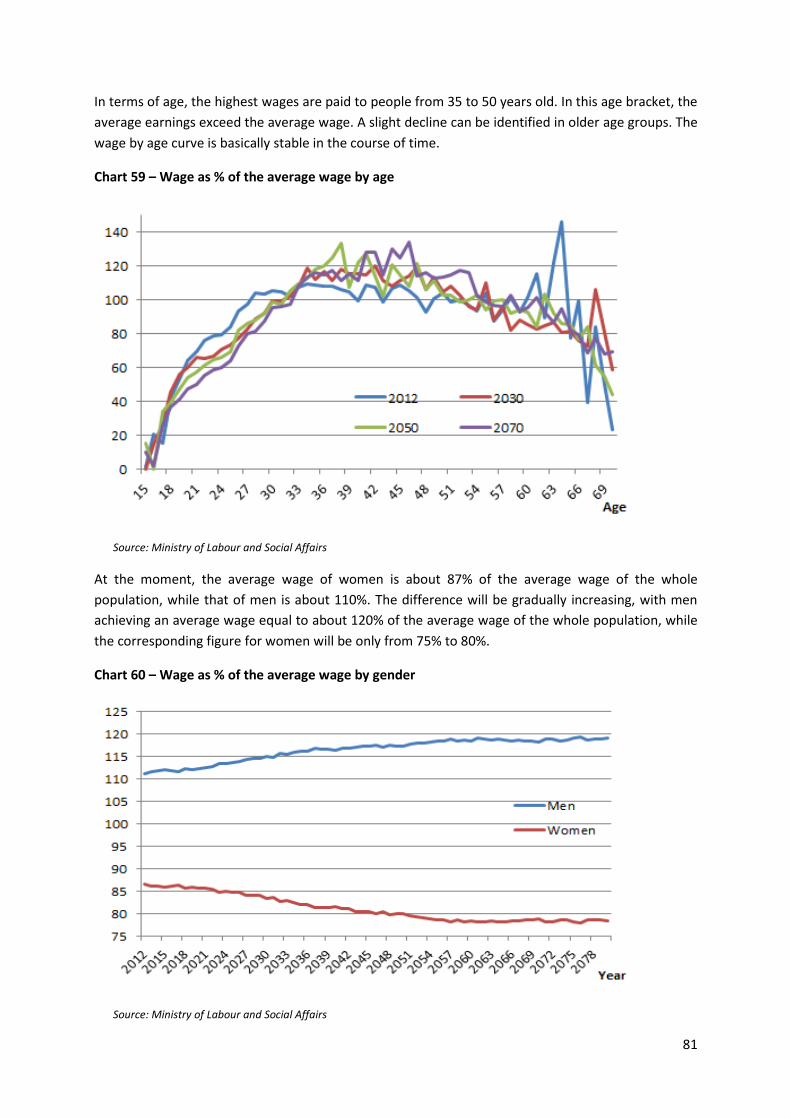
81
In terms of age, the highest wages are paid to people from 35 to 50 years old. In this age bracket, the
average earnings exceed the average wage. A slight decline can be identified in older age groups. The
wage by age curve is basically stable in the course of time.
Chart 59 – Wage as % of the average wage by age
Source: Ministry of Labour and Social Affairs
At the moment, the average wage of women is about 87% of the average wage of the whole
population, while that of men is about 110%. The difference will be gradually increasing, with men
achieving an average wage equal to about 120% of the average wage of the whole population, while
the corresponding figure for women will be only from 75% to 80%.
Chart 60 – Wage as % of the average wage by gender
Source: Ministry of Labour and Social Affairs
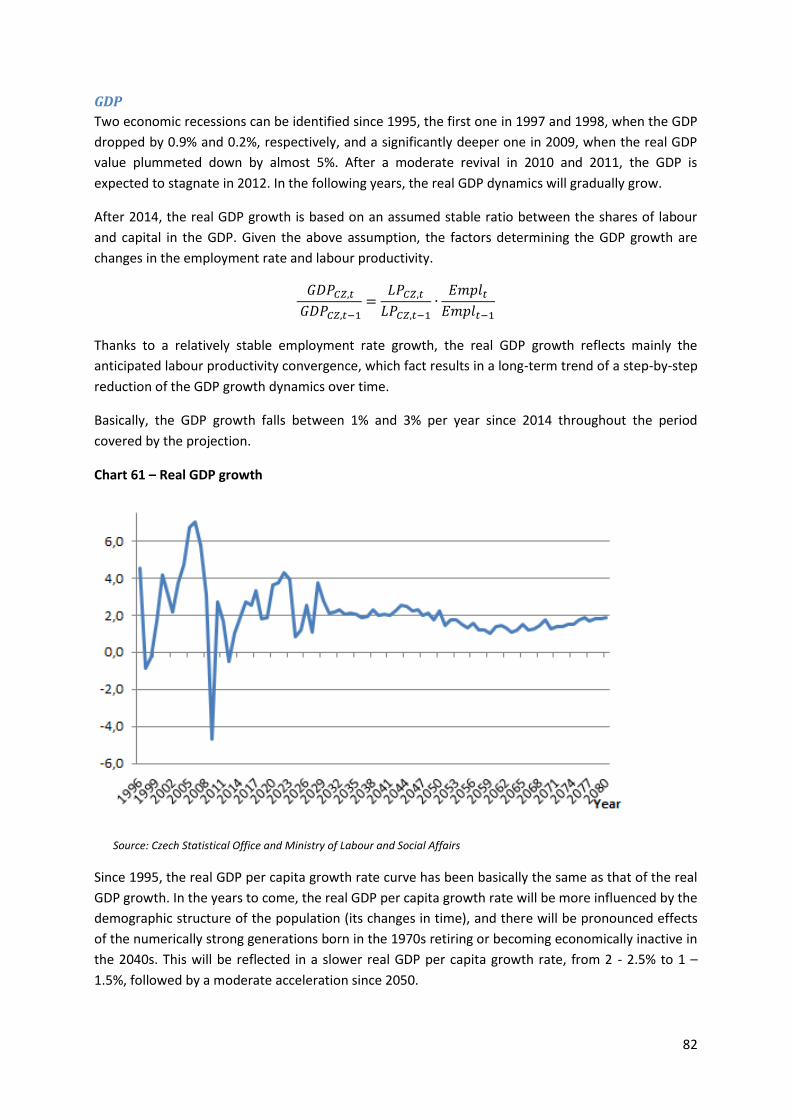
82
GDP
Two economic recessions can be identified since 1995, the first one in 1997 and 1998, when the GDP
dropped by 0.9% and 0.2%, respectively, and a significantly deeper one in 2009, when the real GDP
value plummeted down by almost 5%. After a moderate revival in 2010 and 2011, the GDP is
expected to stagnate in 2012. In the following years, the real GDP dynamics will gradually grow.
After 2014, the real GDP growth is based on an assumed stable ratio between the shares of labour
and capital in the GDP. Given the above assumption, the factors determining the GDP growth are
changes in the employment rate and labour productivity.
Thanks to a relatively stable employment rate growth, the real GDP growth reflects mainly the
anticipated labour productivity convergence, which fact results in a long-term trend of a step-by-step
reduction of the GDP growth dynamics over time.
Basically, the GDP growth falls between 1% and 3% per year since 2014 throughout the period
covered by the projection.
Chart 61 – Real GDP growth
Source: Czech Statistical Office and Ministry of Labour and Social Affairs
Since 1995, the real GDP per capita growth rate curve has been basically the same as that of the real
GDP growth. In the years to come, the real GDP per capita growth rate will be more influenced by the
demographic structure of the population (its changes in time), and there will be pronounced effects
of the numerically strong generations born in the 1970s retiring or becoming economically inactive in
the 2040s. This will be reflected in a slower real GDP per capita growth rate, from 2 - 2.5% to 1 –
1.5%, followed by a moderate acceleration since 2050.
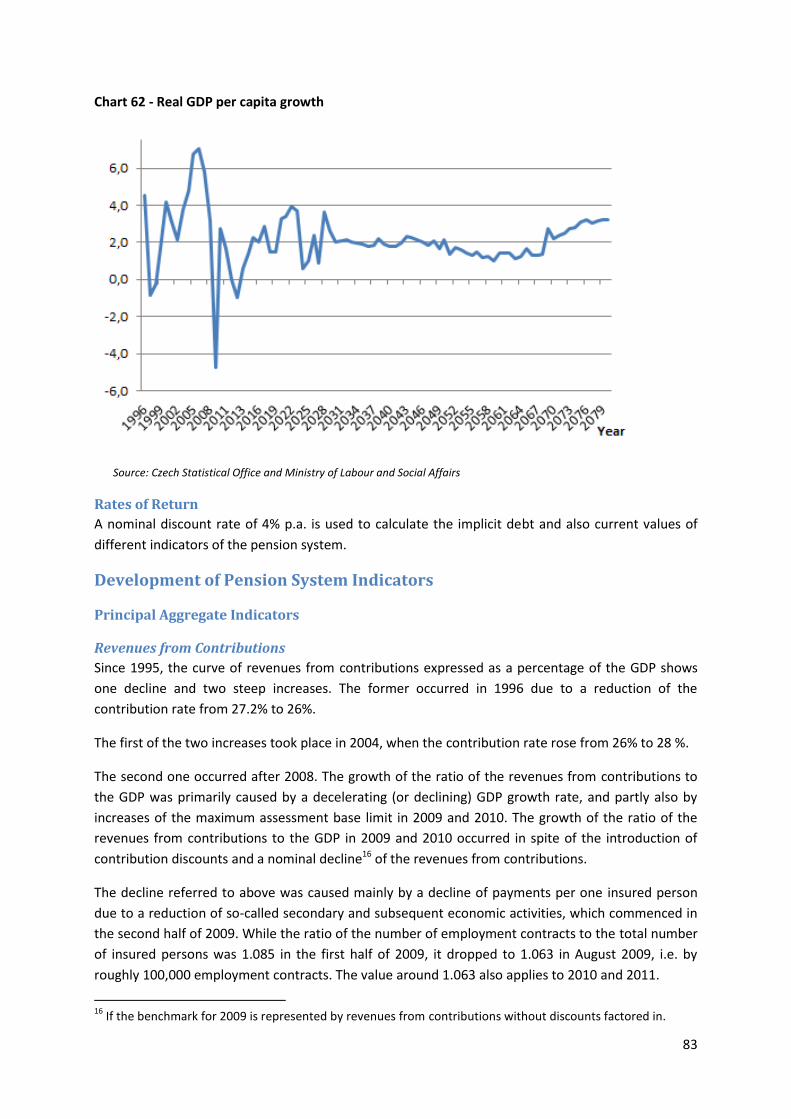
83
Chart 62 - Real GDP per capita growth
Source: Czech Statistical Office and Ministry of Labour and Social Affairs
Rates of Return
A nominal discount rate of 4% p.a. is used to calculate the implicit debt and also current values of
different indicators of the pension system.
Development of Pension System Indicators
Principal Aggregate Indicators
Revenues from Contributions
Since 1995, the curve of revenues from contributions expressed as a percentage of the GDP shows
one decline and two steep increases. The former occurred in 1996 due to a reduction of the
contribution rate from 27.2% to 26%.
The first of the two increases took place in 2004, when the contribution rate rose from 26% to 28 %.
The second one occurred after 2008. The growth of the ratio of the revenues from contributions to
the GDP was primarily caused by a decelerating (or declining) GDP growth rate, and partly also by
increases of the maximum assessment base limit in 2009 and 2010. The growth of the ratio of the
revenues from contributions to the GDP in 2009 and 2010 occurred in spite of the introduction of
contribution discounts and a nominal decline16 of the revenues from contributions.
The decline referred to above was caused mainly by a decline of payments per one insured person
due to a reduction of so-called secondary and subsequent economic activities, which commenced in
the second half of 2009. While the ratio of the number of employment contracts to the total number
of insured persons was 1.085 in the first half of 2009, it dropped to 1.063 in August 2009, i.e. by
roughly 100,000 employment contracts. The value around 1.063 also applies to 2010 and 2011.
16
If the benchmark for 2009 is represented by revenues from contributions without discounts factored in.
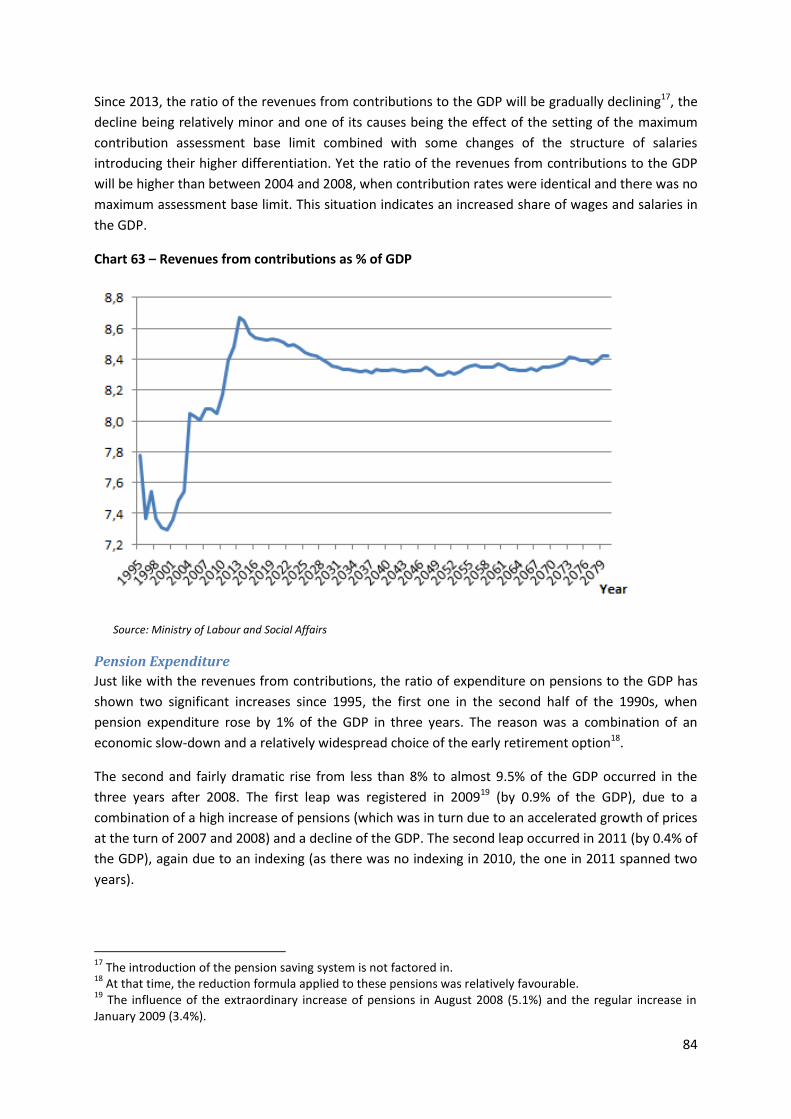
84
Since 2013, the ratio of the revenues from contributions to the GDP will be gradually declining17, the
decline being relatively minor and one of its causes being the effect of the setting of the maximum
contribution assessment base limit combined with some changes of the structure of salaries
introducing their higher differentiation. Yet the ratio of the revenues from contributions to the GDP
will be higher than between 2004 and 2008, when contribution rates were identical and there was no
maximum assessment base limit. This situation indicates an increased share of wages and salaries in
the GDP.
Chart 63 – Revenues from contributions as % of GDP
Source: Ministry of Labour and Social Affairs
Pension Expenditure
Just like with the revenues from contributions, the ratio of expenditure on pensions to the GDP has
shown two significant increases since 1995, the first one in the second half of the 1990s, when
pension expenditure rose by 1% of the GDP in three years. The reason was a combination of an
economic slow-down and a relatively widespread choice of the early retirement option18.
The second and fairly dramatic rise from less than 8% to almost 9.5% of the GDP occurred in the
three years after 2008. The first leap was registered in 200919 (by 0.9% of the GDP), due to a
combination of a high increase of pensions (which was in turn due to an accelerated growth of prices
at the turn of 2007 and 2008) and a decline of the GDP. The second leap occurred in 2011 (by 0.4% of
the GDP), again due to an indexing (as there was no indexing in 2010, the one in 2011 spanned two
years).
17
The introduction of the pension saving system is not factored in. 18
At that time, the reduction formula applied to these pensions was relatively favourable. 19
The influence of the extraordinary increase of pensions in August 2008 (5.1%) and the regular increase in January 2009 (3.4%).
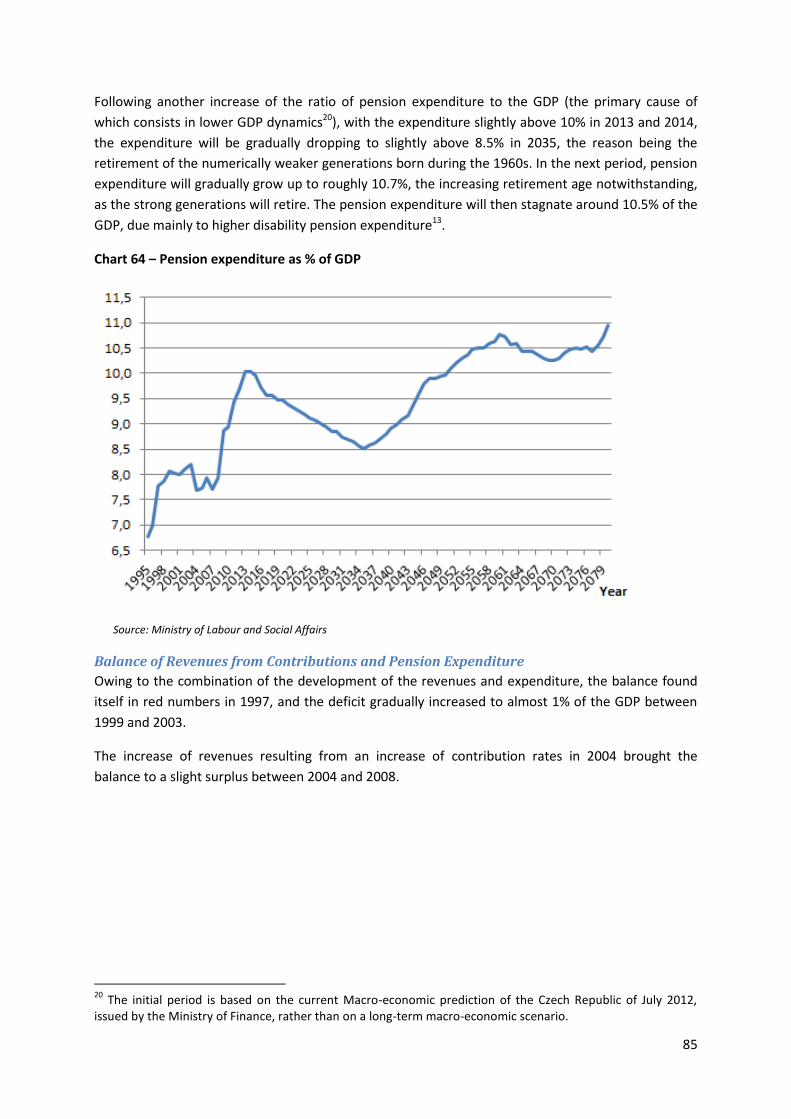
85
Following another increase of the ratio of pension expenditure to the GDP (the primary cause of
which consists in lower GDP dynamics20), with the expenditure slightly above 10% in 2013 and 2014,
the expenditure will be gradually dropping to slightly above 8.5% in 2035, the reason being the
retirement of the numerically weaker generations born during the 1960s. In the next period, pension
expenditure will gradually grow up to roughly 10.7%, the increasing retirement age notwithstanding,
as the strong generations will retire. The pension expenditure will then stagnate around 10.5% of the
GDP, due mainly to higher disability pension expenditure13.
Chart 64 – Pension expenditure as % of GDP
Source: Ministry of Labour and Social Affairs
Balance of Revenues from Contributions and Pension Expenditure
Owing to the combination of the development of the revenues and expenditure, the balance found
itself in red numbers in 1997, and the deficit gradually increased to almost 1% of the GDP between
1999 and 2003.
The increase of revenues resulting from an increase of contribution rates in 2004 brought the
balance to a slight surplus between 2004 and 2008.
20
The initial period is based on the current Macro-economic prediction of the Czech Republic of July 2012, issued by the Ministry of Finance, rather than on a long-term macro-economic scenario.
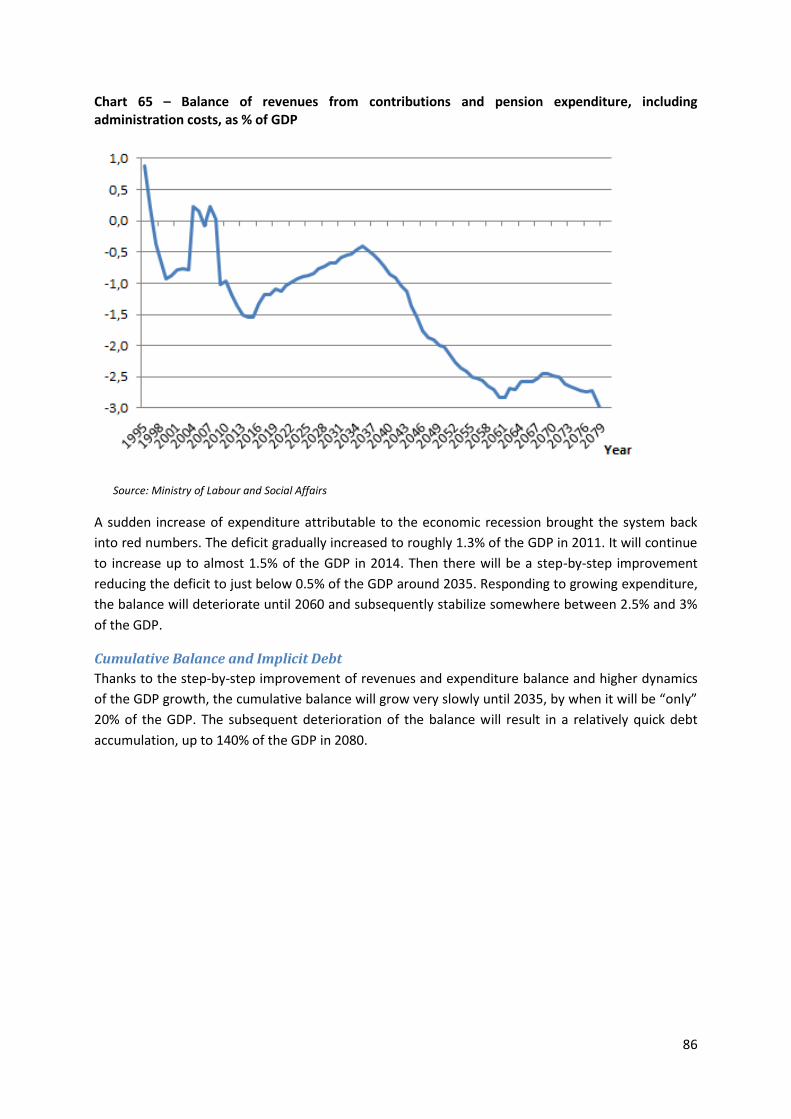
86
Chart 65 – Balance of revenues from contributions and pension expenditure, including administration costs, as % of GDP
Source: Ministry of Labour and Social Affairs
A sudden increase of expenditure attributable to the economic recession brought the system back
into red numbers. The deficit gradually increased to roughly 1.3% of the GDP in 2011. It will continue
to increase up to almost 1.5% of the GDP in 2014. Then there will be a step-by-step improvement
reducing the deficit to just below 0.5% of the GDP around 2035. Responding to growing expenditure,
the balance will deteriorate until 2060 and subsequently stabilize somewhere between 2.5% and 3%
of the GDP.
Cumulative Balance and Implicit Debt
Thanks to the step-by-step improvement of revenues and expenditure balance and higher dynamics
of the GDP growth, the cumulative balance will grow very slowly until 2035, by when it will be “only”
20% of the GDP. The subsequent deterioration of the balance will result in a relatively quick debt
accumulation, up to 140% of the GDP in 2080.
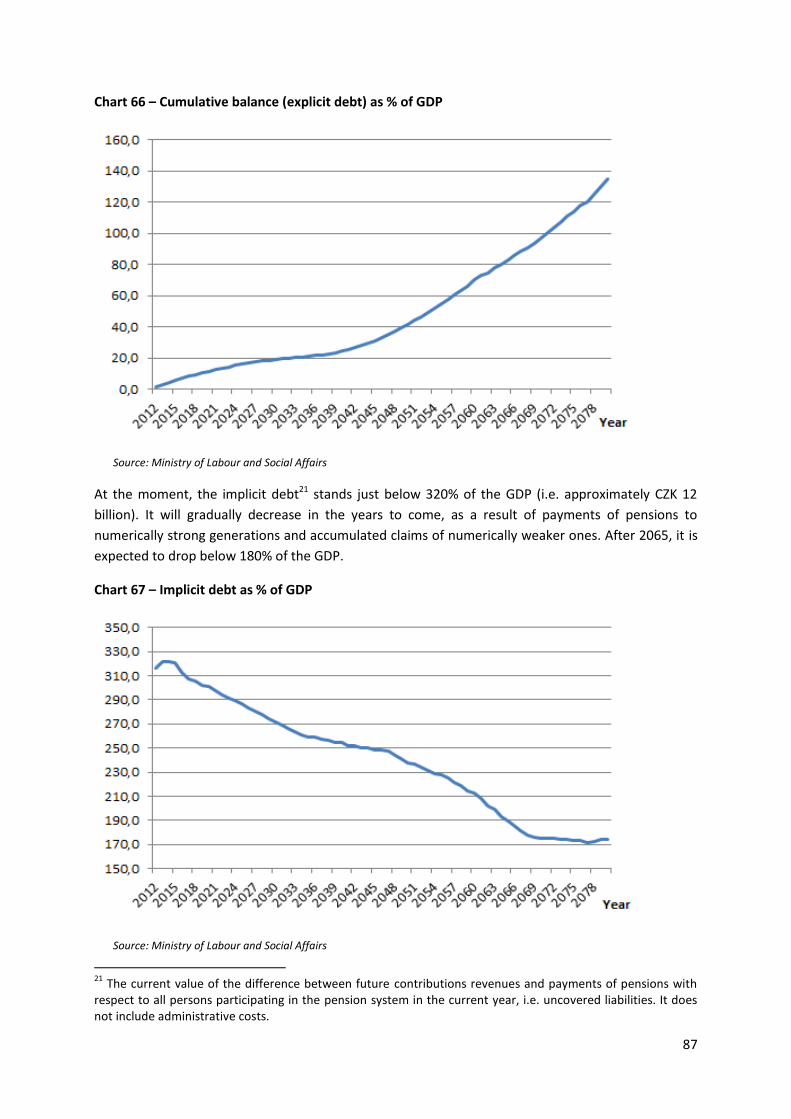
87
Chart 66 – Cumulative balance (explicit debt) as % of GDP
Source: Ministry of Labour and Social Affairs
At the moment, the implicit debt21 stands just below 320% of the GDP (i.e. approximately CZK 12
billion). It will gradually decrease in the years to come, as a result of payments of pensions to
numerically strong generations and accumulated claims of numerically weaker ones. After 2065, it is
expected to drop below 180% of the GDP.
Chart 67 – Implicit debt as % of GDP
Source: Ministry of Labour and Social Affairs
21
The current value of the difference between future contributions revenues and payments of pensions with respect to all persons participating in the pension system in the current year, i.e. uncovered liabilities. It does not include administrative costs.
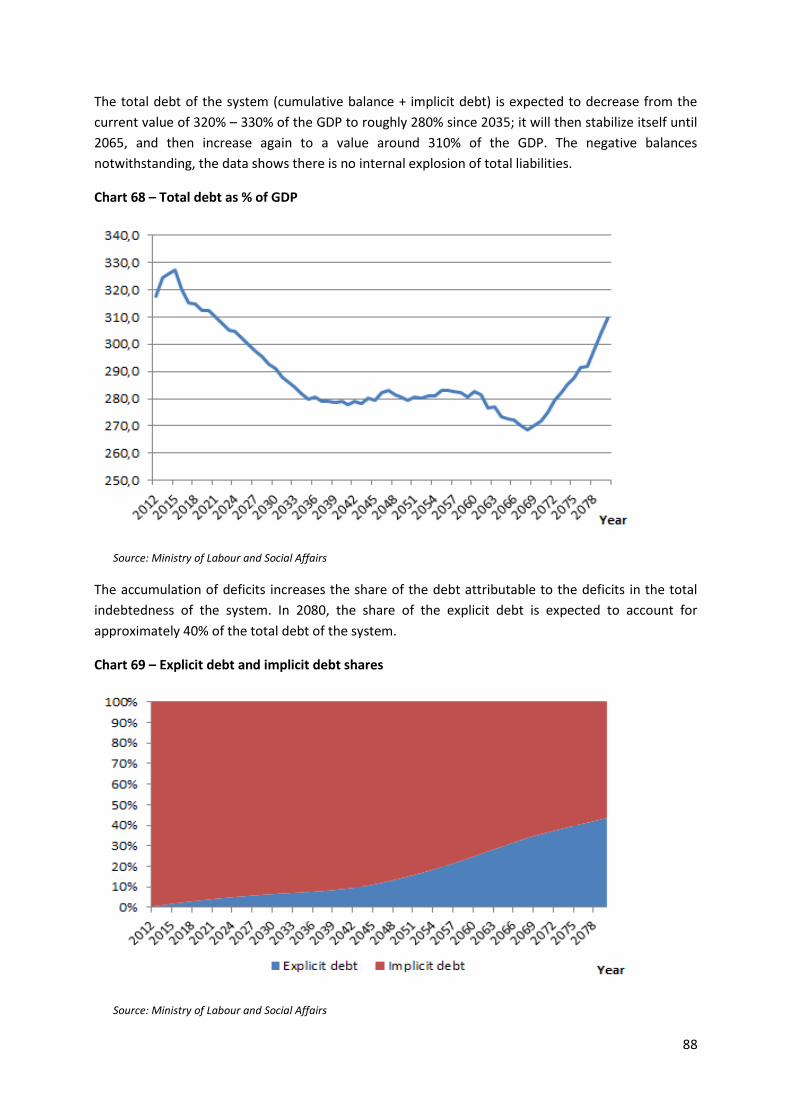
88
The total debt of the system (cumulative balance + implicit debt) is expected to decrease from the
current value of 320% – 330% of the GDP to roughly 280% since 2035; it will then stabilize itself until
2065, and then increase again to a value around 310% of the GDP. The negative balances
notwithstanding, the data shows there is no internal explosion of total liabilities.
Chart 68 – Total debt as % of GDP
Source: Ministry of Labour and Social Affairs
The accumulation of deficits increases the share of the debt attributable to the deficits in the total
indebtedness of the system. In 2080, the share of the explicit debt is expected to account for
approximately 40% of the total debt of the system.
Chart 69 – Explicit debt and implicit debt shares
Source: Ministry of Labour and Social Affairs
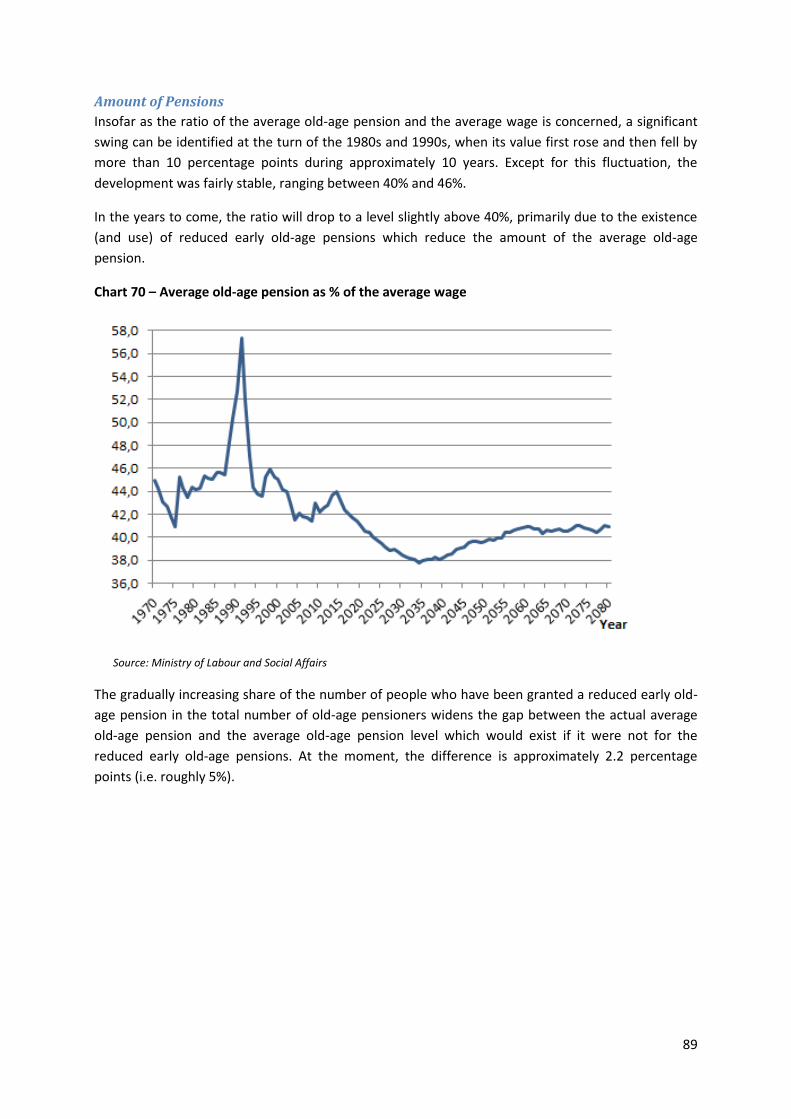
89
Amount of Pensions
Insofar as the ratio of the average old-age pension and the average wage is concerned, a significant
swing can be identified at the turn of the 1980s and 1990s, when its value first rose and then fell by
more than 10 percentage points during approximately 10 years. Except for this fluctuation, the
development was fairly stable, ranging between 40% and 46%.
In the years to come, the ratio will drop to a level slightly above 40%, primarily due to the existence
(and use) of reduced early old-age pensions which reduce the amount of the average old-age
pension.
Chart 70 – Average old-age pension as % of the average wage
Source: Ministry of Labour and Social Affairs
The gradually increasing share of the number of people who have been granted a reduced early old-
age pension in the total number of old-age pensioners widens the gap between the actual average
old-age pension and the average old-age pension level which would exist if it were not for the
reduced early old-age pensions. At the moment, the difference is approximately 2.2 percentage
points (i.e. roughly 5%).
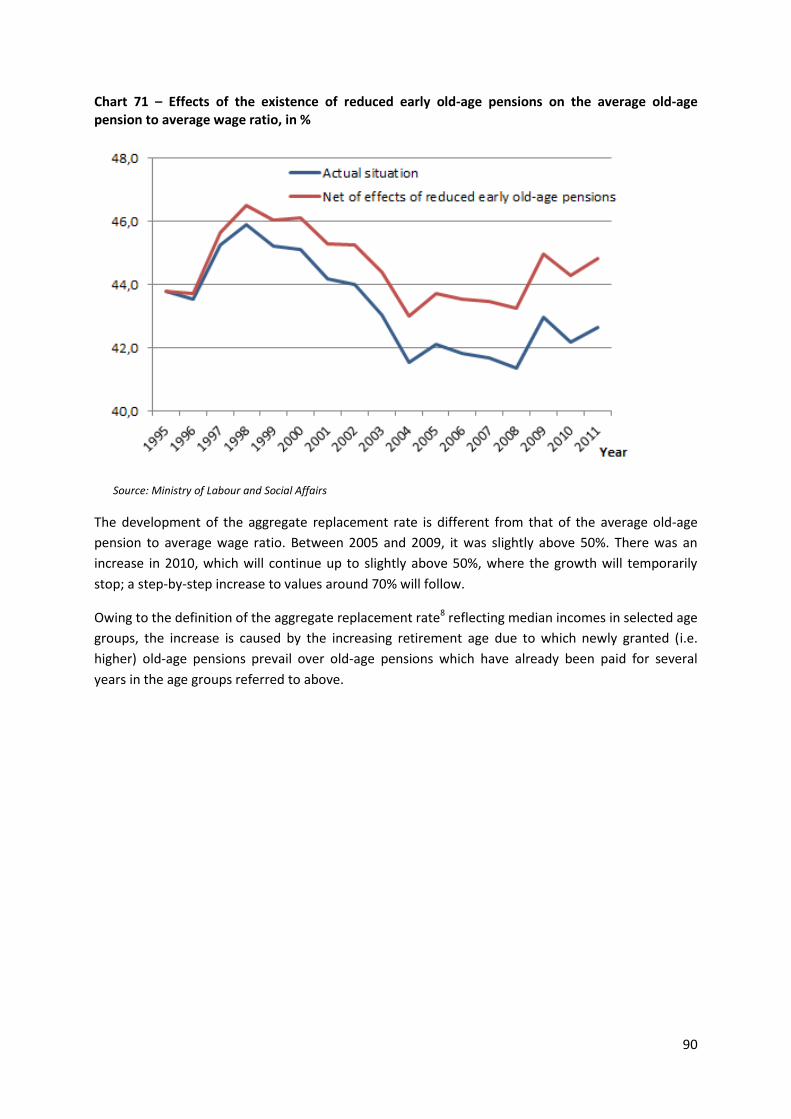
90
Chart 71 – Effects of the existence of reduced early old-age pensions on the average old-age pension to average wage ratio, in %
Source: Ministry of Labour and Social Affairs
The development of the aggregate replacement rate is different from that of the average old-age
pension to average wage ratio. Between 2005 and 2009, it was slightly above 50%. There was an
increase in 2010, which will continue up to slightly above 50%, where the growth will temporarily
stop; a step-by-step increase to values around 70% will follow.
Owing to the definition of the aggregate replacement rate8 reflecting median incomes in selected age
groups, the increase is caused by the increasing retirement age due to which newly granted (i.e.
higher) old-age pensions prevail over old-age pensions which have already been paid for several
years in the age groups referred to above.
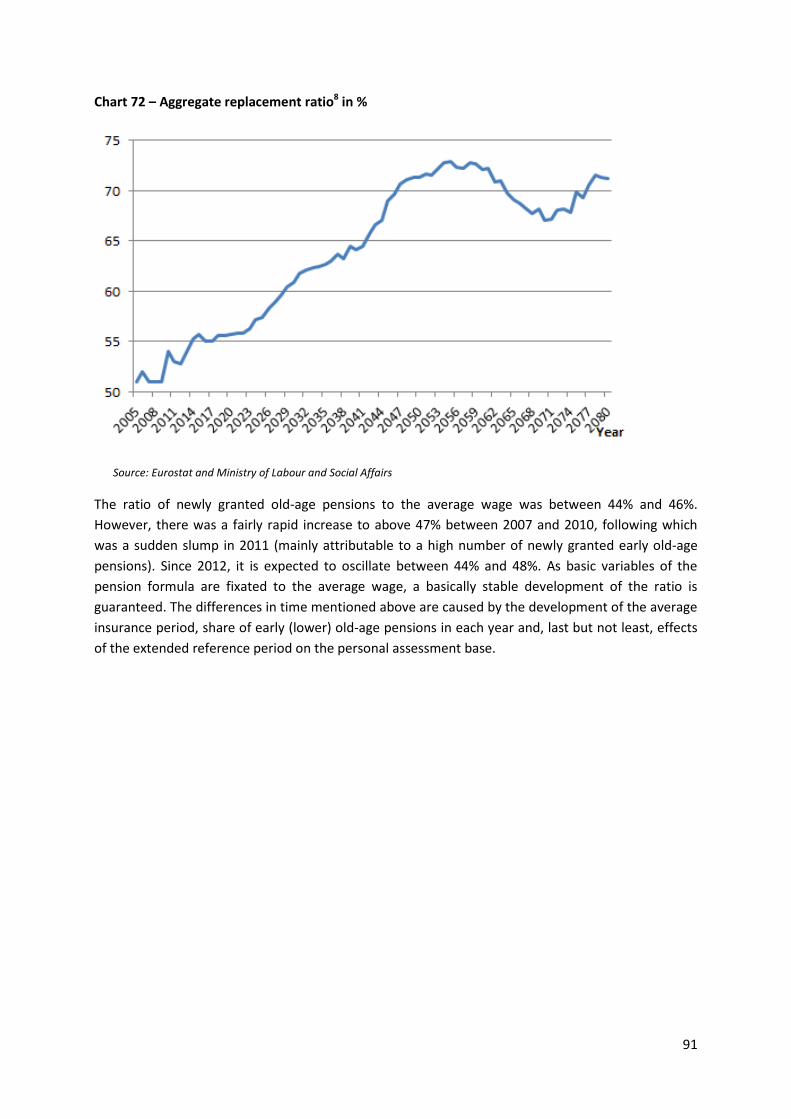
91
Chart 72 – Aggregate replacement ratio8 in %
Source: Eurostat and Ministry of Labour and Social Affairs
The ratio of newly granted old-age pensions to the average wage was between 44% and 46%.
However, there was a fairly rapid increase to above 47% between 2007 and 2010, following which
was a sudden slump in 2011 (mainly attributable to a high number of newly granted early old-age
pensions). Since 2012, it is expected to oscillate between 44% and 48%. As basic variables of the
pension formula are fixated to the average wage, a basically stable development of the ratio is
guaranteed. The differences in time mentioned above are caused by the development of the average
insurance period, share of early (lower) old-age pensions in each year and, last but not least, effects
of the extended reference period on the personal assessment base.
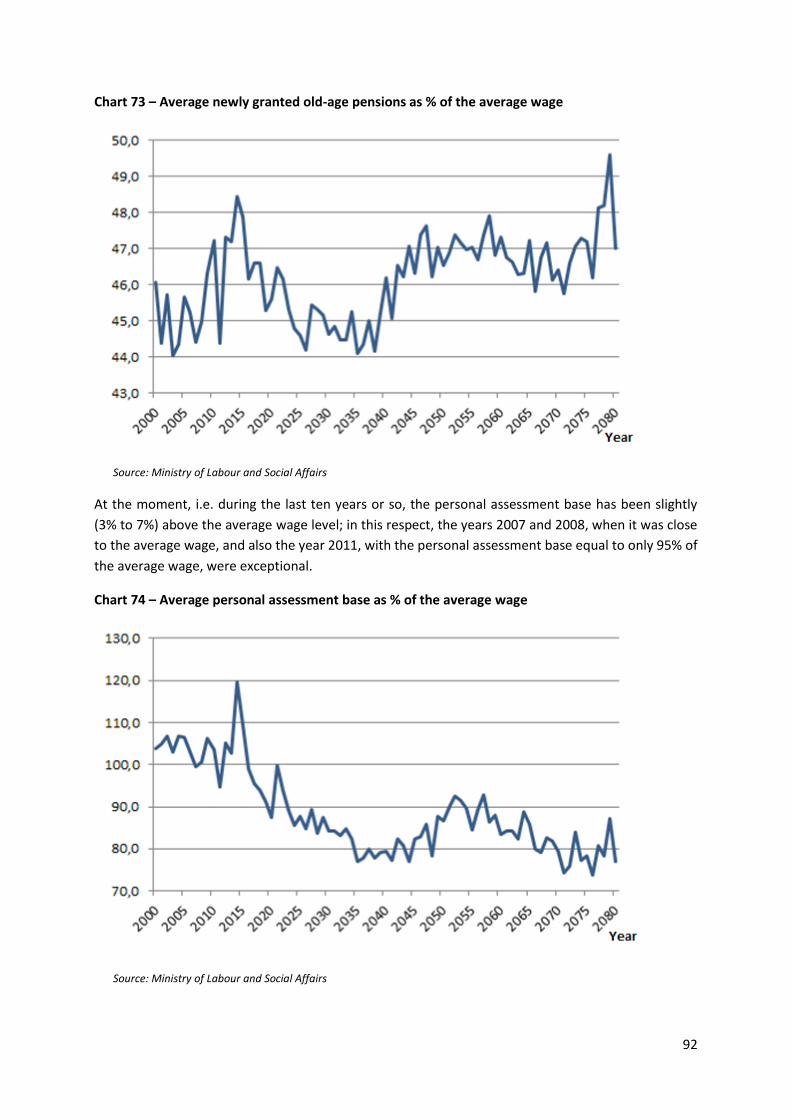
92
Chart 73 – Average newly granted old-age pensions as % of the average wage
Source: Ministry of Labour and Social Affairs
At the moment, i.e. during the last ten years or so, the personal assessment base has been slightly
(3% to 7%) above the average wage level; in this respect, the years 2007 and 2008, when it was close
to the average wage, and also the year 2011, with the personal assessment base equal to only 95% of
the average wage, were exceptional.
Chart 74 – Average personal assessment base as % of the average wage
Source: Ministry of Labour and Social Affairs
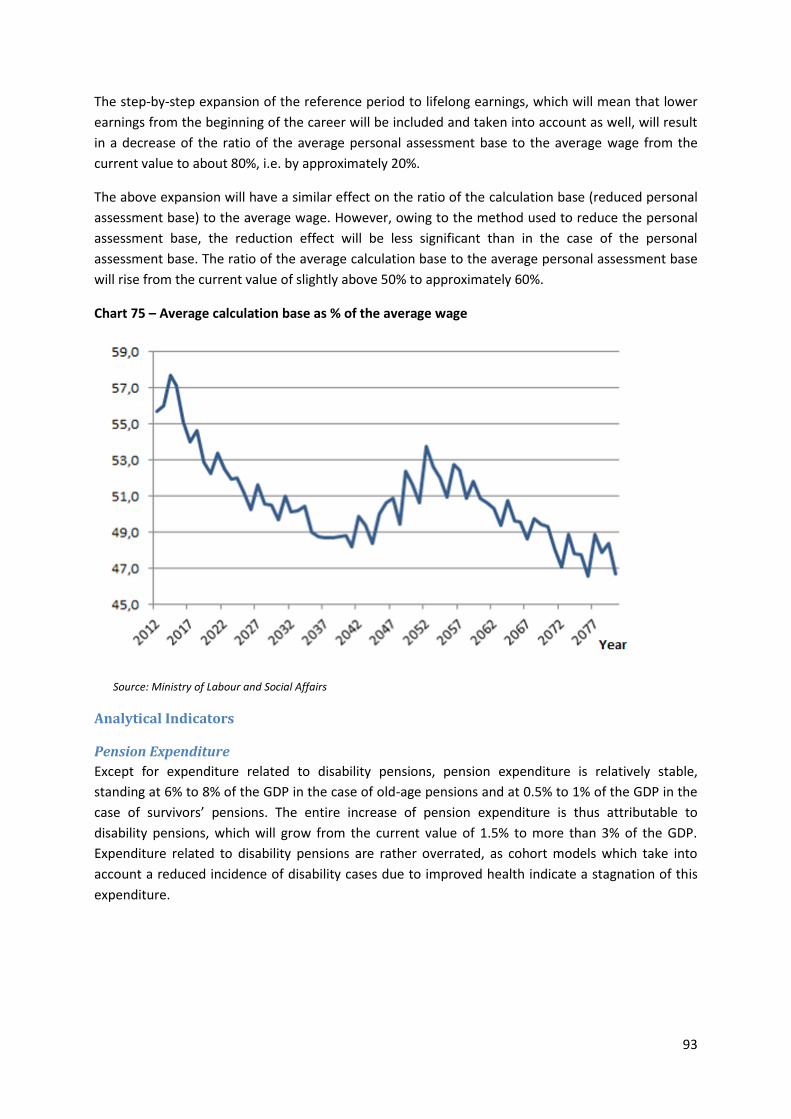
93
The step-by-step expansion of the reference period to lifelong earnings, which will mean that lower
earnings from the beginning of the career will be included and taken into account as well, will result
in a decrease of the ratio of the average personal assessment base to the average wage from the
current value to about 80%, i.e. by approximately 20%.
The above expansion will have a similar effect on the ratio of the calculation base (reduced personal
assessment base) to the average wage. However, owing to the method used to reduce the personal
assessment base, the reduction effect will be less significant than in the case of the personal
assessment base. The ratio of the average calculation base to the average personal assessment base
will rise from the current value of slightly above 50% to approximately 60%.
Chart 75 – Average calculation base as % of the average wage
Source: Ministry of Labour and Social Affairs
Analytical Indicators
Pension Expenditure
Except for expenditure related to disability pensions, pension expenditure is relatively stable,
standing at 6% to 8% of the GDP in the case of old-age pensions and at 0.5% to 1% of the GDP in the
case of survivors’ pensions. The entire increase of pension expenditure is thus attributable to
disability pensions, which will grow from the current value of 1.5% to more than 3% of the GDP.
Expenditure related to disability pensions are rather overrated, as cohort models which take into
account a reduced incidence of disability cases due to improved health indicate a stagnation of this
expenditure.
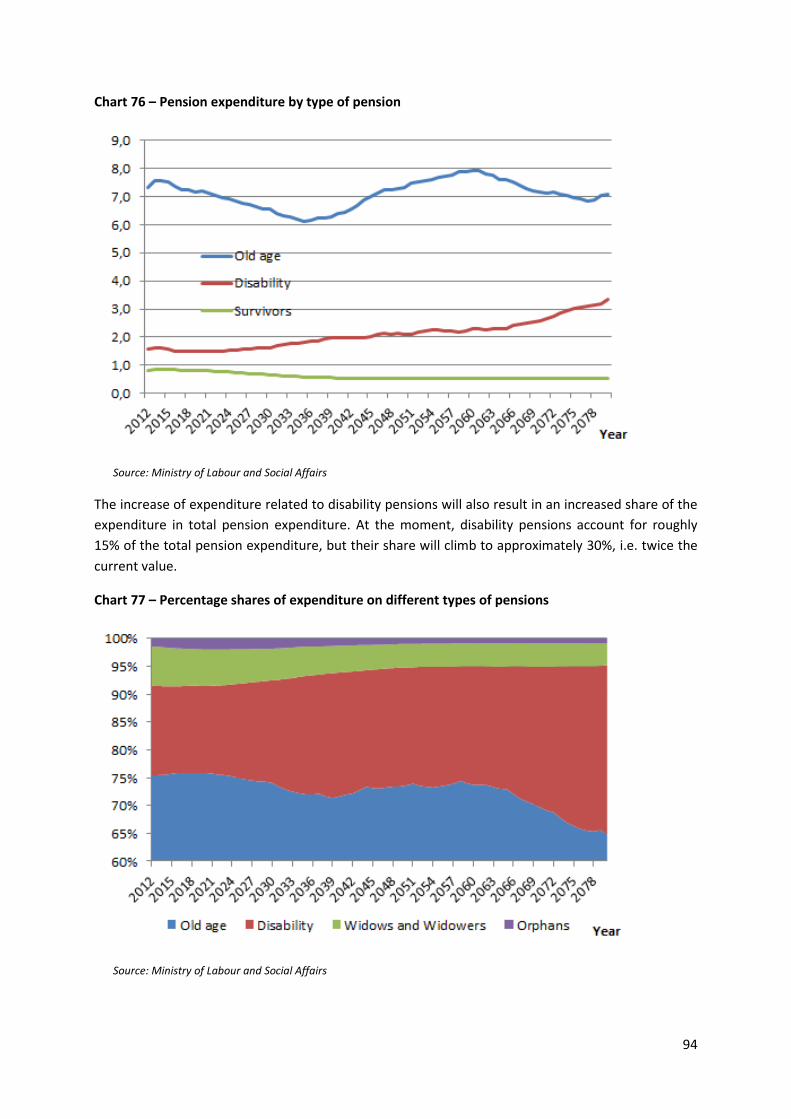
94
Chart 76 – Pension expenditure by type of pension
Source: Ministry of Labour and Social Affairs
The increase of expenditure related to disability pensions will also result in an increased share of the
expenditure in total pension expenditure. At the moment, disability pensions account for roughly
15% of the total pension expenditure, but their share will climb to approximately 30%, i.e. twice the
current value.
Chart 77 – Percentage shares of expenditure on different types of pensions
Source: Ministry of Labour and Social Affairs
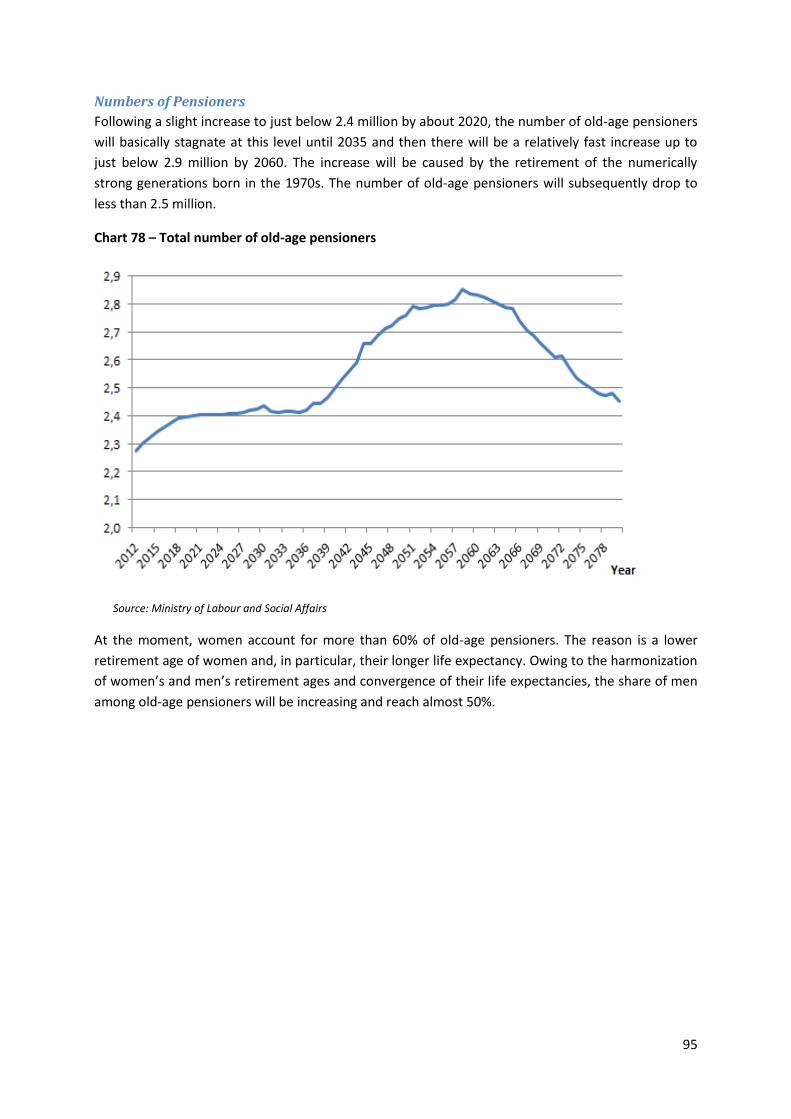
95
Numbers of Pensioners
Following a slight increase to just below 2.4 million by about 2020, the number of old-age pensioners
will basically stagnate at this level until 2035 and then there will be a relatively fast increase up to
just below 2.9 million by 2060. The increase will be caused by the retirement of the numerically
strong generations born in the 1970s. The number of old-age pensioners will subsequently drop to
less than 2.5 million.
Chart 78 – Total number of old-age pensioners
Source: Ministry of Labour and Social Affairs
At the moment, women account for more than 60% of old-age pensioners. The reason is a lower
retirement age of women and, in particular, their longer life expectancy. Owing to the harmonization
of women’s and men’s retirement ages and convergence of their life expectancies, the share of men
among old-age pensioners will be increasing and reach almost 50%.
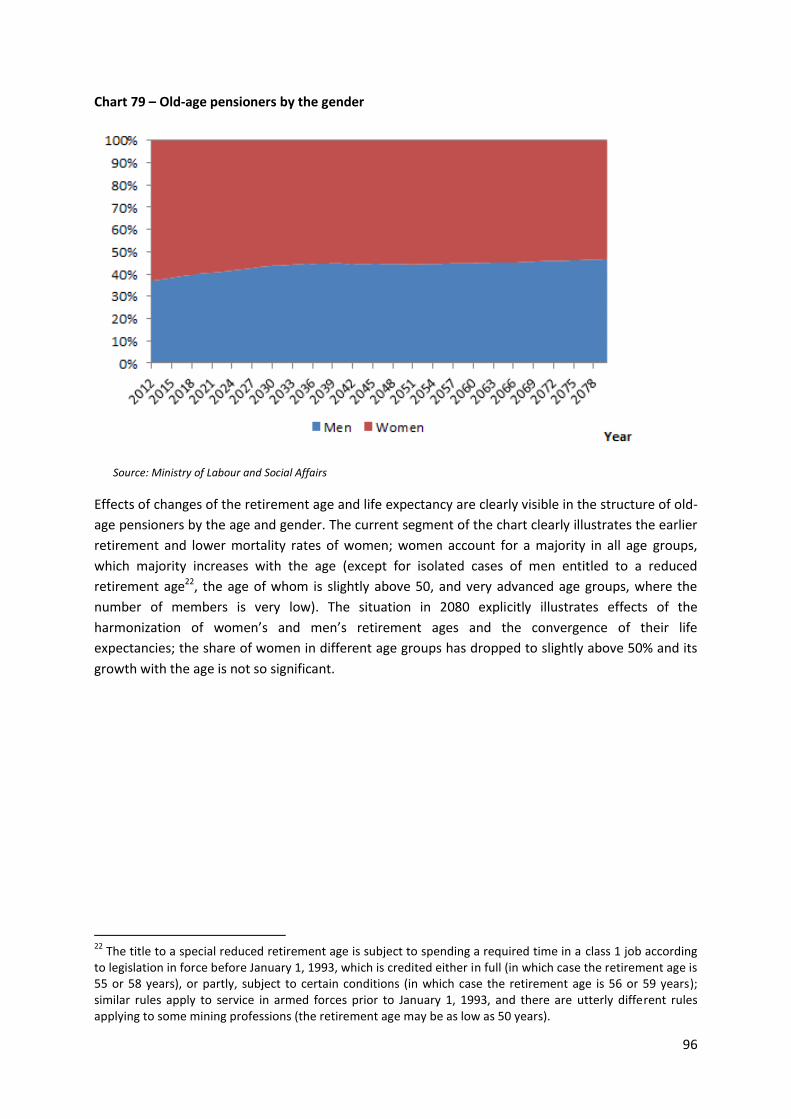
96
Chart 79 – Old-age pensioners by the gender
Source: Ministry of Labour and Social Affairs
Effects of changes of the retirement age and life expectancy are clearly visible in the structure of old-
age pensioners by the age and gender. The current segment of the chart clearly illustrates the earlier
retirement and lower mortality rates of women; women account for a majority in all age groups,
which majority increases with the age (except for isolated cases of men entitled to a reduced
retirement age22, the age of whom is slightly above 50, and very advanced age groups, where the
number of members is very low). The situation in 2080 explicitly illustrates effects of the
harmonization of women’s and men’s retirement ages and the convergence of their life
expectancies; the share of women in different age groups has dropped to slightly above 50% and its
growth with the age is not so significant.
22
The title to a special reduced retirement age is subject to spending a required time in a class 1 job according to legislation in force before January 1, 1993, which is credited either in full (in which case the retirement age is 55 or 58 years), or partly, subject to certain conditions (in which case the retirement age is 56 or 59 years); similar rules apply to service in armed forces prior to January 1, 1993, and there are utterly different rules applying to some mining professions (the retirement age may be as low as 50 years).
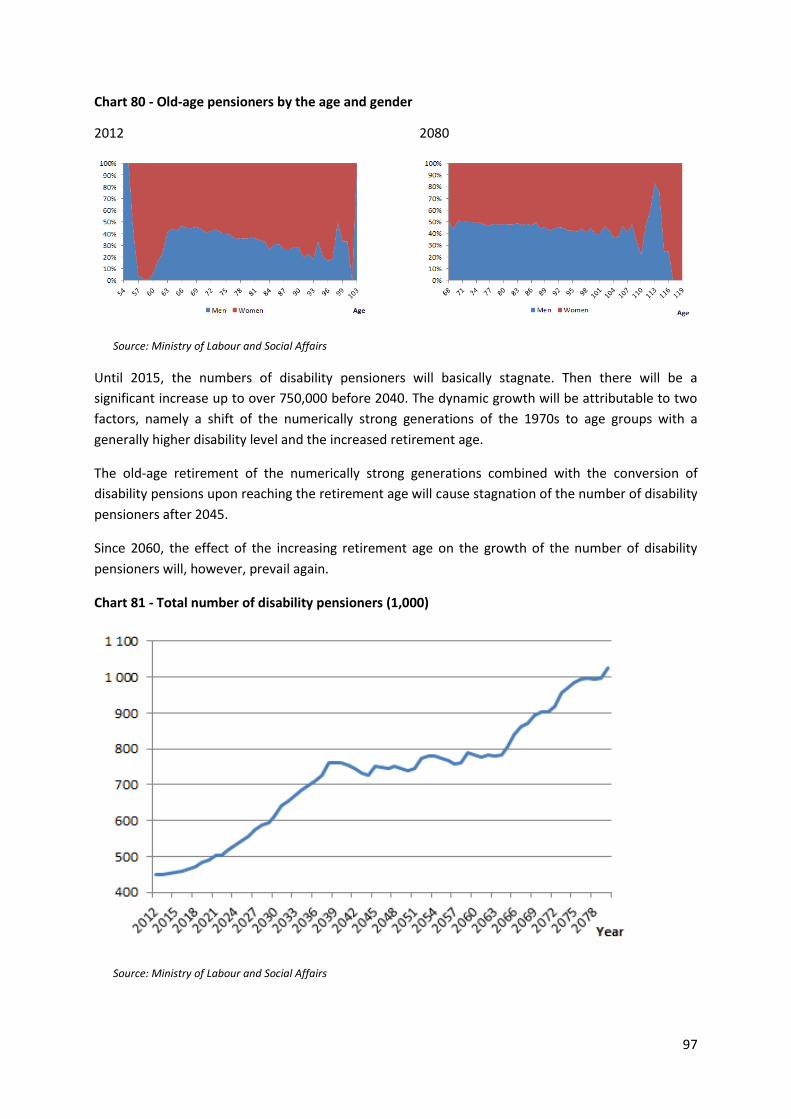
97
Chart 80 - Old-age pensioners by the age and gender
2012 2080
Source: Ministry of Labour and Social Affairs
Until 2015, the numbers of disability pensioners will basically stagnate. Then there will be a
significant increase up to over 750,000 before 2040. The dynamic growth will be attributable to two
factors, namely a shift of the numerically strong generations of the 1970s to age groups with a
generally higher disability level and the increased retirement age.
The old-age retirement of the numerically strong generations combined with the conversion of
disability pensions upon reaching the retirement age will cause stagnation of the number of disability
pensioners after 2045.
Since 2060, the effect of the increasing retirement age on the growth of the number of disability
pensioners will, however, prevail again.
Chart 81 - Total number of disability pensioners (1,000)
Source: Ministry of Labour and Social Affairs
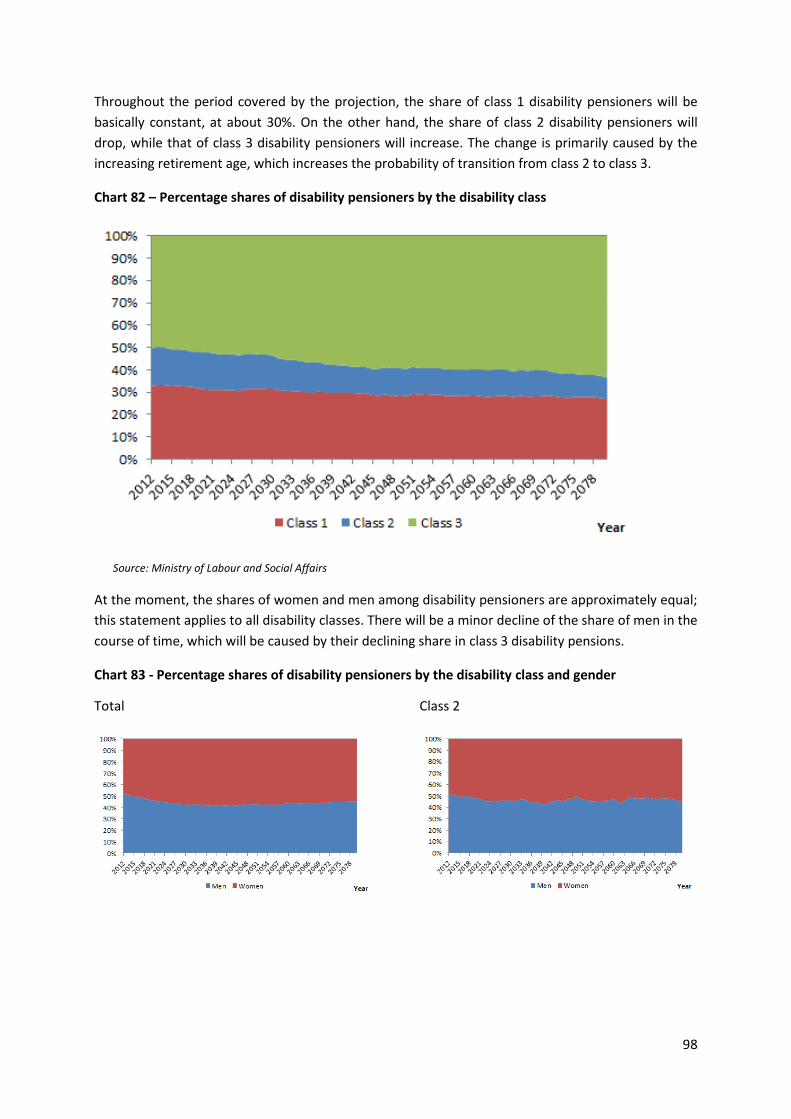
98
Throughout the period covered by the projection, the share of class 1 disability pensioners will be
basically constant, at about 30%. On the other hand, the share of class 2 disability pensioners will
drop, while that of class 3 disability pensioners will increase. The change is primarily caused by the
increasing retirement age, which increases the probability of transition from class 2 to class 3.
Chart 82 – Percentage shares of disability pensioners by the disability class
Source: Ministry of Labour and Social Affairs
At the moment, the shares of women and men among disability pensioners are approximately equal;
this statement applies to all disability classes. There will be a minor decline of the share of men in the
course of time, which will be caused by their declining share in class 3 disability pensions.
Chart 83 - Percentage shares of disability pensioners by the disability class and gender
Total Class 2
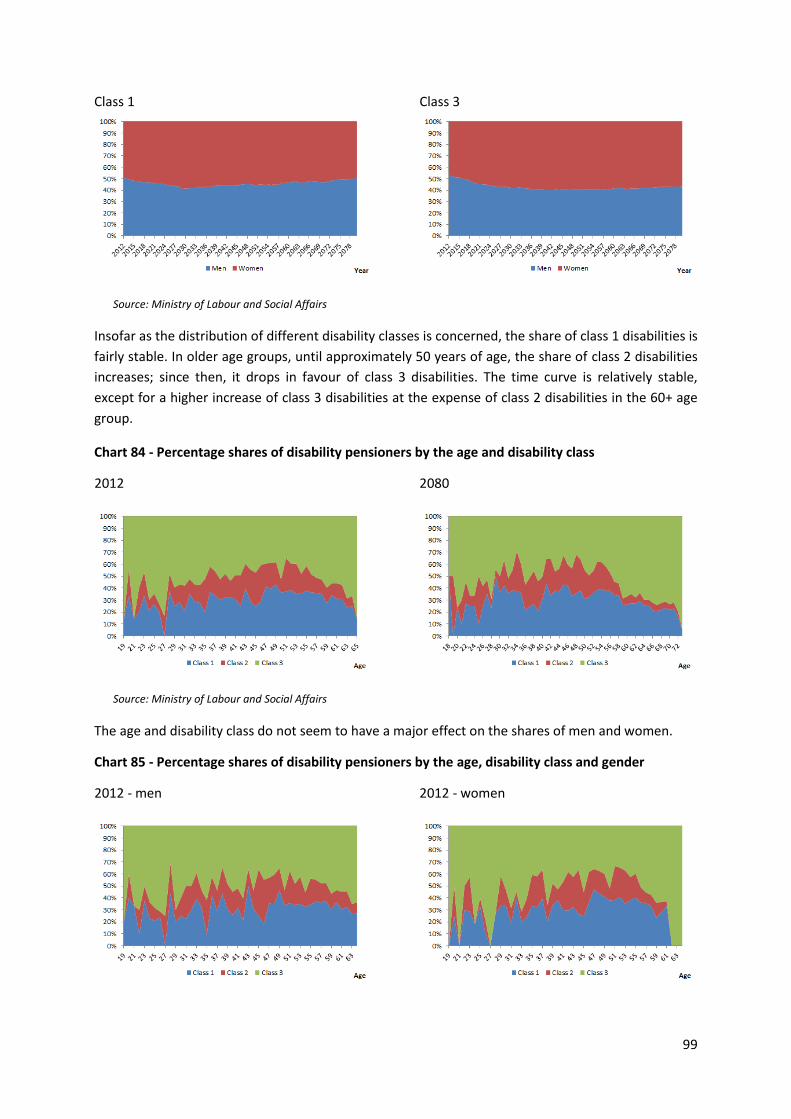
99
Class 1
Class 3
Source: Ministry of Labour and Social Affairs
Insofar as the distribution of different disability classes is concerned, the share of class 1 disabilities is
fairly stable. In older age groups, until approximately 50 years of age, the share of class 2 disabilities
increases; since then, it drops in favour of class 3 disabilities. The time curve is relatively stable,
except for a higher increase of class 3 disabilities at the expense of class 2 disabilities in the 60+ age
group.
Chart 84 - Percentage shares of disability pensioners by the age and disability class
2012 2080
Source: Ministry of Labour and Social Affairs
The age and disability class do not seem to have a major effect on the shares of men and women.
Chart 85 - Percentage shares of disability pensioners by the age, disability class and gender
2012 - men 2012 - women
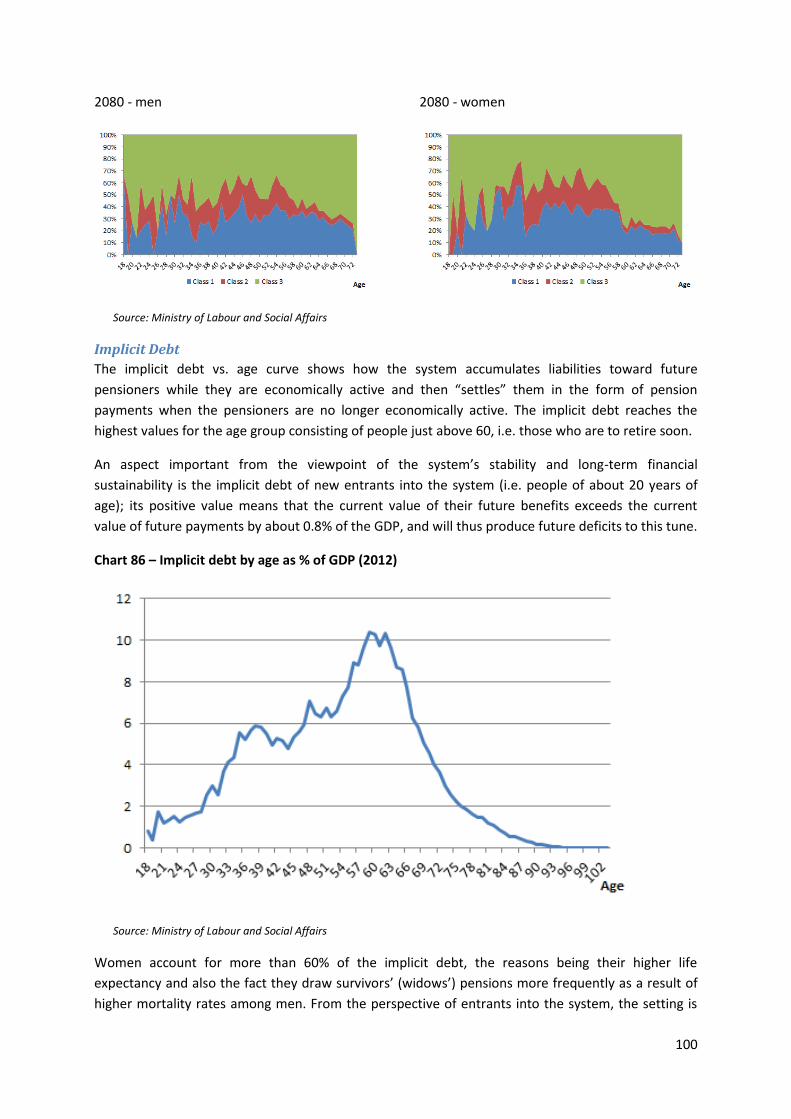
100
2080 - men 2080 - women
Source: Ministry of Labour and Social Affairs
Implicit Debt
The implicit debt vs. age curve shows how the system accumulates liabilities toward future
pensioners while they are economically active and then “settles” them in the form of pension
payments when the pensioners are no longer economically active. The implicit debt reaches the
highest values for the age group consisting of people just above 60, i.e. those who are to retire soon.
An aspect important from the viewpoint of the system’s stability and long-term financial
sustainability is the implicit debt of new entrants into the system (i.e. people of about 20 years of
age); its positive value means that the current value of their future benefits exceeds the current
value of future payments by about 0.8% of the GDP, and will thus produce future deficits to this tune.
Chart 86 – Implicit debt by age as % of GDP (2012)
Source: Ministry of Labour and Social Affairs
Women account for more than 60% of the implicit debt, the reasons being their higher life
expectancy and also the fact they draw survivors’ (widows’) pensions more frequently as a result of
higher mortality rates among men. From the perspective of entrants into the system, the setting is
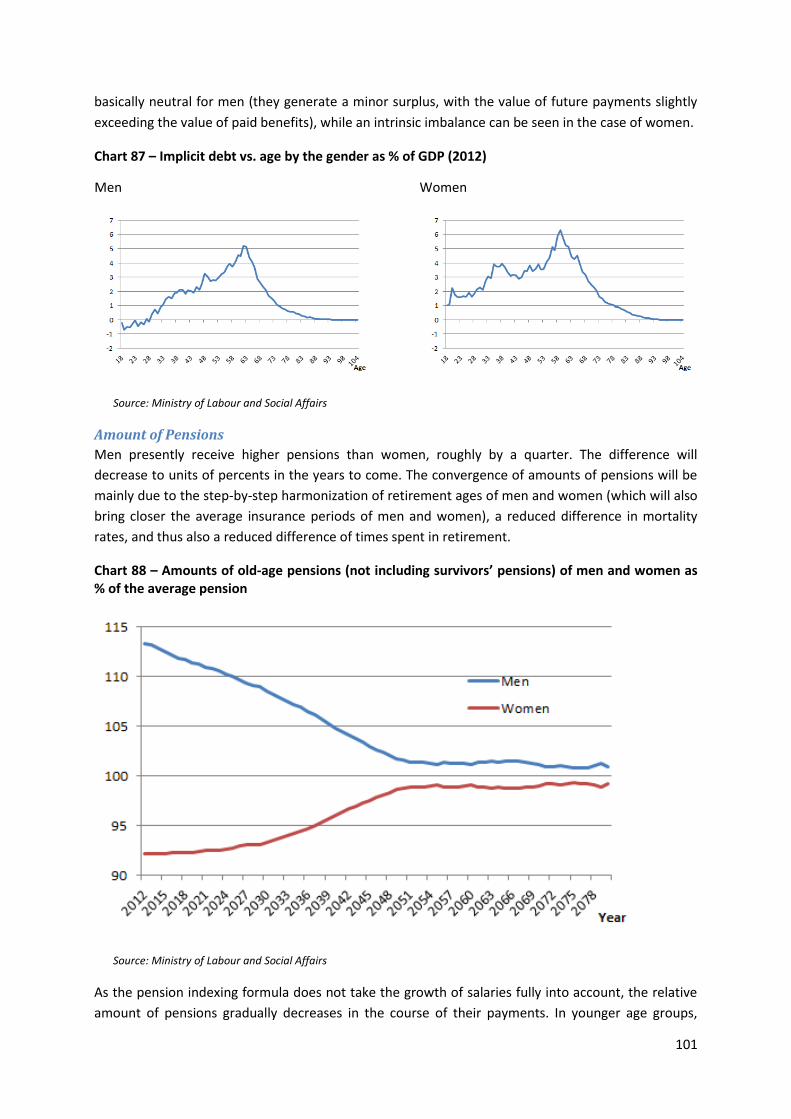
101
basically neutral for men (they generate a minor surplus, with the value of future payments slightly
exceeding the value of paid benefits), while an intrinsic imbalance can be seen in the case of women.
Chart 87 – Implicit debt vs. age by the gender as % of GDP (2012)
Men
Source: Ministry of Labour and Social Affairs
Women
Amount of Pensions
Men presently receive higher pensions than women, roughly by a quarter. The difference will
decrease to units of percents in the years to come. The convergence of amounts of pensions will be
mainly due to the step-by-step harmonization of retirement ages of men and women (which will also
bring closer the average insurance periods of men and women), a reduced difference in mortality
rates, and thus also a reduced difference of times spent in retirement.
Chart 88 – Amounts of old-age pensions (not including survivors’ pensions) of men and women as % of the average pension
Source: Ministry of Labour and Social Affairs
As the pension indexing formula does not take the growth of salaries fully into account, the relative
amount of pensions gradually decreases in the course of their payments. In younger age groups,
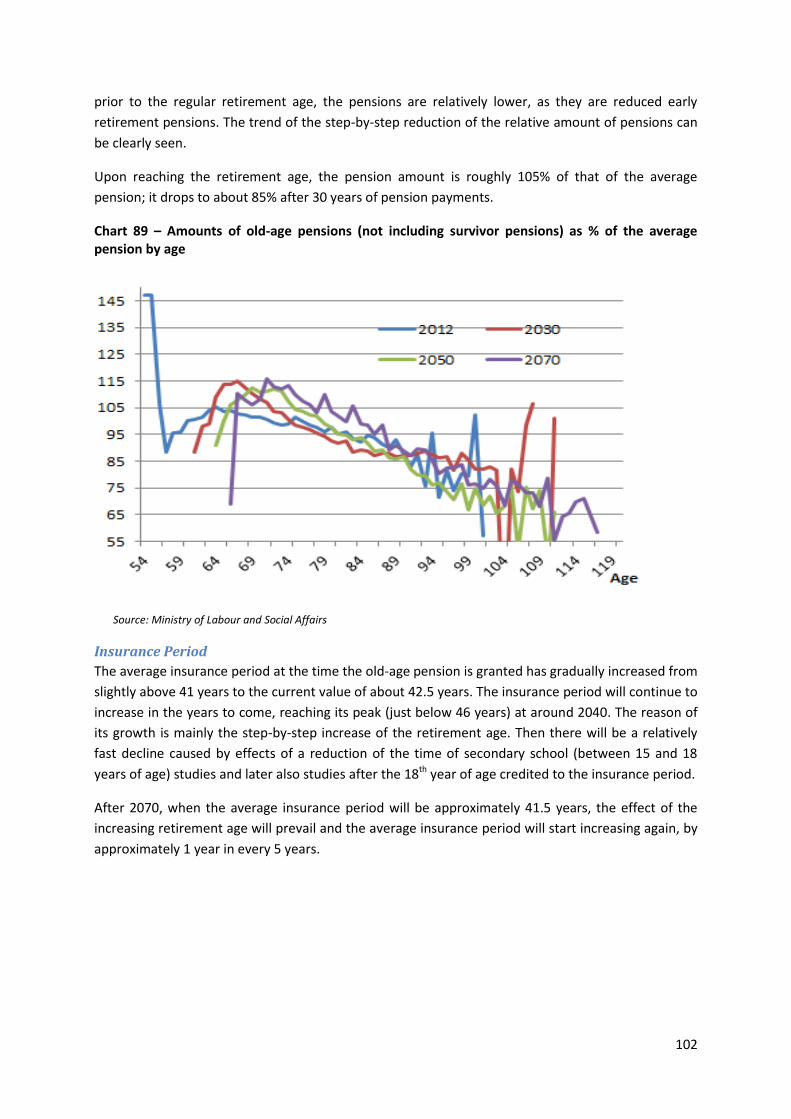
102
prior to the regular retirement age, the pensions are relatively lower, as they are reduced early
retirement pensions. The trend of the step-by-step reduction of the relative amount of pensions can
be clearly seen.
Upon reaching the retirement age, the pension amount is roughly 105% of that of the average
pension; it drops to about 85% after 30 years of pension payments.
Chart 89 – Amounts of old-age pensions (not including survivor pensions) as % of the average pension by age
Source: Ministry of Labour and Social Affairs
Insurance Period
The average insurance period at the time the old-age pension is granted has gradually increased from
slightly above 41 years to the current value of about 42.5 years. The insurance period will continue to
increase in the years to come, reaching its peak (just below 46 years) at around 2040. The reason of
its growth is mainly the step-by-step increase of the retirement age. Then there will be a relatively
fast decline caused by effects of a reduction of the time of secondary school (between 15 and 18
years of age) studies and later also studies after the 18th year of age credited to the insurance period.
After 2070, when the average insurance period will be approximately 41.5 years, the effect of the
increasing retirement age will prevail and the average insurance period will start increasing again, by
approximately 1 year in every 5 years.
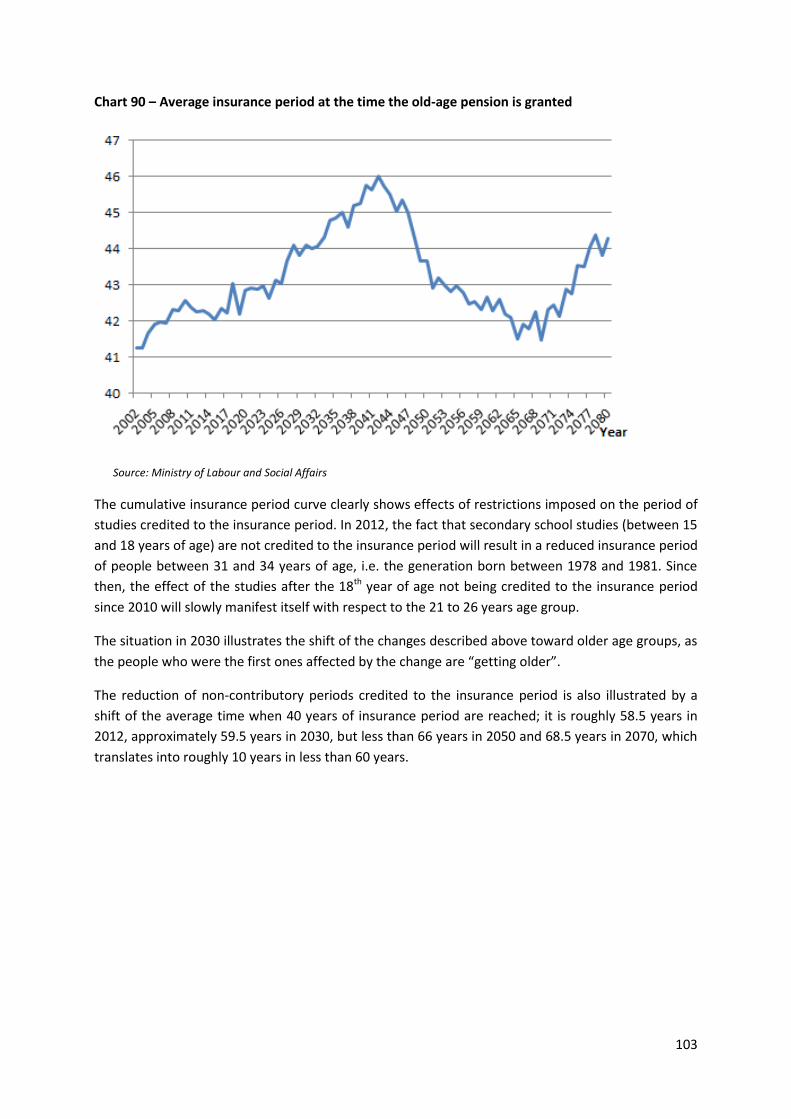
103
Chart 90 – Average insurance period at the time the old-age pension is granted
Source: Ministry of Labour and Social Affairs
The cumulative insurance period curve clearly shows effects of restrictions imposed on the period of
studies credited to the insurance period. In 2012, the fact that secondary school studies (between 15
and 18 years of age) are not credited to the insurance period will result in a reduced insurance period
of people between 31 and 34 years of age, i.e. the generation born between 1978 and 1981. Since
then, the effect of the studies after the 18th year of age not being credited to the insurance period
since 2010 will slowly manifest itself with respect to the 21 to 26 years age group.
The situation in 2030 illustrates the shift of the changes described above toward older age groups, as
the people who were the first ones affected by the change are “getting older”.
The reduction of non-contributory periods credited to the insurance period is also illustrated by a
shift of the average time when 40 years of insurance period are reached; it is roughly 58.5 years in
2012, approximately 59.5 years in 2030, but less than 66 years in 2050 and 68.5 years in 2070, which
translates into roughly 10 years in less than 60 years.
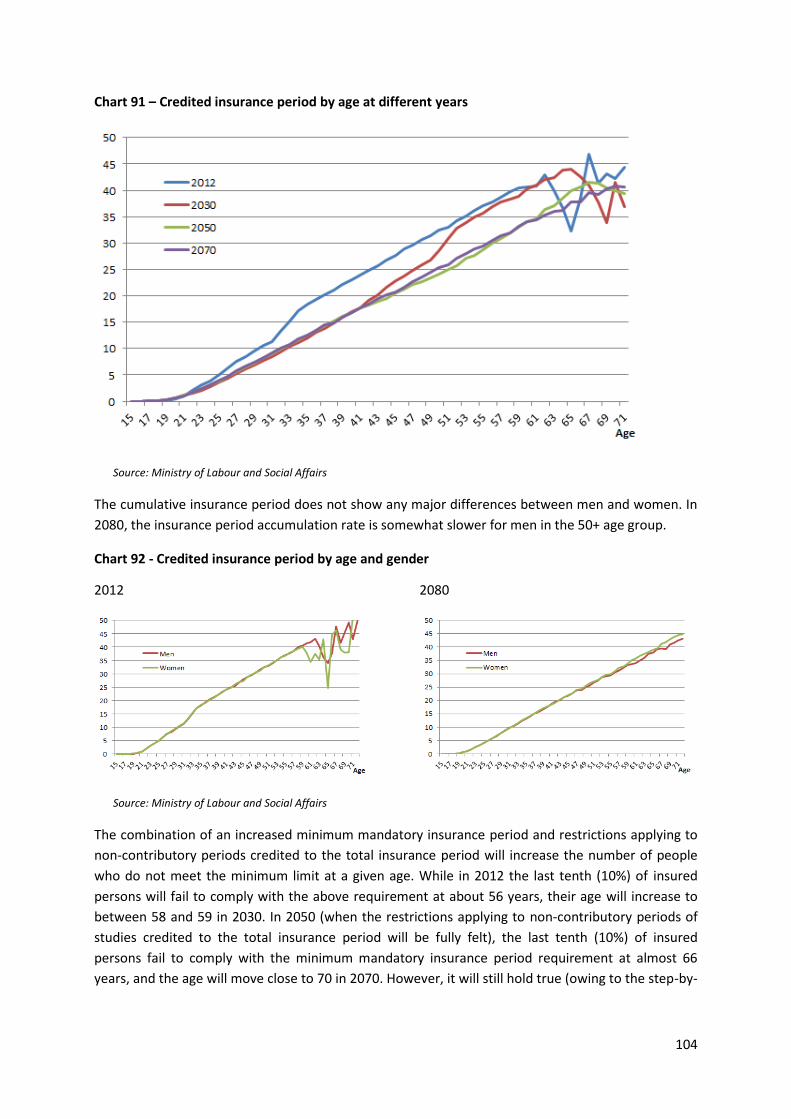
104
Chart 91 – Credited insurance period by age at different years
Source: Ministry of Labour and Social Affairs
The cumulative insurance period does not show any major differences between men and women. In
2080, the insurance period accumulation rate is somewhat slower for men in the 50+ age group.
Chart 92 - Credited insurance period by age and gender
2012
2080
Source: Ministry of Labour and Social Affairs
The combination of an increased minimum mandatory insurance period and restrictions applying to
non-contributory periods credited to the total insurance period will increase the number of people
who do not meet the minimum limit at a given age. While in 2012 the last tenth (10%) of insured
persons will fail to comply with the above requirement at about 56 years, their age will increase to
between 58 and 59 in 2030. In 2050 (when the restrictions applying to non-contributory periods of
studies credited to the total insurance period will be fully felt), the last tenth (10%) of insured
persons fail to comply with the minimum mandatory insurance period requirement at almost 66
years, and the age will move close to 70 in 2070. However, it will still hold true (owing to the step-by-
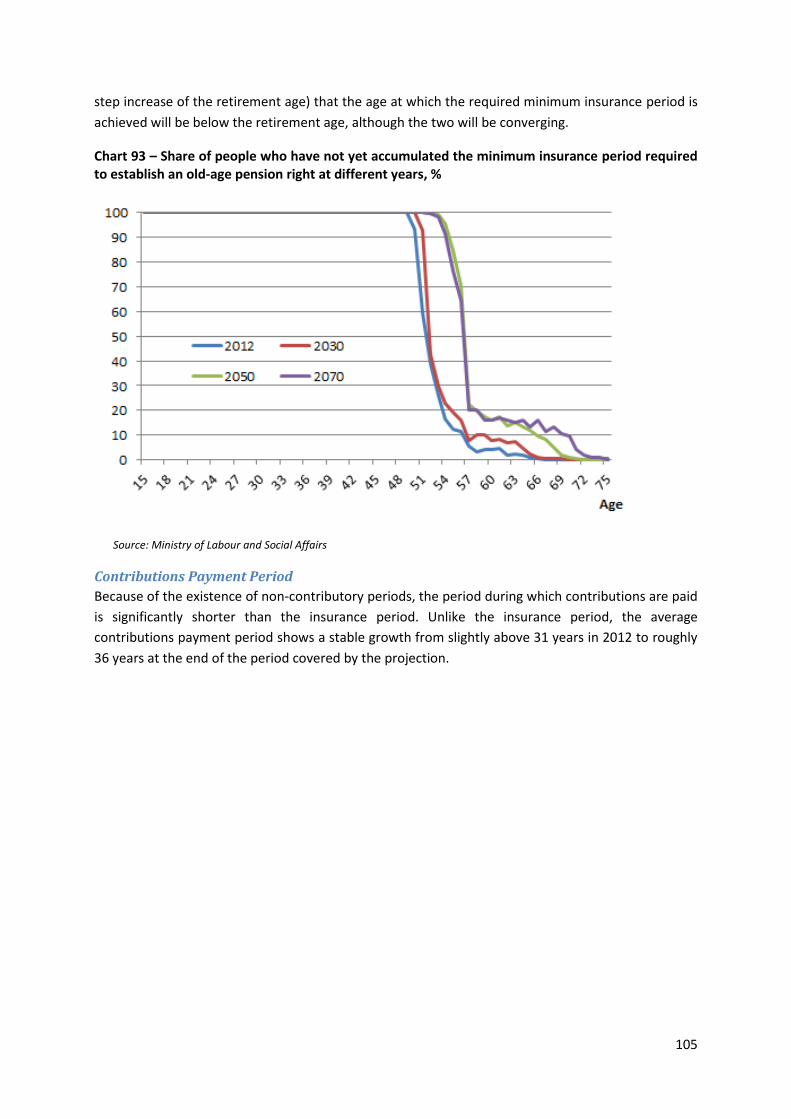
105
step increase of the retirement age) that the age at which the required minimum insurance period is
achieved will be below the retirement age, although the two will be converging.
Chart 93 – Share of people who have not yet accumulated the minimum insurance period required to establish an old-age pension right at different years, %
Source: Ministry of Labour and Social Affairs
Contributions Payment Period
Because of the existence of non-contributory periods, the period during which contributions are paid
is significantly shorter than the insurance period. Unlike the insurance period, the average
contributions payment period shows a stable growth from slightly above 31 years in 2012 to roughly
36 years at the end of the period covered by the projection.
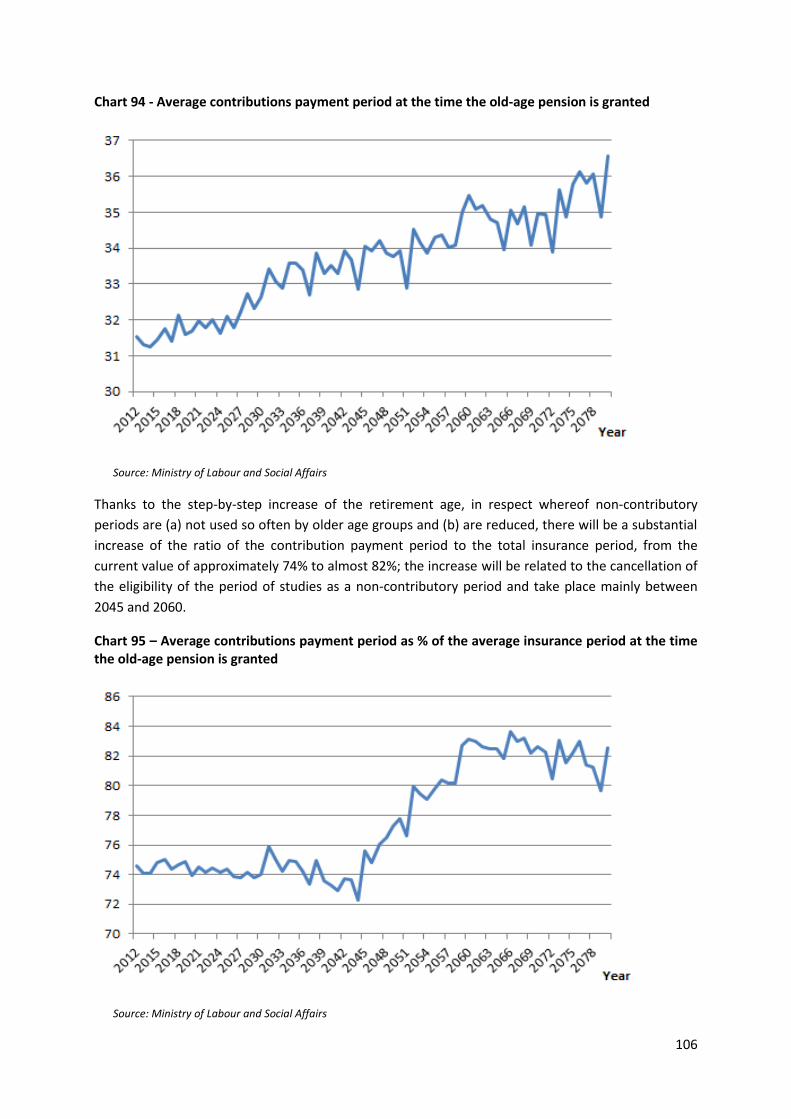
106
Chart 94 - Average contributions payment period at the time the old-age pension is granted
Source: Ministry of Labour and Social Affairs
Thanks to the step-by-step increase of the retirement age, in respect whereof non-contributory
periods are (a) not used so often by older age groups and (b) are reduced, there will be a substantial
increase of the ratio of the contribution payment period to the total insurance period, from the
current value of approximately 74% to almost 82%; the increase will be related to the cancellation of
the eligibility of the period of studies as a non-contributory period and take place mainly between
2045 and 2060.
Chart 95 – Average contributions payment period as % of the average insurance period at the time the old-age pension is granted
Source: Ministry of Labour and Social Affairs
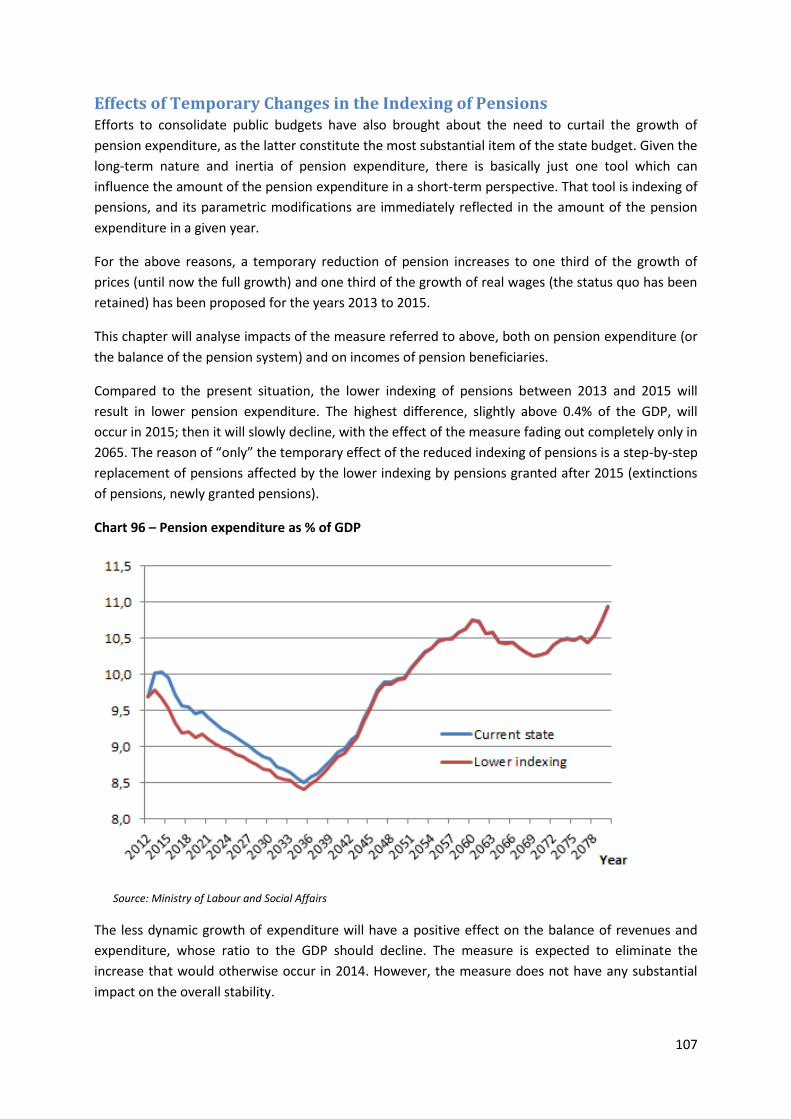
107
Effects of Temporary Changes in the Indexing of Pensions Efforts to consolidate public budgets have also brought about the need to curtail the growth of
pension expenditure, as the latter constitute the most substantial item of the state budget. Given the
long-term nature and inertia of pension expenditure, there is basically just one tool which can
influence the amount of the pension expenditure in a short-term perspective. That tool is indexing of
pensions, and its parametric modifications are immediately reflected in the amount of the pension
expenditure in a given year.
For the above reasons, a temporary reduction of pension increases to one third of the growth of
prices (until now the full growth) and one third of the growth of real wages (the status quo has been
retained) has been proposed for the years 2013 to 2015.
This chapter will analyse impacts of the measure referred to above, both on pension expenditure (or
the balance of the pension system) and on incomes of pension beneficiaries.
Compared to the present situation, the lower indexing of pensions between 2013 and 2015 will
result in lower pension expenditure. The highest difference, slightly above 0.4% of the GDP, will
occur in 2015; then it will slowly decline, with the effect of the measure fading out completely only in
2065. The reason of “only” the temporary effect of the reduced indexing of pensions is a step-by-step
replacement of pensions affected by the lower indexing by pensions granted after 2015 (extinctions
of pensions, newly granted pensions).
Chart 96 – Pension expenditure as % of GDP
Source: Ministry of Labour and Social Affairs
The less dynamic growth of expenditure will have a positive effect on the balance of revenues and
expenditure, whose ratio to the GDP should decline. The measure is expected to eliminate the
increase that would otherwise occur in 2014. However, the measure does not have any substantial
impact on the overall stability.
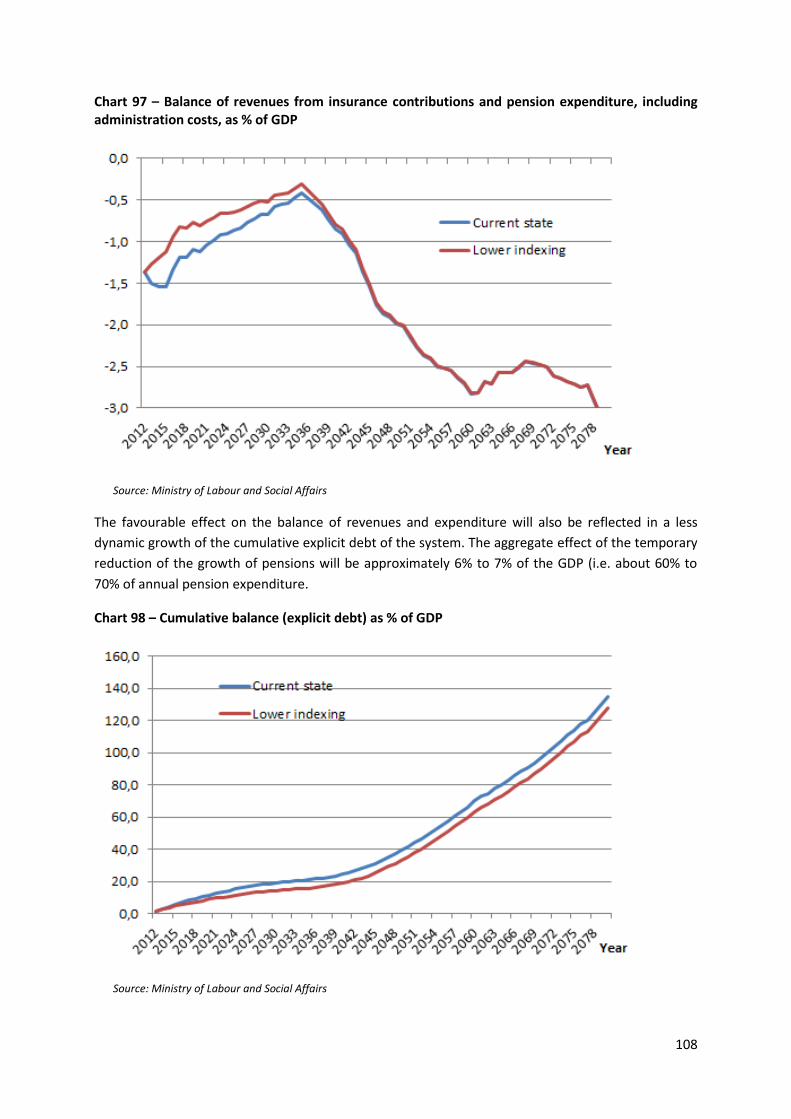
108
Chart 97 – Balance of revenues from insurance contributions and pension expenditure, including administration costs, as % of GDP
Source: Ministry of Labour and Social Affairs
The favourable effect on the balance of revenues and expenditure will also be reflected in a less
dynamic growth of the cumulative explicit debt of the system. The aggregate effect of the temporary
reduction of the growth of pensions will be approximately 6% to 7% of the GDP (i.e. about 60% to
70% of annual pension expenditure.
Chart 98 – Cumulative balance (explicit debt) as % of GDP
Source: Ministry of Labour and Social Affairs
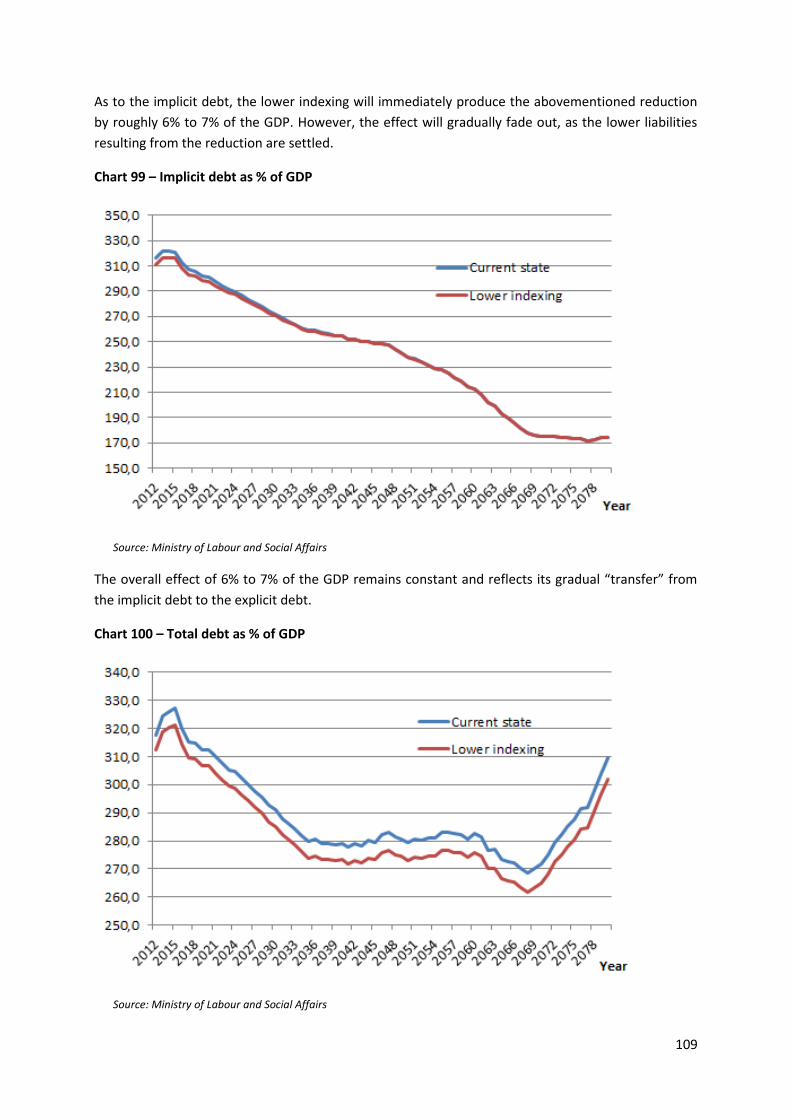
109
As to the implicit debt, the lower indexing will immediately produce the abovementioned reduction
by roughly 6% to 7% of the GDP. However, the effect will gradually fade out, as the lower liabilities
resulting from the reduction are settled.
Chart 99 – Implicit debt as % of GDP
Source: Ministry of Labour and Social Affairs
The overall effect of 6% to 7% of the GDP remains constant and reflects its gradual “transfer” from
the implicit debt to the explicit debt.
Chart 100 – Total debt as % of GDP
Source: Ministry of Labour and Social Affairs
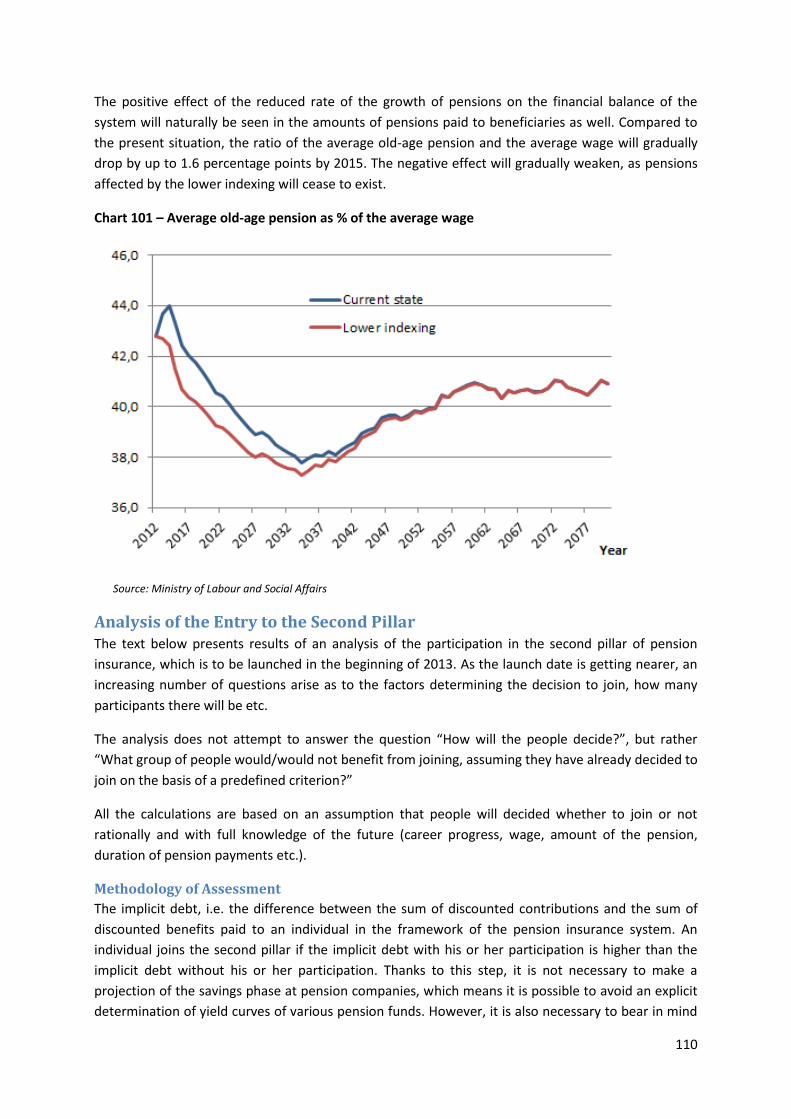
110
The positive effect of the reduced rate of the growth of pensions on the financial balance of the
system will naturally be seen in the amounts of pensions paid to beneficiaries as well. Compared to
the present situation, the ratio of the average old-age pension and the average wage will gradually
drop by up to 1.6 percentage points by 2015. The negative effect will gradually weaken, as pensions
affected by the lower indexing will cease to exist.
Chart 101 – Average old-age pension as % of the average wage
Source: Ministry of Labour and Social Affairs
Analysis of the Entry to the Second Pillar The text below presents results of an analysis of the participation in the second pillar of pension
insurance, which is to be launched in the beginning of 2013. As the launch date is getting nearer, an
increasing number of questions arise as to the factors determining the decision to join, how many
participants there will be etc.
The analysis does not attempt to answer the question “How will the people decide?”, but rather
“What group of people would/would not benefit from joining, assuming they have already decided to
join on the basis of a predefined criterion?”
All the calculations are based on an assumption that people will decided whether to join or not
rationally and with full knowledge of the future (career progress, wage, amount of the pension,
duration of pension payments etc.).
Methodology of Assessment
The implicit debt, i.e. the difference between the sum of discounted contributions and the sum of
discounted benefits paid to an individual in the framework of the pension insurance system. An
individual joins the second pillar if the implicit debt with his or her participation is higher than the
implicit debt without his or her participation. Thanks to this step, it is not necessary to make a
projection of the savings phase at pension companies, which means it is possible to avoid an explicit
determination of yield curves of various pension funds. However, it is also necessary to bear in mind
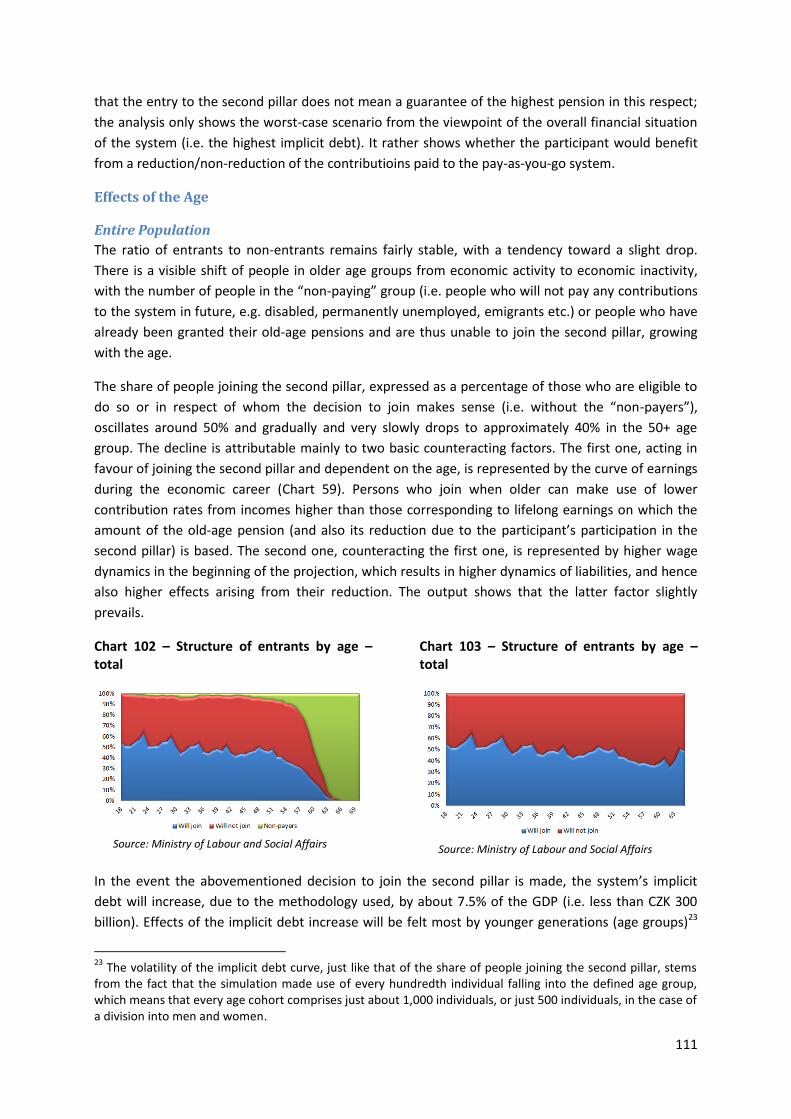
111
that the entry to the second pillar does not mean a guarantee of the highest pension in this respect;
the analysis only shows the worst-case scenario from the viewpoint of the overall financial situation
of the system (i.e. the highest implicit debt). It rather shows whether the participant would benefit
from a reduction/non-reduction of the contributioins paid to the pay-as-you-go system.
Effects of the Age
Entire Population
The ratio of entrants to non-entrants remains fairly stable, with a tendency toward a slight drop.
There is a visible shift of people in older age groups from economic activity to economic inactivity,
with the number of people in the “non-paying” group (i.e. people who will not pay any contributions
to the system in future, e.g. disabled, permanently unemployed, emigrants etc.) or people who have
already been granted their old-age pensions and are thus unable to join the second pillar, growing
with the age.
The share of people joining the second pillar, expressed as a percentage of those who are eligible to
do so or in respect of whom the decision to join makes sense (i.e. without the “non-payers”),
oscillates around 50% and gradually and very slowly drops to approximately 40% in the 50+ age
group. The decline is attributable mainly to two basic counteracting factors. The first one, acting in
favour of joining the second pillar and dependent on the age, is represented by the curve of earnings
during the economic career (Chart 59). Persons who join when older can make use of lower
contribution rates from incomes higher than those corresponding to lifelong earnings on which the
amount of the old-age pension (and also its reduction due to the participant’s participation in the
second pillar) is based. The second one, counteracting the first one, is represented by higher wage
dynamics in the beginning of the projection, which results in higher dynamics of liabilities, and hence
also higher effects arising from their reduction. The output shows that the latter factor slightly
prevails.
Chart 102 – Structure of entrants by age – total
Source: Ministry of Labour and Social Affairs
Chart 103 – Structure of entrants by age – total
Source: Ministry of Labour and Social Affairs
In the event the abovementioned decision to join the second pillar is made, the system’s implicit
debt will increase, due to the methodology used, by about 7.5% of the GDP (i.e. less than CZK 300
billion). Effects of the implicit debt increase will be felt most by younger generations (age groups)23
23
The volatility of the implicit debt curve, just like that of the share of people joining the second pillar, stems from the fact that the simulation made use of every hundredth individual falling into the defined age group, which means that every age cohort comprises just about 1,000 individuals, or just 500 individuals, in the case of a division into men and women.
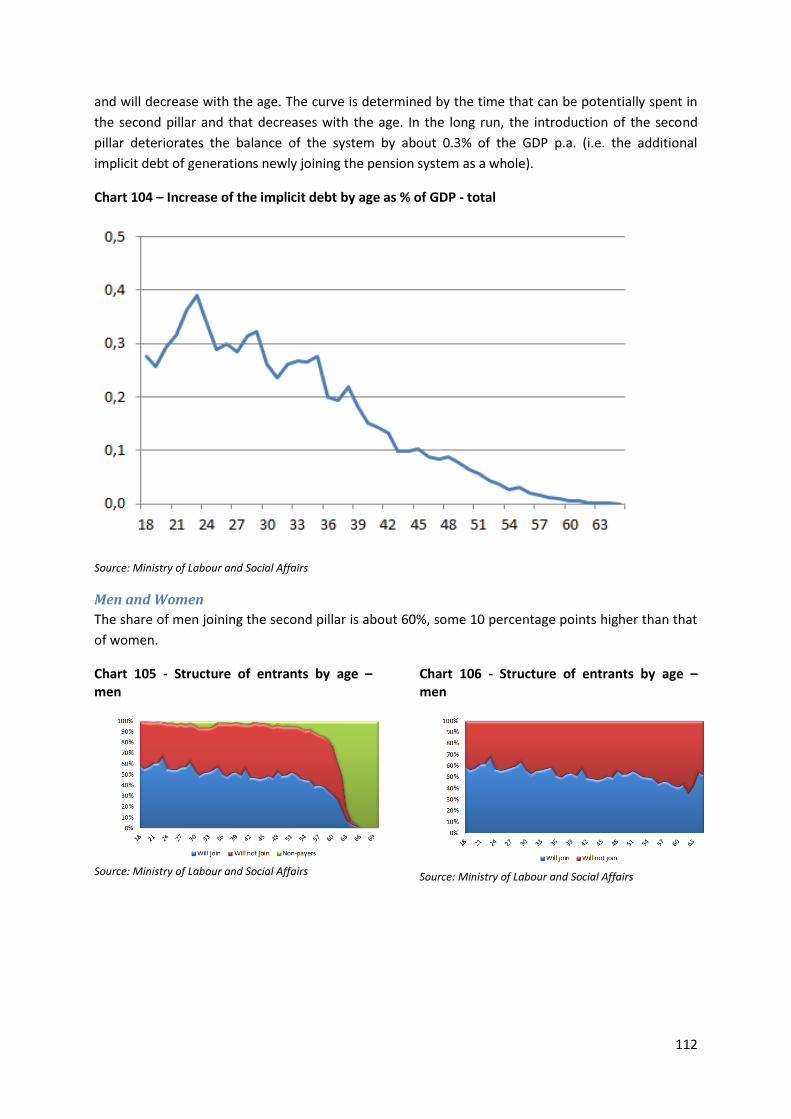
112
and will decrease with the age. The curve is determined by the time that can be potentially spent in
the second pillar and that decreases with the age. In the long run, the introduction of the second
pillar deteriorates the balance of the system by about 0.3% of the GDP p.a. (i.e. the additional
implicit debt of generations newly joining the pension system as a whole).
Chart 104 – Increase of the implicit debt by age as % of GDP - total
Source: Ministry of Labour and Social Affairs
Men and Women
The share of men joining the second pillar is about 60%, some 10 percentage points higher than that
of women.
Chart 105 - Structure of entrants by age – men
Source: Ministry of Labour and Social Affairs
Chart 106 - Structure of entrants by age – men
Source: Ministry of Labour and Social Affairs
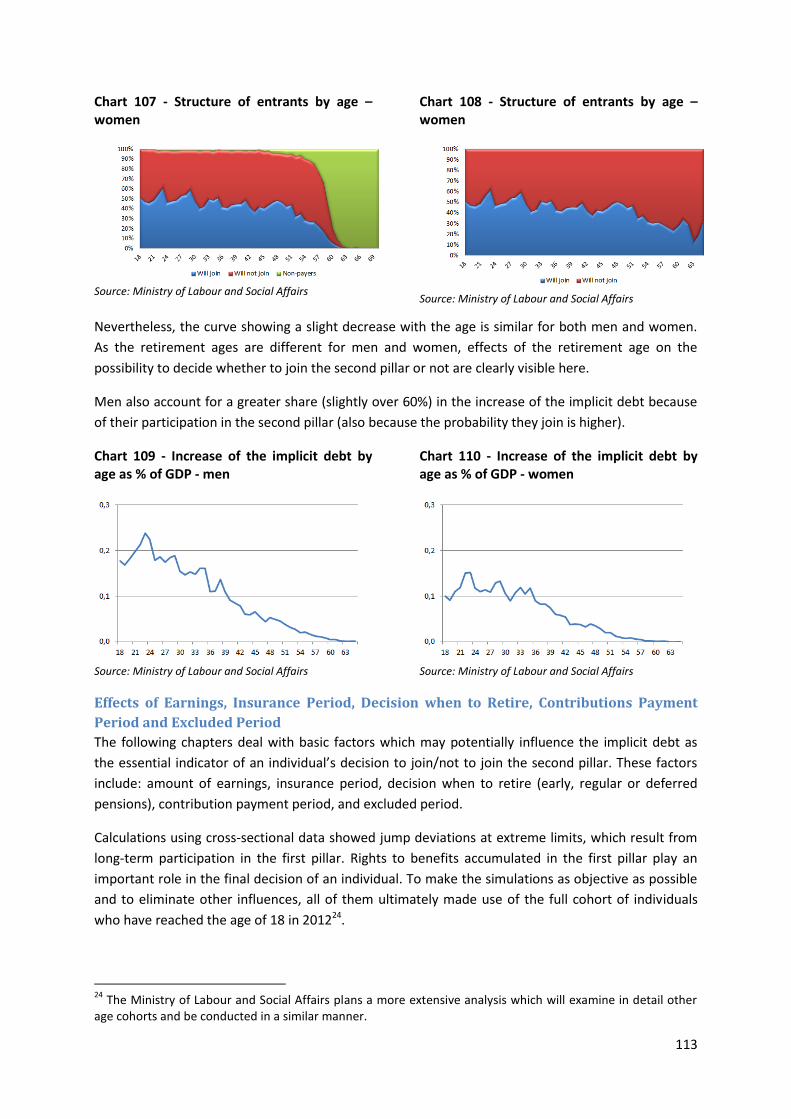
113
Chart 107 - Structure of entrants by age – women
Source: Ministry of Labour and Social Affairs
Chart 108 - Structure of entrants by age – women
Source: Ministry of Labour and Social Affairs
Nevertheless, the curve showing a slight decrease with the age is similar for both men and women.
As the retirement ages are different for men and women, effects of the retirement age on the
possibility to decide whether to join the second pillar or not are clearly visible here.
Men also account for a greater share (slightly over 60%) in the increase of the implicit debt because
of their participation in the second pillar (also because the probability they join is higher).
Chart 109 - Increase of the implicit debt by age as % of GDP - men
Source: Ministry of Labour and Social Affairs
Chart 110 - Increase of the implicit debt by age as % of GDP - women
Source: Ministry of Labour and Social Affairs
Effects of Earnings, Insurance Period, Decision when to Retire, Contributions Payment
Period and Excluded Period
The following chapters deal with basic factors which may potentially influence the implicit debt as
the essential indicator of an individual’s decision to join/not to join the second pillar. These factors
include: amount of earnings, insurance period, decision when to retire (early, regular or deferred
pensions), contribution payment period, and excluded period.
Calculations using cross-sectional data showed jump deviations at extreme limits, which result from
long-term participation in the first pillar. Rights to benefits accumulated in the first pillar play an
important role in the final decision of an individual. To make the simulations as objective as possible
and to eliminate other influences, all of them ultimately made use of the full cohort of individuals
who have reached the age of 18 in 201224.
24
The Ministry of Labour and Social Affairs plans a more extensive analysis which will examine in detail other age cohorts and be conducted in a similar manner.
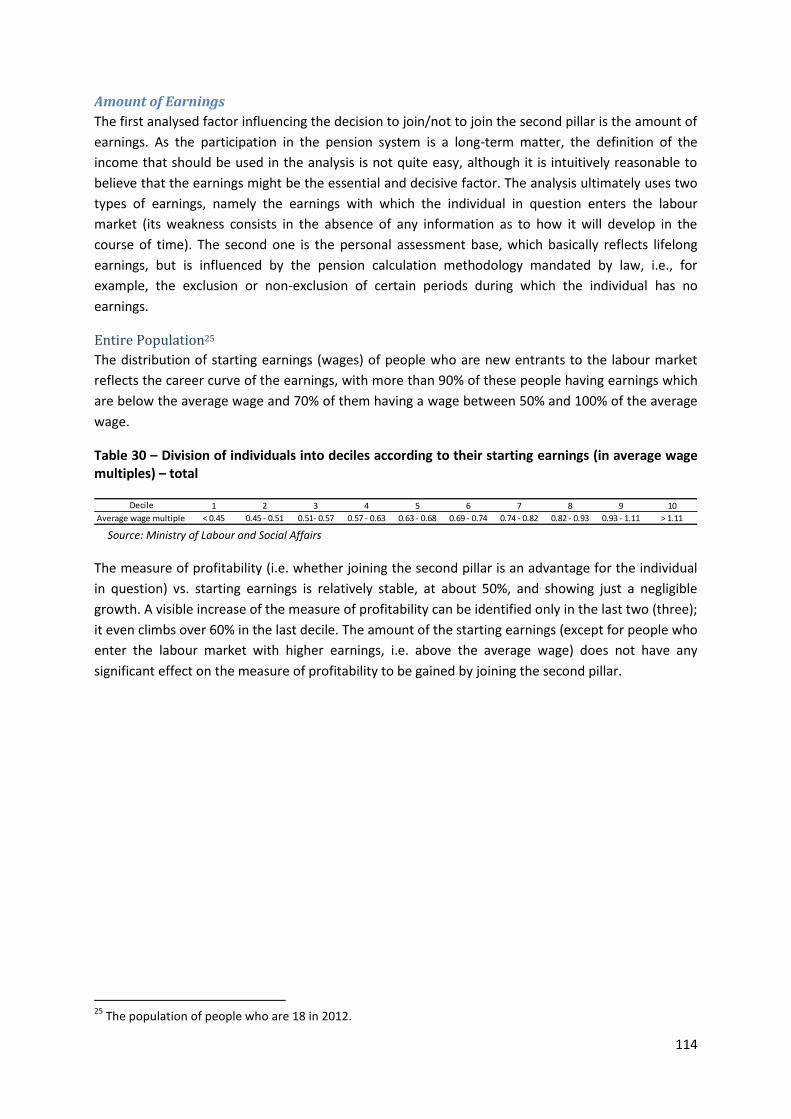
114
Amount of Earnings
The first analysed factor influencing the decision to join/not to join the second pillar is the amount of
earnings. As the participation in the pension system is a long-term matter, the definition of the
income that should be used in the analysis is not quite easy, although it is intuitively reasonable to
believe that the earnings might be the essential and decisive factor. The analysis ultimately uses two
types of earnings, namely the earnings with which the individual in question enters the labour
market (its weakness consists in the absence of any information as to how it will develop in the
course of time). The second one is the personal assessment base, which basically reflects lifelong
earnings, but is influenced by the pension calculation methodology mandated by law, i.e., for
example, the exclusion or non-exclusion of certain periods during which the individual has no
earnings.
Entire Population25
The distribution of starting earnings (wages) of people who are new entrants to the labour market
reflects the career curve of the earnings, with more than 90% of these people having earnings which
are below the average wage and 70% of them having a wage between 50% and 100% of the average
wage.
Table 30 – Division of individuals into deciles according to their starting earnings (in average wage multiples) – total
Source: Ministry of Labour and Social Affairs
The measure of profitability (i.e. whether joining the second pillar is an advantage for the individual
in question) vs. starting earnings is relatively stable, at about 50%, and showing just a negligible
growth. A visible increase of the measure of profitability can be identified only in the last two (three);
it even climbs over 60% in the last decile. The amount of the starting earnings (except for people who
enter the labour market with higher earnings, i.e. above the average wage) does not have any
significant effect on the measure of profitability to be gained by joining the second pillar.
25
The population of people who are 18 in 2012.
1 2 3 4 5 6 7 8 9 10
< 0.45 0.45 - 0.51 0.51- 0.57 0.57 - 0.63 0.63 - 0.68 0.69 - 0.74 0.74 - 0.82 0.82 - 0.93 0.93 - 1.11 > 1.11
Decile
Average wage multiple
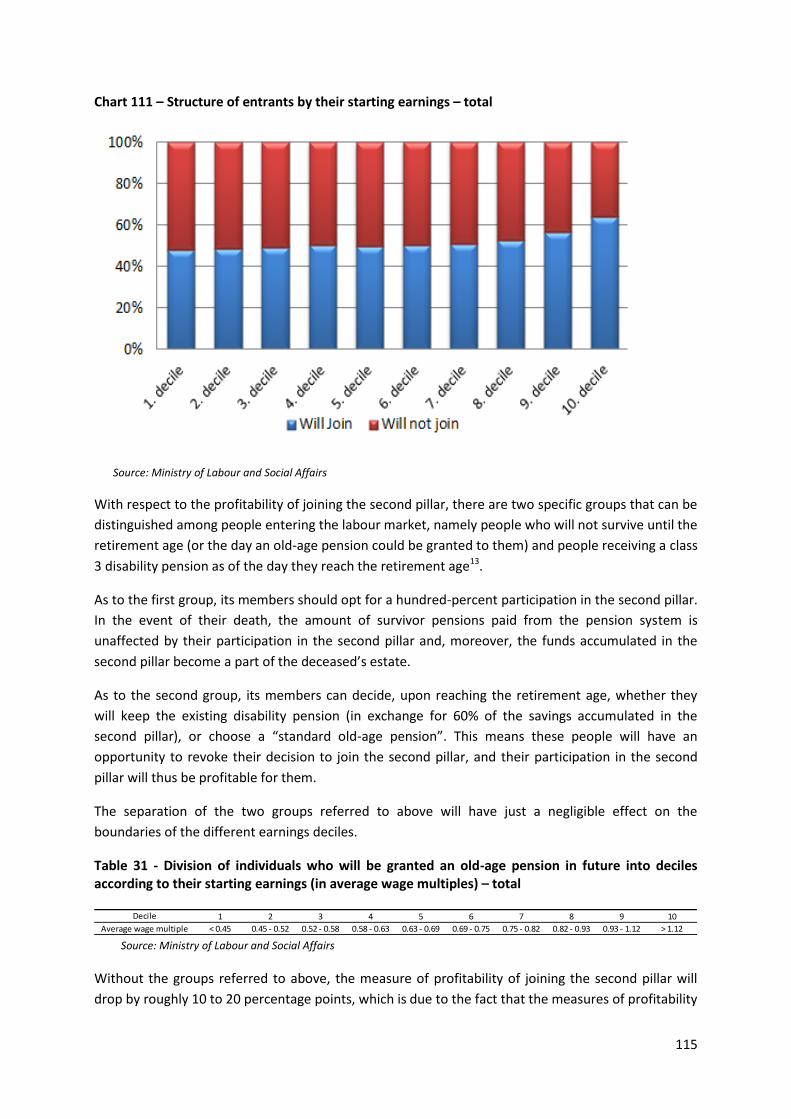
115
Chart 111 – Structure of entrants by their starting earnings – total
Source: Ministry of Labour and Social Affairs
With respect to the profitability of joining the second pillar, there are two specific groups that can be
distinguished among people entering the labour market, namely people who will not survive until the
retirement age (or the day an old-age pension could be granted to them) and people receiving a class
3 disability pension as of the day they reach the retirement age13.
As to the first group, its members should opt for a hundred-percent participation in the second pillar.
In the event of their death, the amount of survivor pensions paid from the pension system is
unaffected by their participation in the second pillar and, moreover, the funds accumulated in the
second pillar become a part of the deceased’s estate.
As to the second group, its members can decide, upon reaching the retirement age, whether they
will keep the existing disability pension (in exchange for 60% of the savings accumulated in the
second pillar), or choose a “standard old-age pension”. This means these people will have an
opportunity to revoke their decision to join the second pillar, and their participation in the second
pillar will thus be profitable for them.
The separation of the two groups referred to above will have just a negligible effect on the
boundaries of the different earnings deciles.
Table 31 - Division of individuals who will be granted an old-age pension in future into deciles according to their starting earnings (in average wage multiples) – total
Source: Ministry of Labour and Social Affairs
Without the groups referred to above, the measure of profitability of joining the second pillar will
drop by roughly 10 to 20 percentage points, which is due to the fact that the measures of profitability
1 2 3 4 5 6 7 8 9 10
< 0.45 0.45 - 0.52 0.52 - 0.58 0.58 - 0.63 0.63 - 0.69 0.69 - 0.75 0.75 - 0.82 0.82 - 0.93 0.93 - 1.12 > 1.12
Decile
Average wage multiple
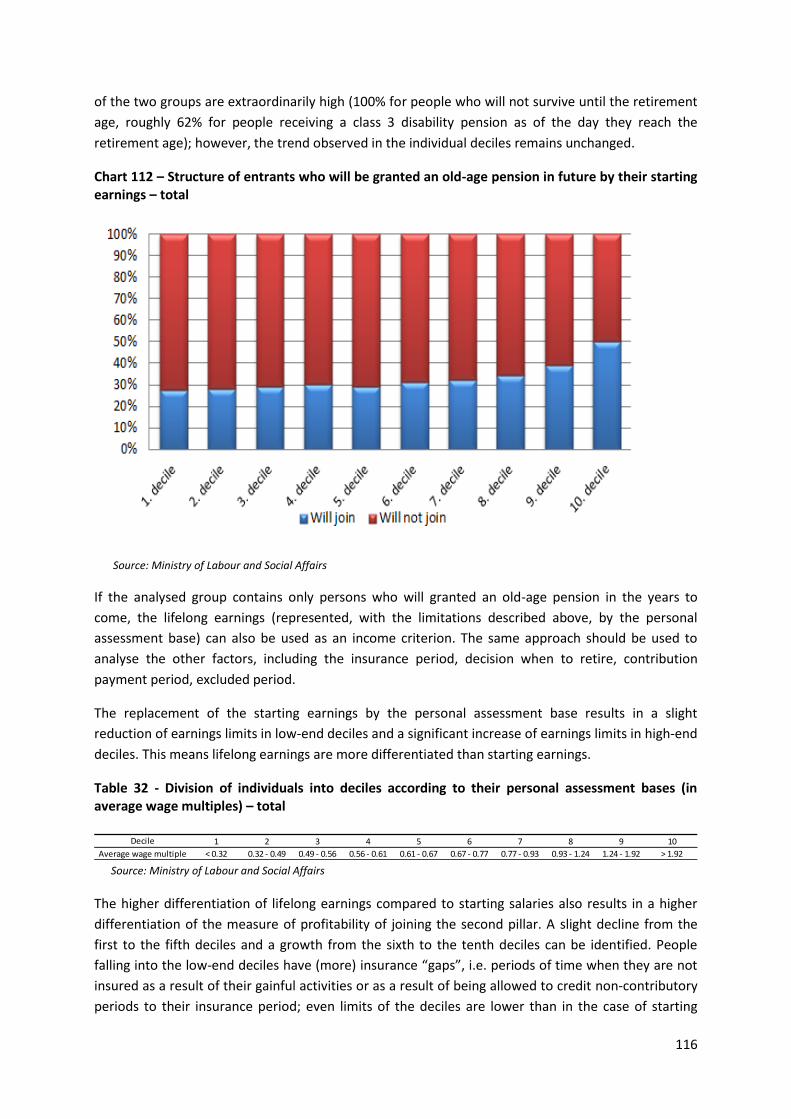
116
of the two groups are extraordinarily high (100% for people who will not survive until the retirement
age, roughly 62% for people receiving a class 3 disability pension as of the day they reach the
retirement age); however, the trend observed in the individual deciles remains unchanged.
Chart 112 – Structure of entrants who will be granted an old-age pension in future by their starting earnings – total
Source: Ministry of Labour and Social Affairs
If the analysed group contains only persons who will granted an old-age pension in the years to
come, the lifelong earnings (represented, with the limitations described above, by the personal
assessment base) can also be used as an income criterion. The same approach should be used to
analyse the other factors, including the insurance period, decision when to retire, contribution
payment period, excluded period.
The replacement of the starting earnings by the personal assessment base results in a slight
reduction of earnings limits in low-end deciles and a significant increase of earnings limits in high-end
deciles. This means lifelong earnings are more differentiated than starting earnings.
Table 32 - Division of individuals into deciles according to their personal assessment bases (in average wage multiples) – total
Source: Ministry of Labour and Social Affairs
The higher differentiation of lifelong earnings compared to starting salaries also results in a higher
differentiation of the measure of profitability of joining the second pillar. A slight decline from the
first to the fifth deciles and a growth from the sixth to the tenth deciles can be identified. People
falling into the low-end deciles have (more) insurance “gaps”, i.e. periods of time when they are not
insured as a result of their gainful activities or as a result of being allowed to credit non-contributory
periods to their insurance period; even limits of the deciles are lower than in the case of starting
1 2 3 4 5 6 7 8 9 10
< 0.32 0.32 - 0.49 0.49 - 0.56 0.56 - 0.61 0.61 - 0.67 0.67 - 0.77 0.77 - 0.93 0.93 - 1.24 1.24 - 1.92 > 1.92
Decile
Average wage multiple
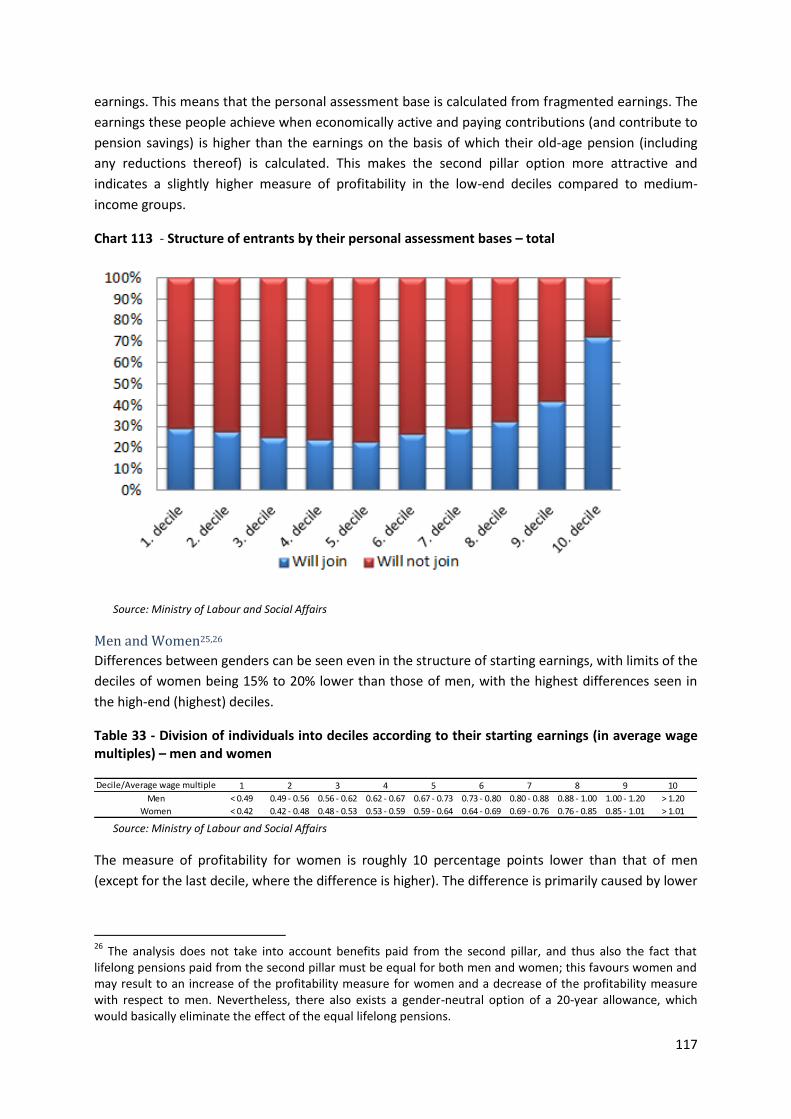
117
earnings. This means that the personal assessment base is calculated from fragmented earnings. The
earnings these people achieve when economically active and paying contributions (and contribute to
pension savings) is higher than the earnings on the basis of which their old-age pension (including
any reductions thereof) is calculated. This makes the second pillar option more attractive and
indicates a slightly higher measure of profitability in the low-end deciles compared to medium-
income groups.
Chart 113 - Structure of entrants by their personal assessment bases – total
Source: Ministry of Labour and Social Affairs
Men and Women25,26
Differences between genders can be seen even in the structure of starting earnings, with limits of the
deciles of women being 15% to 20% lower than those of men, with the highest differences seen in
the high-end (highest) deciles.
Table 33 - Division of individuals into deciles according to their starting earnings (in average wage multiples) – men and women
Source: Ministry of Labour and Social Affairs
The measure of profitability for women is roughly 10 percentage points lower than that of men
(except for the last decile, where the difference is higher). The difference is primarily caused by lower
26
The analysis does not take into account benefits paid from the second pillar, and thus also the fact that lifelong pensions paid from the second pillar must be equal for both men and women; this favours women and may result to an increase of the profitability measure for women and a decrease of the profitability measure with respect to men. Nevertheless, there also exists a gender-neutral option of a 20-year allowance, which would basically eliminate the effect of the equal lifelong pensions.
1 2 3 4 5 6 7 8 9 10
Men < 0.49 0.49 - 0.56 0.56 - 0.62 0.62 - 0.67 0.67 - 0.73 0.73 - 0.80 0.80 - 0.88 0.88 - 1.00 1.00 - 1.20 > 1.20
< 0.42 0.42 - 0.48 0.48 - 0.53 0.53 - 0.59 0.59 - 0.64 0.64 - 0.69 0.69 - 0.76 0.76 - 0.85 0.85 - 1.01 > 1.01
Decile/Average wage multiple
Women
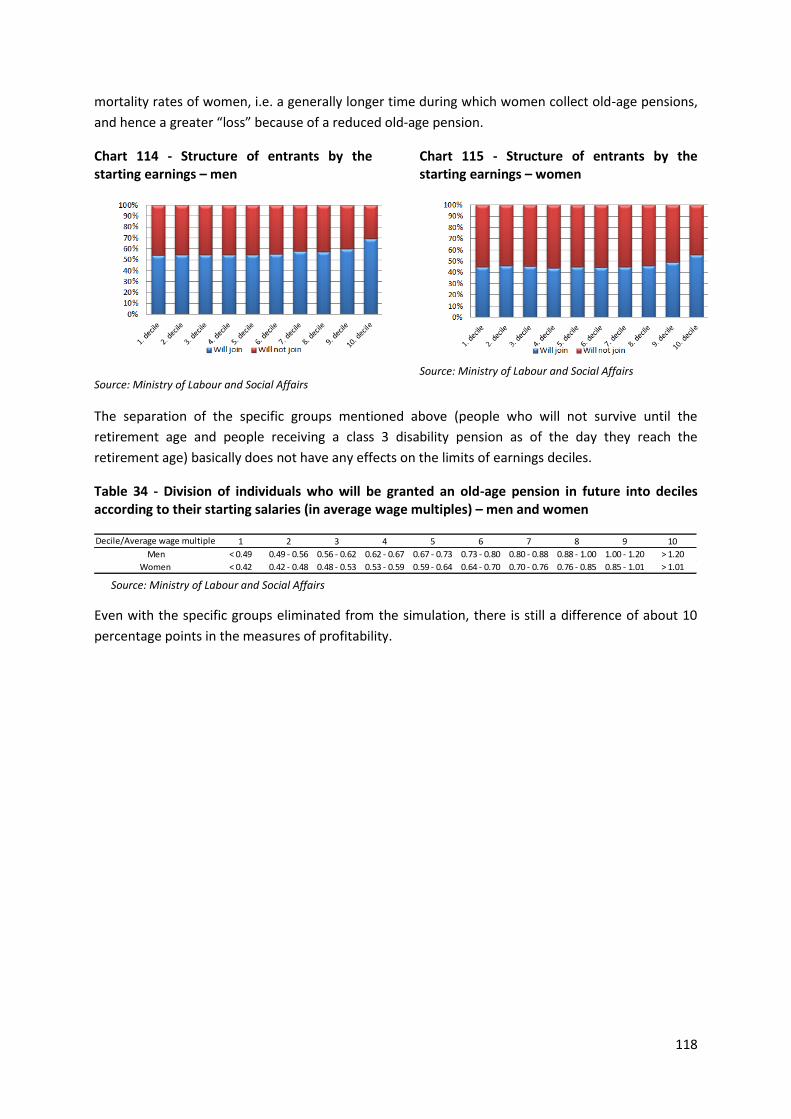
118
mortality rates of women, i.e. a generally longer time during which women collect old-age pensions,
and hence a greater “loss” because of a reduced old-age pension.
Chart 114 - Structure of entrants by the starting earnings – men
Source: Ministry of Labour and Social Affairs
Chart 115 - Structure of entrants by the starting earnings – women
Source: Ministry of Labour and Social Affairs
The separation of the specific groups mentioned above (people who will not survive until the
retirement age and people receiving a class 3 disability pension as of the day they reach the
retirement age) basically does not have any effects on the limits of earnings deciles.
Table 34 - Division of individuals who will be granted an old-age pension in future into deciles according to their starting salaries (in average wage multiples) – men and women
Source: Ministry of Labour and Social Affairs
Even with the specific groups eliminated from the simulation, there is still a difference of about 10
percentage points in the measures of profitability.
1 2 3 4 5 6 7 8 9 10
Men < 0.49 0.49 - 0.56 0.56 - 0.62 0.62 - 0.67 0.67 - 0.73 0.73 - 0.80 0.80 - 0.88 0.88 - 1.00 1.00 - 1.20 > 1.20
< 0.42 0.42 - 0.48 0.48 - 0.53 0.53 - 0.59 0.59 - 0.64 0.64 - 0.70 0.70 - 0.76 0.76 - 0.85 0.85 - 1.01 > 1.01
Decile/Average wage multiple
Women
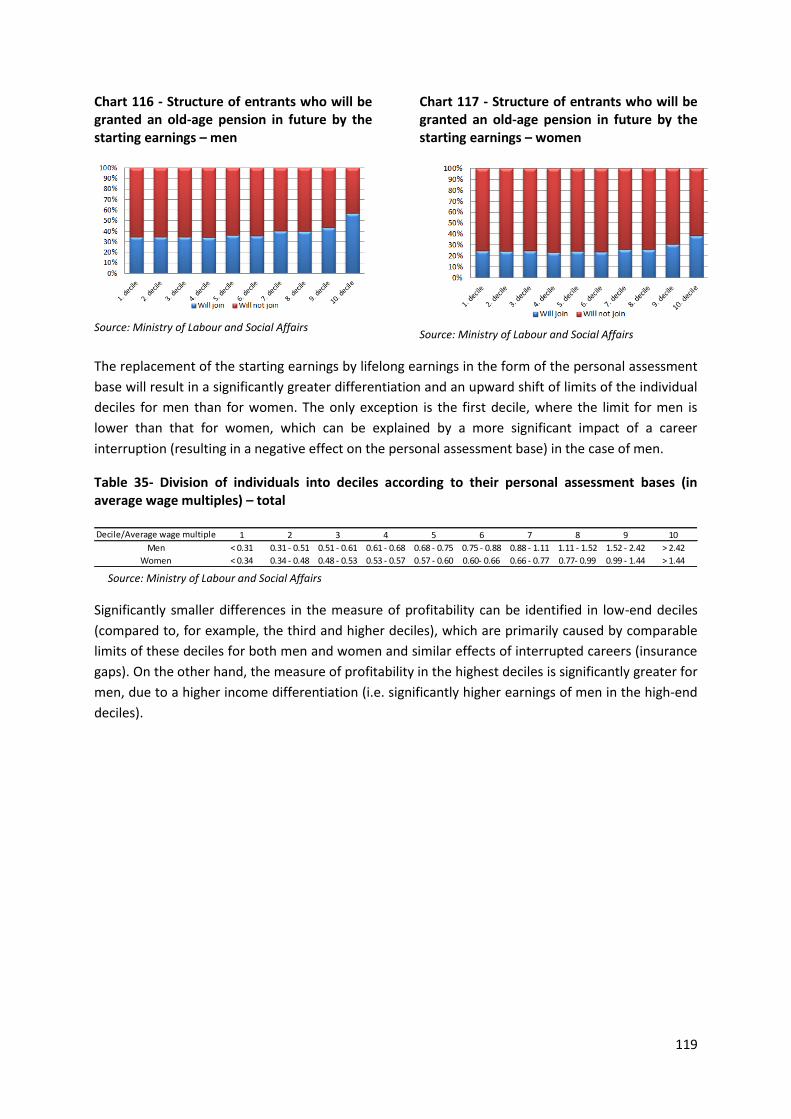
119
Chart 116 - Structure of entrants who will be granted an old-age pension in future by the starting earnings – men
Source: Ministry of Labour and Social Affairs
Chart 117 - Structure of entrants who will be granted an old-age pension in future by the starting earnings – women
Source: Ministry of Labour and Social Affairs
The replacement of the starting earnings by lifelong earnings in the form of the personal assessment
base will result in a significantly greater differentiation and an upward shift of limits of the individual
deciles for men than for women. The only exception is the first decile, where the limit for men is
lower than that for women, which can be explained by a more significant impact of a career
interruption (resulting in a negative effect on the personal assessment base) in the case of men.
Table 35- Division of individuals into deciles according to their personal assessment bases (in average wage multiples) – total
Source: Ministry of Labour and Social Affairs
Significantly smaller differences in the measure of profitability can be identified in low-end deciles
(compared to, for example, the third and higher deciles), which are primarily caused by comparable
limits of these deciles for both men and women and similar effects of interrupted careers (insurance
gaps). On the other hand, the measure of profitability in the highest deciles is significantly greater for
men, due to a higher income differentiation (i.e. significantly higher earnings of men in the high-end
deciles).
1 2 3 4 5 6 7 8 9 10
Men < 0.31 0.31 - 0.51 0.51 - 0.61 0.61 - 0.68 0.68 - 0.75 0.75 - 0.88 0.88 - 1.11 1.11 - 1.52 1.52 - 2.42 > 2.42
< 0.34 0.34 - 0.48 0.48 - 0.53 0.53 - 0.57 0.57 - 0.60 0.60- 0.66 0.66 - 0.77 0.77- 0.99 0.99 - 1.44 > 1.44
Decile/Average wage multiple
Women
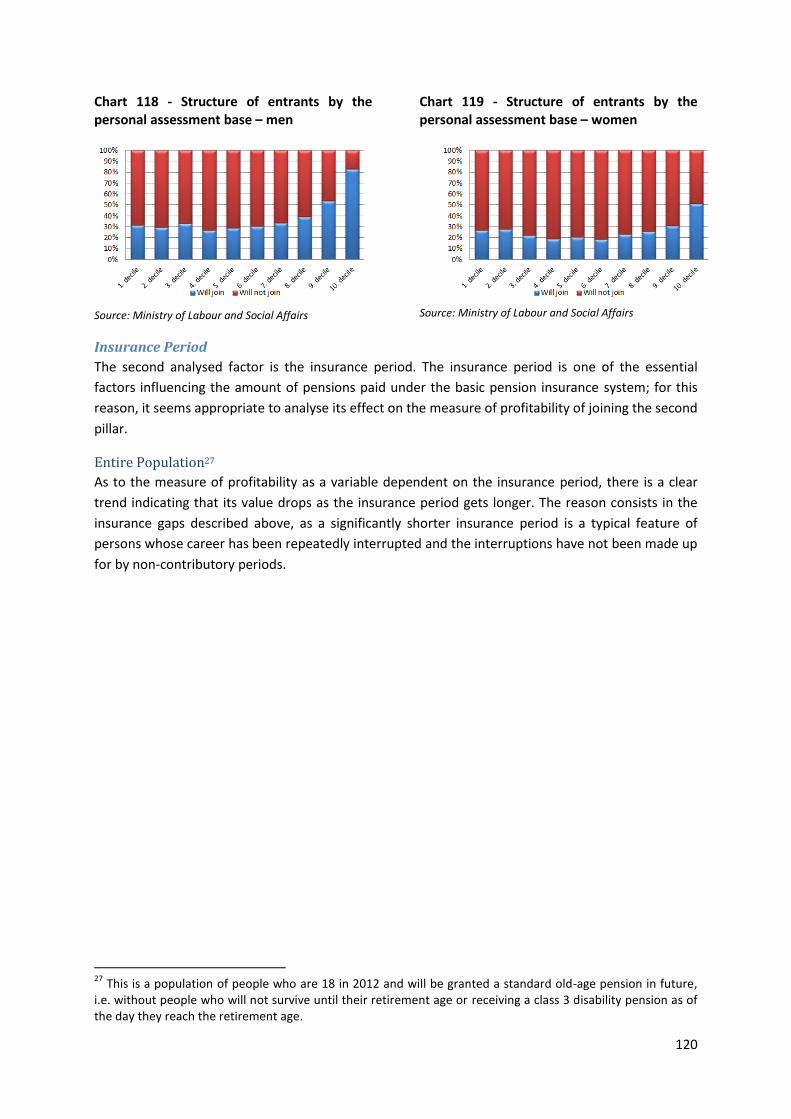
120
Chart 118 - Structure of entrants by the personal assessment base – men
Source: Ministry of Labour and Social Affairs
Chart 119 - Structure of entrants by the personal assessment base – women
Source: Ministry of Labour and Social Affairs
Insurance Period
The second analysed factor is the insurance period. The insurance period is one of the essential
factors influencing the amount of pensions paid under the basic pension insurance system; for this
reason, it seems appropriate to analyse its effect on the measure of profitability of joining the second
pillar.
Entire Population27
As to the measure of profitability as a variable dependent on the insurance period, there is a clear
trend indicating that its value drops as the insurance period gets longer. The reason consists in the
insurance gaps described above, as a significantly shorter insurance period is a typical feature of
persons whose career has been repeatedly interrupted and the interruptions have not been made up
for by non-contributory periods.
27
This is a population of people who are 18 in 2012 and will be granted a standard old-age pension in future, i.e. without people who will not survive until their retirement age or receiving a class 3 disability pension as of the day they reach the retirement age.
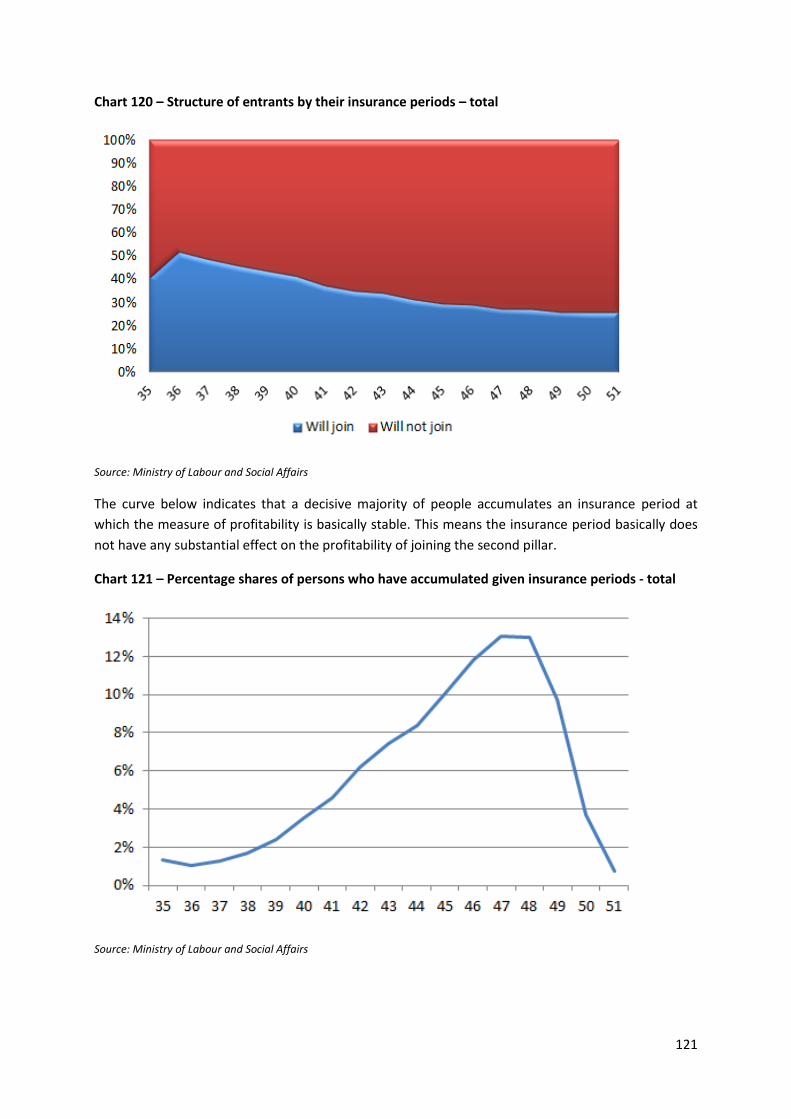
121
Chart 120 – Structure of entrants by their insurance periods – total
Source: Ministry of Labour and Social Affairs
The curve below indicates that a decisive majority of people accumulates an insurance period at
which the measure of profitability is basically stable. This means the insurance period basically does
not have any substantial effect on the profitability of joining the second pillar.
Chart 121 – Percentage shares of persons who have accumulated given insurance periods - total
Source: Ministry of Labour and Social Affairs
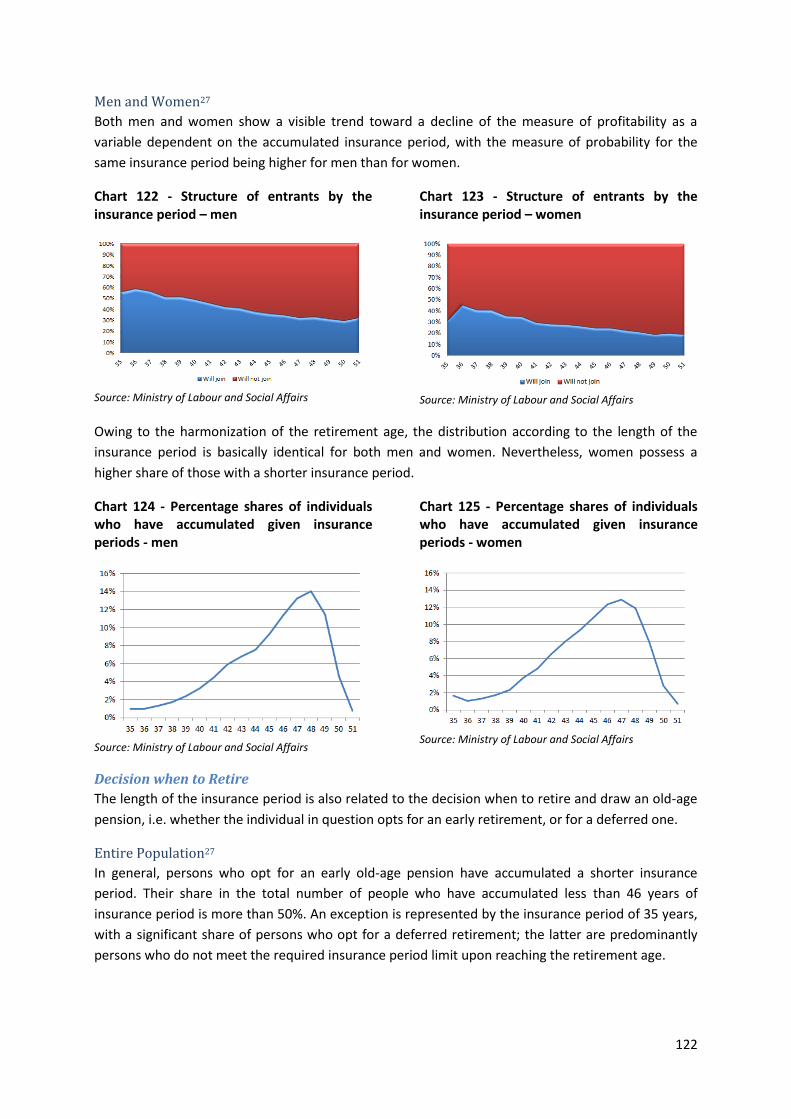
122
Men and Women27
Both men and women show a visible trend toward a decline of the measure of profitability as a
variable dependent on the accumulated insurance period, with the measure of probability for the
same insurance period being higher for men than for women.
Chart 122 - Structure of entrants by the insurance period – men
Source: Ministry of Labour and Social Affairs
Chart 123 - Structure of entrants by the insurance period – women
Source: Ministry of Labour and Social Affairs
Owing to the harmonization of the retirement age, the distribution according to the length of the
insurance period is basically identical for both men and women. Nevertheless, women possess a
higher share of those with a shorter insurance period.
Chart 124 - Percentage shares of individuals who have accumulated given insurance periods - men
Source: Ministry of Labour and Social Affairs
Chart 125 - Percentage shares of individuals who have accumulated given insurance periods - women
Source: Ministry of Labour and Social Affairs
Decision when to Retire
The length of the insurance period is also related to the decision when to retire and draw an old-age
pension, i.e. whether the individual in question opts for an early retirement, or for a deferred one.
Entire Population27
In general, persons who opt for an early old-age pension have accumulated a shorter insurance
period. Their share in the total number of people who have accumulated less than 46 years of
insurance period is more than 50%. An exception is represented by the insurance period of 35 years,
with a significant share of persons who opt for a deferred retirement; the latter are predominantly
persons who do not meet the required insurance period limit upon reaching the retirement age.
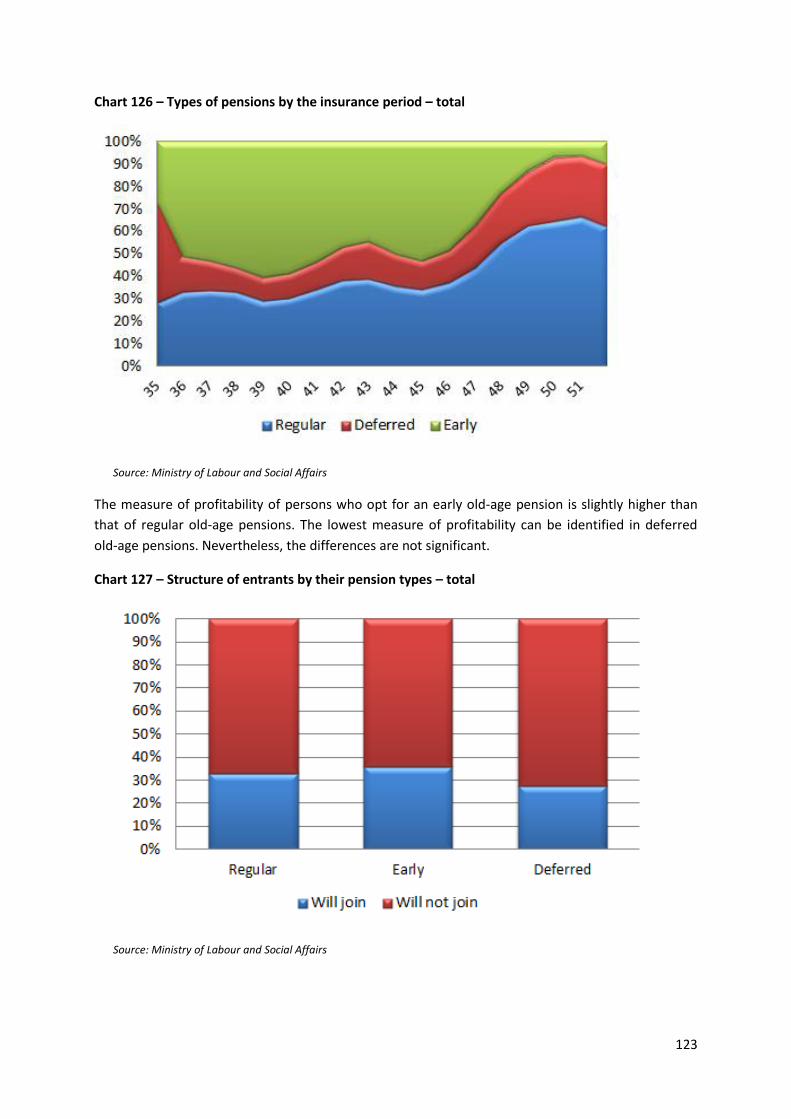
123
Chart 126 – Types of pensions by the insurance period – total
Source: Ministry of Labour and Social Affairs
The measure of profitability of persons who opt for an early old-age pension is slightly higher than
that of regular old-age pensions. The lowest measure of profitability can be identified in deferred
old-age pensions. Nevertheless, the differences are not significant.
Chart 127 – Structure of entrants by their pension types – total
Source: Ministry of Labour and Social Affairs
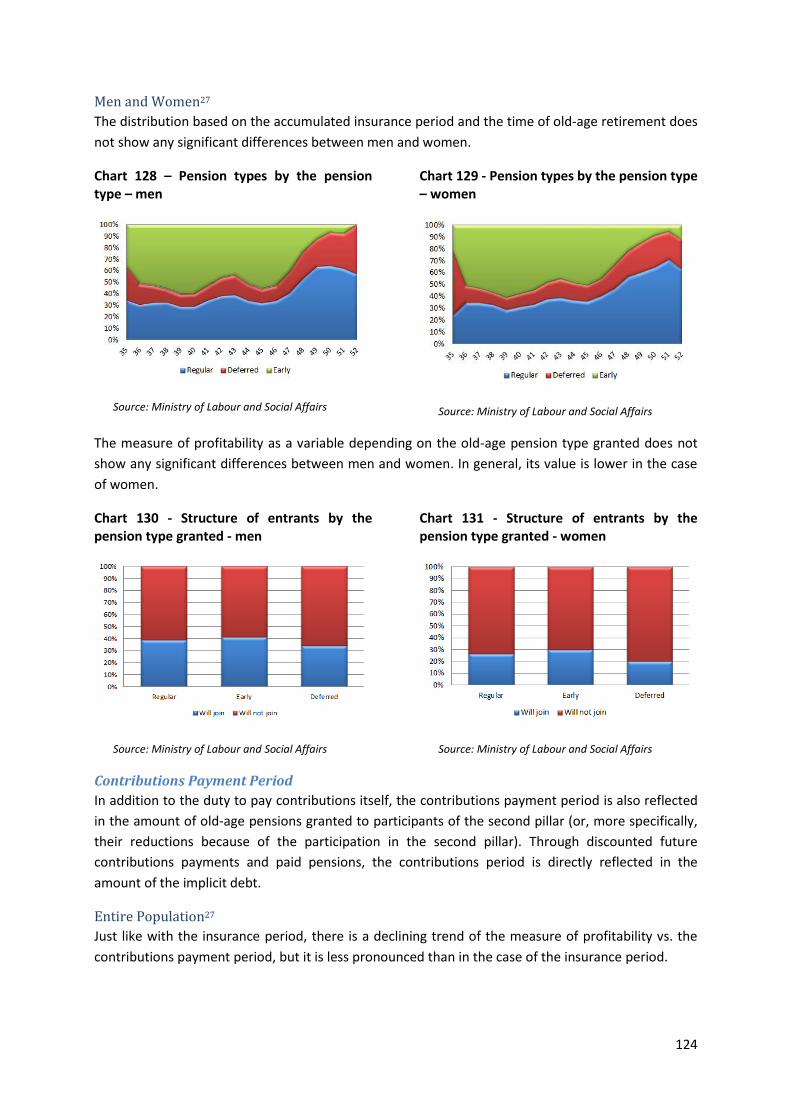
124
Men and Women27
The distribution based on the accumulated insurance period and the time of old-age retirement does
not show any significant differences between men and women.
Chart 128 – Pension types by the pension type – men
Source: Ministry of Labour and Social Affairs
Chart 129 - Pension types by the pension type – women
Source: Ministry of Labour and Social Affairs
The measure of profitability as a variable depending on the old-age pension type granted does not
show any significant differences between men and women. In general, its value is lower in the case
of women.
Chart 130 - Structure of entrants by the pension type granted - men
Source: Ministry of Labour and Social Affairs
Chart 131 - Structure of entrants by the pension type granted - women
Source: Ministry of Labour and Social Affairs
Contributions Payment Period
In addition to the duty to pay contributions itself, the contributions payment period is also reflected
in the amount of old-age pensions granted to participants of the second pillar (or, more specifically,
their reductions because of the participation in the second pillar). Through discounted future
contributions payments and paid pensions, the contributions period is directly reflected in the
amount of the implicit debt.
Entire Population27
Just like with the insurance period, there is a declining trend of the measure of profitability vs. the
contributions payment period, but it is less pronounced than in the case of the insurance period.
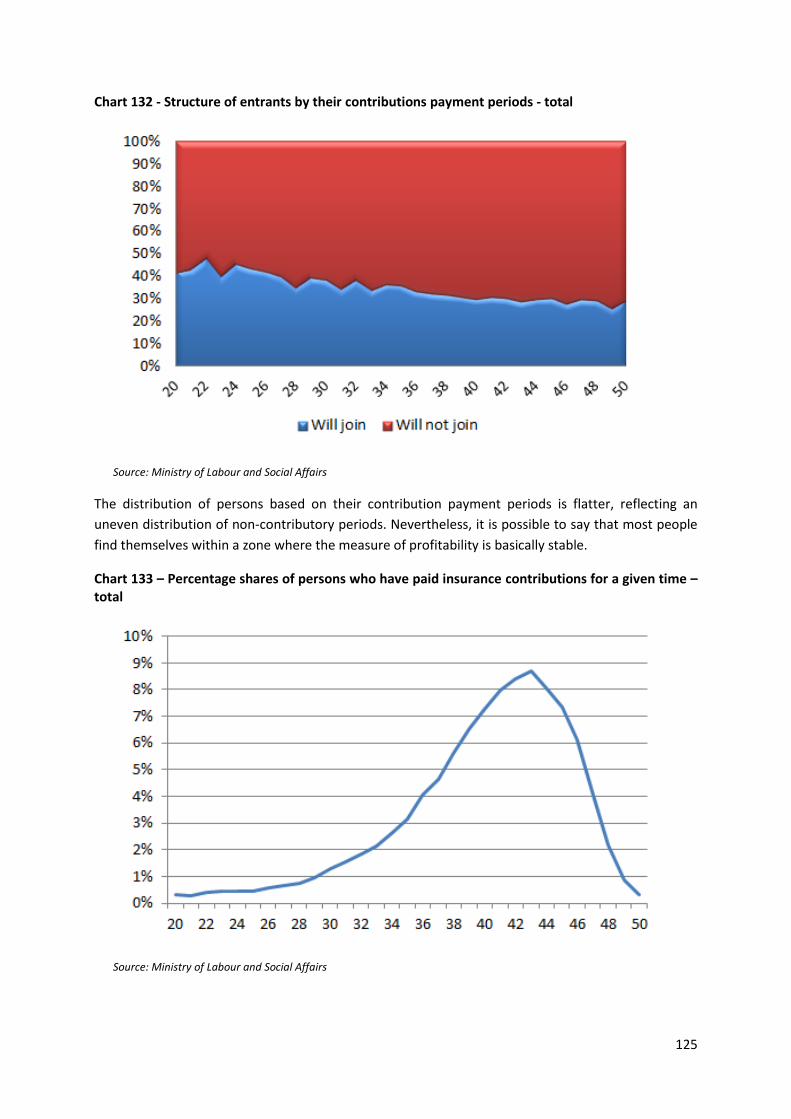
125
Chart 132 - Structure of entrants by their contributions payment periods - total
Source: Ministry of Labour and Social Affairs
The distribution of persons based on their contribution payment periods is flatter, reflecting an
uneven distribution of non-contributory periods. Nevertheless, it is possible to say that most people
find themselves within a zone where the measure of profitability is basically stable.
Chart 133 – Percentage shares of persons who have paid insurance contributions for a given time – total
Source: Ministry of Labour and Social Affairs
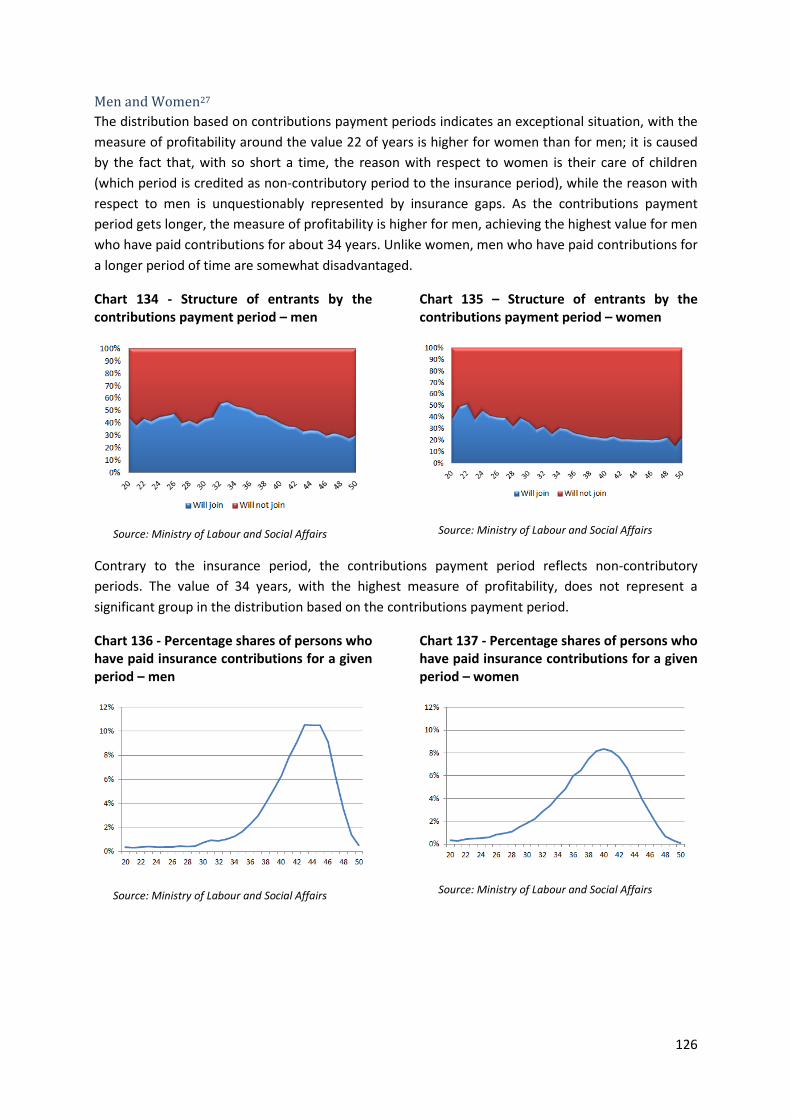
126
Men and Women27
The distribution based on contributions payment periods indicates an exceptional situation, with the
measure of profitability around the value 22 of years is higher for women than for men; it is caused
by the fact that, with so short a time, the reason with respect to women is their care of children
(which period is credited as non-contributory period to the insurance period), while the reason with
respect to men is unquestionably represented by insurance gaps. As the contributions payment
period gets longer, the measure of profitability is higher for men, achieving the highest value for men
who have paid contributions for about 34 years. Unlike women, men who have paid contributions for
a longer period of time are somewhat disadvantaged.
Chart 134 - Structure of entrants by the contributions payment period – men
Source: Ministry of Labour and Social Affairs
Chart 135 – Structure of entrants by the contributions payment period – women
Source: Ministry of Labour and Social Affairs
Contrary to the insurance period, the contributions payment period reflects non-contributory
periods. The value of 34 years, with the highest measure of profitability, does not represent a
significant group in the distribution based on the contributions payment period.
Chart 136 - Percentage shares of persons who have paid insurance contributions for a given period – men
Source: Ministry of Labour and Social Affairs
Chart 137 - Percentage shares of persons who have paid insurance contributions for a given period – women
Source: Ministry of Labour and Social Affairs
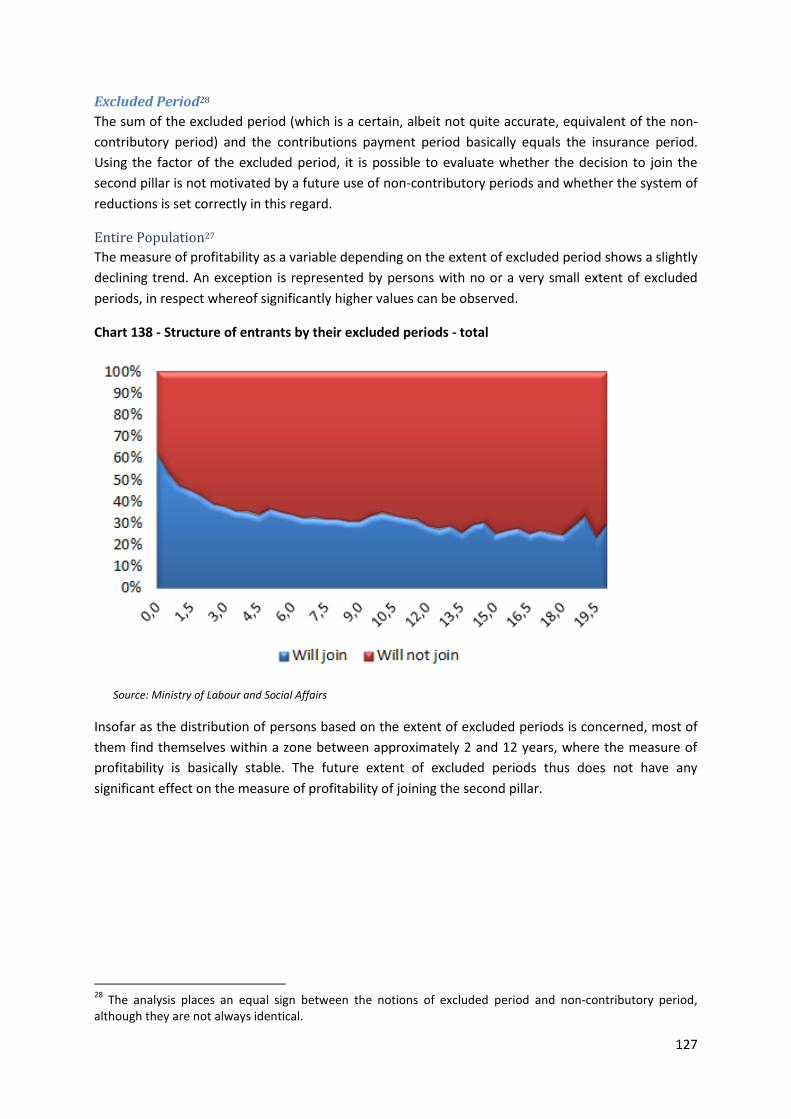
127
Excluded Period28
The sum of the excluded period (which is a certain, albeit not quite accurate, equivalent of the non-
contributory period) and the contributions payment period basically equals the insurance period.
Using the factor of the excluded period, it is possible to evaluate whether the decision to join the
second pillar is not motivated by a future use of non-contributory periods and whether the system of
reductions is set correctly in this regard.
Entire Population27
The measure of profitability as a variable depending on the extent of excluded period shows a slightly
declining trend. An exception is represented by persons with no or a very small extent of excluded
periods, in respect whereof significantly higher values can be observed.
Chart 138 - Structure of entrants by their excluded periods - total
Source: Ministry of Labour and Social Affairs
Insofar as the distribution of persons based on the extent of excluded periods is concerned, most of
them find themselves within a zone between approximately 2 and 12 years, where the measure of
profitability is basically stable. The future extent of excluded periods thus does not have any
significant effect on the measure of profitability of joining the second pillar.
28
The analysis places an equal sign between the notions of excluded period and non-contributory period, although they are not always identical.
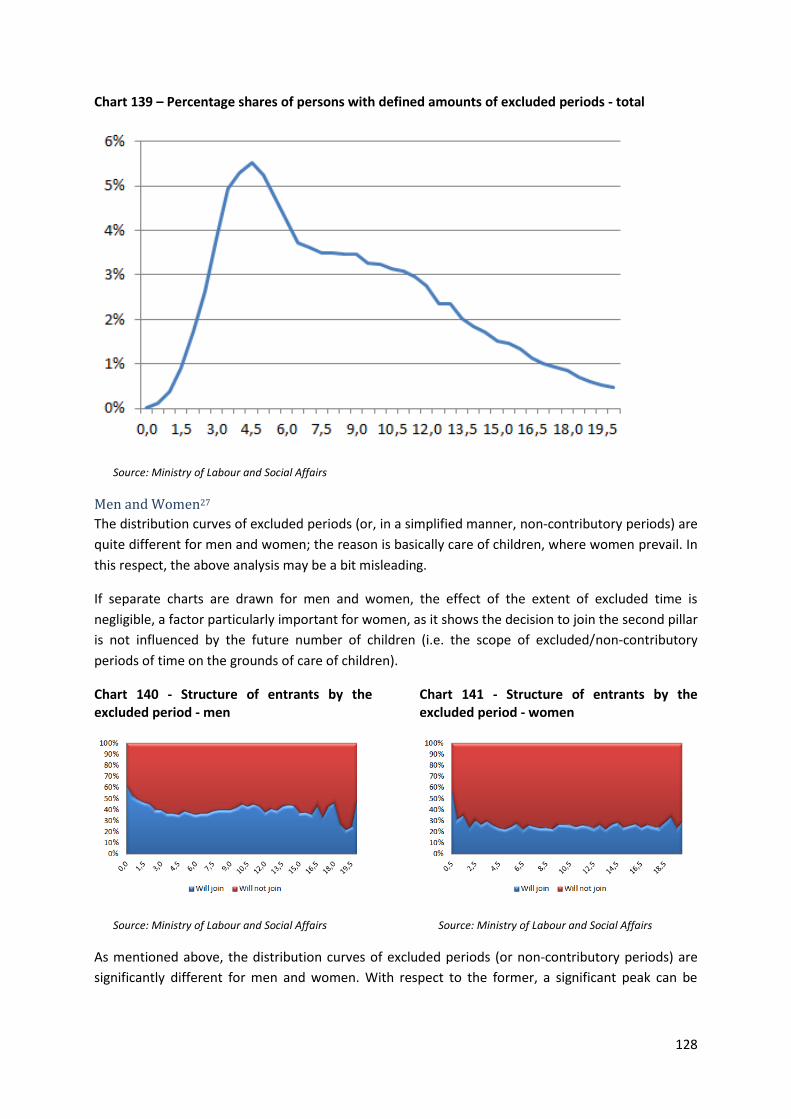
128
Chart 139 – Percentage shares of persons with defined amounts of excluded periods - total
Source: Ministry of Labour and Social Affairs
Men and Women27
The distribution curves of excluded periods (or, in a simplified manner, non-contributory periods) are
quite different for men and women; the reason is basically care of children, where women prevail. In
this respect, the above analysis may be a bit misleading.
If separate charts are drawn for men and women, the effect of the extent of excluded time is
negligible, a factor particularly important for women, as it shows the decision to join the second pillar
is not influenced by the future number of children (i.e. the scope of excluded/non-contributory
periods of time on the grounds of care of children).
Chart 140 - Structure of entrants by the excluded period - men
Source: Ministry of Labour and Social Affairs
Chart 141 - Structure of entrants by the excluded period - women
Source: Ministry of Labour and Social Affairs
As mentioned above, the distribution curves of excluded periods (or non-contributory periods) are
significantly different for men and women. With respect to the former, a significant peak can be
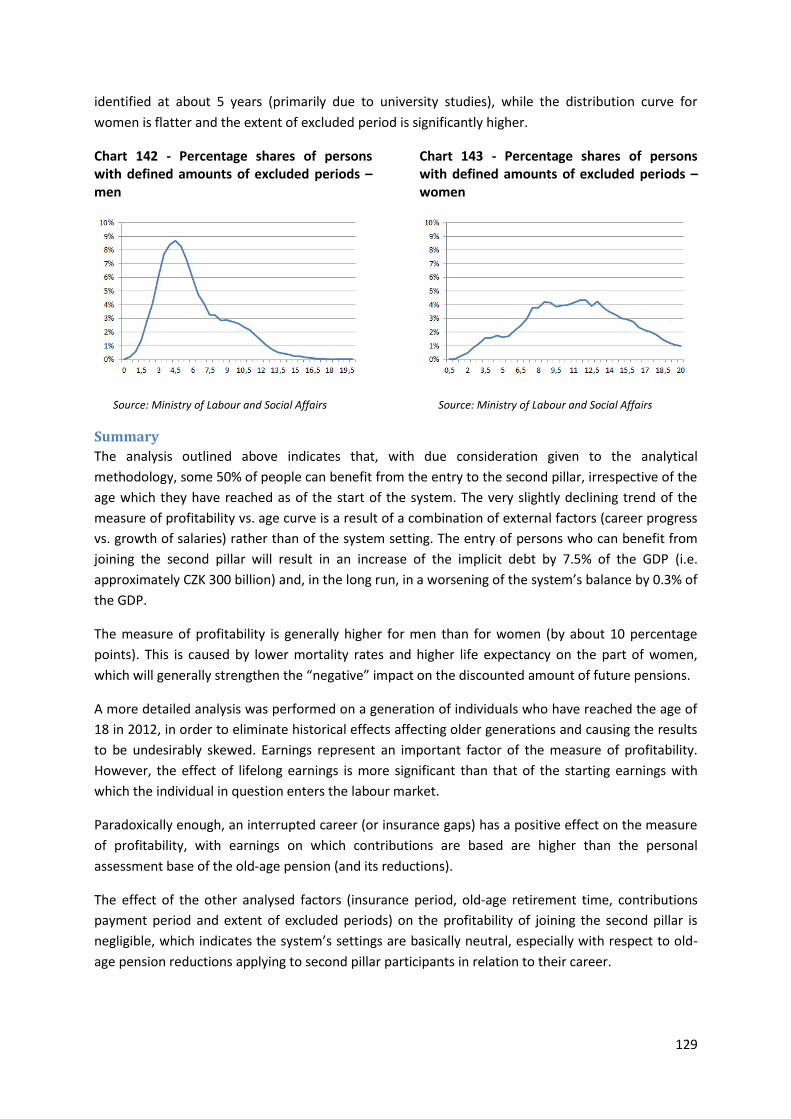
129
identified at about 5 years (primarily due to university studies), while the distribution curve for
women is flatter and the extent of excluded period is significantly higher.
Chart 142 - Percentage shares of persons with defined amounts of excluded periods – men
Source: Ministry of Labour and Social Affairs
Chart 143 - Percentage shares of persons with defined amounts of excluded periods – women
Source: Ministry of Labour and Social Affairs
Summary
The analysis outlined above indicates that, with due consideration given to the analytical
methodology, some 50% of people can benefit from the entry to the second pillar, irrespective of the
age which they have reached as of the start of the system. The very slightly declining trend of the
measure of profitability vs. age curve is a result of a combination of external factors (career progress
vs. growth of salaries) rather than of the system setting. The entry of persons who can benefit from
joining the second pillar will result in an increase of the implicit debt by 7.5% of the GDP (i.e.
approximately CZK 300 billion) and, in the long run, in a worsening of the system’s balance by 0.3% of
the GDP.
The measure of profitability is generally higher for men than for women (by about 10 percentage
points). This is caused by lower mortality rates and higher life expectancy on the part of women,
which will generally strengthen the “negative” impact on the discounted amount of future pensions.
A more detailed analysis was performed on a generation of individuals who have reached the age of
18 in 2012, in order to eliminate historical effects affecting older generations and causing the results
to be undesirably skewed. Earnings represent an important factor of the measure of profitability.
However, the effect of lifelong earnings is more significant than that of the starting earnings with
which the individual in question enters the labour market.
Paradoxically enough, an interrupted career (or insurance gaps) has a positive effect on the measure
of profitability, with earnings on which contributions are based are higher than the personal
assessment base of the old-age pension (and its reductions).
The effect of the other analysed factors (insurance period, old-age retirement time, contributions
payment period and extent of excluded periods) on the profitability of joining the second pillar is
negligible, which indicates the system’s settings are basically neutral, especially with respect to old-
age pension reductions applying to second pillar participants in relation to their career.
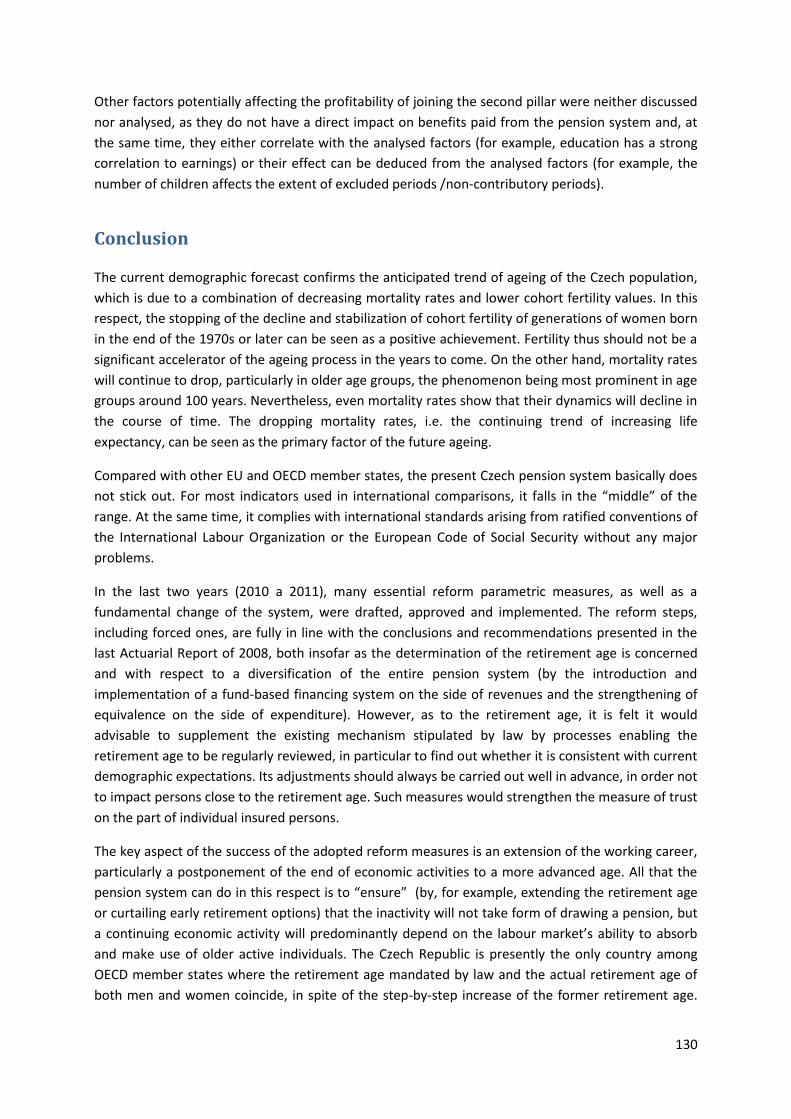
130
Other factors potentially affecting the profitability of joining the second pillar were neither discussed
nor analysed, as they do not have a direct impact on benefits paid from the pension system and, at
the same time, they either correlate with the analysed factors (for example, education has a strong
correlation to earnings) or their effect can be deduced from the analysed factors (for example, the
number of children affects the extent of excluded periods /non-contributory periods).
Conclusion
The current demographic forecast confirms the anticipated trend of ageing of the Czech population,
which is due to a combination of decreasing mortality rates and lower cohort fertility values. In this
respect, the stopping of the decline and stabilization of cohort fertility of generations of women born
in the end of the 1970s or later can be seen as a positive achievement. Fertility thus should not be a
significant accelerator of the ageing process in the years to come. On the other hand, mortality rates
will continue to drop, particularly in older age groups, the phenomenon being most prominent in age
groups around 100 years. Nevertheless, even mortality rates show that their dynamics will decline in
the course of time. The dropping mortality rates, i.e. the continuing trend of increasing life
expectancy, can be seen as the primary factor of the future ageing.
Compared with other EU and OECD member states, the present Czech pension system basically does
not stick out. For most indicators used in international comparisons, it falls in the “middle” of the
range. At the same time, it complies with international standards arising from ratified conventions of
the International Labour Organization or the European Code of Social Security without any major
problems.
In the last two years (2010 a 2011), many essential reform parametric measures, as well as a
fundamental change of the system, were drafted, approved and implemented. The reform steps,
including forced ones, are fully in line with the conclusions and recommendations presented in the
last Actuarial Report of 2008, both insofar as the determination of the retirement age is concerned
and with respect to a diversification of the entire pension system (by the introduction and
implementation of a fund-based financing system on the side of revenues and the strengthening of
equivalence on the side of expenditure). However, as to the retirement age, it is felt it would
advisable to supplement the existing mechanism stipulated by law by processes enabling the
retirement age to be regularly reviewed, in particular to find out whether it is consistent with current
demographic expectations. Its adjustments should always be carried out well in advance, in order not
to impact persons close to the retirement age. Such measures would strengthen the measure of trust
on the part of individual insured persons.
The key aspect of the success of the adopted reform measures is an extension of the working career,
particularly a postponement of the end of economic activities to a more advanced age. All that the
pension system can do in this respect is to “ensure” (by, for example, extending the retirement age
or curtailing early retirement options) that the inactivity will not take form of drawing a pension, but
a continuing economic activity will predominantly depend on the labour market’s ability to absorb
and make use of older active individuals. The Czech Republic is presently the only country among
OECD member states where the retirement age mandated by law and the actual retirement age of
both men and women coincide, in spite of the step-by-step increase of the former retirement age.
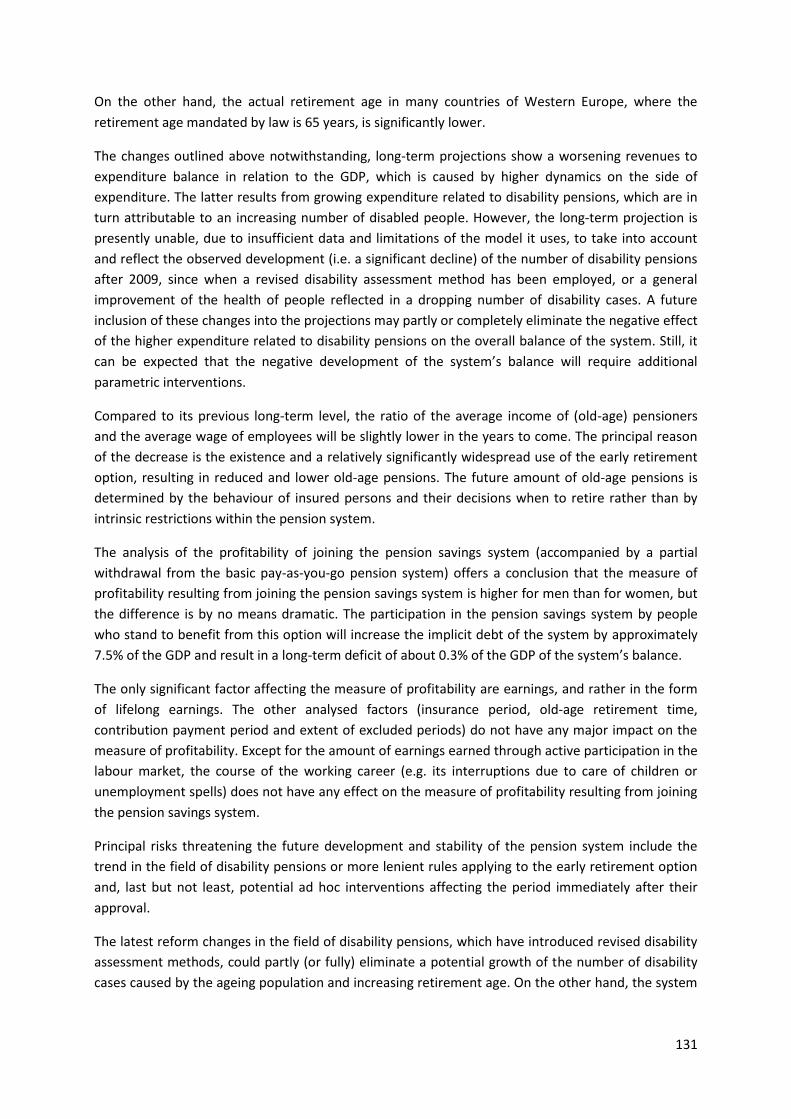
131
On the other hand, the actual retirement age in many countries of Western Europe, where the
retirement age mandated by law is 65 years, is significantly lower.
The changes outlined above notwithstanding, long-term projections show a worsening revenues to
expenditure balance in relation to the GDP, which is caused by higher dynamics on the side of
expenditure. The latter results from growing expenditure related to disability pensions, which are in
turn attributable to an increasing number of disabled people. However, the long-term projection is
presently unable, due to insufficient data and limitations of the model it uses, to take into account
and reflect the observed development (i.e. a significant decline) of the number of disability pensions
after 2009, since when a revised disability assessment method has been employed, or a general
improvement of the health of people reflected in a dropping number of disability cases. A future
inclusion of these changes into the projections may partly or completely eliminate the negative effect
of the higher expenditure related to disability pensions on the overall balance of the system. Still, it
can be expected that the negative development of the system’s balance will require additional
parametric interventions.
Compared to its previous long-term level, the ratio of the average income of (old-age) pensioners
and the average wage of employees will be slightly lower in the years to come. The principal reason
of the decrease is the existence and a relatively significantly widespread use of the early retirement
option, resulting in reduced and lower old-age pensions. The future amount of old-age pensions is
determined by the behaviour of insured persons and their decisions when to retire rather than by
intrinsic restrictions within the pension system.
The analysis of the profitability of joining the pension savings system (accompanied by a partial
withdrawal from the basic pay-as-you-go pension system) offers a conclusion that the measure of
profitability resulting from joining the pension savings system is higher for men than for women, but
the difference is by no means dramatic. The participation in the pension savings system by people
who stand to benefit from this option will increase the implicit debt of the system by approximately
7.5% of the GDP and result in a long-term deficit of about 0.3% of the GDP of the system’s balance.
The only significant factor affecting the measure of profitability are earnings, and rather in the form
of lifelong earnings. The other analysed factors (insurance period, old-age retirement time,
contribution payment period and extent of excluded periods) do not have any major impact on the
measure of profitability. Except for the amount of earnings earned through active participation in the
labour market, the course of the working career (e.g. its interruptions due to care of children or
unemployment spells) does not have any effect on the measure of profitability resulting from joining
the pension savings system.
Principal risks threatening the future development and stability of the pension system include the
trend in the field of disability pensions or more lenient rules applying to the early retirement option
and, last but not least, potential ad hoc interventions affecting the period immediately after their
approval.
The latest reform changes in the field of disability pensions, which have introduced revised disability
assessment methods, could partly (or fully) eliminate a potential growth of the number of disability
cases caused by the ageing population and increasing retirement age. On the other hand, the system
132
of disability pensions may be exposed to an increased pressure in the years to come, particularly due
to the increasing retirement age.
The key aspect of the success of the reform measures is a postponement of (old-age) retirement to a
more advanced age. Any efforts aiming at more lenient early old-age pension granting rules (not just
by modifications of “standard” early old-age pensions, but also by creating other systems or
alleviating conditions applying to existing ones, which would result in specific benefits weakening the
motivation to be economically active during the period prior to the retirement age) may significantly
impair the success of the reforms, both in terms of financial stability and with respect to older people
being adequately provided for after they retire.
Reform experience indicates that ad hoc measures whose effects are manifested shortly after the
approval of the measures may have, in a short run, other than intended impacts, as there will be
efforts to avoid their consequences (particularly through changes in the behaviour). Ad hoc
interventions with short-term objectives may also have unexpected long-term effects which will
necessitate solutions. All the above factors increase uncertainty on the part of insured persons, thus
weakening the stability of the whole system the nature of which is basically a long-term one.
Appendix 1 – Example of Old-Age Pension Calculation
133
Appendix 1- Example of Old-Age Pension Calculation
Example A man born on 25 February 1949, after completing the compulsory nine years of schooling in 1964,
studied at secondary school and university until 30 June 1972. After completing his studies, he was
continuously employed up until 25 September 2011. In 1993, he was sick 10 days, in 1994 he was sick
20 days and in 1996 he was sick 15 days.
Calculation
Determining Retirement Age
The retirement age was reached on 25 June 2011.
For insured born between 1936 and 1977 the retirement age is set by the appendix to the Pension
Insurance Act. According to this appendix the retirement age for men born in 1949 is 62 years and 4
months. According to Section 29, Article 1 of the Act the required insurance period when reaching
retirement age in 2011 is at least 27 years.
Determining the Insurance Period Acquired Up Until Becoming Entitled to Old-Age
Pension
The acquired insurance period amounts to 45 full years.
Included in the insurance period is full period from the beginning of studies at secondary school up to
18 years of age (1 September 1964 - 24 February 1967), i.e. 907 days and the duration of
employment (1 July 1972 – 24 June 2011), i.e. 14,238 days. The duration of studies after the age of
18 (25 February 1967 – 30 June 1972) is included at a rate of 80%, i.e. 1,562 days (1,953 x 0.8).
Hence, the total insurance period amounts to 16,707 days, i.e. 45 full years and 282 days (16,707:
365). Period of gainful activity between 25 June 2011 and 25 September 2011 (93 days) is taken into
account for increase in percentage amount for gainful activity carried out after entitlement to the
old-age pension, not for setting the amount of pension at the day when pension entitlement
originated.
Determining the Reference Period
The reference period for determining the personal assessment base will in this case be 25 years and
will include the years from 1986 to 2010 (2010 being the last year before the granting of the
pension).
Determining the Yearly Assessment Bases for Individual Years of the Reference Period
For each year “t” of the reference period it is necessary to:
To determine the amount of the assessment base (hereinafter "ABt") and the number of days of the excluded period (hereinafter "EP") - in this case this involves the days of sickness referred to in the example.
To determine the reference period from the relevant government decree or MLSA regulations the amount of the general assessment bases (hereinafter "GABt") - with the exception of the calendar year preceding the year in which the pension is granted.
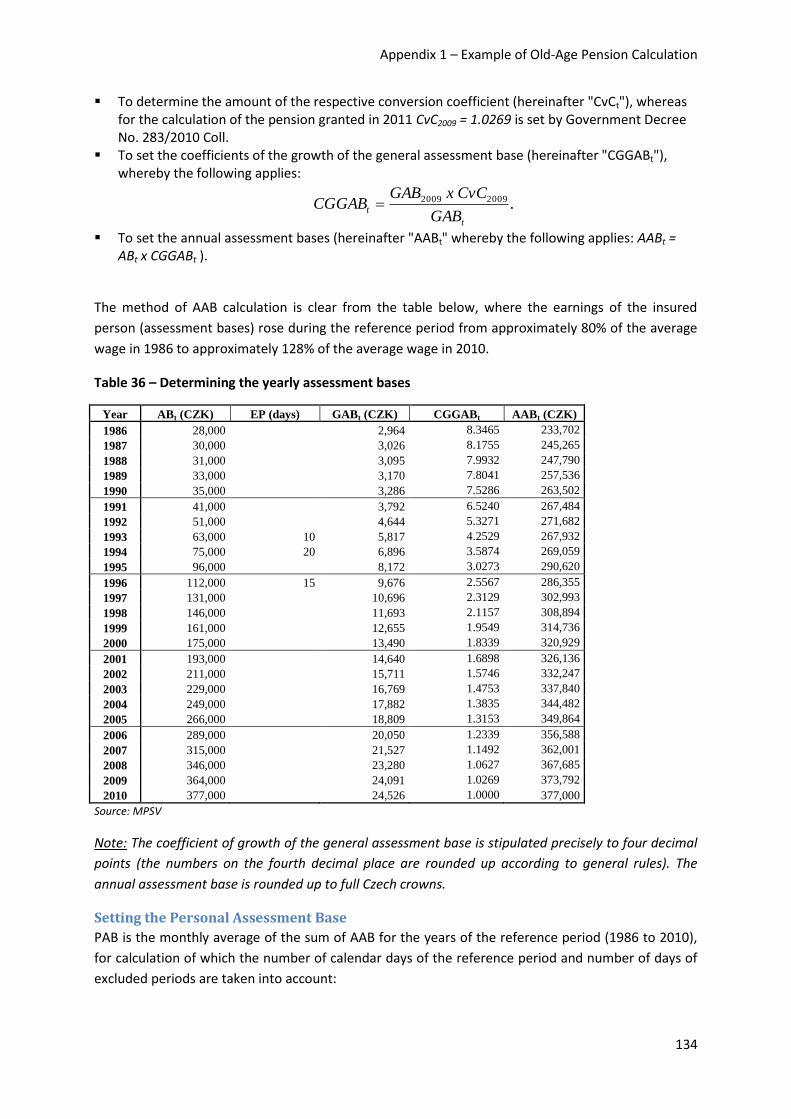
Appendix 1 – Example of Old-Age Pension Calculation
134
To determine the amount of the respective conversion coefficient (hereinafter "CvCt"), whereas for the calculation of the pension granted in 2011 CvC2009 = 1.0269 is set by Government Decree No. 283/2010 Coll.
To set the coefficients of the growth of the general assessment base (hereinafter "CGGABt"), whereby the following applies:
.20092009
t
tGAB
CvCxGABCGGAB
To set the annual assessment bases (hereinafter "AABt" whereby the following applies: AABt = ABt x CGGABt ).
The method of AAB calculation is clear from the table below, where the earnings of the insured
person (assessment bases) rose during the reference period from approximately 80% of the average
wage in 1986 to approximately 128% of the average wage in 2010.
Table 36 – Determining the yearly assessment bases
Year ABt (CZK) EP (days) GABt (CZK) CGGABt AABt (CZK)
1986 28,000 2,964 8.3465 233,702
1987 30,000 3,026 8.1755 245,265
1988 31,000 3,095 7.9932 247,790
1989 33,000 3,170 7.8041 257,536
1990 35,000 3,286 7.5286 263,502
1991 41,000 3,792 6.5240 267,484
1992 51,000 4,644 5.3271 271,682
1993 63,000 10 5,817 4.2529 267,932
1994 75,000 20 6,896 3.5874 269,059
1995 96,000 8,172 3.0273 290,620
1996 112,000 15 9,676 2.5567 286,355
1997 131,000 10,696 2.3129 302,993
1998 146,000 11,693 2.1157 308,894
1999 161,000 12,655 1.9549 314,736
2000 175,000 13,490 1.8339 320,929
2001 193,000 14,640 1.6898 326,136
2002 211,000 15,711 1.5746 332,247
2003 229,000 16,769 1.4753 337,840
2004 249,000 17,882 1.3835 344,482
2005 266,000 18,809 1.3153 349,864
2006 289,000 20,050 1.2339 356,588
2007 315,000 21,527 1.1492 362,001
2008 346,000 23,280 1.0627 367,685
2009 364,000 24,091 1.0269 373,792
2010 377,000 24,526 1.0000 377,000
Source: MPSV
Note: The coefficient of growth of the general assessment base is stipulated precisely to four decimal
points (the numbers on the fourth decimal place are rounded up according to general rules). The
annual assessment base is rounded up to full Czech crowns.
Setting the Personal Assessment Base
PAB is the monthly average of the sum of AAB for the years of the reference period (1986 to 2010),
for calculation of which the number of calendar days of the reference period and number of days of
excluded periods are taken into account:
Appendix 1 – Example of Old-Age Pension Calculation
135
Given that there were days when sickness benefits were received (i.e. excluded periods), the total
number of days of the reference period must be decreased by the number of such days (in this given
example 45 days) when setting the personal assessment base. The personal assessment base is
rounded up to full Czech crowns.
Setting the Calculation Base
When pension is granted in the period 1 January 2011 - 29 September 2011
Reduction: up to the 1st reduction limit 100% of the PAB is included, from the 1st reduction limit to
the 2nd reduction limit 30% of the PAB is included and above the 2nd reduction limit 10% of the PAB is
included. For pensions granted in 2011 the reduction limits are provided for in Government Decree
No. 283/2010 Coll. in the amounts of CZK 11,000 and CZK 28,200.
( ) ( )
When pension is granted in the period 30 September 2011 - 29 December 2011
Reduction: up to the 1st reduction limit 100% of the PAB is included, from the 1st reduction limit to
the 2nd reduction limit 29% of the PAB is included, from the 2nd to the 3rd reduction limit 13% of the
PAB is included and above the 3rd reduction limit 10% of the PAB is included. For pensions granted in
2011 the reduction limits are provided for in Government Decree No. 283/2010 Coll. in the amounts
of CZK 10,886, CZK 28,699 and CZK 98,960.
( )
Setting the Percentage Amount of Pension
The percentage amount (hereinafter “PA”) for each entire year of the insurance period acquired
until entitlement to the old-age retirement is 1.5% of the AB, where the minimum amount of the
percentage amount is 770 CZK per month. In the given example PA therefore is 45 x 1.5% AB = 67.5%
AB.
Percentage amount of the pension for insurance period till the moment when pension entitlement
originated therefore is:
− CZK 10,402 (15,410 x 67.5 %) when pension is granted in the period 1 January 2011 -29 September
2011,
− CZK 10,248 (15,182 x 67.5 %) when pension is granted in the period 30 September 2011 -
31 December 2011.
Increased Percentage Amount by the Period of Gainful Activity Carried out After
Entitlement to the Old-Age Pension
The increase is for every complete 90 calendar days (not including periods of sickness) and amounts to 1.5% for the period acquired after 30 June 2001 and 1% for the period prior to 1 July 2001. In the given example, there is an entitlement to an increased percentage amount of 1.5% of AB for the period from 25 June 2011 till 25 September 2011, i. e. for 93 days.
Appendix 1 – Example of Old-Age Pension Calculation
136
Increase in percentage amount for 90 days of gainful activity carried out after entitlement to the old-
age pension is:
− CZK 232 (15,410 x 1.5%) when pension is granted in the period 1 January 2011 - 29 September
2011,
− CZK 228 (15,182 x 1.5%) when pension is granted in the period 30 September 2011 - 31
December 2011.
Total amount of percentage amount including increase for gainful activity after entitlement to the
old-age pension is:
− CZK 10,634 (10,402 + 232) when pension is granted in the period 1 January 2011 - 29 September
2011,
− CZK 10,476 (10,248 + 228) when pension is granted in the period 30 September 2011 - 31
December 2011.
Note: The amount of the old-age pension is rounded up to the next Czech crown; the amount of the
old-age pension calculated to the date of entitlement to pension is rounded up separately as well as
any increases of old-age pension for the period of employment performed after the entitlement.
Setting the Basic Amount of the Old-Age Pension
Basic amount (hereinafter “BA”) of CZK 2,230 per month is provided for by Government Decree No.
281/2010 Coll., on increase in pensions in 2011; however indexation increase in percentage amount
of pension pursuant to this government decree does not apply.
Total Amount of the Old-Age Pension
Total amount of pension including increase for gainful activity after entitlement to the old-age
pension is:
− CZK 12,864 (10,634+2,230) when pension is granted in the period 1 January 2011 - 29 September 2011,
− CZK 12,706 (10,476+2,230) when pension is granted in the period 30 September 2011 - 31
December 2011.
Approximate calculation of pension amount according to specific input data and information on some terms are available from the website of MLSA http://www.mpsv.cz in the section Pension – Calculators.
Appendix 2 – Overview of Main Measures Adopted since 1990
137
Appendix 2 – Overview of Main Measures Adopted Since 1990
Period 1990 to 1996
Period of years 1990-1996 is characterized by pension system transformation in the framework of
social system transformation during the transition from centrally planned to market economy.
1990 to 1992
Discrimination of the self-employed was eliminated (in particular social security of the self-
employed was placed on equal footing with social security of other gainfully employed persons)
and preferential treatment in the pension system was cancelled (work categories and personal
pensions were cancelled). These measures meant that nearly all of the persons economically
active receive entitlement to pensions under uniform conditions and suitable conditions were
thus created for further reform measures.
The implementation of pension insurance and sickness insurance was unified (sickness insurance
was transferred from the remits of trade unions, the Czech Union of Manufacturing Cooperatives
and district national committees and was organizationally unified with pension insurance under
one state authority – the current CSSA – coordinated by the MLSA).
The rules for regular indexation of pensions were implemented - the first systematic indexation
measures were adopted which provided for the conditions and method of regular increase in
pensions.
1994
The passage of the Act on Supplementary Pension Insurance with State Contribution. Hence, the
Czech pension system is comprised of two pillars - the basic compulsory defined benefit PAYGO
pillar and a non-compulsory defined contribution funded pillar of supplementary pension
insurance with state subsidized contributions; supplementary pillar also includes private life
insurance.
1995
Passage of the Pension Insurance Act. The new legal provisions include such fundamental
measures as the gradual raising of the retirement ages, the unification of the system, changes to
the structure of the calculation of pensions that, to a certain degree, react to developments in
external factors. In addition, full (and partial) disability was newly defined in relation to the
percentage-based reduction of the ability to continuously carry out gainful activities as a result of
a long- term poor health, which does not enable the previous 'professional' and 'estate' disability.
Moreover, in addition to the existing option of taking temporarily reduced old-age pension for up
to two years earlier before reaching the retirement age (which was taken over from the current
legislation) possibility to take a permanently reduced early old-age retirement up to three years
before reaching the retirement age was introduced. The Pension Insurance Act presented a
significant shift to practices common in the EU Member States (e.g. the entitlement to pensions
is not subject to residency in the territory of the CR) and complies with EC law.
Appendix 2 – Overview of Main Measures Adopted since 1990
138
1996
A special account was created for pension insurance as a part of the state financial assets. It
enables the defining of the balance of the basic pension insurance albeit within the framework of
the state budget. The funds on this account may only be used for increasing benefits or to cover
deficit balances of contributions for pension insurance.
Period 1997 to 2008
This period is characterized by changes that focused mainly on strengthening the financial
sustainability of the system.
1997
Under cost-saving measures, the crediting of almost all forms of non-contributory periods was
limited and the conditions for the indexation of pensions were made more stringent.
1999
An amendment to the Act on Supplementary Pension Insurance with State Contribution was
adopted which increased the security of deposits of participants and extended the possibilities of
this form of supplementary insurance (increasing the contribution by the state, introduction of
tax reliefs for participants - employees and for the contributing employers, the setting of stricter
conditions for supplementary pension insurance).
2001
The actuarial rules (the reduction of the percentage amount for the early old-age retirement was
increased and the deferred retirement was made more advantageous) were taken more into
account in setting the pension amounts.
2002
The regular increase of pensions as of 1 January of every year (in January 2003 for the first time)
was introduced and the conditions for increasing pensions were clarified so that the decisions on
such increases could be made only on the basis of final statistical data and not just on estimates
of these indicators with the possibility of raising pensions in exceptional circumstances outside
the regular term when greater price increases occur.
2003
Effective from 1 January 2004:
o Increases in the retirement age after 2007 up to reaching a uniform age level of 63 for
men and childless women, whereby the retirement age for other women will, for the
time being, remain differentiated based on the number of children brought up (59 to 62
years);
o Limiting the possibility of retiring before reaching the retirement age by cancelling
temporarily reduced early old-age pensions (one of the two forms of early retirement),
o Reducing the crediting of studies for the purposes of pension insurance;
Appendix 2 – Overview of Main Measures Adopted since 1990
139
o Cancelling the condition enabling entitlement to the payment of old-age pensions
concurrently with earnings from gainful activities during two years following entitlement
to such a pension only when it does not exceed the prescribed level of earnings and
introducing a condition of concluding the employment relationship for a maximum of one
year (previously, there was no such requirement);
o The classification of, for the purposes of pension insurance, self-employed activities as
'main' and 'secondary'.
An amendment to the Act on Supplementary Pension Insurance with State Contribution was
approved whose aim was primarily to achieve harmonization with EU law.
The system of reducing partial disability pensions or the suspension of their payment due to
exceeding the set levels of earnings from gainful activity was cancelled with effect from 1
February 2006.
2006
The amount of widowers’ pensions or permitting their payment was adjusted if the reduction of
the amounts of these pensions or their non-granting occurred under legislation in force prior to 1
January 1996 due to “concurrent maximums”.
2007
Change in the legislation (in reaction to the finding of the Constitutional Court of 6 June 2006 No.
405/2006 Coll.) consisting in the arrangement whereby the period of care of a child needs to be
proved in the same manner for all insured persons, i.e. both men and women, namely by an
affidavit submitted together with the application for pension.
2008
A condition for indexation of pensions outside the regular term was changed (i.e. even if prices
increase by at least 5%).
The special account for pension insurance was transformed to a single reserve account for the
pension reform. Cash flows of this account are used for pension reform according to resolution
of House of Representatives of the Parliament on the proposal of government. MF is authorized
to invest temporarily free resources on this account to state bonds, bonds of CNB, bonds issued
by member states of OECD, bonds issued by central banks of these states or by European Central
Bank.
2010 As part of the first stage of the pension reform changes to the basic pension insurance were
approved with effect as from 1 January 2010. The key measures adopted include:
o Gradual extension of the insurance period required for entitlement to the old-age
pension from 25 years to 35 years, including non-contributory periods or to 30 years
without non-contributory periods;
o Gradual limitation on crediting of non-contributory insurance periods also for entitlement
to the old-age pension;
o Uninterrupted continuation in gradual increases in the retirement age to 65 years for
men and women who have not brought up any child or one child and 62 to 64 years for
women (by the number of the brought up children), if they have brought up at least two
Appendix 2 – Overview of Main Measures Adopted since 1990
140
children and in this connection also the age limit for entitlement to the old-age pension if
shorter insurance period is acquired;
o Gradual extension of the period for the early retirement from three to five years;
o Cancellation of the condition for entitlement to the payment of the old-age pension
concurrently with income from gainful activities which consists in negotiating the
employment relationship for a maximum period of one year;
o Increasing the percentage amount of the old-age pension for a period of gainful activity
after becoming entitled to the old-age pension, with concurrent receipt of this pension in
full or receipt of half the amount of the pension;
o Change of full disability pension to the old-age pension in the same amount upon
reaching the age of 65;
o Unification of the existing fixed age limit for “permanent“ entitlement of women to
widow’s pension and men to widower’s pension;
o New definition of disability (introduction of three degrees for disability classification);
o Unification of the age limit for which the so-called additional calculated period for the
percentage amount of disability pension for men and women is ascertained;
o Cancellation of the duration of studies acquired in the period after the Act was enacted as
non-contributory period, except for assessment of entitlement to disability pensions;
o Increasing the reduction of the percentage amount in the case of early retirement, from
the third year onwards.
2011 An amendment of the Pension Insurance Act, dealing mainly with effects of a Constitutional
Court finding which repealed Section 15 of the Act. The Constitutional Court found Section 15 of
the Pension Insurance Act, stipulating how the calculation base used to calculate the percentage
amount of the pension and the reduction limits are determined, unconstitutional. However, the
finding did not dispute the existence of the reduction limits per se, as one of the elements of the
pension calculation formula. In addition to changes directly related to the finding of the
Constitutional Court, other parametric changes were adopted as well, the purpose of which was
to contribute to improving the financial sustainability of the basic pension insurance system or to
refine the existing legislation.
New additions were made to the range of persons eligible for pension insurance (e.g. persons
working under a job performance contract, if they earn more than CZK 10,000 a month); the
definition of the person to the care of whom an orphaned child is entrusted for the purpose of
the right to an orphan’s pension (on the basis of a court ruling) was changed; and an alternative
condition establishing the right to an orphan’s pension was introduced (the right to an orphan’s
pension will also be established if the insured person has accumulated at least a half of the time
needed to establish the right to a disability pension according to the Pension Insurance Act as of
the day of the insured person’s death).
As a result of legal acts adopted in the framework of the so-called “large” pension reform, the
Czech pension system will comprise, as of January 1, 2013, three pillars:
o 1st pillar – state, compulsory, defined-benefit, pay-as-you-go pension system funded from
social insurance contributions (basic pension insurance); the introduction of a pension
savings system was projected into the basic pension insurance system (in other words,

Appendix 2 – Overview of Main Measures Adopted since 1990
141
the participation of a person in the pension savings system was projected into pension
rights arising from the basic pension insurance system);
o 2nd pillar – newly established, capital-funded and defined-contribution; the participation
will be voluntary, but when the decision to join has been taken, its change or reversal will
not be possible (pension savings system),
o 3rd pillar – voluntary, capital-funded and defined-contribution, based on the existing
supplementary pension savings system with a state contribution, but reformed
(supplementary pension savings system).
Appendix 3 – Description of the Dynamic Micro-Simulation Model
142
Appendix 3 – Description of the Dynamic Micro-Simulation Model
The model is implemented in a software system called Prophet developed by Sungard. A special
library called “Liska”, which contains the entire code, has been developed specifically for the model.
Modelled objects – model points The calculations are made on the level of the model point which represents an individual from the
population. As some cash flows depend not only on the life of the respective individual but also on
his/her family, the family members are also taken into account in the calculations for the respective
model point. Every model point, therefore, includes the main individual and several auxiliary
individuals. Although it is possible to calculate cash flows also for some auxiliary individuals, the input
for the overall and individual results is only the cash flows for the main individual because for every
auxiliary individual there is a model point in which he/she is the main individual.
Full model calculations are always made for the main individual. The auxiliary individuals can be
modelled either fully or in simplified manner. The model is set up such as the spouse of the main
individual (husband/wife or potential husband/wife in the case of singles) is modelled fully. Children
are modelled in simplified manner because the full career history of the children does not affect the
cash flows of the main individual. The number of individuals modelled fully within one model point is
the parameter which can be changed.
Model Calculations Model calculations can be divided into the following inter-connected groups:
Events;
Career paths capturing the economic (in)activity of an individual throughout his/her life;
Family relations reflecting the marital status of an individual and number of children born and
raised; and
Calculation of cash flows consisting of modelling of the individual’s earnings (including the
earnings of the husband/wife), payments to the pension system (pension contributions), and
payments of pension benefits.
Events
Major events in the life of the modelled individuals are modelled randomly on monthly basis based
on the predefined probabilities of the specific events.
The following events are modelled:
Birth
Death
Termination of studies
Occurrence of disability
Change of the degree of disability
Termination of disability
Marriage
Divorce/becoming a widow(er)

Appendix 3 – Description of the Dynamic Micro-Simulation Model
143
Birth of a child
Termination of care of a child
Beginning and end of care of family
Retirement
Emigration
Change of the possibility of parallel employment and receipt of old-age pension
Change of wage
Transfer between employee status and self-employed status
Status variables are developed based on the event. The model uses the following status variables:
Living (yes/no)
Student (yes/no)
Disability (yes/no)
Married (yes/no)
Taking care of a child (yes/no)
Taking care of family (yes/no)
Pensioner (yes/no)
In pension system (yes/no)
Degree of disability pursuant to the legislation
Possibility of parallel employment and receipt of old-age pension pursuant to the legislation
Self-employed individual (yes/no)
Life and career paths and family relations are developed based on the events and status variables.
Career Paths
A career path of an individual in the given model point is the sequence of statuses of economic
activity / inactivity, and a change of a status is triggered by the occurrence of events. Statuses are
defined in the input table and can be changed or added by the user. Statuses can be further divided
into sub-statuses. Within the project, we consider the following statuses and sub-statuses:
Employed
o Healthy
o Sick
Unemployed
o Individuals registered in the employment bureau (separately those who receive and those
who do not receive unemployment benefits)
o Other individuals without employment
Inactive individuals
o Children and students
o Persons taking care of children
o Persons taking care of family
o Disability pensioners by degree of disability
o Old-age pensioners
Individuals outside the pension system
o Emigrants
Appendix 3 – Description of the Dynamic Micro-Simulation Model
144
o Armed forces
A special status is death which results in the termination of projection of the main individual.
Projection of the auxiliary individuals, however, continues due to the possibility to model survivors’
pensions.
Transfer from one status to another is a result of decision-making processes, random events and the
assessment of compliance with requirements for entry to the respective status (e.g., sufficient time
of insurance period for eligibility for old-age pension, etc.).
For inactive individuals the reason for inactivity is determined based on the status variables. The
reasons for inactivity are as follows:
Taking care of a child
Disability pensioner, degree 3
Disability pensioner, degree 2
Disability pensioner, degree 1
Old-age pensioner
Student/child
Taking care of family
Family Relations
Another part of the calculations is related to the modelling of family relations of the main individual.
In every model point the main individual has a spouse assigned at the beginning of the projection
even if he/she is single or divorced. Marriages, divorces and re-marriages are modelled as random
events based on the assumptions regarding the marriage rate and divorce rate. It is assumed that the
spouse of the main individual is the same also in the case of re-marriage after divorce of widowhood.
Child birth is also modelled as a random event based on the fertility rates of the woman in the
couple. Career paths of children are not modelled fully but only in simplified manner (age, death,
orphan, having left the household).
Cash Flows
Career path and family relation define the conditions of entitlement for the payment of benefits
from the pension insurance system. Part of the model projecting the cash flows uses information on
career path and marital status for the calculation of the contributions to the pension system and
payments of benefits from the pension system. The following items are modelled in this part of the
model:
Gross monthly earnings based on wage inflation and career-based earnings increase. The
individual’s earnings in the respective month is then determined in combination with the
information on the economic status;
Contributions to the pension system according to the current legislation derived from the
individual’s income in the respective month;
Contributions to fund pillar and accumulation of the fund derived from the individual’s earnings
in the respective month and information on participation in the fund pillar;

Appendix 3 – Description of the Dynamic Micro-Simulation Model
145
Old-age pensions according to the current legislation (regular, permanently reduced,
concurrence with gainful activity);
Payment of annuity from the fund pillar and fund in the payment phase in the event of the
individual’s participation in the fund pillar;
Disability pensions according to the current legislation (according to the degree of disability,
concurrence with gainful activity);
Widows’/widowers’ pensions according to the current legislation;
Orphans’ pension according to the current legislation; and
Pensions in concurrence with another pension.
Wage Modelling
The initial wage of an individual after completion of studies is defined in the model point and is
derived from the distribution of salaries depending on the education level achieved. If the individual
has been working prior to completion of his/her studies the model will use an age-dependent
average wage defined in the table. Wage is increased once a year, and the increase consists of three
components:
Career growth
Residual wage inflation (growth of the average wage due to general growth in productivity)
Decrease of wage in the case of inactivity and unemployment
Residual wage inflation is the input of the model and should be calibrated together with the career
growth, so that the total generated growth of the average wage would correspond with the wage
inflation which also enters the model and is used for indexation.
Career growth can be modelled as follows:
Stochastically based on the distribution of wage growth; or
Deterministically based on average age-dependent growths; or
Deterministically depending on education.
In the first two cases it is possible to take into account or not to take into account dependency on the amount of wage. Decrease of wage in the case of inactivity and unemployment is driven by age-dependent assumption.
Fund Pillar Modelling
It is possible to model any quantity of fund pillars with several separate sub-funds. The following
elements are modelled in the accumulation phase:
Contributions based on wage growth
Fee from the contribution
Investment yield of the funds
Fee from the amount of the fund
Transfers between sub-funds
The following elements are modelled in the payment phase:
Appendix 3 – Description of the Dynamic Micro-Simulation Model
146
Payment of the annuity (calculated based on the defined technical interest rate, indexation rate,
and cost and profit margin)
Calculation of the technical reserve
Profit-sharing based on outperformance over the technical interest rate on the technical reserve
Development of the annuity fund
Model Assumptions The model works with several types of assumptions:
Decision-making processes which can be further divided into:
o Probability of an event occurrence and
o Probabilities of transfer between working statuses.
Macroeconomic assumptions and
Assumptions for the fund pillars.
Macroeconomic Assumptions
Macroeconomic assumptions include:
Projection of CPI inflation,
Projection of the growth of the average nominal wage,
Risk-free interest rate.
Wage inflation is used for indexation of all fixed values in the model (e.g., basic amount of the
pension, minimum percentage amount of the pension, etc.). A similar role could be played also by
the CPI inflation but if the use of CPI inflation is not required by the legislation, the indexation of
nominal values uses wage inflation due to preservation of the relative level. CPI inflation is the input
value of the calculation of the coefficient for the indexation of the pension benefits paid. Risk-free
interest rate is used for discounting the implicit debt and it should also be used as a basis for deriving
the performance of the fund pillar.
Assumptions for the Fund Pillar
These are assumptions used for the modelling of funds in the saving phase, calculation of the annuity
and calculation of the profit sharing in the payment phase. The model uses the following
assumptions:
Performance of the respective fund in the respective pillar
Performance of the annuity fund in the respective pillar
Technical interest rate for the calculation of annuity in the respective pillar
Indexation of annuity in the respective pillar
Annual fee as a percentage from the fund (saving phase) for the respective fund
Annual fee as a percentage from the fund (payment phase) for the respective pillar
Fee from the contributions to the respective fund
Profit margin used for the calculation of annuity in the respective pillar
Costs in the annuity fund in the respective pillar
Cost surcharge for the calculation of annuity in the respective pillar
Percentage of outperformance of the annuity fund paid as a profit share in the respective pillar

Appendix 3 – Description of the Dynamic Micro-Simulation Model
147
Percentage of transfer from one fund to another within the respective pillar
Main Output Variables of the Model Outputs for each variable used and possibly in a different level of aggregation can be extracted from
the model. As the model includes several hundreds of variables, and the calculation is made on the
level of each of the model points, of which there are several million, the user must carefully specify
the required outputs.
In terms of the degree of aggregation, the following results are available:
Overall aggregate results for the entire population, resulting from:
o Addition over all model points (individuals in the population), or
o Addition over all model points re-weighted to the size of the population in the event that
a sample of model points was randomly selected from the set of all model points in order
to speed up the calculation;
Results by so-called SP codes (sub-product code used for division of aggregate results). An SP
code can be created e.g., to define cohorts according to the year of birth and gender.
Results by model points.
It is possible to consider the variables containing information on the marital status, economic status,
typical status (including the reasons for inactivity), contributions to the pension system, amount of
the pension, etc. to be the main output variables of the model.
On the aggregate level, the following indicators are of particular interest:
Income of the pension system,
Expenditure of the pension system categorized according to the type of pension as follows:
o Expenditure for old-age pensions,
o Expenditure for disability pensions, and
o Expenditure for survivor’s pensions.
Balance of the pension system,
Implicit debt of the pension system,
Number of contributors to the system,
Number of recipients of benefits according to the type of pension:
o Number of old-age pensioners,
o Number of disability pensioners,
o Number of widows’/widowers’ pensions, and
o Number of orphans’ pensions.
Average pension according to the type of pension:
o Average old-age pension,
o Average disability pension,
o Average widow’s/widower’s pension, and
o Average orphan’s pension.
Structure of the population according to the economic status:
o Number of employed individuals,
o Number of unemployed individuals, and
Appendix 3 – Description of the Dynamic Micro-Simulation Model
148
o Number of inactive individuals according to the type of inactivity:
Studies,
Care of a child,
are of family,
Disability (according to the degree),
Old-age pension.
On the cohort level, interesting information is provided by the so-called implicit debt. It provides
information for the generation of new entrants to the labour market on whether the respective
cohort will be a new recipient or net payer to the system throughout the entire life. In other words, it
informs whether the system is well set up in actuarial terms.
On the individual level, the following indicators are of particular interest:
Distribution of old-age pensions paid, according to the amount,
Distribution of newly awarded old-age pensions, according to the amount,
Number of pensions below the set level (poverty level),
Dependency of the newly awarded pension on the amount of the assessment base.
All these indicators can be acquired by processing of the individual results.
Inputs of the Dynamic Micro-Simulation Model The model works with two main types of input data:
Model points and
Decision-making processes (probabilities of transfer between statuses or probabilities of an
event occurrence).
Model Points
The basic input data for the model is the database of model points. One model point represents one
particular individual and puts its input characteristics into the model.
Model points enter the model as a unified database of people who had one of the economic and
marital statuses as of the projection date. Completeness and quality of the database has impact
mainly on the first years of the projection because it describes the current situation. For example, the
amount of pension is almost completely determined by the past development for pensions awarded
shortly after the projection date (duration of insurance and average lifelong assessment base) and is
virtually independent of the development modelled by the decision-making processes. The high-
quality of the input data makes it possible to model the pension expenditure at the beginning of the
projection very accurately.
Decision-Making Processes
The model generates the course of life of an individual (model point) that transfers between the
individual economic statuses (studies, employment, illness, unemployment, taking care of a child,
disability, old-age pension) and marital statuses (single, married, divorced, widowed) using the
decision-making processes.
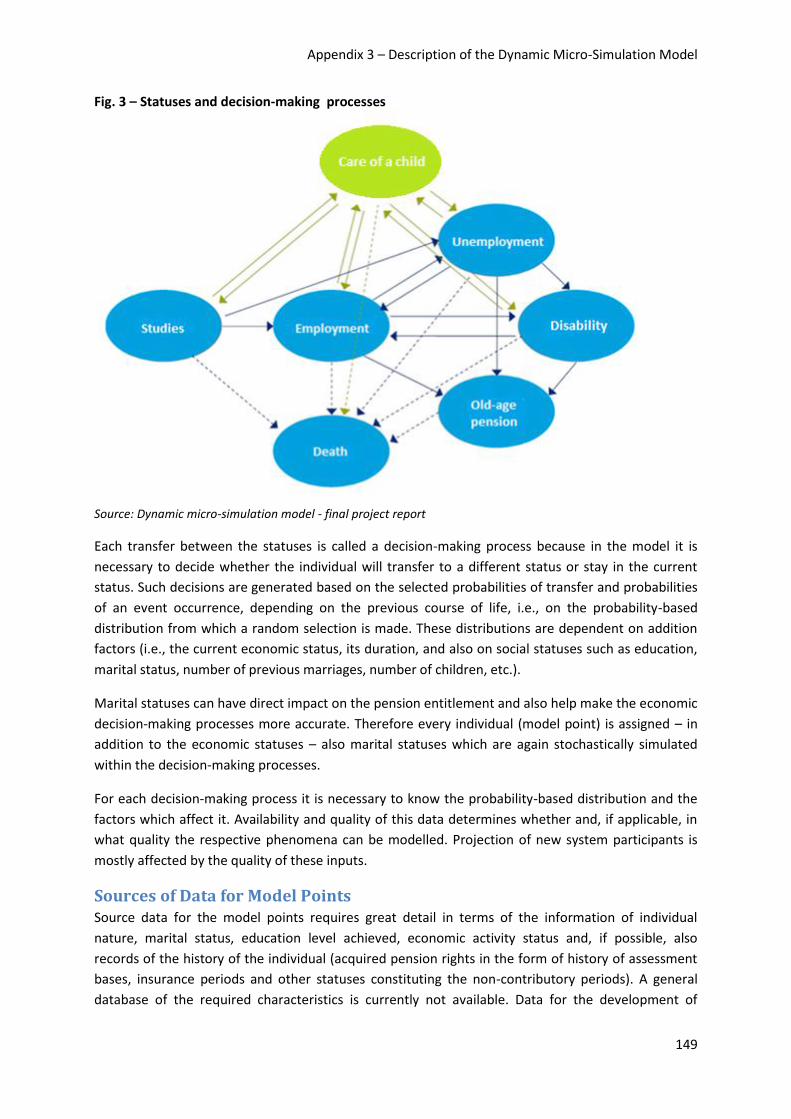
Appendix 3 – Description of the Dynamic Micro-Simulation Model
149
Fig. 3 – Statuses and decision-making processes
Source: Dynamic micro-simulation model - final project report
Each transfer between the statuses is called a decision-making process because in the model it is
necessary to decide whether the individual will transfer to a different status or stay in the current
status. Such decisions are generated based on the selected probabilities of transfer and probabilities
of an event occurrence, depending on the previous course of life, i.e., on the probability-based
distribution from which a random selection is made. These distributions are dependent on addition
factors (i.e., the current economic status, its duration, and also on social statuses such as education,
marital status, number of previous marriages, number of children, etc.).
Marital statuses can have direct impact on the pension entitlement and also help make the economic
decision-making processes more accurate. Therefore every individual (model point) is assigned – in
addition to the economic statuses – also marital statuses which are again stochastically simulated
within the decision-making processes.
For each decision-making process it is necessary to know the probability-based distribution and the
factors which affect it. Availability and quality of this data determines whether and, if applicable, in
what quality the respective phenomena can be modelled. Projection of new system participants is
mostly affected by the quality of these inputs.
Sources of Data for Model Points Source data for the model points requires great detail in terms of the information of individual
nature, marital status, education level achieved, economic activity status and, if possible, also
records of the history of the individual (acquired pension rights in the form of history of assessment
bases, insurance periods and other statuses constituting the non-contributory periods). A general
database of the required characteristics is currently not available. Data for the development of
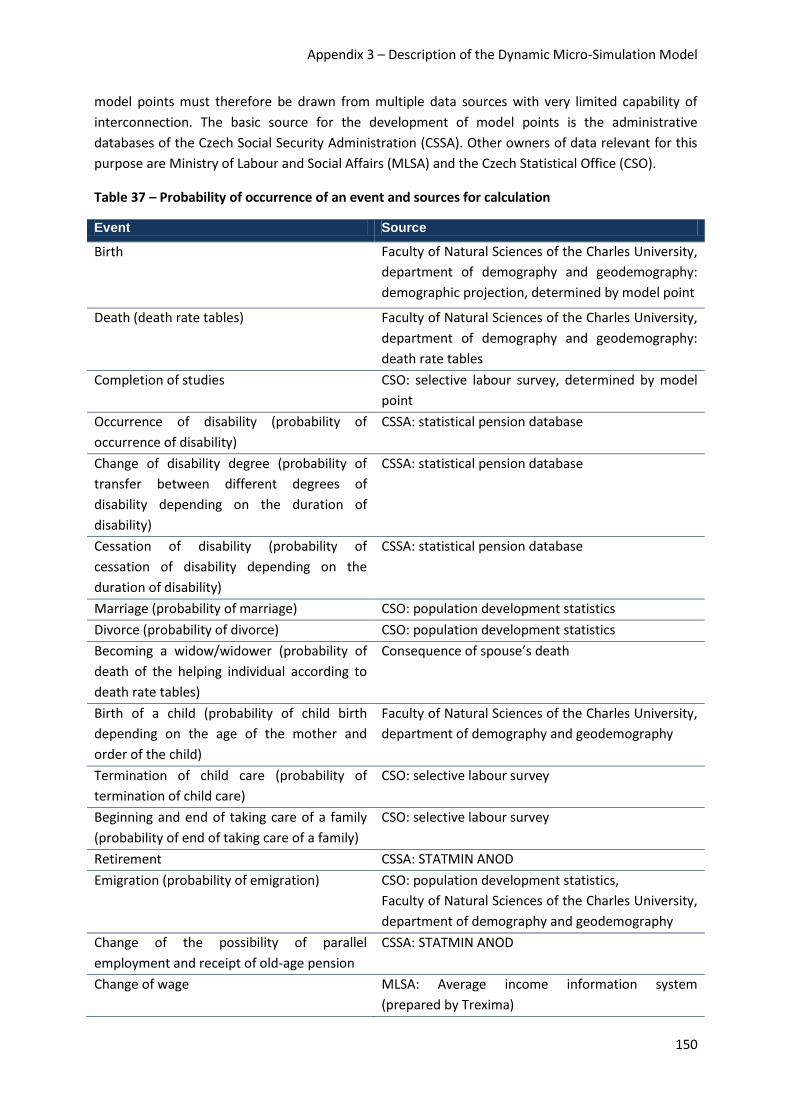
Appendix 3 – Description of the Dynamic Micro-Simulation Model
150
model points must therefore be drawn from multiple data sources with very limited capability of
interconnection. The basic source for the development of model points is the administrative
databases of the Czech Social Security Administration (CSSA). Other owners of data relevant for this
purpose are Ministry of Labour and Social Affairs (MLSA) and the Czech Statistical Office (CSO).
Table 37 – Probability of occurrence of an event and sources for calculation
Event Source
Birth Faculty of Natural Sciences of the Charles University,
department of demography and geodemography:
demographic projection, determined by model point
Death (death rate tables) Faculty of Natural Sciences of the Charles University,
department of demography and geodemography:
death rate tables
Completion of studies CSO: selective labour survey, determined by model
point
Occurrence of disability (probability of
occurrence of disability)
CSSA: statistical pension database
Change of disability degree (probability of
transfer between different degrees of
disability depending on the duration of
disability)
CSSA: statistical pension database
Cessation of disability (probability of
cessation of disability depending on the
duration of disability)
CSSA: statistical pension database
Marriage (probability of marriage) CSO: population development statistics
Divorce (probability of divorce) CSO: population development statistics
Becoming a widow/widower (probability of
death of the helping individual according to
death rate tables)
Consequence of spouse’s death
Birth of a child (probability of child birth
depending on the age of the mother and
order of the child)
Faculty of Natural Sciences of the Charles University,
department of demography and geodemography
Termination of child care (probability of
termination of child care)
CSO: selective labour survey
Beginning and end of taking care of a family
(probability of end of taking care of a family)
CSO: selective labour survey
Retirement CSSA: STATMIN ANOD
Emigration (probability of emigration) CSO: population development statistics,
Faculty of Natural Sciences of the Charles University,
department of demography and geodemography
Change of the possibility of parallel
employment and receipt of old-age pension
CSSA: STATMIN ANOD
Change of wage MLSA: Average income information system
(prepared by Trexima)

Appendix 3 – Description of the Dynamic Micro-Simulation Model
151
CSSA: STATMIN VZ
Becoming / ceasing to be a self-employed
individual
CSO: labour force survey
Source: Dynamic micro-simulation model - final project report
Ideally, the source of data for the calculation of the probabilities of transfer and event occurrence
depending on the relevant factors would be a general (summary) database which would be used for
the development of model points. Such database would include information on the past statuses of
an individual, duration thereof, and transfer to different statuses. The calculation of transfer
probabilities would then be reduced to sorting of the source data according to the relevant factors
and calculation of the respective proportions. Consistency between the model points and the
assumptions for the modelling of the decision-making processes would be ensured automatically.
Probabilities of Transfer between Working Statuses
In general, transfers between working statuses can be divided into two types:
Transfers associated with an event, or
Transfers without an event.
In the first case it involves mostly events which allow an individual to be inactive (such as beginning
of a disability pension or old-age pension, studies, care of a child, and care of family) and the transfer
probabilities in such case represent a one-time response to a specific event. For example, at the time
of becoming eligible for old-age pension benefits there is a high probability of termination of
employment and transfer to inactivity.
The second type represents transfers which occur all the time, independent of events. For example,
for a pensioner who is also working this probability will represent transfer to inactivity. The
probabilities are stated as annual probabilities.
The model works with the following probabilities of transfer between statuses:
Probability of transfer from employment to inactivity associated with an event, according to the
type of event (e.g., upon occurrence of disability, care of child or family, becoming eligible for
old-age pension benefits),
Probability of transfer from employment to inactivity without an event, according to the status
(disability, care of a child, care of family, studies, old-age pension),
Probability of transfer from employment to unemployment associated with an event, according
to the type of event,
Probability of transfer from employment to unemployment without an event, according to the
status,
Probability of transfer from inactivity to employment associated with an event, according to the
type of event,
Probability of transfer from inactivity to employment without an event, according to the status,
Probability of transfer from inactivity to unemployment without an event, according to the
status,
Probability of transfer from unemployment to employment depending on the number of months
unemployed,

Appendix 3 – Description of the Dynamic Micro-Simulation Model
152
Probability of transfer from unemployment to inactivity associated with an event, according to
the type of event,
Probability of transfer from unemployment to inactivity without an event, according to the
status,
Distribution of sickness duration according to the age and gender,
Probability of employment in the case of termination of care of family,
Initial probabilities of the individual degrees of disability,
Probabilities for the choice of the version of pension for working pensioners (full or half pension),
Career-based wage increase.
Data Sources for the Decision-Making Processes The following sources were particularly used for the determination of the assumptions for the
decision-making processes:
MLSA – Unemployment statistics (http://portal.mpsv.cz/sz);
CSSA – sickness insurance benefits records;
CSO – selective labour survey;
CSO – population development statistics; and
CSSA – statistical pension database.
Table 38 – Probability of transfer and sources for the calculation
Unemployed Employed MLSA: Unemployment statistics
(http://portal.mpsv.cz/sz)
Unemployed Inactive CSO: Labour force survey, further categorized according
to the status (disability, care of a child, care of family,
studies, old-age pension) and whether an event changing
the status occurred
Employed Unemployed MLSA: Unemployment statistics
(http://portal.mpsv.cz/sz),
CSO: Labour force survey, further categorized according
to the status (disability, care of a child, care of family,
studies, old-age pension) and here an event changing the
status occurred
Employed Inactive CSO: Selective labour survey, further categorized
according to the status (disability, care of a child, care of
family, studies, old-age pension) and whether an event
changing the status occurred
Inactive Employed CSO: Selective labour survey, further categorized
according to the status (disability, care of a child, care of
family, studies, old-age pension) and here an event
changing the status occurred
Inactive Unemployed CSO: Selective labour survey, further categorized
according to the status (disability, care of a child, care of

Appendix 3 – Description of the Dynamic Micro-Simulation Model
153
family, studies, old-age pension) and here an event
changing the status occurred
Sick Healthy IHIS: records of payment of sickness insurance benefits
Healthy Sick IHIS: records of payment of sickness insurance benefits
Source: Dynamic micro-simulation model - final project report
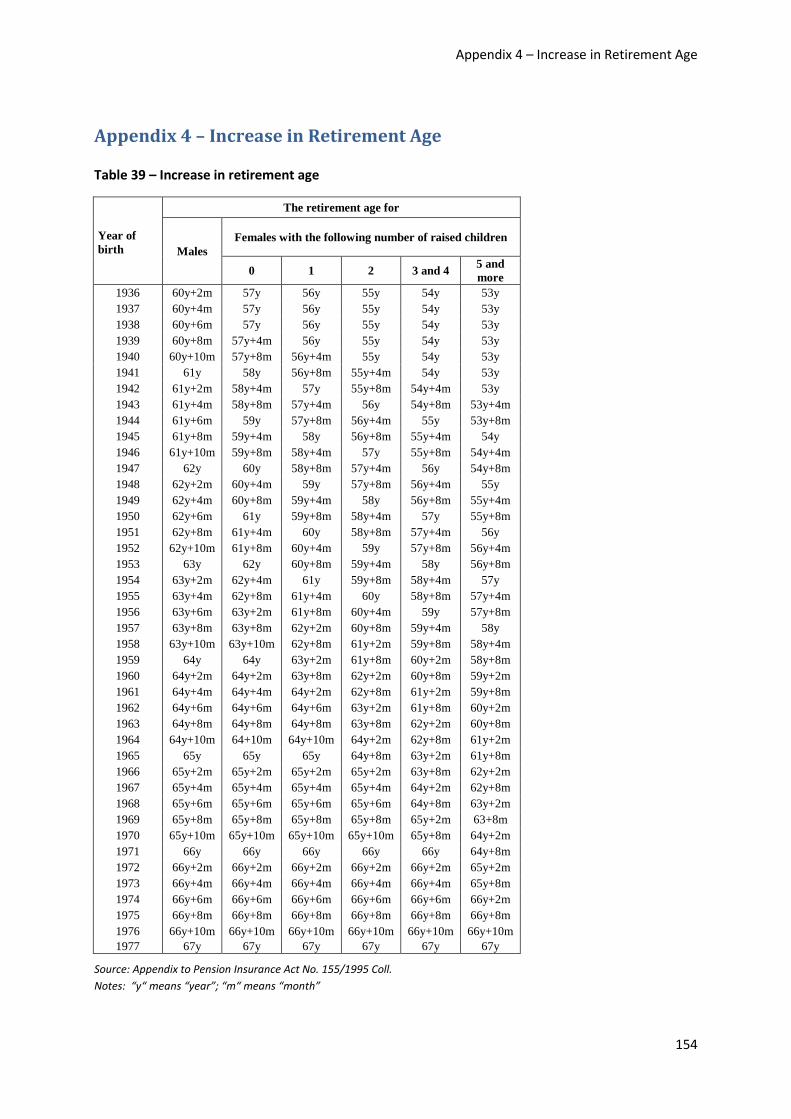
Appendix 4 – Increase in Retirement Age
154
Appendix 4 – Increase in Retirement Age
Table 39 – Increase in retirement age
The retirement age for
Year of
birth Males
Females with the following number of raised children
0 1 2 3 and 4 5 and
more
1936 60y+2m 57y 56y 55y 54y 53y
1937 60y+4m 57y 56y 55y 54y 53y
1938 60y+6m 57y 56y 55y 54y 53y
1939 60y+8m 57y+4m 56y 55y 54y 53y
1940 60y+10m 57y+8m 56y+4m 55y 54y 53y
1941 61y 58y 56y+8m 55y+4m 54y 53y
1942 61y+2m 58y+4m 57y 55y+8m 54y+4m 53y
1943 61y+4m 58y+8m 57y+4m 56y 54y+8m 53y+4m
1944 61y+6m 59y 57y+8m 56y+4m 55y 53y+8m
1945 61y+8m 59y+4m 58y 56y+8m 55y+4m 54y
1946 61y+10m 59y+8m 58y+4m 57y 55y+8m 54y+4m
1947 62y 60y 58y+8m 57y+4m 56y 54y+8m
1948 62y+2m 60y+4m 59y 57y+8m 56y+4m 55y
1949 62y+4m 60y+8m 59y+4m 58y 56y+8m 55y+4m
1950 62y+6m 61y 59y+8m 58y+4m 57y 55y+8m
1951 62y+8m 61y+4m 60y 58y+8m 57y+4m 56y
1952 62y+10m 61y+8m 60y+4m 59y 57y+8m 56y+4m
1953 63y 62y 60y+8m 59y+4m 58y 56y+8m
1954 63y+2m 62y+4m 61y 59y+8m 58y+4m 57y
1955 63y+4m 62y+8m 61y+4m 60y 58y+8m 57y+4m
1956 63y+6m 63y+2m 61y+8m 60y+4m 59y 57y+8m
1957 63y+8m 63y+8m 62y+2m 60y+8m 59y+4m 58y
1958 63y+10m 63y+10m 62y+8m 61y+2m 59y+8m 58y+4m
1959 64y 64y 63y+2m 61y+8m 60y+2m 58y+8m
1960 64y+2m 64y+2m 63y+8m 62y+2m 60y+8m 59y+2m
1961 64y+4m 64y+4m 64y+2m 62y+8m 61y+2m 59y+8m
1962 64y+6m 64y+6m 64y+6m 63y+2m 61y+8m 60y+2m
1963 64y+8m 64y+8m 64y+8m 63y+8m 62y+2m 60y+8m
1964 64y+10m 64+10m 64y+10m 64y+2m 62y+8m 61y+2m
1965 65y 65y 65y 64y+8m 63y+2m 61y+8m
1966 65y+2m 65y+2m 65y+2m 65y+2m 63y+8m 62y+2m
1967 65y+4m 65y+4m 65y+4m 65y+4m 64y+2m 62y+8m
1968 65y+6m 65y+6m 65y+6m 65y+6m 64y+8m 63y+2m
1969 65y+8m 65y+8m 65y+8m 65y+8m 65y+2m 63+8m
1970 65y+10m 65y+10m 65y+10m 65y+10m 65y+8m 64y+2m
1971 66y 66y 66y 66y 66y 64y+8m
1972 66y+2m 66y+2m 66y+2m 66y+2m 66y+2m 65y+2m
1973 66y+4m 66y+4m 66y+4m 66y+4m 66y+4m 65y+8m
1974 66y+6m 66y+6m 66y+6m 66y+6m 66y+6m 66y+2m
1975 66y+8m 66y+8m 66y+8m 66y+8m 66y+8m 66y+8m
1976 66y+10m 66y+10m 66y+10m 66y+10m 66y+10m 66y+10m
1977 67y 67y 67y 67y 67y 67y
Source: Appendix to Pension Insurance Act No. 155/1995 Coll.
Notes: “y“ means “year”; “m“ means “month”

Appendix 5 – List of Abbreviations
155
Appendix 5 – List of Abbreviations
CNB…………..Czech National Bank
Coll……………Collection of laws (CR)
CR…………….Czech Republic
CRC………….Central Register of Contracts
CSO………….Czech Statistical Office
CSSA………..Czech Social Security Administration
CZK………….Czech crown
EU/EC……….European Union/European Communities
GAB …………general assessment base
GDP………… Gross Domestic Product
IHIS…………..Institute of Health Information and Statistics of the Czech Republic
ILO…………...International Labour Organization
MF……………Ministry of Finance
MLSA…….…Ministry of Labour and Social Affairs of the Czech Republic
OECD………..Organization for Economic Co-operation and Development
RL……………..reduction limit
URA………….Unified Revenue Collection Agency
WWII………..World War II
156
List of Charts
Chart 1 – The process of increase in the retirement age ........................................................................ 9
Chart 2 – Numbers of old-age pensioners receiving reduced old-age pensions .................................. 27
Chart 3 – Development of the share of newly granted old-age pensions in the total number of newly
granted pensions (%) ............................................................................................................................. 31
Chart 4 – Development of the real values of the average old-age pension and the average wage as %
of their values in 1989 ........................................................................................................................... 36
Chart 5 – Average amount of solo old-age pensions paid in December 2011 by the year in which they
were granted ......................................................................................................................................... 38
Chart 6 - Average amounts of newly granted old-age pensions ........................................................... 41
Chart 7 - Share of +65 people in the total population .......................................................................... 45
Chart 8 – Retirement age and its increase in selected countries .......................................................... 46
Chart 9 – Retirement age of men in EU and OECD countries (2010) .................................................... 47
Chart 10 - Retirement age of women in EU and OECD countries (2010) .............................................. 47
Chart 11 – Differences between the retirement ages of men and women in years (2010) ................. 47
Chart 12 – Employment rates in the 55 - 64 years age group (2010) ................................................... 48
Chart 13 – Average age of exit from the labour market (2009) ............................................................ 49
Chart 14 – Difference between the actual retirement age and the statutory retirement age ............. 50
Chart 15 – Pension-drawing time - men (years) .................................................................................... 50
Chart 16 - Pension-drawing time - women (years) ............................................................................... 50
Chart 17 – Difference between pension-drawing times of men and women ....................................... 51
Chart 18 – Gross replacement rate ....................................................................................................... 52
Chart 19 – Net replacement rate .......................................................................................................... 52
Chart 20 – Aggregate replacement ratio (2009, 2010)8 ........................................................................ 52
Chart 21 – Gini coefficient in OECD countries ....................................................................................... 53
Chart 22 – Progressivity index in OECD countries ................................................................................. 53
Chart 23 – Costs of pension systems in EU countries as a percentage of GDP (2010) ......................... 54
Chart 24 – Old-age pension to previous wage ratio .............................................................................. 55
Chart 25 – Class 3 disability pension to previous wage ratio ................................................................ 57
Chart 26 – Survivors’ pensions to previous wage ratio ......................................................................... 58
Chart 27 – Total fertility rate and average age at childbirth ................................................................. 61
Chart 28 – Completed cohort fertility rate ............................................................................................ 62
Chart 29 – Cohort fertility rates ............................................................................................................ 63
Chart 30 – Life expectancy at birth – men ............................................................................................ 64
Chart 31 - Life expectancy at birth – women ........................................................................................ 64
Chart 32 – Mortality rates - men ........................................................................................................... 64
Chart 33 - Mortality rates - women ....................................................................................................... 64
Chart 34 – Decline of mortality rates for different generations - men ................................................. 65
Chart 35 - Decline of mortality rates for different generations - women ............................................. 65
Chart 36 – Probability of survival until different ages – men ................................................................ 65
Chart 37 - Probability of survival until different ages – women ........................................................... 65
Chart 38 – Age structure of population – reality................................................................................... 66
157
Chart 39 – Age structure of the population – anticipated development .............................................. 67
Chart 40 – Percentage shares of the basic population groups by the year .......................................... 68
Chart 41 - Percentage shares of the basic population groups by age group ........................................ 69
Chart 42 – Average age of exit from the labour market ....................................................................... 70
Chart 43 – Total employment (million) ................................................................................................. 70
Chart 44 – Employment structure by type ............................................................................................ 71
Chart 45 - Employment structure by age .............................................................................................. 72
Chart 46 – Employment structure by gender ........................................................................................ 72
Chart 47 – Total employment rate in the 20 - 64 years age group ....................................................... 73
Chart 48 – Employment rate in the 20 - 64 years age group - women ................................................. 74
Chart 49 - Employment rate in the 55 - 64 years age group ................................................................. 74
Chart 50 – Total unemployment (1,000) ............................................................................................... 75
Chart 51 – Unemployment by the type ................................................................................................. 76
Chart 52 – Unemployment by age ........................................................................................................ 76
Chart 53 - Unemployment by gender .................................................................................................... 77
Chart 54 – Unemployment rate development ...................................................................................... 78
Chart 55 - Unemployment rates in the 15 - 24 years age group ........................................................... 78
Chart 56 - Unemployment rates in the 55 - 64 years age group ........................................................... 79
Chart 57 – Real growth of labour productivity ...................................................................................... 80
Chart 58 – Real growth of the average wage ........................................................................................ 80
Chart 59 – Wage as % of the average wage by age ............................................................................... 81
Chart 60 – Wage as % of the average wage by gender ......................................................................... 81
Chart 61 – Real GDP growth .................................................................................................................. 82
Chart 62 - Real GDP per capita growth.................................................................................................. 83
Chart 63 – Revenues from contributions as % of GDP .......................................................................... 84
Chart 64 – Pension expenditure as % of GDP ........................................................................................ 85
Chart 65 – Balance of revenues from contributions and pension expenditure, including administration
costs, as % of GDP ................................................................................................................................. 86
Chart 66 – Cumulative balance (explicit debt) as % of GDP .................................................................. 87
Chart 67 – Implicit debt as % of GDP ..................................................................................................... 87
Chart 68 – Total debt as % of GDP ........................................................................................................ 88
Chart 69 – Explicit debt and implicit debt shares .................................................................................. 88
Chart 70 – Average old-age pension as % of the average wage ........................................................... 89
Chart 71 – Effects of the existence of reduced early old-age pensions on the average old-age pension
to average wage ratio, in % ................................................................................................................... 90
Chart 72 – Aggregate replacement ratio8 in % ...................................................................................... 91
Chart 73 – Average newly granted old-age pensions as % of the average wage .................................. 92
Chart 74 – Average personal assessment base as % of the average wage ........................................... 92
Chart 75 – Average calculation base as % of the average wage ........................................................... 93
Chart 76 – Pension expenditure by type of pension ............................................................................. 94
Chart 77 – Percentage shares of expenditure on different types of pensions ..................................... 94
Chart 78 – Total number of old-age pensioners ................................................................................... 95
Chart 79 – Old-age pensioners by the gender ....................................................................................... 96
Chart 80 - Old-age pensioners by the age and gender .......................................................................... 97
Chart 81 - Total number of disability pensioners (1,000) ..................................................................... 97
158
Chart 82 – Percentage shares of disability pensioners by the disability class ...................................... 98
Chart 83 - Percentage shares of disability pensioners by the disability class and gender .................... 98
Chart 84 - Percentage shares of disability pensioners by the age and disability class ......................... 99
Chart 85 - Percentage shares of disability pensioners by the age, disability class and gender ............ 99
Chart 86 – Implicit debt by age as % of GDP (2012) ............................................................................ 100
Chart 87 – Implicit debt vs. age by the gender as % of GDP (2012) .................................................... 101
Chart 88 – Amounts of old-age pensions (not including survivors’ pensions) of men and women as %
of the average pension ........................................................................................................................ 101
Chart 89 – Amounts of old-age pensions (not including survivor pensions) as % of the average
pension by age ..................................................................................................................................... 102
Chart 90 – Average insurance period at the time the old-age pension is granted ............................. 103
Chart 91 – Credited insurance period by age at different years ......................................................... 104
Chart 92 - Credited insurance period by age and gender ................................................................... 104
Chart 93 – Share of people who have not yet accumulated the minimum insurance period required to
establish an old-age pension right at different years, % ..................................................................... 105
Chart 94 - Average contributions payment period at the time the old-age pension is granted ......... 106
Chart 95 – Average contributions payment period as % of the average insurance period at the time
the old-age pension is granted ............................................................................................................ 106
Chart 96 – Pension expenditure as % of GDP ...................................................................................... 107
Chart 97 – Balance of revenues from insurance contributions and pension expenditure, including
administration costs, as % of GDP ....................................................................................................... 108
Chart 98 – Cumulative balance (explicit debt) as % of GDP ................................................................ 108
Chart 99 – Implicit debt as % of GDP ................................................................................................... 109
Chart 100 – Total debt as % of GDP .................................................................................................... 109
Chart 101 – Average old-age pension as % of the average wage ....................................................... 110
Chart 102 – Structure of entrants by age – total ................................................................................ 111
Chart 103 – Structure of entrants by age – total ................................................................................ 111
Chart 104 – Increase of the implicit debt by age as % of GDP - total ................................................. 112
Chart 105 - Structure of entrants by age – men .................................................................................. 112
Chart 106 - Structure of entrants by age – men .................................................................................. 112
Chart 107 - Structure of entrants by age – women ............................................................................. 113
Chart 108 - Structure of entrants by age – women ............................................................................. 113
Chart 109 - Increase of the implicit debt by age as % of GDP - men ................................................... 113
Chart 110 - Increase of the implicit debt by age as % of GDP - women .............................................. 113
Chart 111 – Structure of entrants by their starting earnings – total .................................................. 115
Chart 112 – Structure of entrants who will be granted an old-age pension in future by their starting
earnings – total .................................................................................................................................... 116
Chart 113 - Structure of entrants by their personal assessment bases – total .................................. 117
Chart 114 - Structure of entrants by the starting earnings – men ...................................................... 118
Chart 115 - Structure of entrants by the starting earnings – women ................................................. 118
Chart 116 - Structure of entrants who will be granted an old-age pension in future by the starting
earnings – men .................................................................................................................................... 119
Chart 117 - Structure of entrants who will be granted an old-age pension in future by the starting
earnings – women ............................................................................................................................... 119
Chart 118 - Structure of entrants by the personal assessment base – men ....................................... 120
159
Chart 119 - Structure of entrants by the personal assessment base – women .................................. 120
Chart 120 – Structure of entrants by their insurance periods – total ................................................. 121
Chart 121 – Percentage shares of persons who have accumulated given insurance periods - total . 121
Chart 122 - Structure of entrants by the insurance period – men ...................................................... 122
Chart 123 - Structure of entrants by the insurance period – women ................................................. 122
Chart 124 - Percentage shares of individuals who have accumulated given insurance periods - men
............................................................................................................................................................. 122
Chart 125 - Percentage shares of individuals who have accumulated given insurance periods - women
............................................................................................................................................................. 122
Chart 126 – Types of pensions by the insurance period – total .......................................................... 123
Chart 127 – Structure of entrants by their pension types – total ....................................................... 123
Chart 128 – Pension types by the pension type – men ....................................................................... 124
Chart 129 - Pension types by the pension type – women ................................................................... 124
Chart 130 - Structure of entrants by the pension type granted - men ............................................... 124
Chart 131 - Structure of entrants by the pension type granted - women .......................................... 124
Chart 132 - Structure of entrants by their contributions payment periods - total ............................. 125
Chart 133 – Percentage shares of persons who have paid insurance contributions for a given time –
total ..................................................................................................................................................... 125
Chart 134 - Structure of entrants by the contributions payment period – men................................. 126
Chart 135 – Structure of entrants by the contributions payment period – women ........................... 126
Chart 136 - Percentage shares of persons who have paid insurance contributions for a given period –
men ...................................................................................................................................................... 126
Chart 137 - Percentage shares of persons who have paid insurance contributions for a given period –
women ................................................................................................................................................. 126
Chart 138 - Structure of entrants by their excluded periods - total.................................................... 127
Chart 139 – Percentage shares of persons with defined amounts of excluded periods - total .......... 128
Chart 140 - Structure of entrants by the excluded period - men ........................................................ 128
Chart 141 - Structure of entrants by the excluded period - women ................................................... 128
Chart 142 - Percentage shares of persons with defined amounts of excluded periods – men .......... 129
Chart 143 - Percentage shares of persons with defined amounts of excluded periods – women ..... 129
160
List of Tables
Table 1 – Pension insurance revenues and pension expenditure (CZK billion)..................................... 24
Table 2 – Special pension insurance account (CZK million)................................................................... 25
Table 3 – Pension expenditure1 by the pension type (CZK billion) ....................................................... 25
Table 4 - Numbers of pensioners1) by the pension type (1,000) ........................................................... 26
Table 5 - Share of old-age pensioners receiving a reduced old-age pension after reaching the
retirement age in the total number of pensioners receiving reduced old-age pensions ..................... 27
Table 6 - Average age of pensioners1 .................................................................................................... 28
Table 7 - Number of pensioners to number of insured persons ratio .................................................. 29
Table 8 – Number of pensions paid out (1,000) .................................................................................... 29
Table 9 – Pensions remitted to beneficiaries abroad............................................................................ 30
Table 10 – Number of newly granted pensions .................................................................................... 30
Table 11 – Average retirement age ....................................................................................................... 32
Table 12 – Retirement ages establishing the right to an old-age pension in 2007 and 2011 ............... 32
Table 13 – Number of terminated pensions ......................................................................................... 33
Table 14 – Review of increases of pensions paid out to beneficiaries .................................................. 34
Table 15 – Average monthly amounts1) of solo pensions (CZK) ............................................................ 34
Table 16 – Relation between the average old-age pension and the average wage ............................. 35
Table 17 – Development of the real value of the average old-age pension paid to beneficiaries ....... 36
Table 18 – Average amount of solo old-age pensions by the period in which they were granted
(pensions paid in December 2011, CZK) ................................................................................................ 37
Table 19 - Reduction limits applying to the calculation of pensions ..................................................... 39
Table 20 – Reduction of the personal assessment base and reduction limits ...................................... 39
Table 21 – Development of the newly granted old-age pension to wage ratio for different pension
amounts and after 40 years of insurance period (in %) ........................................................................ 40
Table 22 – Average amounts of newly granted pensions ..................................................................... 40
Table 23 – Reductions of permanently reduced early retirement old-age pensions granted in 2011 for
retirements taken one year*) prior to the regular retirement date (in %) ........................................... 41
Table 24 - Basic differentiation in the amounts of solo old-age pensions ............................................ 43
Table 25 - Characteristics of the differentiation in amounts of old-age pensions paid in December
2011 by the reduction type ................................................................................................................... 43
Table 26 – Basic differentiation of newly granted (solo) old-age pensions by their amount ............... 44
Table 27 – Compliance with ILO Conventions in the field of old-age pensions .................................... 55
Table 28 - Compliance with ILO Conventions in the field of disability pensions (class 3) ..................... 56
Table 29 - Compliance with ILO Conventions in the field of survivors’ pensions ................................. 57
Table 30 – Division of individuals into deciles according to their starting earnings (in average wage
multiples) – total ................................................................................................................................. 114
Table 31 - Division of individuals who will be granted an old-age pension in future into deciles
according to their starting earnings (in average wage multiples) – total ........................................... 115
Table 32 - Division of individuals into deciles according to their personal assessment bases (in
average wage multiples) – total .......................................................................................................... 116
Table 33 - Division of individuals into deciles according to their starting earnings (in average wage
multiples) – men and women ............................................................................................................. 117
161
Table 34 - Division of individuals who will be granted an old-age pension in future into deciles
according to their starting salaries (in average wage multiples) – men and women ......................... 118
Table 35- Division of individuals into deciles according to their personal assessment bases (in average
wage multiples) – total ........................................................................................................................ 119
Table 36 – Determining the yearly assessment bases ........................................................................ 134
Table 37 – Probability of occurrence of an event and sources for calculation ................................... 150
Table 38 – Probability of transfer and sources for the calculation ..................................................... 152
Table 39 – Increase in retirement age ................................................................................................. 154
List of Figures
Fig. 1 – Chart of the saving phase of the pension savings system ........................................................ 19
Fig. 2 - Chart of the disbursement phase of the pension savings system ............................................. 22
Fig. 3 – Statuses and decision-making processes ............................................................................... 149