active nz - sport new zealand · sport is associated with being competitive, but individuals differ...
TRANSCRIPT

ACTIVE NZMAIN REPORT— THE NEW ZEALAND PARTICIPATION SURVEY 2017

ACKNOWLEDGEMENTS Many people have contributed to the development and implementation of our new Active NZ survey, and we thank you for your expertise, support and guidance. We express special thanks to previous and current Sport New Zealand (Sport NZ) researchers, Intelligence team members and our research partner, Nielsen.
Within Sport NZ, special thanks also go to Janette Brocklesby, who has led the extensive work to redevelop and reinvigorate Active NZ.
Finally, we would like to thank everyone across New Zealand who took the time to take part in the research. Without their willing contribution this report would not have been possible. Their input has been invaluable in providing Sport NZ, our partners and providers with important insights into how we can improve the accessibility and quality of sport and active recreation.
AUTHORS The principal author of this report is Janette Brocklesby, working alongside Glen McCarty and others at Sport NZ and Nielsen.
CITATION Sport New Zealand, 2018
Active NZ 2017 Participation Report. Wellington: Sport New Zealand
ISBN: 978-0-947502-73-7
Published in 2018 by Sport New Zealand.
Download this report at sportnz.org.nz/ActiveNZ
WANT TO FIND OUT MORE? The following Active NZ resources are also available at sportnz.org.nz/ActiveNZ
≠ Detailed data tables supporting the report
≠ Technical report for more detail on design, method, data treatment and questionnaires.
Contact: [email protected]

Appendices A–C PAGE 50
CONTENTS
PARTICIPATIONHOW MANY, WHO AND HOW MUCH PARTICIPATION HAPPENS IN ANY GIVEN WEEK?
WHY TIME SPENT PARTICIPATING MATTERSWHY IS THE AMOUNT OF TIME SPENT PARTICIPATING IMPORTANT?
MOTIVATIONWHAT MOTIVATES PARTICIPATION?
HOW PEOPLE PARTICIPATEHOW DO PEOPLE PARTICIPATE?
HURDLESWHAT GETS IN THE WAY OF PARTICIPATING?
YOUNG PEOPLESPOTLIGHT ON YOUNG PEOPLE’S PARTICIPATION
PAGE 11
PAGE 19
PAGE 37
PAGE 25
PAGE 45
PAGE 31
0102
05
03
06
04
Foreword PAGE 2 Glossary PAGE 4 About this report PAGE 5 Key findings PAGE 7
1
SPORT NEW ZEALAND

This is the fourth time Sport NZ has carried out a nationwide participation survey. However, it is the first time since 2011 that we have reported young people’s participation and the very first time we have surveyed young people and adults together.
The results in this report are based on data collected through the Active NZ survey between 5 January 2017 and 4 January 2018 from 6,004 young people (aged 5–17) and 27,038 adults (aged 18+).
Through the up-to-date evidence in this report – gathered through a fresh participant focus and a continuous survey approach – we now have a better understanding of participants and non-participants alike, as well as the overall landscape of participation in sport and active recreation in New Zealand.
So, what does it tell us? Importantly, it tells us that sport and active recreation continue to play a key role in New Zealanders’ lives. In any given week, 95 per cent of young people and 73 per cent of adults participate. Young people spend an average of 11 hours participating in 5.4 sports and activities, while adults average 5.3 hours across 2.3 sports and activities.
Weekly participation, average time spent participating and the average number of sports and activities peak between ages 12–14 before declining between ages 15–17. Participation is then relatively stable throughout adult years before declining again from age 65.
Yet while these weekly averages may appear high, participation is under pressure. In 2016, we reported a 7.7 per cent decline in adult participation over a 16-year period between 1998 and 2014, and this report shows barriers to participation persist.
Despite these challenges, the main findings in this report clearly show that people of all ages in New Zealand have an appetite for increasing their participation and highlight diversity in the ways population groups engage in sport and active recreation. Sport NZ and its partners will use Active NZ to inform future planning, and there will be more reports to come on topics that explore the needs and wants specific to different participant groups – based, for instance, on age and ethnicity.
Finally, I would like to thank everyone involved in developing and implementing the survey, including previous and current Sport NZ researchers, Intelligence team members, our research partner Nielsen, together with the thousands of people who took the time to contribute.
PETER MISKIMMIN CHIEF EXECUTIVE SPORT NZ
SPORT NZ IS PLEASED TO RELEASE THE FIRST RESULTS FROM ITS REDESIGNED 2017 ACTIVE NZ SURVEY.
2
ACTIVE NZ 2017

It is the first time since 2011 we have reported young people’s participation and the very first time we have surveyed young people and adults together.”
– Peter Miskimmin, Chief Executive, Sport NZ
“

GLOSSARY
RESPONDENTSPeople who took part in the survey.
ADULTSRespondents aged 18+.
YOUNG PEOPLE Respondents aged 5–17.
PARTICIPANTSPeople who have been physically active in sport or recreation in the past seven days, where this participation excludes any physical activity undertaken for work or chores. Participation can include physical activity undertaken to get from one place to another (active transport) if the respondent considers it to be for sport or active recreation.
NON-PARTICIPANTSPeople who have not been physically active in sport or recreation in the past seven days.
PARTICIPATION IN COMPETITIVE AND NON-COMPETITIVE SPORTS OR ACTIVITIESParticipating through an organised structure, e.g. in a league or club competition, tournament or competitive event. Non-competitive participation refers to sports or activities undertaken outside of a league or club competition, tournament or competitive event.
ORGANISED PARTICIPATIONApplies to young people only. Participation in a competition or tournament is one component of organised participation.
Other organised sports and activities include being physically active in physical education or class at school, sport and activities undertaken in a competition and training, or practising with a coach or instructor.
INFORMAL PARTICIPATIONApplies to young people only.
Informal sports and activities include being physically active through play with others, playing alone, extra training activities, or practising without a coach or instructor.
SPORT AND ACTIVE RECREATIONSport and active recreation is used throughout this report for simplicity. However, participation is multifaceted. Sport can be undertaken in an organised structure, e.g, in a competition or tournament or informally outside an organised structure. Sport is associated with being competitive, but individuals differ in their degree of competitiveness irrespective of how they participate. Active recreation is a term used by Sport NZ to capture participation in activities not considered to be sport, e.g, play, dance or tramping.
WEEKLY PARTICIPATIONRefers to being physically active in sport and active recreation at least once in the past seven days.
ETHNICITYWhen referring to results by ethnicity throughout this report – European, M-aori, Pacific (including Samoan) and Asian (including Indian and Chinese) – this is based on respondents’ self-identification.
ACTIVE NZ 2017
4

The redesigned Active NZ survey, puts the participant front and centre and is based on extensive qualitative research, cognitive testing and piloting, to ensure the voices of both participants and non-participants are heard.
It is based on data collected through the Active NZ survey between 5 January 2017 and 4 January 2018 among 6,004 young people (aged 5–17) and 27,038 adults (aged 18+). 1
This report covers a selection of results from the survey and will be supported by a progressive release of up-to-date information and insights on participation. It focuses on:
≠ How much participation happens in any given week – how many people are participating and who they are
≠ The relationship between increasing time spent participating and benefits to individuals
≠ How people participate
≠ What motivates them to participate
≠ What gets in the way of participating.
This report also highlights the differences (and similarities) between young people’s and adults’ participation and draws attention to variation by gender and ethnicity.
It should be noted that results have been drawn from two separate surveys and data sets: one for young people aged 5–17 and one for adults 18+. When there is commentary about differences between young people and adults, comments are based on observations rather than statistical testing between the two data sets.
Within the two data sets, reported differences between the total result and sub-groups are statistically significant at the 95 per cent confidence level. Significance testing means we can be sure that the differences reported are not due to random variation because we are using a sample and not conducting a population census.
Knowing a difference is statistically significant does not mean the difference is important, and only meaningful differences have been commented on.
Data tables accompanying the report contain all base sizes and highlight all statistically significant differences at the 95 per cent confidence level. 2
ACTIVE NZ YEAR 1 PARTICIPATION REPORT
This report provides a snapshot of participation in sport and active recreation in 2017 by people aged 5+. It also resets New Zealand’s participation baselines using a new method.
ABOUT THIS REPORT
1. For further information on method, sample and objectives, see Appendix C and the Technical Report. 2. For more detail on statistical testing, refer to the Technical Report.
5
SPORT NEW ZEALAND

7
SPORT NEW ZEALAND
KEY FINDINGS The results are based on data collected between 5 January 2017 and 4 January 2018 from 6,004 young people (aged 5–17) and 27,038 adults (aged 18+).
Active NZ provides a point-in-time snapshot of participation. This is explored through the lenses of age, gender, ethnicity and deprivation, with the key out-takes being:
PARTICIPATION
01Young people are much more active than adults. In any given week, 95 per cent of young people and 73 per cent of adults participate. Young people spend an average of 11 hours participating in 5.4 sports and activities, while adults average 5.3 hours in 2.3 sports and activities.
04 Participation peaks between ages 12–14. This age group tops all others for overall weekly participation, time spent participating and participation in competitive sports and activities, and takes part in the most sports and activities.
08 Three out of four young people aged 15–17 want to do more, but other commitments or being busy get in the way. Their lack of energy and self-motivation is above average for all young people.
07 Those aged 12–14 have above average desire to increase their participation: three in four want to participate more.
03Young people are most likely to participate for fun and adults for physical wellbeing.
06Weekly participation is relatively stable throughout adult years before declining from age 65, yet adults do not regain the high levels of participation of their youth.
05 The first significant drop in weekly participation occurs at ages 15–17, when the number of sports and activities and time spent participating also decline.
02Participants and non-participants want to participate more. Sixty-four per cent of young people and 74 per cent of adults want to increase their participation.

8
ACTIVE NZ 2017
GENDER
12 On average, males spend more time participating than females, but this varies with age. Between ages 15–17, 25–34 and 50–74 no gender difference exists in time spent participating.
15No gender difference exists in weekly participation in competitive sports and activities between ages 8–17. At all other ages, male participation exceeds females.
13 On average, females of all ages are more likely than males to want to participate more.
16 Young females are more likely than males to be motivated by physical wellbeing, and this appears to emerge between ages 12–17.
11On average, no difference exists in weekly participation by gender, however, between ages 50–64 more females participate.
14 No gender difference exists in weekly participation in non-competitive sports and activities for young people. It is in the adult years when females are more likely than males to take part in non-competitive sports and activities.
17 Male and female adults are equally likely to participate for physical wellbeing. Adult males are more likely to participate for fun.
18 On average, young males and females are equally likely to participate for fun, but it appears that, between ages 15–17, males participate for fun more so than females.
10Other commitments and a lack of energy and self-motivation are significant barriers for those aged 18–49. Other commitments peak between ages 25–49 and lack of energy and self-motivation are significant between ages 18–24.
09 The amount of time adults spend participating varies, and it is between ages 18–49 when the desire to do more is higher.
9
SPORT NEW ZEALAND
DEPRIVATION
WHY IS THE AMOUNT OF TIME SPENT PARTICIPATING IMPORTANT?
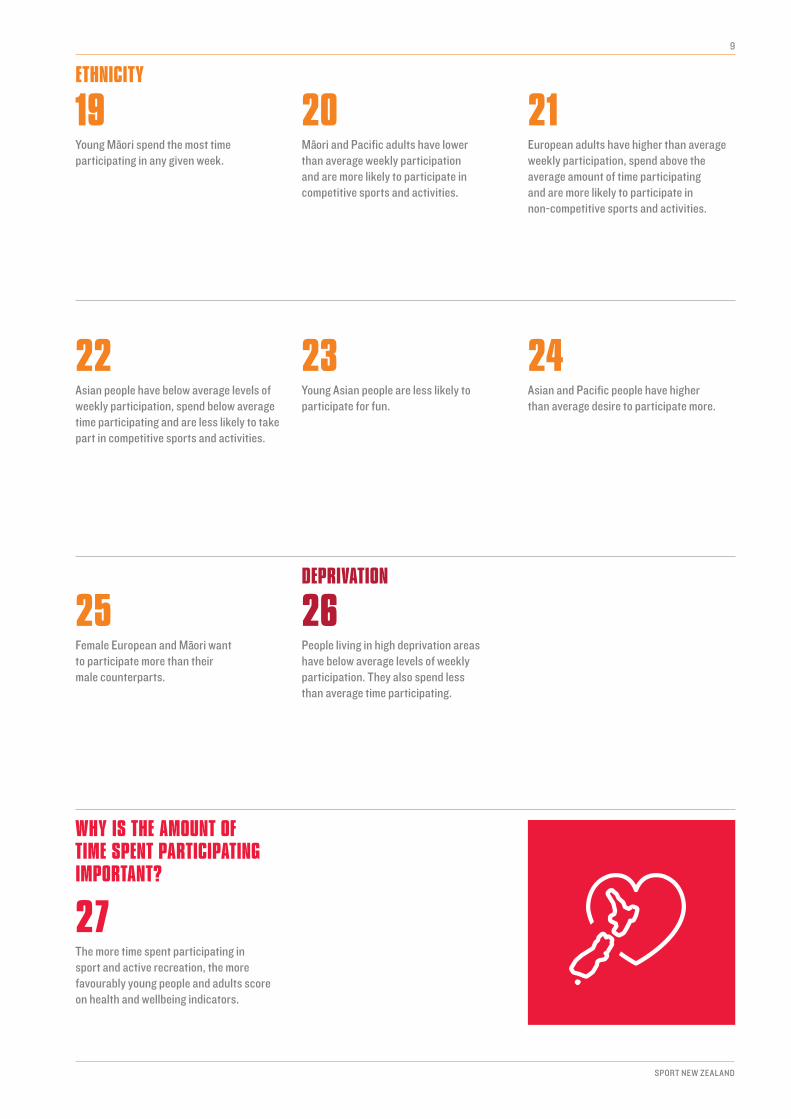
20 Ma-ori and Pacific adults have lower than average weekly participation and are more likely to participate in competitive sports and activities.
21 European adults have higher than average weekly participation, spend above the average amount of time participating and are more likely to participate in non-competitive sports and activities.
24 Asian and Pacific people have higher than average desire to participate more.
19 Young Ma-ori spend the most time participating in any given week.
25 Female European and Ma-ori want to participate more than their male counterparts.
22 Asian people have below average levels of weekly participation, spend below average time participating and are less likely to take part in competitive sports and activities.
27 The more time spent participating in sport and active recreation, the more favourably young people and adults score on health and wellbeing indicators.
26 People living in high deprivation areas have below average levels of weekly participation. They also spend less than average time participating.
23 Young Asian people are less likely to participate for fun.
ETHNICITY


PARTICIPATIONThis section describes how many people in New Zealand are participating, who they are and how much they are participating in any given week.
01
SPORT NEW ZEALAND
11

95% 95 per cent of young people aged 5 to 17 take part in sport and active recreation.
PARTICIPATION FIGURE 1WEEKLY PARTICIPATION IN SPORT AND ACTIVE RECREATION (PAST SEVEN DAYS).
In any given week throughout the year, 95 per cent of young people and 73 per cent of adults participate.
12
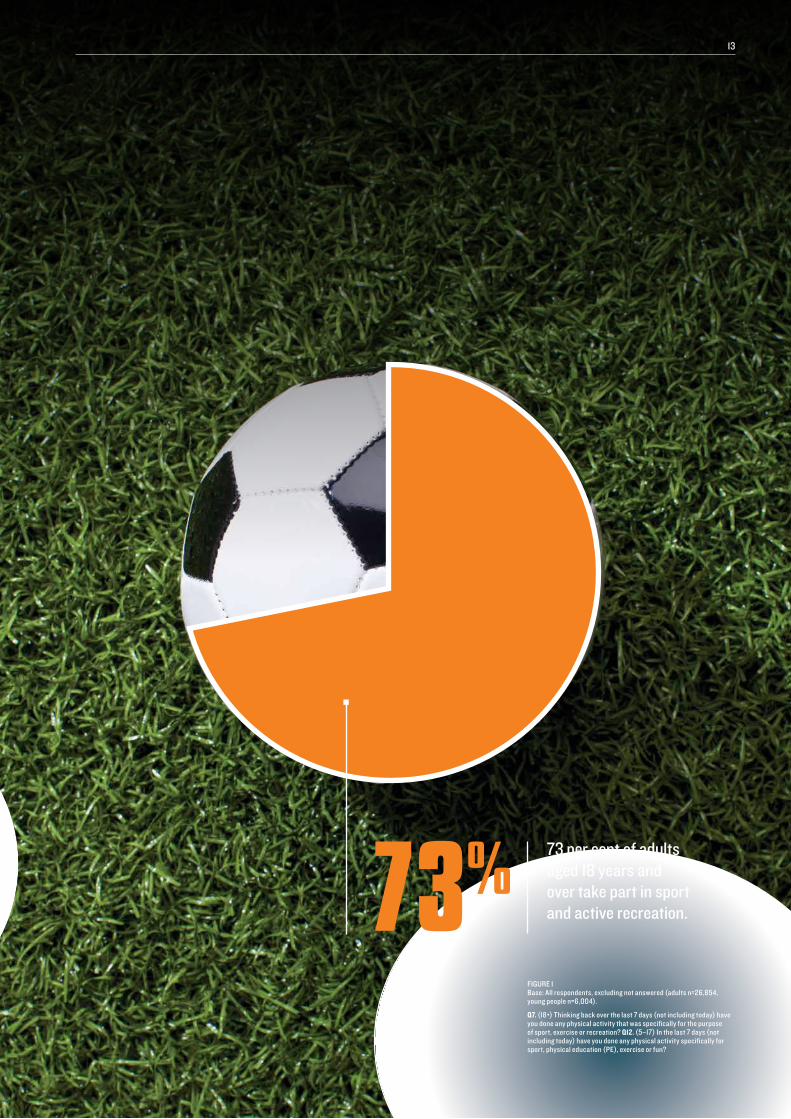
FIGURE 1Base: All respondents, excluding not answered (adults n=26,854, young people n=6,004).
Q7. (18+) Thinking back over the last 7 days (not including today) have you done any physical activity that was specifically for the purpose of sport, exercise or recreation? Q12. (5 –17) In the last 7 days (not including today) have you done any physical activity specifically for sport, physical education (PE), exercise or fun?
73% 73 per cent of adults aged 18 years and over take part in sport and active recreation.
13

FIGURE 2WEEKLY PARTICIPATION, AVERAGE NUMBER OF HOURS PER WEEK SPENT PARTICIPATING AND AVERAGE NUMBER OF SPORTS AND ACTIVITIES BY AGE.
Young people are much more active than adults. In any given week, 95 per cent of young people and 73 per cent of adults participate. Young people spend an average of 11 hours participating in 5.4 sports and activities. Adults average 5.3 hours in 2.3 sports and activities.
For young people, weekly participation, time spent participating and number of sports and activities peak between ages 12–14, before declining between ages 15–17. Participation is relatively stable throughout adult years before declining again from age 65.
FIGURE 3WEEKLY PARTICIPATION AND AVERAGE NUMBER OF HOURS PER WEEK SPENT PARTICIPATING BY AGE AND GENDER.
Weekly participation is the same for males and females, except between ages 50–64 when more females are participating. However, males spend more time participating: an extra hour for young males and half an hour for adult males – with the largest gap at ages 18–24. There is no difference in the average number of sports and activities by age and gender and the trend line reflects that in figure 2.
YOUNG PEOPLE ADULTS
Average # hours per week
Average # sports and activities per week
Weeklyparticipation
10.6
5.1 5.4
11.412.5
8.3
5.95.1 5.1 5.4
5.7
4.4
5–7
94%
18–24
75%
25–34
75%
50–64
72%
8–11
96%
12–14
98%
15–17
89%
35–49
77%
65–74
69%
75+
62%
11
95%
5.3
2.3
73%
5.4
6.4
3.9
2.5 2.6 2.62.1 1.9 1.4
Significantly higher/lower than total
PARTICIPATION
YOUNG PEOPLE ADULTS
73% 74%
5.6 5.011.6 10.4
5–7 8–11 12–14 15–17 18–24 25–34 35–49 50–64 65–74 75+
Average# hours
Weeklyparticipation
94%95% 92% 95% 96% 98% 98% 89% 89% 77% 74% 78% 74% 76% 78% 70% 75% 68% 71% 62% 61%
11.211.8
11.0 11.7
8.2
5.2
13.2
8.5
6.9
5.3
4.9 5.4 5.7
3.8
5.4 5.4 5.85.1
10.0
4.895% 94%
MaleMale participation
FemaleFemale participation
Significantly higher/lower than the other gender in the same age group
FIGURES 2 & 3Base: All respondents, excluding not answered.
Q7. (18+) Thinking back over the last 7 days (not including today) have you done any physical activity that was specifically for the purpose of sport, exercise or recreation? Q12. (5–17) In the last 7 days (not including today) have you done any physical activity specifically for sport, physical education (PE), exercise or fun? Q19. (18+).
Still thinking about the physical activities you have done in the last 7 days, in total how many hours did you spend being physically active for sport, exercise or recreation? Q16b. (5–17) In total in the last 7 days how many hours did you spend being physically active for sport, PE, exercise or fun? Q8. (18+) Which of the following have you done in the last 7 days, and which have you done in the last 12 months? Please only
select the activities where you have been physically active specifically for sport, exercise or recreation. Note: reporting is based on responses to the 7 days component of the question. AND Q97. Please select the additional activities you have done in the last 7 days. Q13. (5 to 17) Please tick all the ways you have been physically active for sport, PE, exercise or fun in the last 7 days (not including today).
14
ACTIVE NZ 2017

FIGURE 4 WEEKLY PARTICIPATION AMONG YOUNG PEOPLE AND ADULTS BY ETHNICITY.
Weekly participation is lower among both young and adult Asian people. European adults have higher than average weekly participation, while Pacific and M-aori adults have lower participation.
Participant
Non-participant
Participant
Non-participant5% 27%
European
Pacific
Asian
Samoan
Indian
Chinese
European
Ma-ori
Pacific
Asian
Samoan
Indian
Chinese
ADULTSYOUNG PEOPLE
96%
95%
92%
91%
91%
88%
89%
4%
5%
8%
9%
9%
12%
11%
95%
75%
71%
67%
65%
70%
66%
68%
25%
29%
33%
32%
35%
30%
34%
73%
Significantly higher/lower than total
Ma-ori
FIGURE 5 WEEKLY PARTICIPATION BY ETHNICITY AND GENDER.
Where there are differences in weekly participation between males and females of the same ethnicity, more males take part – except for European adults. 96
%96
%
96%
95%
95%
95%
92%
96%
89%
89%
92%
87%
91%
93%
*
90%
*
91%
96%
*
87%
*
88%
87%
89%
3% gap 10% gap 16% gap 9% gap
95%
YOUNG PEOPLE
Ma-ori Pacific Asian Samoan Indian ChineseEuropean
Ma-ori Pacific Asian Samoan Indian ChineseEuropean
Ethnicity result is significantly higher/lower than the total
Significant gender differenceTotal
ADULTS
73%
Male
Female
75%
73%
76%
71%
70%
72%
67%
68%
65%
68%
73%
63%
65%
64%
66%
70%
78%
62%
66%
70%
61%
*Base size less than n=100
FIGURES 4 & 5 Base: All respondents, excluding not answered.
Q7. (18+) Thinking back over the last 7 days (not including today) have you done any physical activity that was specifically for the purpose of sport, exercise or recreation? Q12. (5–17) In the last 7 days (not including today) have you done any physical activity specifically for sport, physical education (PE), exercise or fun?
15
SPORT NEW ZEALAND
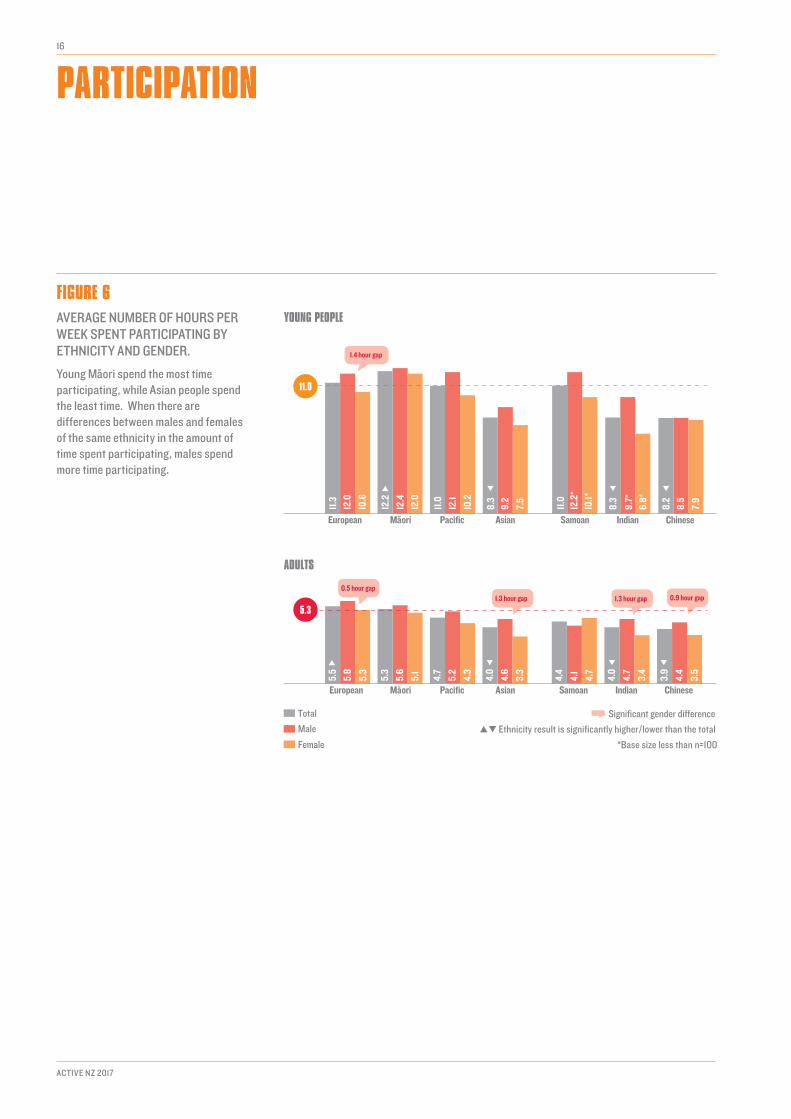
FIGURE 6AVERAGE NUMBER OF HOURS PER WEEK SPENT PARTICIPATING BY ETHNICITY AND GENDER.
Young M-aori spend the most time participating, while Asian people spend the least time. When there are differences between males and females of the same ethnicity in the amount of time spent participating, males spend more time participating.
5.5
5.8
5.3
11.3
12.0
10.6
12.2
12.4
12.0
YOUNG PEOPLE
Ma-ori Pacific Asian Samoan Indian ChineseEuropean
Ma-ori Pacific Asian Samoan Indian ChineseEuropean
ADULTS
0.5 hour gap1.3 hour gap 1.3 hour gap 0.9 hour gap
1.4 hour gap
11.0
12.1
10.2
8.3
9.2
7.5
11.0
12.2
*10
.1*
8.3
9.7*
6.8*
8.2
8.5
7.9
11.05.
3
5.6
5.1
4.7
5.2
4.3
4.0
4.6
3.3
4.4
4.1
4.7
4.0
4.7
3.4
3.9
4.4
3.5
5.3
Ethnicity result is significantly higher/lower than the total
*Base size less than n=100
Significant gender differenceTotal
Male
Female
PARTICIPATION16
ACTIVE NZ 2017

FIGURE 6Base: All respondents, excluding not answered.
Q19. (18+) Still thinking about the physical activities you have done in the last 7 days, in total how many hours did you spend being physically active for sport, exercise or recreation? Q16b. (5–17) In total in the last 7 days, how many hours did you spend being physically active for sport, PE, exercise or fun?
FIGURE 7 WEEKLY PARTICIPATION AND AVERAGE NUMBER OF HOURS PER WEEK SPENT PARTICIPATING BY DEPRIVATION.
People living in areas of high deprivation3 have lower than average levels of weekly participation and spend less than average time participating.
96%
95%
93%
4%
5%
7%
Participant
Non-participant
Low deprivation
Medium deprivation
High deprivation
73%95%
5%
78%
73%
66%
22%
27%
34%
Participant
Low deprivation
Medium deprivation
High deprivation
YOUNG PEOPLE ADULTS
Non-participant27%
Significantly higher/lower than total
Medium deprivation High deprivationLow deprivation
Medium deprivation High deprivationLow deprivation
5.6 5.3 4.8
11.3 11.1 10.1
11.0
5.3
YOUNG PEOPLE
ADULTS
Significantly higher/lower than total
FIGURE 7Base: All respondents, excluding not answered.
Q12. (5–17) In the last 7 days (not including today) have you done any physical activity specifically for sport, physical education (PE), exercise or fun? Q7. (18+) Thinking back over the last 7 days (not including today) have you done any physical activity that was specifically for the purpose of sport, exercise or recreation?
3. NZDep2013 combines census data relating to income, home ownership, employment, qualifications, family structure, housing, access to transport and communications. NZDep2013 groups deprivation scores into deciles, where 1 represents the areas with the least deprived scores and 10 the areas with the most deprived scores. For more information, refer to the Technical Report.
Note: Deprivation Index: Low 1–3, Medium 4–7, High 8–10.
17
SPORT NEW ZEALAND


WHY TIME SPENT PARTICIPATING MATTERSThis section explores the relationship between the amount of time spent participating each week and the benefits participants experience through being active.
02
SPORT NEW ZEALAND
19
WHY TIME SPENT PARTICIPATING MATTERS
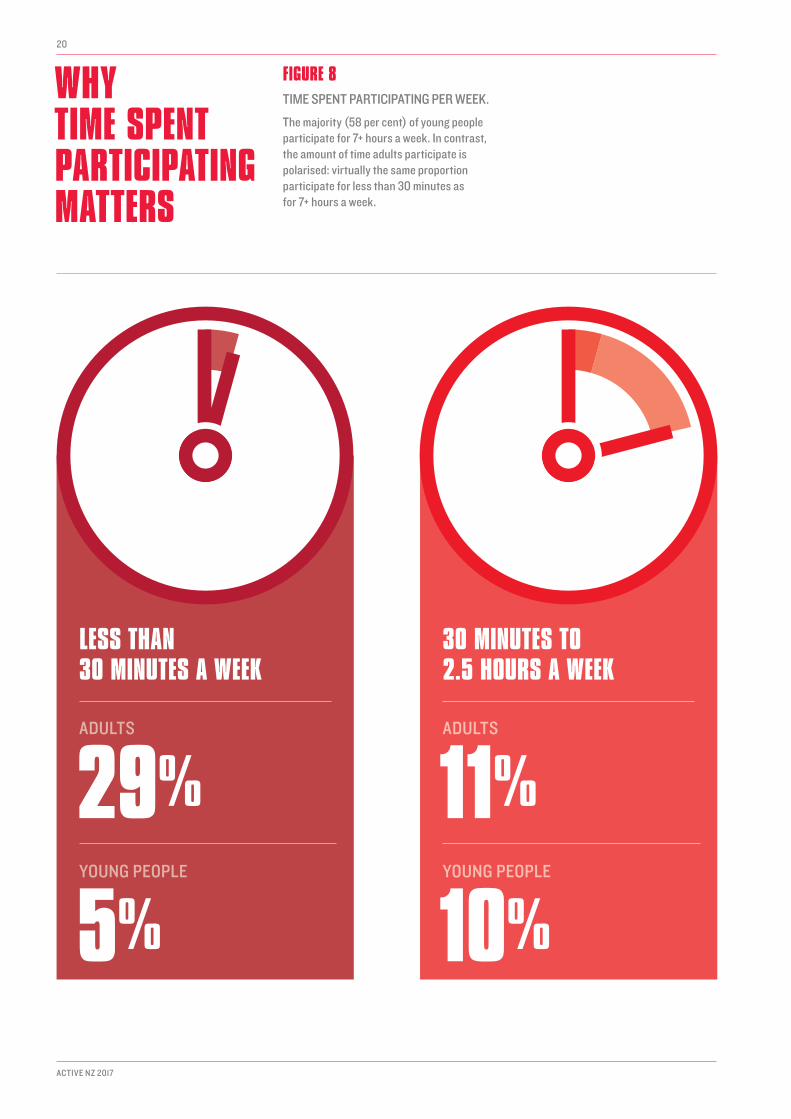
FIGURE 8TIME SPENT PARTICIPATING PER WEEK.
The majority (58 per cent) of young people participate for 7+ hours a week. In contrast, the amount of time adults participate is polarised: virtually the same proportion participate for less than 30 minutes as for 7+ hours a week.
29%
5%
LESS THAN 30 MINUTES A WEEK
YOUNG PEOPLE
ADULTS
11%
10%
30 MINUTES TO 2.5 HOURS A WEEK
YOUNG PEOPLE
ADULTS
20
ACTIVE NZ 2017

30% 30%
26% 58%
2.5 TO 7 HOURS A WEEK
7+ HOURS A WEEK
YOUNG PEOPLE YOUNG PEOPLE
ADULTS ADULTS
FIGURE 8Base: All respondents, excluding not answered.
Q19. (18+) Still thinking about the physical activities you have done in the last 7 days, in total how many hours did you spend being physically active for sport, exercise or recreation? Q16b. (5–17) In total in the last
7 days, how many hours did you spend being physically active for sport, PE, exercise or fun?
Note: The majority of those who fall into the ‘Less than 30 minutes a week’ are non-participants (5% of young people and 27% of adults).
21
SPORT NEW ZEALAND

FIGURE 9TIME SPENT PARTICIPATING BY HEALTH AND WELLBEING INDICATORS FOR YOUNG PEOPLE AND ADULTS.
As the amount of time spent participating increases, so does the emotional wellbeing of both young people and adults. Other positive outcomes associated with increased time spent participating relate to meeting the Ministry of Health Physical Activity Guidelines, healthy eating, screen time, sleep, weight and body mass index (BMI).
51% 67% 70% 78%
EMOTIONAL WELLBEING
Life satisfaction (% rated 8–10 with 10 being ‘very happy’)
0% n/a n/a 10%
PHYSICAL ACTIVITY GUIDELINES
% meeting Ministry of Health Physical Activity Guidelines
76% 77% 84% 89%
HEALTHY EATING
% who eat fruit and vegetables every day
62% 67% 75% 77%
SLEEP
% who get the recommended amount of sleep for their age
22% 30% 39% 47%
SCREEN TIME
% less than 2 hours screen time (weekday)
73% rate their life 8–10 with 10 being ‘very happy’
7% meet the Physical Activity Guidelines (60 mins, 7 days, moderate + vigorous) through sport and active recreation
86% agree that they eat fruit and vegetables every day
74% get the recommended amount of sleep for their age
42% spend less than two hours on a screen outside of school or work on a typical weekday
Less than 30 minutes a week 30 mins to 2.5 hours a week2.5 to 7 hours a week 7+ hours a week
Significantly higher/lower than total
WHY TIME SPENT PARTICIPATING MATTERS
22
ACTIVE NZ 2017
HEALTH AND WELLBEING INDICATORS FOR YOUNG PEOPLE

Less than 30 minutes a week 30 mins to 2.5 hours a week2.5 to 7 hours a week 7+ hours a week
59% 61% 71% 79%
EMOTIONAL WELLBEING
% scored 13+ on WHO-5 Wellbeing Index (an indicator of good emotional wellbeing)
0%9%
22% 50%
PHYSICAL ACTIVITY
% meeting Ministry of Health Physical Activity Guidelines
25% 25% 28% 37%
HEALTHY EATING
% who have at least 3 servings of vegetables and 2 servings of fruit per day
35% 41% 43% 47%
BODY MASS INDEX
% who have a healthy BMI (18.5–24.9)
33% 35% 39% 45%
WEIGHT
% about the right weight
69% scored above 13 on the WHO-5 (indicator of good emotional wellbeing)
23% meet the Physical Activity Guidelines (30 mins of moderate or 15 mins of vigorous 5 days) through sport and active recreation
29% eat three servings of vegetables and two servings of fruit every day
42% have a BMI in the ‘healthy’ range (18.50–24.99)
38% self-report their weight as being ‘about right’
Significantly higher/lower than total
FIGURE 9Base: All respondents aged 5–17. Questions vary.
Note: The Physical Activity Guidelines were agreed to by the Ministry of Health and Sport NZ and they outline the minimum levels of physical activity required to gain physical health benefits:
YOUNG PEOPLE GUIDELINES: To meet the Physical Activity Guidelines, young people need to do at least 60 mins moderate or vigorous activity, 7 days a week.
ADULT GUIDELINES: To meet the Physical Activity Guidelines, adults need to do at least 30 mins of moderate or 15 mins vigorous activity, at least 5 days a week.
Moderate activity is ‘any activity that caused a slight, but noticeable, increase in breath’ (could still have a conversation). Vigorous activity is ‘any activity that had you out of breath’ (couldn’t do this activity and have a conversation at the same time).
23
SPORT NEW ZEALAND
HEALTH AND WELLBEING INDICATORS FOR ADULTS


HOW PEOPLE PARTICIPATEThis section explores how young people and adults participate.
03
SPORT NEW ZEALAND
25

HOW PEOPLE PARTICIPATE
FIGURE 10WEEKLY PARTICIPATION IN COMPETITIVE AND NON-COMPETITIVE SPORTS AND ACTIVITIES.
Most weekly participation is in non-competitive sports and activities: 63 per cent of young people and 61 per cent of adults. Non-competitive participation refers to sports and activities undertaken outside of a league or club competition, tournament or competitive event.
26
ACTIVE NZ 2017
YOUNG PEOPLE
ADULTS
COMPETITIVE SPORTS OR ACTIVITIES ONLY
BOTH
NON-COMPETITIVE SPORTS OR ACTIVITIES
1%
31%
63%
COMPETITIVE SPORTS OR ACTIVITIES ONLY
BOTH
NON-COMPETITIVE SPORTS OR ACTIVITIES
2%
10%
61%
5%NON-PARTICIPANT
27%NON-PARTICIPANT
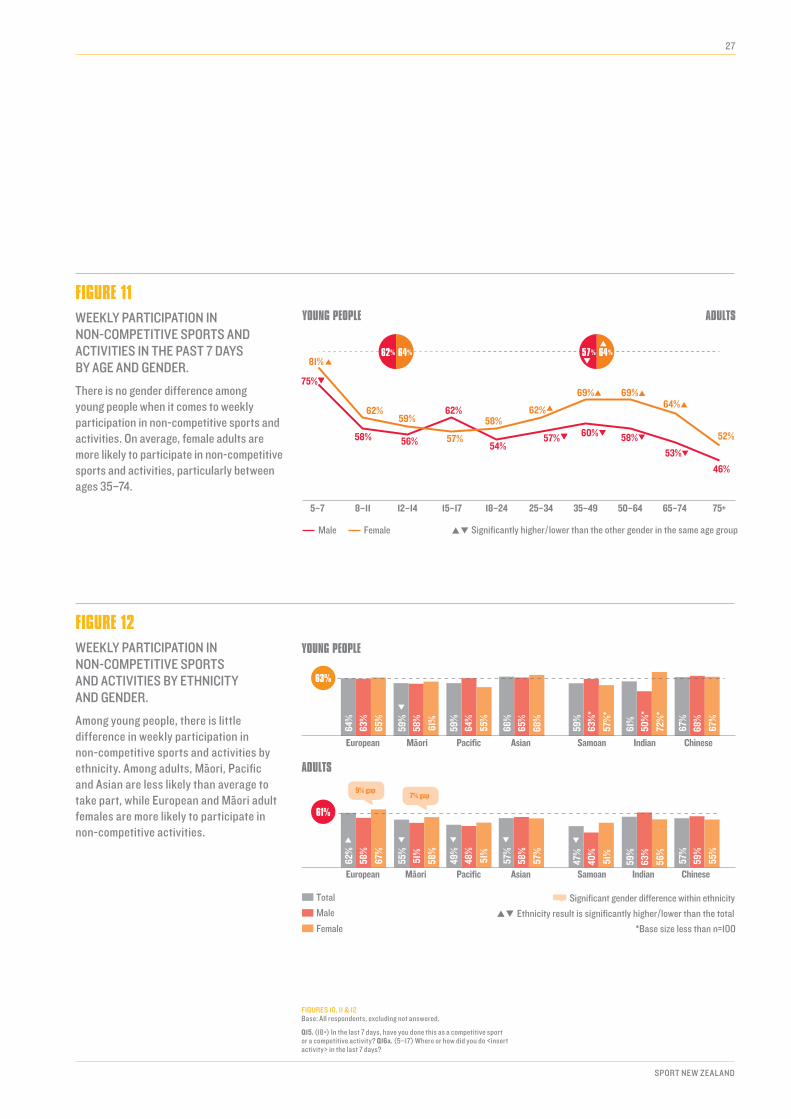
FIGURE 11WEEKLY PARTICIPATION IN NON-COMPETITIVE SPORTS AND ACTIVITIES IN THE PAST 7 DAYS BY AGE AND GENDER.
There is no gender difference among young people when it comes to weekly participation in non-competitive sports and activities. On average, female adults are more likely to participate in non-competitive sports and activities, particularly between ages 35–74.
FIGURE 12WEEKLY PARTICIPATION IN NON-COMPETITIVE SPORTS AND ACTIVITIES BY ETHNICITY AND GENDER.
Among young people, there is little difference in weekly participation in non-competitive sports and activities by ethnicity. Among adults, M-aori, Pacific and Asian are less likely than average to take part, while European and M-aori adult females are more likely to participate in non-competitive activities.
5–7
Male Female
8–11 12–14 15–17 18–24 25–34 35–49 50–64 65–74 75+
YOUNG PEOPLE ADULTS
62% 64% 57% 64%
Significantly higher/lower than the other gender in the same age group
75%
58% 56%
62%
54%57% 60% 58%
53%
46%
81%
62%59%
57%
58%62%
69% 69%64%
52%
64%
63%
65%
59%
58%
61%
59%
64%
55%
66%
65%
68%
59%
63%
*
57%
*
61%
50%
*
72%
*
67%
68%
67%
9% gap7% gap
63%
YOUNG PEOPLE
Ma-ori Pacific Asian Samoan Indian ChineseEuropean
Ma-ori Pacific Asian Samoan Indian ChineseEuropean
ADULTS
61%
62%
58%
67%
55%
51%
58%
49%
48%
51%
57%
58%
57%
47%
40%
51%
59%
63%
56%
57%
59%
55%
Ethnicity result is significantly higher/lower than the total
Significant gender difference within ethnicityTotal
Male
Female *Base size less than n=100
FIGURES 10, 11 & 12Base: All respondents, excluding not answered.
Q15. (18+) In the last 7 days, have you done this as a competitive sport or a competitive activity? Q16a. (5–17) Where or how did you do <insert activity> in the last 7 days?
27
SPORT NEW ZEALAND

FIGURE 13WEEKLY PARTICIPATION IN COMPETITIVE SPORTS AND ACTIVITIES BY AGE.
Young people are almost three times more likely to participate in competitive sports and activities than adults, especially between ages 8–14. Adult participation is higher than average between ages 18–34 and lower than average between ages 50–74.
FIGURE 14 WEEKLY PARTICIPATION IN COMPETITIVE SPORTS AND ACTIVITIES BY AGE AND GENDER.
There is no gender difference in weekly participation in competitive sports and activities between ages 8–17. At all other ages, male participation exceeds females.
5–7 16%
18–2418%
25–3416%
50–649%
8–1136%
12–1440%
15–1729%
35–4912%
65–7410%
75+11%
32%
12%
YOUNG PEOPLE ADULTS
COMPETITIVE SPORT(weekly participation)
Significantly higher/lower than total
5–7 8–11 12–14 15–17 18–24 25–34 35–49 50–64 65–74 75+
YOUNG PEOPLE ADULTS
33% 30% 16% 9%
Male Female Significantly higher/lower than the other gender in the same age group
20%
37%42%
27% 23% 21%15%
12% 14% 15%11%
34%39% 32%
15% 12%8% 6% 7% 8%
HOW PEOPLE PARTICIPATE
28
ACTIVE NZ 2017

FIGURES 13, 14 & 15Base: All respondents, excluding not answered.
Q15. (18+) In the last 7 days, have you done this as a competitive sport or a competitive activity? Q16a. (5 to 17) Where or how did you do <insert activity> in the last 7 days?
FIGURE 15WEEKLY PARTICIPATION IN COMPETITIVE SPORTS AND ACTIVITIES BY ETHNICITY AND GENDER.
M-aori have higher than average weekly participation in competitive sports and activities, and Asian people have lower than average. M-aori and Pacific adults are more likely to participate in competitive sports and activities. Where there are differences in participation between males and females of the same ethnicity, male participation exceeds female.
32%
33%
31%
36%
38%
34%
34%
33%
34%
23%
27%
19%
32%
31%
*
33%
*
30%
45%
*
15%
*
21%
19%
22%
7% gap7% gap
5% gap
32%
YOUNG PEOPLE
Ma-ori Pacific Asian Samoan Indian ChineseEuropean
Ma-ori Pacific Asian Samoan Indian ChineseEuropean
ADULTS
12%
12%
16%
9% 16%
19%
14%
17%
20%
14%
10%
14%
7% 18%
23%
14%
10%
15%
6% 8% 11% 6%
30% gap
Ethnicity result is significantly higher/lower than the total
Significant gender difference
5% gap
Total
Male
Female *Base size less than n=100
29
SPORT NEW ZEALAND


YOUNG PEOPLE04This section specifically focuses on aspects of young people’s participation.
SPORT NEW ZEALAND
31
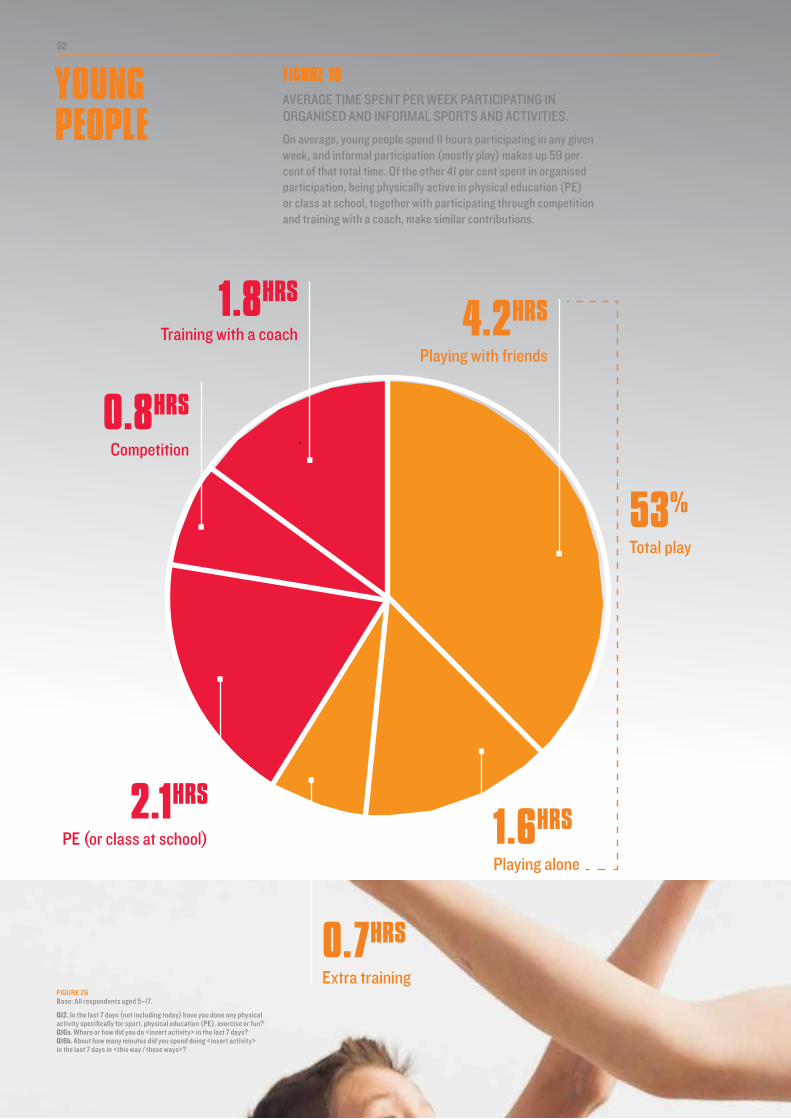
FIGURE 26Base: All respondents aged 5–17.
Q12. In the last 7 days (not including today) have you done any physical activity specifically for sport, physical education (PE), exercise or fun? Q16a. Where or how did you do <insert activity> in the last 7 days? Q16b. About how many minutes did you spend doing <insert activity> in the last 7 days in <this way / these ways>?
YOUNG PEOPLE
FIGURE 16AVERAGE TIME SPENT PER WEEK PARTICIPATING IN ORGANISED AND INFORMAL SPORTS AND ACTIVITIES.
On average, young people spend 11 hours participating in any given week, and informal participation (mostly play) makes up 59 per cent of that total time. Of the other 41 per cent spent in organised participation, being physically active in physical education (PE) or class at school, together with participating through competition and training with a coach, make similar contributions.
1.8HRS
0.8HRS
2.1HRS
0.7HRS
1.6HRS
4.2HRS
53%
Training with a coach
Competition
PE (or class at school)
Extra training
Playing alone
Playing with friends
Total play
3232
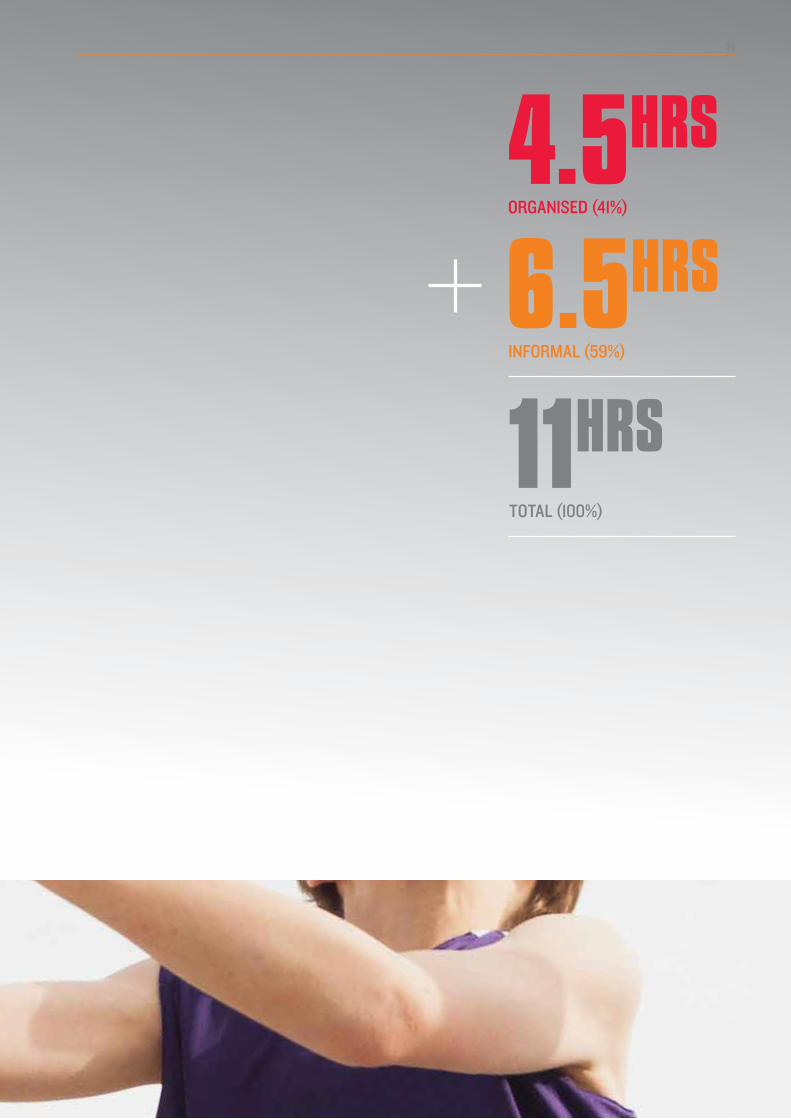
4.5HRS
6.5HRS
11HRS
ORGANISED (41%)
INFORMAL (59%)
TOTAL (100%)
Total play
33

INFO
RMAL
EURO
PEAN
M- AO
RI
PACI
FIC
ASIA
N
SAM
OAN
INDI
AN
CHIN
ESE
Total informal 6.5 6.8 7.2 6.0 4.4 5.7 4.0 4.5
Playing with friends 4.2 4.5 4.7 4.0 2.7 3.7 2.5 2.8
Playing alone 1.6 1.6 1.8 1.4 1.1 1.3 1.0 1.2
Extra training 0.7 0.8 0.7 0.6 0.6 0.7 0.7 0.6
TABLE 17AVERAGE TIME (HOURS) SPENT PER WEEK PARTICIPATING IN ORGANISED AND INFORMAL SPORTS AND ACTIVITIES BY GENDER.
Overall, there is no gender difference in the average amount of time young people spend in organised participation. However, there is a gender difference in informal participation: boys spend 1.3 hours more than girls participating informally. This is accounted for by higher levels of male participation through play.
ORGA
NISE
D
EURO
PEAN
M- AO
RI
PACI
FIC
ASIA
N
SAM
OAN
INDI
AN
CHIN
ESE
Total organised 4.5 4.5 5.2 5.2 3.7 5.2 3.9 3.7
Training with a coach 1.8 1.8 1.9 1.6 1.5 2.1 1.9 1.2
Competition 0.8 0.7 1.0 1.1 0.5 1.0 0.5 0.6
PE (or class at school) 2.1 2.0 2.4 2.5 1.8 2.1 1.6 1.9
ORGA
NISE
D
MAL
ES
FEM
ALES
Total organised 4.5 4.4 4.7
Training with a coach 1.8 1.6 1.9
Competition 0.8 0.8 0.8
PE (or class at school) 2.1 2.1 2.0
INFO
RMAL
MAL
ES
FEM
ALES
Total informal 6.5 7.1 5.8
Playing with friends 4.2 4.7 3.7
Playing alone 1.6 1.7 1.5
Extra training 0.7 0.7 0.8
TABLE 18 AVERAGE TIME SPENT PER WEEK PARTICIPATING IN ORGANISED AND INFORMAL SPORTS AND ACTIVITIES BY ETHNICITY.
Young M-aori spend more time than average participating: 1.4 hours above average for all young people. The additional time spent is equally split between participating in organised and informal sports and activities. At the same time, young Asian people participate 2.9 hours less than the overall average for young people: 0.8 hours less in organised sports and activities and 2.1 hours less in informal sports and activities.
TABLES 17, 18 & FIGURE 19Base: All respondents aged 5–17.
Q12. In the last 7 days (not including today) have you done any physical activity specifically for sport, physical education (PE), exercise or fun? Q16a. Where or how did you do <insert activity> in the last 7 days? Q16b. About how many minutes did you spend doing <insert activity> in the last 7 days in <this way / these ways>?
YOUNG PEOPLE
Significantly higher/lower than total
Significantly higher/lower than total
34
ACTIVE NZ 2017

FIGURE 20WEEKLY PARTICIPATION, I.E, PHYSICALLY ACTIVE IN PE OR CLASS AT SCHOOL PAST 7 DAYS, AND ENJOYMENT OF PE.
Being physically active in any given week in PE or class is highest from ages 8–14, then drops between ages 15–17 when PE is no longer a compulsory subject in the education curriculum.4 Fifty-three per cent continue to be physically active in PE or class at age 15. This drops to 33 per cent at age 16, and 24 per cent at age 17.5 However, overall enjoyment among those taking PE is high.
FIGURE 19AVERAGE TIME (HOURS) SPENT PER WEEK PARTICIPATING IN DIFFERENT TYPES OF ORGANISED AND INFORMAL SPORTS AND ACTIVITIES BY AGE.
Young people aged 5–7 spend 7.3 hours or 69 per cent of their time participating through play. Those aged 12–14 spend 6.1 hours participating in organised sports and activities – the most of all other age groups. The amount of time spent participating drops by 4.2 hours between aged 12–14 and 15–17, mostly accounted for by a reduction in time spent in play (2.5 hours) and PE (1.3 hours).
5–7
0.2 0.1
8–11
12–14
15–17
Total (hours)
2.1
2.3
2.4
1.1 0.8 1.9 1.5 1.9 1.1 8.3
1.2 2.5 1.3 3.9 1.6
0.7 1.7 0.3 5.0 1.6
0.9 5.3 2.0
12.5
11.4
10.6
PE (or class at school) Competition Training (with a coach)
Extra training
Organised:
Informal: Playing with friends Playing alone
YOUNG PEOPLE
% Physically active in PE/Class in the past 7 days
Enjoyment (total % agree or strongly agree), for those aged 15–17, this is enjoyment among those who chose to continue doing PE after it was no longer compulsory
Enjoyment (total % agree or strongly agree), among those who stopped doing PE after it was no longer compulsory
5–7 8–11 12–14 1515-17 16 17
65% 68% 71% 53%40% 38% 24%
85% 83% 81%89% 89% 90% 87%
29%28% 33%
26%
Significantly higher/ lower than total
FIGURE 20Base: All respondents aged 5–17.
Q12. In the last 7 days (not including today) have you done any physical activity specifically for sport, physical education (PE), exercise or fun? Q16. Where or how did you do <insert activity> in the last 7 days? Q39a. (5–17) Please select a box on each line to show how much you agree or disagree with each statement. (R1) I like/liked PE or fitness class at school.
4. Weekly participation in PE or class between ages 5–14 when a compulsory school subject does not total 100%, as the reported figure is based on one calendar year, not the school year. It does not consider non-attendance or no physical activity undertaken as part of class.
5. The decline is accounted forby fewer young people taking PE with each successive year and less time spent being active in PE or class.
35
SPORT NEW ZEALAND


MOTIVATION05This section explores what motivates people to participate in sport and active recreation.
SPORT NEW ZEALAND
37

MOTIVATION
YOUNG PEOPLE
45%
31% 28%
76% 31%
28%
To hang out with family or friends
To learn a new skill
I have to (my parents or school make me)
For fun For fitness or health
To physically challenge myself or to win
FIGURE 21TOP MAIN MOTIVATION FOR YOUNG PEOPLE AND ADULTS.
Although there are many reasons why people participate in different sports and activities, the lead motivation for young people is fun, and for adults it is physical wellbeing.
38
ACTIVE NZ 2017
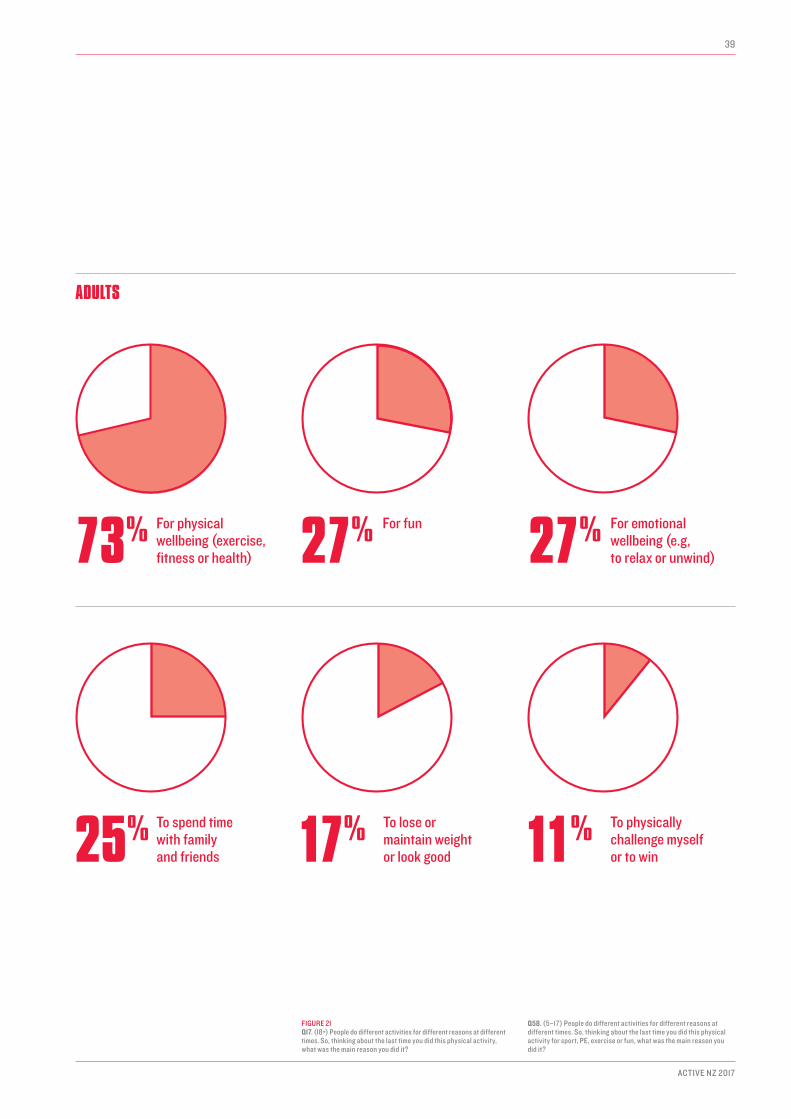
ADULTS
73% 27%
17%
27%
25% 11%
For physical wellbeing (exercise, fitness or health)
For emotional wellbeing (e.g, to relax or unwind)
To lose or maintain weight or look good
For fun
To spend time with family and friends
To physically challenge myself or to win
FIGURE 21Q17. (18+) People do different activities for different reasons at different times. So, thinking about the last time you did this physical activity, what was the main reason you did it?
Q58. (5–17) People do different activities for different reasons at different times. So, thinking about the last time you did this physical activity for sport, PE, exercise or fun, what was the main reason you did it?
39
ACTIVE NZ 2017

MOTIVATION
FIGURE 22WEEKLY PARTICIPATION IN AT LEAST ONE SPORT OR ACTIVITY FOR FUN OR PHYSICAL WELLBEING BY AGE.
With increasing age, participation for fun declines and wellbeing increases. Between ages 15–17 participation for fun drops. Participating for physical wellbeing begins between ages 12–17. Younger adults aged between 18–34 are less likely to participate for physical wellbeing than those adged 50+.
FIGURE 23WEEKLY PARTICIPATION IN AT LEAST ONE SPORT OR ACTIVITY FOR FUN BY AGE AND GENDER.
Overall, males are more likely to participate for fun. For young people, this appears to emerge between ages 15–17 when the gap between males and females is the greatest.
5–7 8–11 12–14 15–17 18–24 25–34 35–49 50–64 65–74 75+
YOUNG PEOPLE ADULTS
For fun Physical wellbeing
75+
Significantly higher/lower than the other gender in the same age group
84%
8%
78%
57%
77%
47%54%
78%
24%
82%
23%
79%
18%19%
65% 66%
73%
36% 33%
27%31%
27%
73%76%
Physical wellbeing
Fun Physical wellbeing
Fun
77% 74% 30% 25%
5–7 8–11 12–14 15–17 18–24 25–34 35–49 50–64 65–74 75+
YOUNG PEOPLE ADULTS
Male Female Significantly higher/lower than the other gender in the same age group
86%
77%
78%
61%
39% 35% 31% 26% 26%19%
83%80%
76%
54%
33% 31%24% 21% 20% 15%
40
ACTIVE NZ 2017

FIGURE 24 WEEKLY PARTICIPATION IN AT LEAST ONE SPORT OR ACTIVITY FOR FUN BY ETHNICITY AND GENDER.
Young Asian people are less likely to participate for fun, and European males are more likely than females to participate in sports and activities for fun.
78%
80%
77%
76%
78%
74%
70%
70%
70%
65%
67%
62%
71%
80%
*
64%
*
68%
64%
*
72%
*
60%
71%
51%
6% gap
3% gap
76%
YOUNG PEOPLE
Ma-ori Pacific Asian Samoan Indian ChineseEuropean
Ma-ori Pacific Asian Samoan Indian ChineseEuropean
ADULTS
27%
28%
31%
25%
27%
25%
29%
27%
29%
25%
25%
27%
22%
25%
19%
30%
24%
22%
26%
25%
28%
21%
20% gap
Ethnicity result is significantly higher/lower than the total
Significant gender differenceTotal
Male
Female *Base size less than n=100
FIGURE 25WEEKLY PARTICIPATION IN AT LEAST ONE SPORT OR ACTIVITY FOR PHYSICAL WELLBEING BY AGE AND GENDER.
On average, young females are more likely to participate for physical wellbeing than males. This appears to emerge between ages 15–17. Overall, male and female adults are equally likely to be motivated to participate for physical wellbeing.
29% 32% 73% 73%
5–7 8–11 12–14 15–17 18–24 25–34 35–49 50–64 65–74 75+
YOUNG PEOPLE ADULTS
Male Female Significantly higher/lower than the other gender in the same age group
8% 18%
49%57%
67% 67%73%
78% 83% 81%
7%
19%
46% 50%63% 65%
72%78% 80% 78%
FIGURE 22Base: Those who have done physical activity specifically for the purpose of sport, exercise or recreation in the past 7 days, excluding not answered.
Q17. (18+) People do different activities for different reasons at different times. So, thinking about the last time you did this physical activity, what was the main reason you did it? Q58. (5–17). People do different activities for different reasons at different times. So, thinking about the last time you did this physical activity for sport, PE, exercise or fun, what was the main reason you did it?
FIGURES 23, 24 & 25Base: Those who have done physical activity specifically for the purpose of sport, exercise or recreation in the past 7 days, excluding not answered.
Q17. (18+) People do different activities for different reasons at different times. So, thinking about the last time you did this physical activity, what was the main reason you did it? Q58. (5–17) People do different activities for different reasons at different times. So, thinking about the last time you did this physical activity for sport, PE, exercise or fun, what was the main reason you did it?
41
SPORT NEW ZEALAND
MOTIVATION
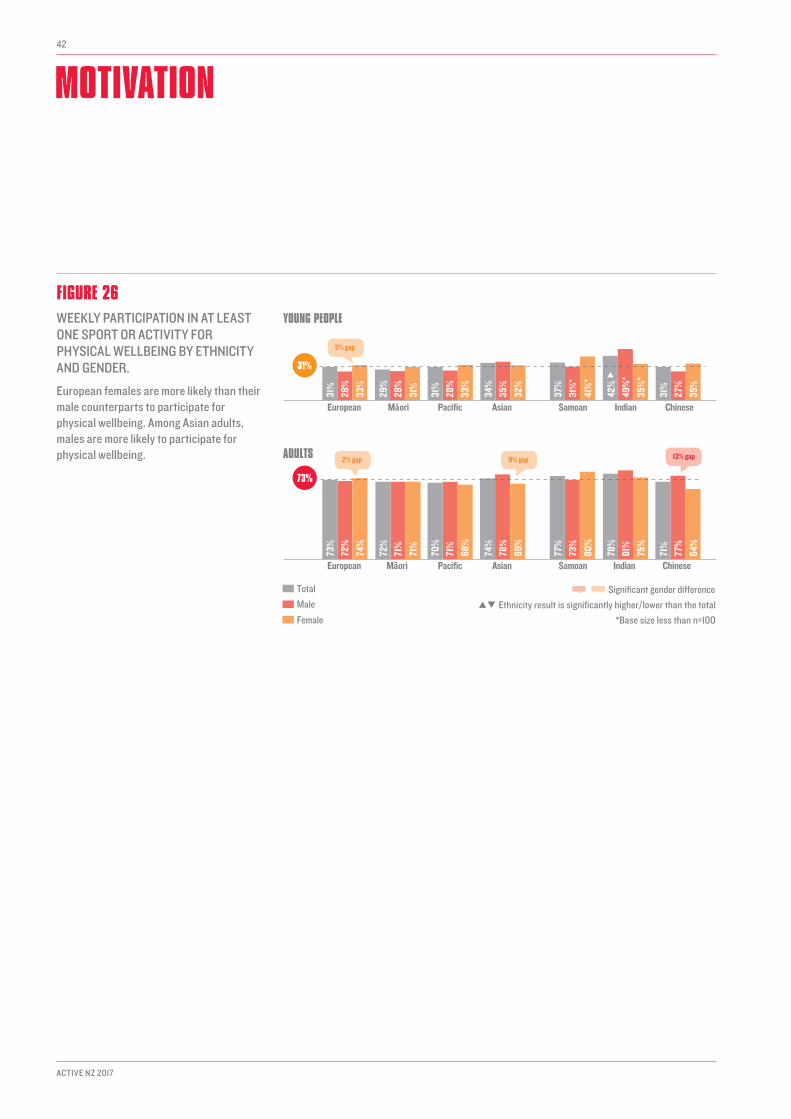
FIGURE 26 WEEKLY PARTICIPATION IN AT LEAST ONE SPORT OR ACTIVITY FOR PHYSICAL WELLBEING BY ETHNICITY AND GENDER.
European females are more likely than their male counterparts to participate for physical wellbeing. Among Asian adults, males are more likely to participate for physical wellbeing.
31%
28%
33%
29%
28%
31%
31%
28%
33%
34%
35%
32%
37%
31%
*
41%
*
42%
49%
*
35%
*
31%
27%
35%
9% gap 13% gap2% gap
31%
YOUNG PEOPLE
Ma-ori Pacific Asian Samoan Indian ChineseEuropean
Ma-ori Pacific Asian Samoan Indian ChineseEuropean
ADULTS
73%
73%
72%
74%
72%
71%
71%
70%
71%
68%
74%
78%
69%
77%
73%
80%
78%
81%
75%
71%
77%
64%
5% gap
Ethnicity result is significantly higher/lower than the total
Significant gender differenceTotal
Male
Female *Base size less than n=100
42
ACTIVE NZ 2017

FIGURE 26*Small base size. Base: Those who have done physical activity specifically for the purpose of sport, exercise, or recreation in the last 7 days, excluding not answered.
Q17. (18+) People do different activities for different reasons at different times. So, thinking about the last time you did this physical activity, what was the main reason you did it? Q58. (5–17) People do different activities for different reasons at different times. So, thinking about the last time you did this physical activity for sport, PE, exercise or fun, what was the main reason you did it?
TABLE 27 Base: Those who have done physical activity specifically for the purpose of sport, exercise, or recreation in the past 7 days, excluding not answered.
Q17. (18+) People do different activities for different reasons at different times. So, thinking about the last time you did this physical activity, what was the main reason you did it? Q58. (5–17) People do different activities for different reasons at different times. So, thinking about the last time you did this physical activity for sport, PE, exercise or fun, what was the main reason you did it?
TABLE 27MAIN MOTIVATION FOR WEEKLY PARTICIPATION IN A SELECTION OF SPORTS AND ACTIVITIES.
Just as reasons for participating vary by age, gender and ethnicity, people participate in different sports and activities for varying reasons. For example, young people are more likely to scooter for fun and run, jog or take part in cross country for physical wellbeing. Adults are also more likely to run or jog for physical wellbeing, to lose or maintain weight or to look good, and are more likely to play golf for fun.
YOUNG PEOPLE AGED 5–17 TOTA
L
Runn
ing,
jogg
ing
or
cro
ss c
ount
ry
Scoo
terin
g
Athl
etic
s or
track
and
fiel
d
Gym
nast
ics;
rh
ythm
ic o
r art
istic
Rugb
y or R
ippa
Ru
gby
For fun 43% 21% 68% 15% 37% 35%
To hang out with family or friends 16% 8% 19% 3% 4% 9%
For fitness or health 9% 27% 2% 8% 5% 6%
To learn or practise a new skill 8% 2% 2% 10% 33% 11%
To physically challenge myself and win 8% 14% 1% 21% 10% 21%
I have to (my parents or school make me) 8% 20% 2% 35% 6% 6%
ADULTS AGED 18+ TOTA
L
Runn
ing
or jo
ggin
g
Danc
e or
bal
let
Golf
Rugb
y
Gard
enin
g
Mar
ine
fishi
ng
For physical wellbeing 41% 60% 22% 17% 17% 11% 4%
For fun 13% 3% 37% 26% 17% 18% 44%
For emotional wellbeing 11% 6% 13% 6% 2% 29% 17%
To spend time with family and friends 11% 1% 6% 14% 15% 4% 25%
To lose or maintain weight or look good 8% 20% 4% 0% 3% 1% 0%
To physically challenge myself or to win 4% 7% 2% 19% 25% 0% 2%
Significantly higher/lower than total
43
SPORT NEW ZEALAND

This section explores what gets in the way of people participating in sport and active recreation in New Zealand.
SPORT NEW ZEALAND
45
HURDLES06
HURDLES
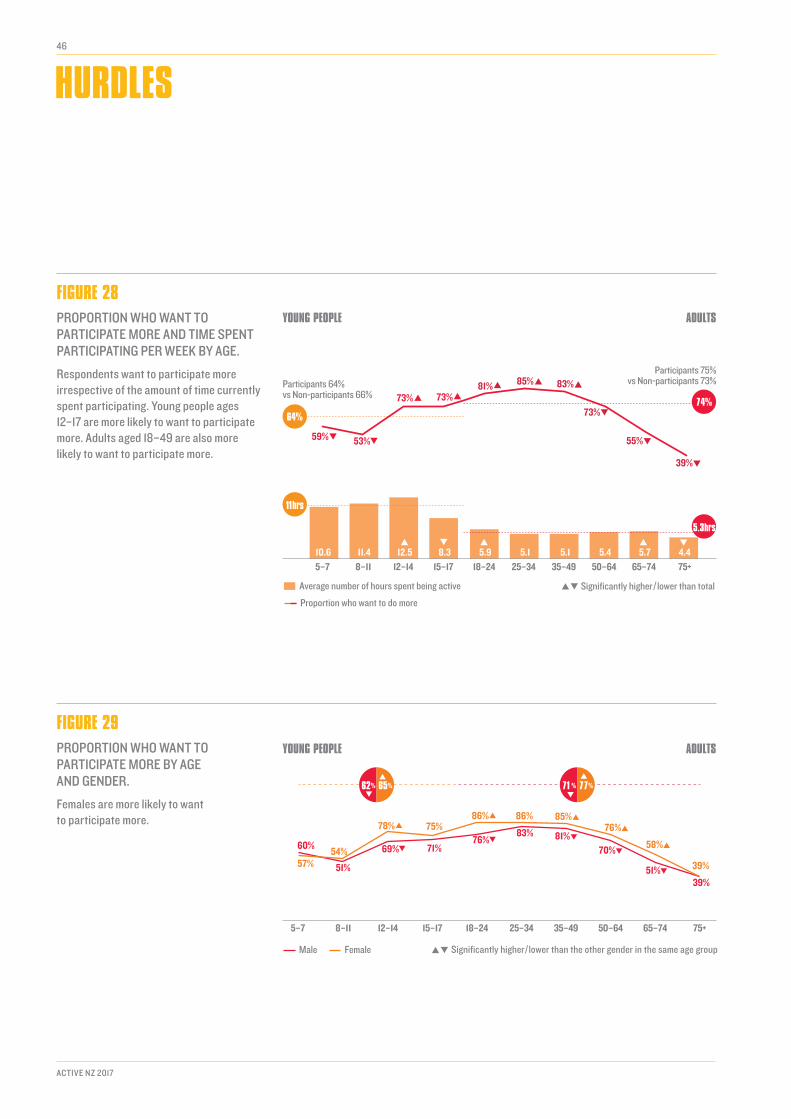
FIGURE 28PROPORTION WHO WANT TO PARTICIPATE MORE AND TIME SPENT PARTICIPATING PER WEEK BY AGE.
Respondents want to participate more irrespective of the amount of time currently spent participating. Young people ages 12–17 are more likely to want to participate more. Adults aged 18–49 are also more likely to want to participate more.
FIGURE 29 PROPORTION WHO WANT TO PARTICIPATE MORE BY AGE AND GENDER.
Females are more likely to want to participate more.
46
ACTIVE NZ 2017
62% 65% 71 % 77%
5–7 8–11 12–14 15–17 18–24 25–34 35–49 50–64 65–74 75+
YOUNG PEOPLE ADULTS
Male Female Significantly higher/lower than the other gender in the same age group
60%54%
78% 75%86% 86% 85%
76%
58%
39%57% 51%
69% 71%76%
83% 81%70%
51%39%
YOUNG PEOPLE ADULTS
Average number of hours spent being active
Proportion who want to do more
5–7 8–11 12–14 15–17 18–24 25–34 35–49 50–64 65–74 75+
Participants 64%vs Non-participants 66%
Participants 75%vs Non-participants 73%
10.6 11.4 12.5 8.3
59% 53%
73% 73%
5.9 5.1 5.1 5.4 5.7 4.4
81% 85% 83%
73%
55%
39%
64%
11hrs
74%
5.3hrs
Significantly higher/lower than total

FIGURE 28Base: All respondents, excluding not answered.
Q31. (18+) Overall, would you like to be doing more physical activity for sport, exercise or recreation than you are currently doing? Q19. (18+) Still thinking about the physical activities you have done in the past 7 days, in total how many hours did you spend being physically active for sport, exercise or recreation? Q22. (5–17) Would you like to be doing more physical activity for sport, PE, exercise or fun than what you do now? Q16b. (5–17) In total in the last 7 days how many hours did you spend being physically active for sport, PE, exercise or fun?
FIGURE 29Base: All respondents, excluding not answered.
Q31. (18+) Overall, would you like to be doing more physical activity for sport, exercise or recreation than you are currently doing? Q22. (5–17) Would you like to be doing more physical activity for sport, PE, exercise or fun than what you do now?
FIGURE 30PROPORTION WHO WANT TO PARTICIPATE MORE BY ETHNICITY AND GENDER.
Pacific and Asian people are more likely to want to participate more. European and M-aori females are more likely to want to participate more, compared with their male counterparts. 62
%60
%
63%
65%
61%
70%
71%
70%
71%
75%
72%
78%
69%
70%
*
67%
*
79%
71%
*
87%
*
71%
67%
75%
7% gap6% gap
64%
YOUNG PEOPLE
Ma-ori Pacific Asian Samoan Indian ChineseEuropean
Ma-ori Pacific Asian Samoan Indian ChineseEuropean
ADULTS
74%
74%
71%
77%
75%
71%
78%
80%
76%
83%
77%
75%
78%
81%
76%
87%
78%
79%
77%
75%
73%
76%
9% gap3% gap
Ethnicity result is significantly higher/lower than the total
Significant gender differenceTotal
Male
Female *Base size less than n=100
FIGURE 30*Small base size. Base: All respondents, excluding not answered.
Q31. (18+) Overall, would you like to be doing more physical activity for sport, exercise or recreation than you are currently doing? Q22. (5–17) Would you like to be doing more physical activity for sport, PE, exercise or fun than what you do now?
47
SPORT NEW ZEALAND
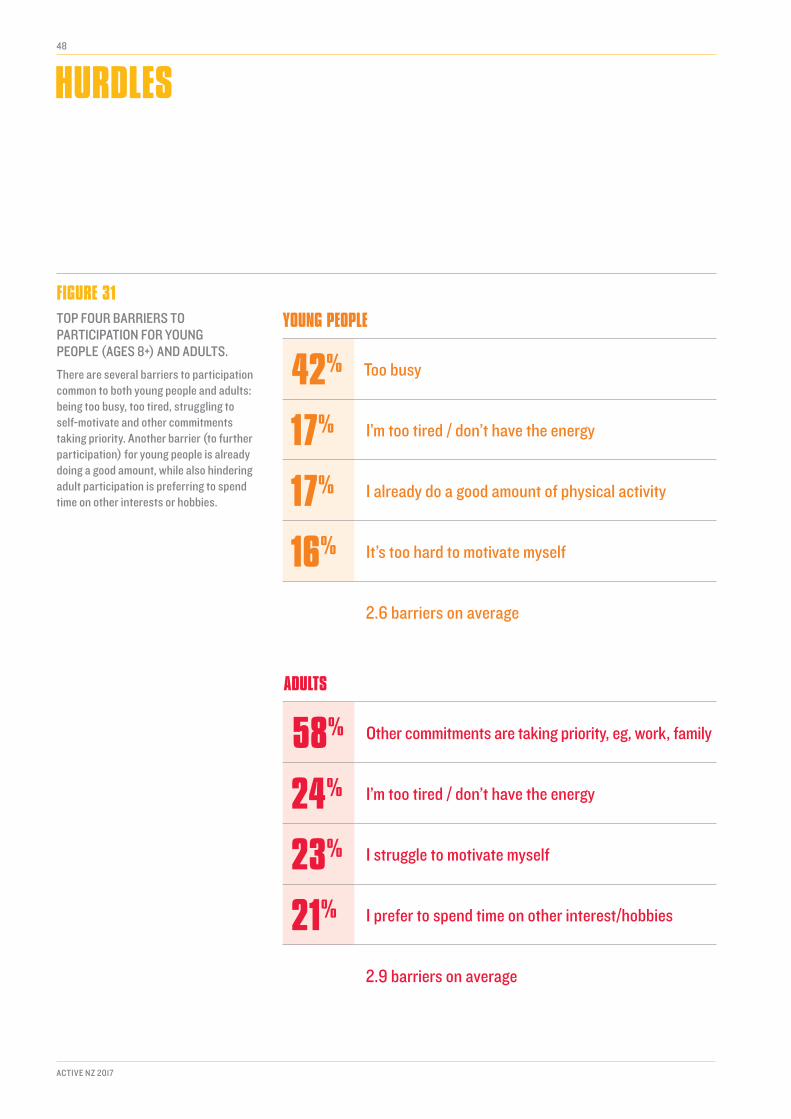
FIGURE 31TOP FOUR BARRIERS TO PARTICIPATION FOR YOUNG PEOPLE (AGES 8+) AND ADULTS.
There are several barriers to participation common to both young people and adults: being too busy, too tired, struggling to self-motivate and other commitments taking priority. Another barrier (to further participation) for young people is already doing a good amount, while also hindering adult participation is preferring to spend time on other interests or hobbies.
HURDLES
YOUNG PEOPLE
42% Too busy
17% I’m too tired / don’t have the energy
17% I already do a good amount of physical activity
16% It’s too hard to motivate myself
2.6 barriers on average
ADULTS
58% Other commitments are taking priority, eg, work, family
24% I’m too tired / don’t have the energy
23% I struggle to motivate myself
21% I prefer to spend time on other interest/hobbies
2.9 barriers on average
48
ACTIVE NZ 2017

FIGURE 32HOW KEY BARRIERS CHANGE BY AGE (AGES 8+).
As a barrier, other commitments taking priority or being too busy is higher between ages aged 15–17 and continues to be higher for adults aged 18–49, peaking between ages 25 and 49. Other commitments, preferring to spend time on other interests, and already doing a good amount of activity are barriers for an equal proportion of those aged 65–74. Twenty-four per cent of those aged 18–24 prefer to spend time on other interests and hobbies. This emerges again as more of a barrier from age 65.
FIGURE 33HOW KEY BARRIERS CHANGE BY AGE (AGES 8+).
Lack of energy and lack of self-motivation are more prominent barriers for adults than young people, although they do surface between ages 15–17. Among adults, lack of energy and self-motivation peak between ages 18–24 before becoming less of a barrier from age 50.
FIGURES 31 32 & 33Base: All respondents, excluding not answered.
Q32. (18+) For what reasons are you not doing as much physical activity as you would like? For what reasons do you not want to do more physical activity than you are currently doing?
Q23. (8-17) Why are you not doing as much physical activity as you would like? Why do you not want to do more than you are currently doing?
49
SPORT NEW ZEALAND
Other commitments are taking priority (e.g, work, family)/too busyI prefer to spend my time on other interests / hobbiesI already do a good amount of physical activity
8–11 12–14 15–17 18–24 25–34 35–49 50–64 65–74 75+
YOUNG PEOPLE ADULTS
42% 13%
17%
58% 21%
17%
Significantly higher/lower than total
35%23%
15%
55%
12%11%
41%
14%12%
63%
11%
24%
72%
9%17%
73%
12%
14%
56%
30%38%
35%
15%
30%29%
19%
19%
8–11 12–14 15–17 18–24 25–34 35–49 50–64 65–74 75+
YOUNG PEOPLE ADULTS
I struggle to motivate myselfI am too tired or don’t have the energy Significantly higher/lower than total
10%
8%
30%
27%18%
16%
35%
39% 34%31%
26%
24% 11%
7%9%
12%20%
19%
17% 16% 24% 23 %

APPENDICES
WHAT ARE THE MOST POPULAR SPORTS, ACTIVITIES AND PLACES?
A SPOTLIGHT ON REGIONAL DIFFERENCES
METHOD, SAMPLE AND OBJECTIVES
PAGE 51
PAGE 55
PAGE 57
ABC
ACTIVE NZ 2017
50

TABLE 34PERCENTAGE WHO HAVE PARTICIPATED IN EACH SPORT OR ACTIVITY IN THE 7 DAYS PRIOR AND WHETHER THEY TOOK PART COMPETITIVELY VERSUS NON-COMPETITIVELY.
Most popular activities for young people.
APPENDIX A
TABLE 34Base: All respondents aged 5–17.
Q13. Please tick all the ways you have been physically active for sport, PE, exercise or fun in the last 7 days (not including today) Q16a. (5–17) Where or how did you do <insert activity> in the last 7 days?
51
SPORT NEW ZEALAND
%
PART
ICIP
ATED
7
DAYS
COM
PETI
TIVE
NON-
CO
MPE
TITI
VE
52% 8% 92% Running, jogging or cross-country
41% 0% 100% Playing (e.g, running around, climbing trees, make-believe)
36% 5% 95% Swimming
36% 2% 98% Games (e.g, four square, tag, bull rush, dodgeball)
36% 0% 100% Playing on playground (e.g, jungle gym)
29% 2% 98% Walking for fitness
29% 2% 98% Cycling or biking
26% 0% 100% Trampoline
20% 0% 100% Scootering
19% 30% 70% Football, soccer or futsal
16% 6% 94% Dance/dancing (e.g, ballet, hip hop etc)
14% 1% 99% Workout (weights or cardio)
12% 3% 97% Group exercise class (e.g, aerobics, cross fit, jump jam)
12% 26% 74% Basketball or mini-ball
11% 50% 50% Netball
10% 0% 100% Tramping or bush walks
10% 42% 58% Rugby or Rippa Rugby
9% 23% 77% Athletics or track and field
8% 3% 97% Gymnastics (e.g. rhythmic, artistic)
8% 36% 64% Touch
6% 0% 100% Skateboarding
6% 11% 89% Kapa haka
6% 26% 74% Cricket
6% 42% 58% Hockey or floorball
5% 6% 94% Mountain biking

TABLE 35WEEKLY PARTICIPATION IN EACH SPORT OR ACTIVITY IN THE PAST SEVEN DAYS AND WHETHER PARTICIPATED COMPETITIVELY OR NON-COMPETITIVELY.
Most popular activities for adults.
APPENDIX A52
ACTIVE NZ 2017
%
PART
ICIP
ATED
7
DAYS
COM
PETI
TIVE
NON-
CO
MPE
TITI
VE
59% 2% 98% Walking
25% 1% 99% Gardening
22% 2% 98% Individual workout using equipment
20% 5% 95% Running / jogging
16% 4% 96% Playing games (e.g. with kids)
9% 4% 96% Group fitness class (e.g. aerobics, cross fit)
9% 3% 97% Swimming
7% 4% 96% Road cycling
6% 2% 98% Yoga
4% 5% 95% Mountain biking
4% 4% 96% Dance/dancing (e.g. ballet, hip hop etc)
4% 0% 100% Day tramp
4% 50% 50% Golf
3% 1% 99% Pilates
2% 7% 93% Marine fishing
2% 58% 42% Football (soccer)
2% 37% 63% Tennis
2% 7% 93% Boxing
2% 6% 94% Motorcycling
1% 5% 95% Canoeing / kayaking
1% 4% 96% Hunting
1% 2% 98% Surfing / body boarding
1% 16% 84% Table tennis
1% 79% 21% Netball
1% 36% 64% Basketball
TABLE 35Base: All respondents aged 18 or over, excluding not answered.
Q8. Which of the following have you done in the last 7 days, and which have you done in the last 12 months? Please only select the activities where you have been physically active specifically for sport, exercise or recreation. Note: reporting is based on responses to the 7 days component of the question. AND Q97. Please select the additional activities you have done in the last 7 days. Q15. (18+) In the last 7 days, have you done this as a competitive sport or a competitive activity?
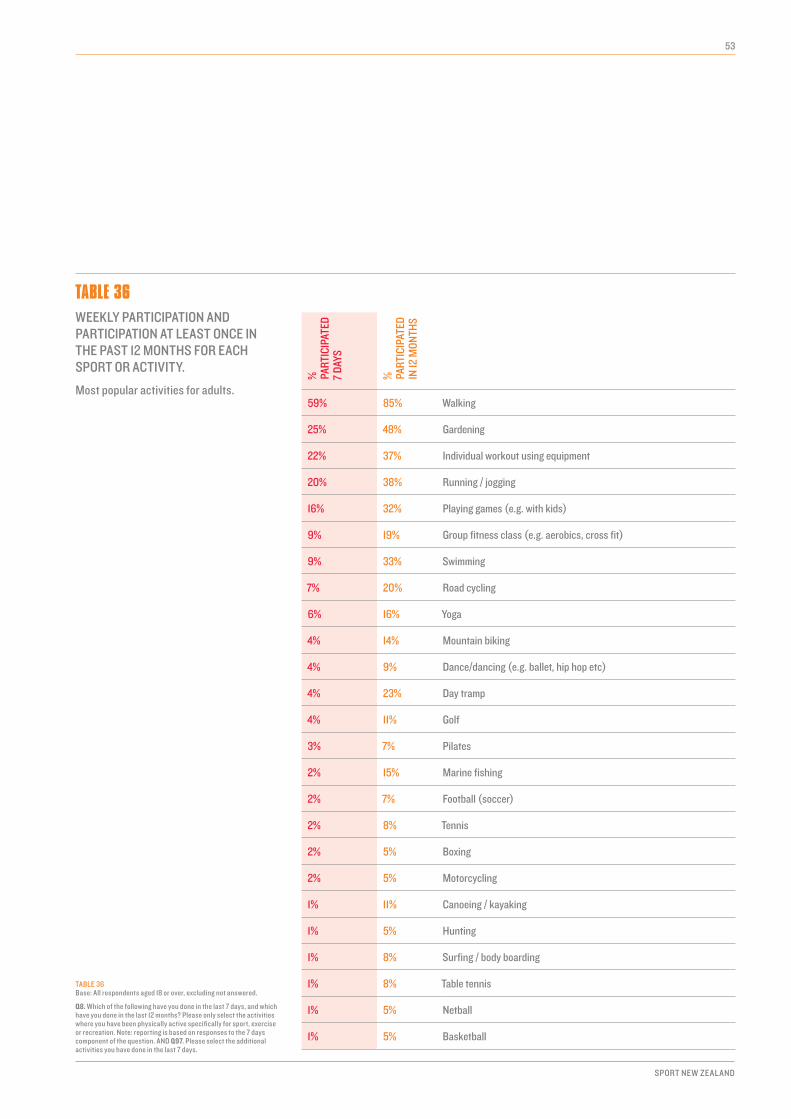
TABLE 36WEEKLY PARTICIPATION AND PARTICIPATION AT LEAST ONCE IN THE PAST 12 MONTHS FOR EACH SPORT OR ACTIVITY.
Most popular activities for adults.
53
SPORT NEW ZEALAND
%
PART
ICIP
ATED
7
DAYS
%
PART
ICIP
ATED
IN
12 M
ONTH
S59% 85% Walking
25% 48% Gardening
22% 37% Individual workout using equipment
20% 38% Running / jogging
16% 32% Playing games (e.g. with kids)
9% 19% Group fitness class (e.g. aerobics, cross fit)
9% 33% Swimming
7% 20% Road cycling
6% 16% Yoga
4% 14% Mountain biking
4% 9% Dance/dancing (e.g. ballet, hip hop etc)
4% 23% Day tramp
4% 11% Golf
3% 7% Pilates
2% 15% Marine fishing
2% 7% Football (soccer)
2% 8% Tennis
2% 5% Boxing
2% 5% Motorcycling
1% 11% Canoeing / kayaking
1% 5% Hunting
1% 8% Surfing / body boarding
1% 8% Table tennis
1% 5% Netball
1% 5% Basketball
TABLE 36Base: All respondents aged 18 or over, excluding not answered.
Q8. Which of the following have you done in the last 7 days, and which have you done in the last 12 months? Please only select the activities where you have been physically active specifically for sport, exercise or recreation. Note: reporting is based on responses to the 7 days component of the question. AND Q97. Please select the additional activities you have done in the last 7 days.

TABLE 37WEEKLY PARTICIPATION LOCATIONS.
Most popular locations for young people and adults.
TABLE 37Base: All respondents, excluding not answered.
Q25. (18+) In the last 7 days, in which of the following places have you been physically active for sport, exercise or recreation? Q17. (5–17) Where have you done each of these in the last 7 days?
APPENDIX A54
ACTIVE NZ 2017
YOUNG PARTICIPANTS (N=5722)
At school or in the school grounds 71%
At home 66%
Outdoor facilities (e.g. playground, park, field, astroturf or outdoor pool) 59%
Indoor facilities (e.g. gym, community hall, church, marae or indoor pool) 52%
Other outdoor locations (e.g, beach, lake, bush, footpath) 52%
ADULT PARTICIPANTS (N=19221)
On the road / footpath 42%
Private property, home, garden or pool 32%
Walkway 25%
Public park, field, playground, skate park or BMX track 20%
Gym or fitness centre 18%
On, in or beside sea or coast 15%
Outdoor sports facility or purpose-built environment (e.g. netball or tennis courts, golf course, ski field, astroturf or outdoor stadium)
10%
Off road biking or walking track 10%
On, in or beside lake, river or stream 8%
Indoor sports facility or complex (e.g. a recreation centre or indoor stadium) 6%
Public pool or aquatic centre 6%
Cycleway or cycle lane specifically set aside for cyclists 6%
Community hall, school hall, marae, church (e.g. an indoor facility that is not used mainly for sport or physical activity)
5%
National park area 5%

APPENDIX B
FIGURE 38WEEKLY PARTICIPATION BY REGION.
This section highlights the differences in weekly participation and time spent participating by regional sports trusts.
FIGURE 38Base: All respondents, excluding not answered.
Q7. (18+) Thinking back over the last 7 days (not including today) have you done any physical activity that was specifically for the purpose of sport, exercise or recreation? OR Q12. (8-–17) In the past 7 days (not including today) have you done any physical activity specifically for sport, physical education (PE), exercise or fun?
Bay of Plenty Adults: 76% / Young people: 95%
Southland Adults: 67% / Young people: 96%
Tasman and Marlborough Adults: 76% / Young people: 97%
Manawatu Adults: 71% / Young people: 93%
Taranaki Adults: 74% / Young people: 95%
Whanganui Adults: 65% / Young people: 96%
Auckland (Aktive) Adults: 73% / Young people: 94%North Harbour Adults: 77% / Young people: 95%Auckland Adults: 77% / Young people: 94%Counties Manukau Adults: 67% / Young people: 93%Waitekere Adults: 68% / Young people: 93%
Waikato Adults: 71% / Young people: 96%
Otago Adults: 75% / Young people: 97%
Canterbury and West Coast Adults: 75% / Young people: 94%
Wellington Adults: 77% / Young people: 96%
Hawke’s Bay Adults: 71% / Young people: 98%
Gisborne Adults: 71% / Young people: 96%
Significant gender difference
New Zealand Total
Young people Adults
95% 73%
Northland Adults: 69% / Young people: 93%
55
SPORT NEW ZEALAND

APPENDIX B
FIGURE 39TIME SPENT PARTICIPATING BY REGION.
Hours spent participating by region.
Northland Adults: 5.1 hours / Young people: 12.1 hours
Bay of Plenty Adults: 5.9 hours / Young people: 12.1 hours
Southland Adults: 5.0 hours / Young people: 12.3 hours
Tasman and Marlborough Adults: 6.1 hours / Young people: 12.4 hours
Manawatu Adults: 5.3 hours/ Young people: 9.8 hours
Taranaki Adults: 6 hours / Young people: 11.9 hours
Whanganui Adults: 5.1 hours / Young people: 11.5 hours
Auckland (Aktive) Adults: 4.8 hours / Young people: 10.4 hours North Harbour Adults: 5.2 hours / Young people: 12.2 hours Auckland Adults: 5 hours / Young people: 9.4 hours Counties Manukau Adults: 4.4 hours / Young people: 10.2 hoursWaitekere Adults: 4.5 hours / Young people: 9.8 hours
Waikato Adults: 5.4 hours / Young people: 11.2 hours
Otago Adults: 5.8 hours / Young people: 12.3 hours
Canterbury and West Coast Adults: 5.5 hours / Young people: 10.9 hours
Wellington Adults: 5.4 hours / Young people: 10.4 hours
Hawke’s Bay Adults: 5.3 hours / Young people: 11.3 hours
Gisborne Adults: 5.6 hours / Young people: 11.7 hours
FIGURE 39Base: All respondents, excluding not answered.
Q19. (18+) Still thinking about the physical activities you have done in the last 7 days, in total how many hours did you spend being physically active for sport, exercise or recreation? OR Q16b. (5–17) About how many minutes did you spend doing <insert activity> in the last 7 days in <this way/these ways>?
Significantly higher / lower than total
56
ACTIVE NZ 2017
APPENDIX C
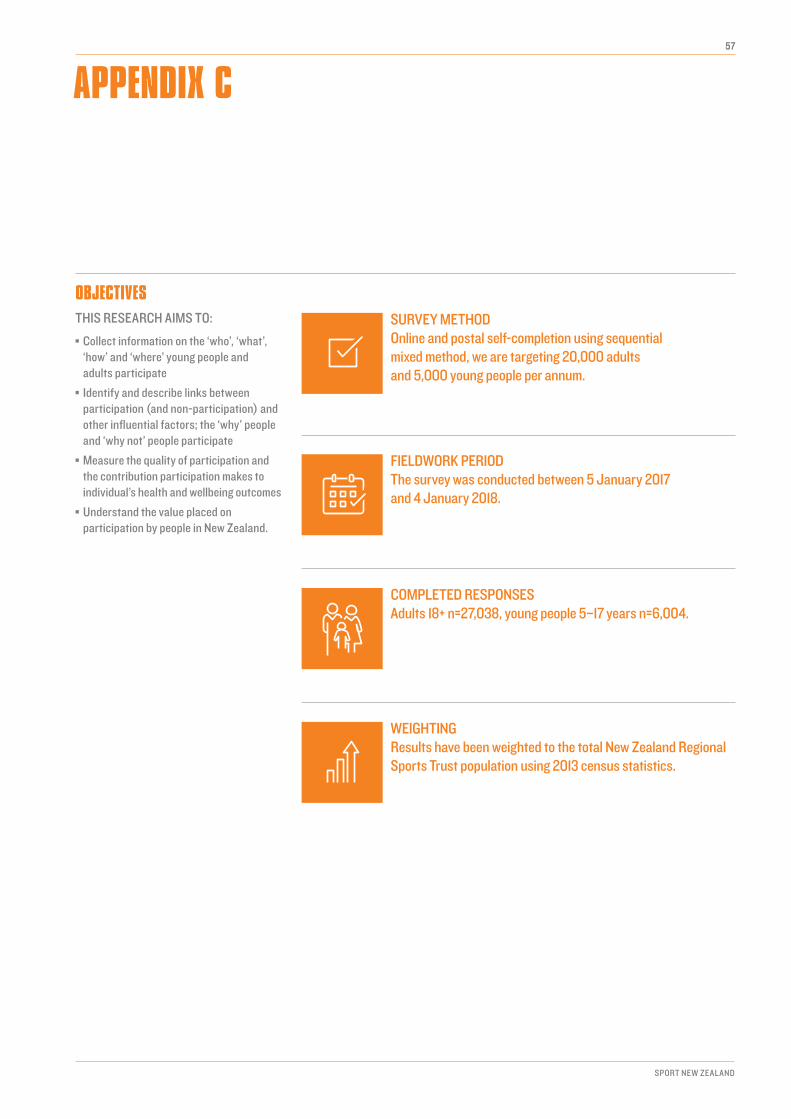
OBJECTIVESTHIS RESEARCH AIMS TO:
≠ Collect information on the ‘who’, ‘what’, ‘how’ and ‘where’ young people and adults participate
≠ Identify and describe links between participation (and non-participation) and other influential factors; the ‘why’ people and ‘why not’ people participate
≠ Measure the quality of participation and the contribution participation makes to individual’s health and wellbeing outcomes
≠ Understand the value placed on participation by people in New Zealand.
SURVEY METHODOnline and postal self-completion using sequential mixed method, we are targeting 20,000 adults and 5,000 young people per annum.
FIELDWORK PERIODThe survey was conducted between 5 January 2017 and 4 January 2018.
COMPLETED RESPONSESAdults 18+ n=27,038, young people 5–17 years n=6,004.
WEIGHTINGResults have been weighted to the total New Zealand Regional Sports Trust population using 2013 census statistics.
57
SPORT NEW ZEALAND
57

A SEQUENTIAL MIXED METHODOLOGY IS USED FOR THIS RESEARCH.
ELECTORAL ROLE
INVITATION LETTER
REMINDER POSTCARD 1 SURVEY PACK REMINDER
POSTCARD 2
Sample selected from Electoral Roll.
Invitation letters are sent to the named adults (aged 18+) inviting them to complete the questionnaire online (with instructions and log-in provided).
A flyer is included to encourage young people aged 12 to 17 to complete the young people’s questionnaire online. An 0800 number and email address is provided for questions.
About a week later, a reminder postcard is sent thanking respondents and acting as a reminder to those who haven’t yet completed the questionnaire.
This communication is targeted to adults only.
A week after the postcard, non- respondents are sent a survey pack with a hardcopy of the questionnaire, a pen, a cover letter and a reply-paid envelope.
A flyer is included for 12 to 17 year olds to complete the survey online (no paper questionnaire is available for the young people’s survey).
A final reminder is sent to adults who have not yet taken part in the survey.
APPENDIX C
Note: Parents or caregivers are asked to respond on behalf of 5–11 year olds in their household (and are encouraged to check responses with them).
58
ACTIVE NZ 2017

Level 1, Harbour City Centre 29 Brandon Street Wellington 6011, New ZealandPO Box 2251 Wellington 6140Phone: +64 4 472 8058SPORTNZ.ORG.NZ
SPNZ00001
ISBN: 978-0-947502-73-7