act & sat a three year summary 2002-04 - … was in his or her sophomore year, then that is the...
TRANSCRIPT

ALBUQUERQUE PUBLIC SCHOOLS
DISTRICT REPORT
ACT & SAT
A Three Year Summary 2002-04
College Entrance Testing
Author: Michael Loughrey, Ph.D. Date: January 2005

ALBUQUERQUE PUBLIC SCHOOLS
BOARD OF EDUCATION
MARY LEE MARTIN President
MIGUEL ACOSTA BERNA V. FACIO Vice President Secretary
PAULA MAES LEONARD J. DELAYO, JR Policy Chair District Relations Chair
GORDON ROWE ROBERT LUCERO Finance Chair Capital Outlay Chair
ELIZABETH EVERITT Superintendent
SUSIE PECK NELINDA VENEGAS Associate Superintendent Associate Superintendent
RESEARCH, DEVELOPMENT AND ACCOUNTABILITY 930-A Oak Street SE
Albuquerque, New Mexico 87106 (505) 848-8710
www.rda.aps.edu Rose-Ann McKernan
Director

Table of Contents
Executive Summary...............................................................................................................................................................1 Why Students Take College Entrance Examinations……………………………………………………………………..3 A Profile of APS Students Taking College Entrance Exams....................................................................................................4 ACT 2000-2004 Summary Information.................................................................................................................................7 Figure 1. Five-Year History of ACT Composite Scores for APS, New Mexico, and the Nation ..………………8 Figure 2. Average APS ACT Scores by Level of Academic Preparation ………………………………………..9 SAT 2000-2004 Summary Information...............................................................................................................................10 Figure 3. Five-year History of SAT Verbal and Math Scores for APS, New Mexico, and the Nation .......................11 Table 1. Number and Percent of Males and Females Tested................................................................................ 12 Table 2. Percent of Graduating Class Having Taken College Entrance Exams During High School......................... 12 Table 3. Grade Level at Time of Testing ...............................................................................................................13 Table 4. Student-Reported Grade Point Average..................................................................................................14 Table 5. Student-Estimated Family Income ...........................................................................................................15 Table 6. Ethnicity.................................................................................................................................................17 Table 7. Educational Goals...................................................................................................................................18 Table 8. Most Frequent College Major.................................................................................................................19 Table 9. Five Year Trends of ACT-Tested Student Evaluations of APS High Schools ...........................................20 Individual APS High School Results Table 10. ACT and SAT Scores for APS High Schools...........................................................................................21
Executive Summary About This Report

Albuquerque Public Schools Research, Development & Accountability
ACT & SAT Report
RDA/ml/ACT_SATreport2002-04 5/24/2007 2
For this report, data was taken from ACT and SAT reporting services which use the most recent test scores of seniors only. If the last time the senior took the test was in his or her sophomore year, then that is the score that is reported for his or her graduating class. The SAT scores reported in this summary are only based on the number of students who took the SAT I (Verbal and Math), and not the SAT II which is based on specific course content. During the past two years only, charter school students from APS who have taken the ACT have been included in the Executive Summary of ACT’s The High School Profile. Figures 1 & 2 and Table 9 & 10 are the only data in this report that include students from charter schools. There were 13 students from five charter schools in 2002-03 and 105 students from eight charter schools in 2003-04 whose data were included. Student Performance American College Testing Program (ACT) Over the last five years the APS average ACT Composite score has been higher than both state and national averages except for 2000-2001 when the average APS composite was the same as the average national Composite score (Figure 1). Students in a college preparatory curriculum scored higher than students in a regular high school curriculum on all five subtests of the ACT in the past three years (Figure 2). Scholastic Assessment Test (SAT) Over the last five years the APS average Verbal and Math SAT I scores have been significantly higher than both state and national Verbal and Math scores (Figure 3). (The SAT report allows statistically significant differences to be determined. The ACT report does not.) Student Demographic Profile Since 1999-2000, girls have been 56-57% of the APS ACT test takers and 52-55% of the SAT test takers (Table 1). The percent of APS seniors having taken the ACT at some point during high school had peaked at 61% in 2000-01 and was 60% this past year. The percent of seniors having taken the SAT some time during their high school tenure has steadily increased by about one percent per year from 12% in 1999-2000 to 15% in 2003-04. There was a 2% increase this past year (Table 2). For the class of 2003-04, 72% of students who took the ACT took it for the last time in their senior year, while about 59% of students last took the SAT in their senior year (Table 3). Over the past three years, there has been a slight increase in the number of juniors who took their final ACT in their junior year. The
Albuquerque Public Schools Research, Development & Accountability
ACT & SAT Report
RDA/ml/ACT_SATreport2002-04 5/24/2007 3
number of students who chose to take their final SAT in their junior year has remained about 40%. Some students who take their final ACT or SAT in their junior year do so to take advantage of the increase in schools that offer early action acceptance. A greater percentage of students taking the SAT do so during their junior year because they are applying to out-of-state colleges. A much larger percent of APS students participate in the ACT. For APS students, the higher the reported GPA, the higher the scores earned on the ACT and SAT (Table 4). As would be expected, Composite ACT scores and SAT Verbal and Math subtest scores tend to increase as income increases. Students from lower income families are appreciably under-represented in the number of students who take either the ACT or SAT (Table 5). Why Students Take College Entrance Examinations Most institutions of higher education require entering students to submit college entrance examination results. The primary purpose of this requirement is to help colleges and universities decide which students to admit and what coursework best fits those individuals' needs and abilities. A large number of Albuquerque Public Schools' students voluntarily participate in either the American College Testing Program (ACT) or the Scholastic Assessment Test (SAT) of the College Entrance Examination Board.

Albuquerque Public Schools Research, Development & Accountability
ACT & SAT Report
RDA/ml/ACT_SATreport2002-04 5/24/2007 4
College entrance examinations are designed to measure academic achievement, predict success in college and help the student understand his or her potential to do college work. The domains of academic achievement measured in the ACT are English, Math, Reading, Science Reasoning, and the Composite (an average of the four primary subtests). The SAT I is comprised of two major academic domains: Verbal and Math. Since all New Mexico colleges accept the ACT, the majority of college-bound APS students take this test. Those with plans to attend college out-of-state often take the SAT, especially if the college of their choice is located in the Eastern part of the United States. It should be noted that both ACT and SAT test results have limited application to APS high school instructional planning. College entrance examination test results cannot be used as an assessment of the APS curriculum or instructional program for two reasons. First, not all APS high school students take these tests. Those who do take them are assumed to be college-bound. Second, the questions on these tests are not designed to measure a district's high school curriculum though the ACT has recently done a standards alignment to the New Mexico State Standards. Instead, the questions are designed to measure the application of analytical reasoning for problem solving needed for successful college-level study.
Albuquerque Public Schools Research, Development & Accountability
ACT & SAT Report
RDA/ml/ACT_SATreport2002-04 5/24/2007 5
A Profile of APS Students Taking College Entrance Exams Student Demographic Profile While the total number of students nationwide who participate in ACT testing has increased almost 10% over the past five years, the number of both New Mexico and APS participants has decreased about 4% and 8%, respectively, during that time. The total number of graduating seniors in APS schools has fluctuated over the past five years from 4637 in 2000-01 to 4317 in 2003-04 (Table 2), which is about a 7% decrease in the total number of students enrolled. This probably explains the decrease in the number of students taking the test. For those students who reported gender on the ACT, 44% were male and 56% were female. Participation in the SAT has increased 22% since 1999-2000, an increase of 23% for girls and 21% for boys. This may indicate more interest in attending out-of-state colleges. The percent (60%) of the senior class students having taken the ACT in 1999-2000 has fluctuated in the past five years, although it is back at 60% for this past year. The fluctuation may be due to students being counseled to take T-VI’s free ACCU-Placer test instead of the ACT because they plan on enrolling at T-VI for their first two years of college. The percent of students who have taken the SAT has increased almost 1% each year (Table 2). Over the past three years, there has been an increase from 26% to 28% of seniors who took their ACT for the last time in their junior year. The number of SAT test takers who took the SAT for the last time in their junior year is again at 40%. Essentially, almost half of the seniors who took the SAT did so for the last time in their junior year. This would seem to indicate that students who take the SAT are deciding on their college plans, i.e., going out-of-state to attend college, earlier than those who take the ACT. As would be expected, the higher the student-reported grade point average (GPA), the higher the score earned on the ACT Composite and SAT Verbal and Math subtests (Table 4). The average ACT composite over the last three years has remained similar for each of the GPA bands. For this past year 95% percent of SAT test takers and 65% of ACT test takers reported an A or B average. Composite ACT scores and SAT Verbal and Math subtest scores tend to increase somewhat as family income increases, particularly at low and middle income levels (Table 5). This result is consistent with other research establishing the relationship between socioeconomic status (SES) and student achievement. When the percent of students at each income category is inspected, a disproportionately lower percentage of test-takers are from the lowest income categories. A vigorous program to encourage students from families with lower incomes to keep more post-secondary options open by taking college entrance examinations and college prep courses would increase the number of low income test takers.

Albuquerque Public Schools Research, Development & Accountability
ACT & SAT Report
RDA/ml/ACT_SATreport2002-04 5/24/2007 6
Within APS, White students have the highest average Composite ACT scores each year and usually the highest Verbal score on the SAT. However, in 2002-03, 41 Asian/Pacific Island students comprising 8% of the total students tested, scored higher on the SAT Verbal subtest than Caucasian/White students. For the past three years, Asian/Pacific Islanders scored highest on the SAT Math subtests (Table 6). At the state level in 2003-04, Asian students scored .4 of a point higher on the ACT Composite score than Caucasian/White students. American Indian/Alaskan Native, Mexican-American/Chicano, and Caucasian-American/White students at the state level scored lower than their counterparts in APS. African-American/Black students at the state scored similar to their counterparts in APS, while Asian/Pacific Island students in the state scored higher than their APS counterparts. On the SAT Verbal subtest, New Mexico Caucasian/White students scored significantly higher than any other subgroup on the SAT Verbal subtest, while Asian/Pacific Island students scored significantly higher than any other subgroup on the SAT Math subtest. At the national level in 2003-2004, Asian/Pacific Island students scored .1 of a point higher on the ACT Composite score than Caucasian-American/White students. African-American/Black, Mexican-American/Chicano, and Caucasian-American/White students had much lower ACT Composite scores than their counterparts in APS. American Indian/Alaskan Native and Asian/Pacific Islander scored similarly to their counterparts in APS. Caucasian-American/White students scored significantly higher than any other subgroup on the SAT Verbal subtest, while Asian/Pacific Islander students scored significantly higher than any other subgroup on the SAT Math subtest. A higher percentage of APS students participating in the 2003-04 ACT were minority (37%) (Table 6) compared to the national level (21%), but less than the state (45%). (It is worth mentioning that for APS an additional 10% of the students noted they were multiracial or “other” and another 10% refused to respond.) On the other hand, the proportion of minority students taking the 2003-04 SAT from APS (22%) is a little less than at the state (24%) or the national level (27%). In 2003-04, 57% of the students taking the ACT said their goal was graduate study or a professional level degree while 67% of the students taking the SAT indicated their educational goal to be a Master's degree or a Doctoral level/Related level degree (Table 7). These figures are similar to those in the previous two years. In the past year, the greatest number of students taking the ACT indicated an intended college major in the field of health, while the greatest number of students taking the SAT intended college majors in engineering and health, which is a reversal from the past two years (Table 8). APS students who take the ACT complete a survey at the end of the exam to indicate their satisfaction or dissatisfaction with eleven different aspects of their high school's programs. Over the past five years, the percent of students who indicated that they were satisfied with various aspects of their high schools equaled or exceeded 50% in only two out of ten aspects of programs assessed (Honors Programs and Variety of Courses). Satisfaction with Honors Program decreased from 54% to 49% and satisfaction with Variety of Courses decreased from 55% to 49% in the past five years. There were also declines of 5% in students’ satisfaction with Grading Practices and Library/Learning Center. School Rules and Guidance Services have been the areas of most dissatisfaction each
Albuquerque Public Schools Research, Development & Accountability
ACT & SAT Report
RDA/ml/ACT_SATreport2002-04 5/24/2007 7
of the past five years (Table 9).
ACT 2000-2004 Summary Information

Albuquerque Public Schools Research, Development & Accountability
ACT & SAT Report
RDA/ml/ACT_SATreport2002-04 5/24/2007 8
The Enhanced ACT Assessment First administered in APS in 1989, the Enhanced ACT is a test designed to reflect current skills and knowledge students need for success in college. Scores for the four subtests of the Enhanced ACT: English, Math, Reading, and Science Reasoning are reported on a scale of 1 to 36. Since the 1999-2000 school year, APS's average composite score has been higher than both the state of New Mexico and the nation, except for 2000-01 (Figure 1) when the national average was equal to the district average. This pattern of results, with APS scores being higher, is consistent across all four subtests, except for math where the national average was .2 of a point higher than the district average this past year. Two separate sets of scores are generated for the ACT subtests, one for students who have participated in a college preparatory curriculum, and one for students in a regular curriculum. Those students in the college prep curriculum scored higher on all four subtests of the ACT in the 2001-02, 2002-03, and 2003-04 school years (Figure 2).

Albuquerque Public Schools Research, Development & Accountability
ACT & SAT Report
RDA/ml/ACT_SATreport2002-04 5/24/2007 9
Figure 1. ACT Composite Scores for APS, New Mexico, and the Nation 2000-2004
21
21
20.8
20.8
20.9
20.1
19.9
20
19.9
20.1
21.1
21
21.2
21.1
21.2
18 19 20 21 22 23
1999-00
2000-01
2001-02
2002-03
2003-04
Composite Scores
APS
NM
Nation
Figure 1 shows that APS graduates scored higher than those throughout New Mexico and the nation on the ACT. Source: ACT High School Profile (Executive Summary)

Albuquerque Public Schools Research, Development & Accountability
ACT & SAT Report
RDA/ml/ACT_SATreport2002-04 5/24/2007 10
Figure 2. Average APS ACT Scores by Level of Academic Preparation 2002-2004
20.0
20.0
20.9
19.1
19.4
22.4
22.1
23.0
22.0
22.0
0 5 10 15 20 25Compo
site
Scien
ce
Reading
Math
Englis
h
2003-04 Average Scores
Regular College Prep
20.1
20.2
21.1
19.4
19.4
22.2
22
22.7
21.9
21.7
0 5 10 15 20 25Com
posite
Scien
ce
Reading
Math
Englis
h
2002-03 Average Scores
Regular College Prep
20.1
20.2
21
19.2
19.4
22.2
21.8
23
21.9
21.6
0 5 10 15 20 25Com
posite
Scien
ce
Reading
Math
Englis
h
2001-02 Average Scores
Regular College Prep
Source: ACT High School Profile (Executive Summary)
Albuquerque Public Schools Research, Development & Accountability
ACT & SAT Report
RDA/ml/ACT_SATreport2002-04 5/24/2007 11
SAT 2000-04 Summary Information Although the majority of college-bound students in New Mexico take the ACT, over six hundred students in APS choose to take the Scholastic Assessment Test (SAT) each year. These students are typically those who intend to go to out-of-state colleges or who may not yet have chosen the college or university they wish to attend. Because all universities and colleges in New Mexico accept the ACT, it is unnecessary for those students seeking higher education in New Mexico to take the SAT. Since 1994-95, students have been participating in the new SAT (Scholastic Assessment Test) Program. The new SAT I: Reasoning Test has replaced the traditional SAT (Scholastic Aptitude Test) and the new SAT I has been linked statistically to the traditional. The College Board introduced a new re-centered scale in April 1995. This recalibration re-established 500 as the average on each test's scale of 200 to 800 points. Since the SAT was "re-centered" meaningful comparisons can be made between a student's Verbal and Math subtest scores. ETS has prepared a table of equivalent scores for use by college admissions officers and guidance counselors to assist in interpreting the new scale. Currently, the SAT is composed of two major subtests, Verbal and Math. APS has higher average scores than both the state and the nation over the last five years. In 2003-04, APS has averaged 13 points higher than the state and 59 points higher than the nation on the Verbal subtest. In the same year, APS averaged 19 points higher than the state and 44 points higher than the nation on the Math subtest (Figure 3). Starting in March 2005, the “new” SAT will be comprised of a writing section, in addition to the Verbal and Math sections. The score range for each of the three sections will be 200-800 points.

Albuquerque Public Schools Research, Development & Accountability
ACT & SAT Report
RDA/ml/ACT_SATreport2002-04 5/24/2007 12
Figure 3: Average SAT Verbal and Math Scores for APS, New Mexico, and the Nation 2000-2004
514
514
516
519
518
543
542
543
540
543
561
563
560
559
562
400 500 600
1999-00
2000-01
2001-02
2002-03
2003-04
Math
Nation NM APS
Source: SAT Collegebound Senior Profile (Table 6)
505
506
504
507
508
549
551
551
548
554
561
564
561
562
567
400 500 600
1999-00
2000-01
2001-02
2002-03
2003-04
Verbal
Nation NM APS

Albuquerque Public Schools Research, Development & Accountability
ACT & SAT Report
RDA/ml/ACT_SATreport2002-04 5/24/2007 13
Results for all years are reported on the re-centered scale, which the Educational Testing Service implemented in the 1995-96 school year. This was the second time ETS re-centered scores, which was done, as it was the first time in 1941, to reflect the more diverse group that the re-norming was based on. Re-norming has established 500 as the mean in both Verbal and Math sections and, additionally, has aligned the scores in both areas so that they are comparable to each other.
Table 1. Number and Percent of Males and Females Tested
ACT SAT
1999-2000 2000-2001 2001-2002 2002-2003 2003-2004 1999-2000 2000-2001 2001-2002 2002-2003 2003-04
Males 1191 (43%) 1105 (44%) 1101 (44%)
1133 (44%) 1133 (44%) 246 (46%) 258 (48%) 283 (46%) 275 (45%) 298 (46%)
Females 1591 (57%) 1464 (56%) 1401 (56%)
1425 (56%) 1419 (56%) 289 (54%) 278 (52%) 326 (54%) 340 (55%) 355 (54%)
*No Response 6 14 14 23 19 - - - -
Total 2788 2583 2516 2581 2571 535 536 609 615 653
*Not included in percent Sources: ACT High School Profile (Table 6) and SAT Collegebound Senior Profile (Table 1)
Table 2. Percent of Graduating Class Having Taken College Entrance Exams During High School
1999-00 2000-01 2001-2002 2002-03 2003-04 Senior Enrollment* 4637 4201 4449 4649 4317
N % N % N % N % N %
ACT 2788 60 2583 61 2516 57 2581 56 2571 60
SAT 535 12 536 13 609 14 615 13 653 15
* Source: 40-day count Sources: ACT High School Profile (Table 11) SAT Collegebound Senior Profile (Table 1)

Albuquerque Public Schools Research, Development & Accountability
ACT & SAT Report
RDA/ml/ACT_SATreport2002-04 5/24/2007 14
Table 3. Grade Level At Time of Testing
ACT SAT
2001-02 2002-03 2003-04 2001-02 2002-03 2003-04
N % N % N % N % N % N %
Freshman 0 - 0 - - 0 1 <1 0 - 0 -
Sophomore 17 <1 10 <1 6 <1 7 1 - - 7 1
Juniors 637 26 706 29 673 28 245 40 264 43 262 40
Seniors 1768 73 1737 71 1763 72 356 58 351 57 384 59
*Other/No Response
94 - 128 - 129 - 0 - 0 - 0 -
Total 2516 2581 2571 609 615 653 *Not included in percent Sources: ACT High School Profile (Table 11) SAT Collegebound Senior Profile (Table 1)

Albuquerque Public Schools Research, Development & Accountability
ACT & SAT Report
RDA/ml/ACT_SATreport2002-04 5/24/2007 15
Table 4. Student-Reported Grade Point Average
ACT
2001-2002 2002-2003 2003-2004 Grade Range N % Avg.
Composite N % Avg.
Composite N % Avg.
Composite
3.50 - 4.00 3.00 - 3.49 2.50 - 2.99 2.00 - 2.49 1.99 and below
722 749 458 223 54
33 34 21 10 2
24.1 21.0 19.3 18.7 17.5
730 722 494 247 54
32 32 22 11 2
24.1 20.9 19.3 18.8 17.9
755 642 447 235 60
35 30 21 11 3
24.4 21.3 18.9 18.3 16.9
Source: ACT High School Profile (Table 8)
SAT
2001-2002 2002-2003 2003-2004
Grade Range N % Avg. Verbal
Avg. Math
N % Avg. Verbal
Avg. Math
N % Avg. Verbal
Avg. Math
A+ A A- B C D, E, F *No Response
88 124 109 192 25 -
71
16 23 20 36 5 - -
625 591 559 530 505
- -
653 599 557 515 484
- -
75 139 110 185 29 2 75
14 26 20 34 5 <1 -
637 598 568 517 461
- -
645 612 567 502 451
- -
96 174 113 183 32 -
55
16 29 19 31 5 -
638 592 575 519 465
- -
630 603 561 513 447
- -
*Not included in percent Source: SAT Collegebound Senior Profile (Table 2)

Albuquerque Public Schools Research, Development & Accountability
ACT & SAT Report
RDA/ml/ACT_SATreport2002-04 5/24/2007 16
Table 5. Student-Estimated Family Income
ACT
2001-2002 2002-2003 2003-2004
Income Range N % Avg. Comp.
N % Avg. Comp. N % Avg. Comp.
Less than $18,000 $18,000 - $24,000 $24,000 - $30,000 $30,000 - $36,000 $36,000 - $42,000 $42,000 - $50,000 $50,000 - $60,000 $60,000 - $80,000 $80,000 - $100,000 More than $100,000 No response
194 138 141 153 188 190 213 381 269 279 370
8 5 6 6 7 8 8 15 11 11 15
18.7 19.2 20.3 20.2 20.1 21.3 21.5 21.8 22.9 23.0 21.0
164 164 167 148 170 175 244 398 273 304 374
6 6 6 6 7 7 9 15 11 12 14
18.7 19.1 19.3 19.9 20.1 21.2 21.1 22.1 22.1 23.3 21.3
173 156 164 151 156 203 204 343 269 318 434
7 6 6 6 6 8 8 13 10 12 17
18.4 19.0 19.8 20.0 21.3 20.6 21.1 21.9 22.4 23.4 21.3
Source: ACT High School Report (Table 11)

Albuquerque Public Schools Research, Development & Accountability
ACT & SAT Report
RDA/ml/ACT_SATreport2002-04 5/24/2007 17
Table 5. Student-Estimated Family Income (cont’d)
SAT
2001-2002 2002-2003 2003-2004
Income Range N % Avg. Verb.
Avg. Math
N % Avg. Verb.
Avg. Math
N % Avg. Verb.
Avg. Math
Less than $10,000 $10,000 - $20,000 $20,000 - $30,000 $30,000 - $40,000 $40,000 - $50,000 $50,000 - $60,000 $60,000 - $70,000 $70,000 - $80,000 $80,000 - $100,000 More than $100,000 *No response
7 13 27 35 55 33 57 35 73 86 188
2 3 6 8 13 8 14 8 17 20
481 555 539 556 575 536 552 576 587 568
447 526 523 573 562 552 551 580 586 572
5 22 24 41 38 43 31 33 73 83 222
1 6 6 10 10 11 8 8 19 21
440 499 562 528 547 551 575 578 574 585
466 489 510 505 544 550 568 583 580 583
1 21 34 39 33 39 44 40 78 107 217
0 5 8 9 8 9 10 9 18 25
510 545 539 536 546 550 583 559 577
501 542 547 540 562 530 564 545 583
*Not included in percent Source: SAT Collegebound Senior Profile (Table 4-2)
Table 6. Ethnicity
ACT

Albuquerque Public Schools Research, Development & Accountability
ACT & SAT Report
RDA/ml/ACT_SATreport2002-04 5/24/2007 18
2001-2002 2002-2003 2003-2004
Ethnic Group N % Avg. Composite
N % Avg. Composite
N % Avg. Composite
Amer/Alaskan Native Asian/Pacific Amer Black/African-Amer Mexican Amer/Chicano Puerto Rican/Hispanic Caucasian Amer/White Other Multi-racial No response Prefer no response
62 93 71
504 150
1143 90
135 81
187
2 4 3 20 6 45 4 5 3 7
19.0 22.1 18.7 19.3 19.5 22.5 18.6 21.1 22.3 21.5
72 105 71
535 164
1115 112 134 71
202
3 4 3 21 6 43 4 5 3 8
18.5 21.5 18.9 19.3 19.5 22.4 19.9 21.2 21.4 22.3
73 80 79
489 234
1113 102 149 91
161
3 3 3 19 9 43 4 6 4 6
18.6 21.8 18.6 19.3 18.9 22.8 19.6 20.9 22.0 22.2
Source: ACT High School Profile (Table 11) and SAT Collegebound Senior Profile (Table 4-1)
SAT
2001-2002 2002-2003 2003-2004
Ethnic Group N % Avg. Verbal
Avg. Math
N % Avg. Verbal
Avg. Math
N % Avg. Verbal
Avg. Math
Amer Indian/Alaskan Nat Asian/As Amer/Pacific Is Black/African American Mexican/Mexican American Puerto Rican Hispanic/Latino White Other No Response
12 29 23 37 -
43 341 25 99
2 6 5 7 - 8 67
5 -
512 550 514 550
- 510 575 573 559
483 593 481 553
- 502 573 578 559
12 41 10 38 3 41
312 31
127
2 8 2 8 <1 8 64
6 -
516 571 467 542
- 522 567 553 580
478 600 486 547
- 516 563 535 573
8 39 18 44 2 33
355 46
108
1 7 3 8 <1 6 65
8 -
481 560 508 530
- 498 573 602 587
501 580 490 524
- 508 571 568 572
Table 7. Educational Goals
ACT

Albuquerque Public Schools Research, Development & Accountability
ACT & SAT Report
RDA/ml/ACT_SATreport2002-04 5/24/2007 19
2001-2002 2002-2003 2003-2004
Educational Goal N % Avg. Composite
N % Avg. Composite
N % Avg. Composite
Voc/Tech 2 Yr College Degree
Bachelor's Graduate Study
Professional Level Degree Other
No Response
14 46 742 548 940 58 168
1 2 29 22 37 2 7
17.6 16.9 20.1 22.3 21.9 18.5 20.5
13 59 760 570 956 65 158
1 2
29 22 37 3 6
15.8 17.9 20.0 22.4 21.9 18.6 20.4
15 56
770 557 905 65 203
1 2
30 22 35 3 8
18.5 17.2 20.0 22.7 22.0 18.2 20.2
Source: ACT High School Profile (Table 11)
SAT
2001-2002 2002-2003 2003-2004
Educational Goal N % Avg. Verbal
Avg. Math
N % Avg. Verbal
Avg. Math
N % Avg. Verbal
Avg. Math
Certificate Program Associate (2 yr.)
Bachelor's Master's
Doctoral/Related Degree Other
Undecided
2 3
62 172 187 3 78
0 1
12 34 37 1
15
- -
541 550 580
- 578
- -
533 556 571
- 582
3 2
58 177 176 3
88
1 0
11 35 35 1
17
- -
501 552 593
- 576
- -
495 553 590
- 578
5 1
74 181 189 -
104
1 0
13 33 34 - 19
466 -
517 565 582
- 577
458 -
501 560 583
- 572
Source: SAT Collegebound Senior Profile (Table 5)

Albuquerque Public Schools Research, Development & Accountability
ACT & SAT Report
RDA/ml/ACT_SATreport2002-04 5/24/2007 20
Table 8. Most Frequent College Major
ACT
2001-2002 2002-2003 2003-2004
Major
N
Avg. Composite
N Avg. Composite
N Avg. Composite
Health Business
Social Sciences Engineering
Art Sciences Education
373 229 203 178 177 171 70
20.8 19.6 21.6 22.7 21.4 23.5 20.6
410 233 213 150 168 175 81
20.3 20.7 21.3 22.5 21.0 23.6 20.2
412 201 179 127 174 165 95
20.7 19.9 21.6 23.0 20.5 23.7 20.6
Sources: ACT High School Profile (Table 10) and SAT Collegebound Senior Profile (Table 5)
SAT
2001-2002 2002-2003 2003-2004
Major N Avg. Verbal
Avg. Math
N Avg. Verbal
Avg. Math
N Avg. Verbal
Avg. Math
Health Engineering
Social Sciences Arts
Biological Sciences Business Education
Physical Sciences Computer/
Info. Sciences
78 69 52 47 60 46 13 14
25
539 581 562 553 580 522 535 610
574
533 631 546 548 582 526 502 632
585
72 71 52 41 57 47 12 17
21
538 574 551 553 578 527 568 608
600
533 605 517 531 573 529 581 633
622
76 80 49 33 56 40 19 18
15
543 565 551 561 601 534 552 667
581
549 602 516 524 590 540 543 661
575

Albuquerque Public Schools Research, Development & Accountability
ACT & SAT Report
RDA/ml/ACT_SATreport2002-04 5/24/2007 21
Table 9. Five-Year Trends of ACT-Tested Student Evaluations of APS High Schools
ASPECT OF PROGRAMS
1999-2000 2000-2001 2001-2002 2002-2003 2003-2004
% satisfied
% dissatisfied
% satisfied
% dissatisfied
% satisfied
% dissatisfied
% satisfied
% dissatisfied
% satisfied
% dissatisfied
Classroom Instruction Variety of Courses Grading Practices Number/Kinds of Tests Guidance Services School Rules Library/Learning Center Laboratory Facilities Remedial Skills Devlp. Honors Program Career Education
46 55 44 41 39 33 44 44 27 54 34
15 17 16 13 25 31 17 18 13 9 21
45 53 43 40 37 33 42 43 26 51 31
17 18 17 13 27 31 18 18 13 9 22
43 51 41 38 35 31 42 42 26 50 31
16 18 17 14 25 28 17 19 12 10 20
43 51 41 38 36 31 41 41 27 50 30
16 17 16 13 25 27 17 18 13 9
20
43 49 39 37 35 31 39 40 26 49 32
13 16 14 14 23 25 17 17 12 8
17
Note: Percentages may not sum to 100 because some students were neutral or did not respond. Table 9 shows that across the past five years the greatest satisfaction with program aspects of high school for students taking the ACT has been with Variety of Courses and Honors Program although there has been a decrease in the satisfaction of both of these since 1999-2000. There have also been negative trends on the satisfaction level of most of the other aspects of high school programs. The lowest satisfaction is with the categories of Remedial Skills Development, School Rules, and Career Education although 2% more students expressed satisfaction with Career Education from the previous year. The satisfaction rate with Remedial Education, though low, has remained the most stable over the past five years. Source: ACT High School Profile (Executive Summary)
Albuquerque Public Schools Research, Development & Accountability
ACT & SAT Report
RDA/ml/ACT_SATreport2002-04 5/24/2007 22
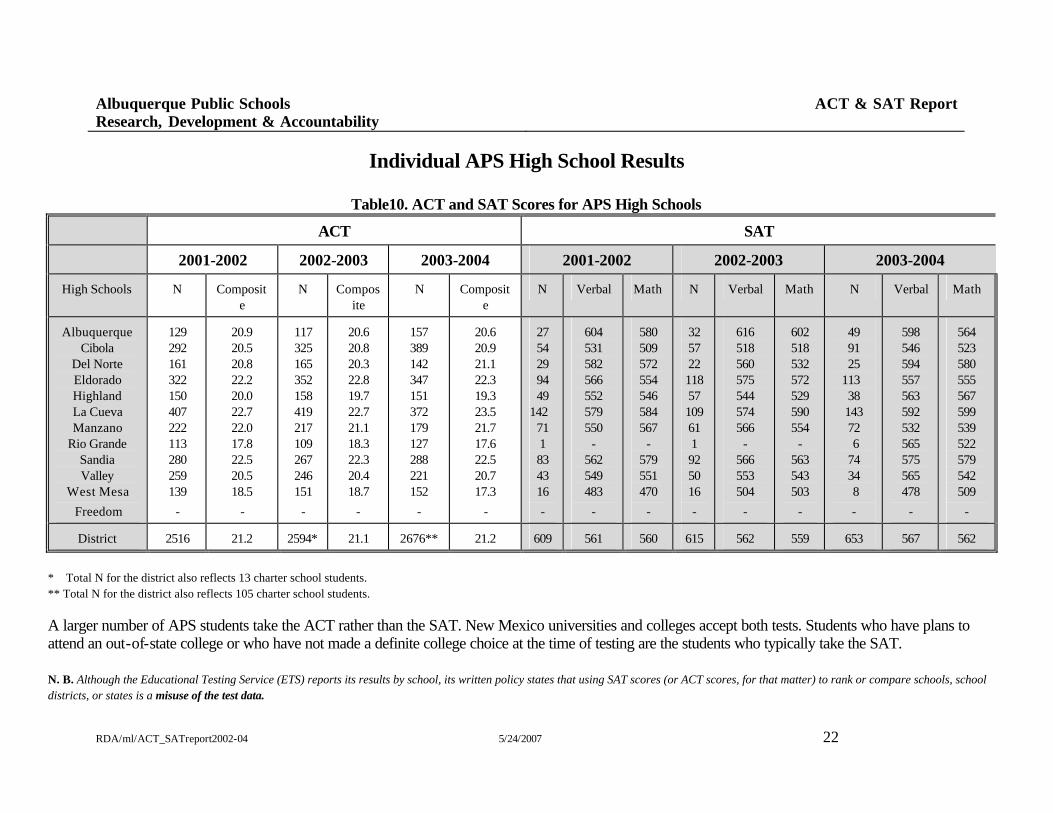
Individual APS High School Results Table10. ACT and SAT Scores for APS High Schools
ACT SAT
2001-2002 2002-2003 2003-2004 2001-2002 2002-2003 2003-2004
High Schools N Composite
N Composite
N Composite
N Verbal Math N Verbal Math N Verbal Math
Albuquerque Cibola
Del Norte Eldorado Highland La Cueva Manzano
Rio Grande Sandia Valley
West Mesa
Freedom
129 292 161 322 150 407 222 113 280 259 139
-
20.9 20.5 20.8 22.2 20.0 22.7 22.0 17.8 22.5 20.5 18.5
-
117 325 165 352 158 419 217 109 267 246 151
-
20.6 20.8 20.3 22.8 19.7 22.7 21.1 18.3 22.3 20.4 18.7
-
157 389 142 347 151 372 179 127 288 221 152
-
20.6 20.9 21.1 22.3 19.3 23.5 21.7 17.6 22.5 20.7 17.3
-
27 54 29 94 49
142 71 1 83 43 16
-
604 531 582 566 552 579 550
- 562 549 483
-
580 509 572 554 546 584 567
- 579 551 470
-
32 57 22 118 57 109 61 1 92 50 16
-
616 518 560 575 544 574 566
- 566 553 504
-
602 518 532 572 529 590 554
- 563 543 503
-
49 91 25
113 38 143 72 6 74 34 8
-
598 546 594 557 563 592 532 565 575 565 478
-
564 523 580 555 567 599 539 522 579 542 509
-
District 2516 21.2 2594* 21.1 2676** 21.2 609 561 560 615 562 559 653 567 562
* Total N for the district also reflects 13 charter school students. ** Total N for the district also reflects 105 charter school students. A larger number of APS students take the ACT rather than the SAT. New Mexico universities and colleges accept both tests. Students who have plans to attend an out-of-state college or who have not made a definite college choice at the time of testing are the students who typically take the SAT. N. B. Although the Educational Testing Service (ETS) reports its results by school, its written policy states that using SAT scores (or ACT scores, for that matter) to rank or compare schools, school districts, or states is a misuse of the test data.