acceleration of the sea surface fco2 growth rate in the north atlantic subpolar gyre (1993-2008)
DESCRIPTION
CARBOOCEAN Final meeting, Bergen, 5-10/10/09. Acceleration of the sea surface fCO2 growth rate in the North Atlantic Subpolar Gyre (1993-2008). N. Metzl, A Corbière, G. Reverdin, A.Lenton, T. Takahashi, A. Olsen, T. Johannessen, D. Pierrot, R. Wanninkhof , - PowerPoint PPT PresentationTRANSCRIPT

Acceleration of the sea surface fCO2 growth rate in the North Atlantic Subpolar Gyre (1993-2008).
N. Metzl, A Corbière, G. Reverdin, A.Lenton, T. Takahashi, A. Olsen,
T. Johannessen, D. Pierrot, R. Wanninkhof , S. R. Ólafsdóttir, J. Olafsson and M. Ramonet
CARBOOCEAN Final meeting, Bergen, 5-10/10/09

0.0
0.5
1.0
1.5
2.0
2.5
3.0
1975 1980 1985 1990 1995 2000 2005 2010
Year
An
nu
al x
CO
2 ra
te (
pp
m/y
r)
1980-19951990-2007
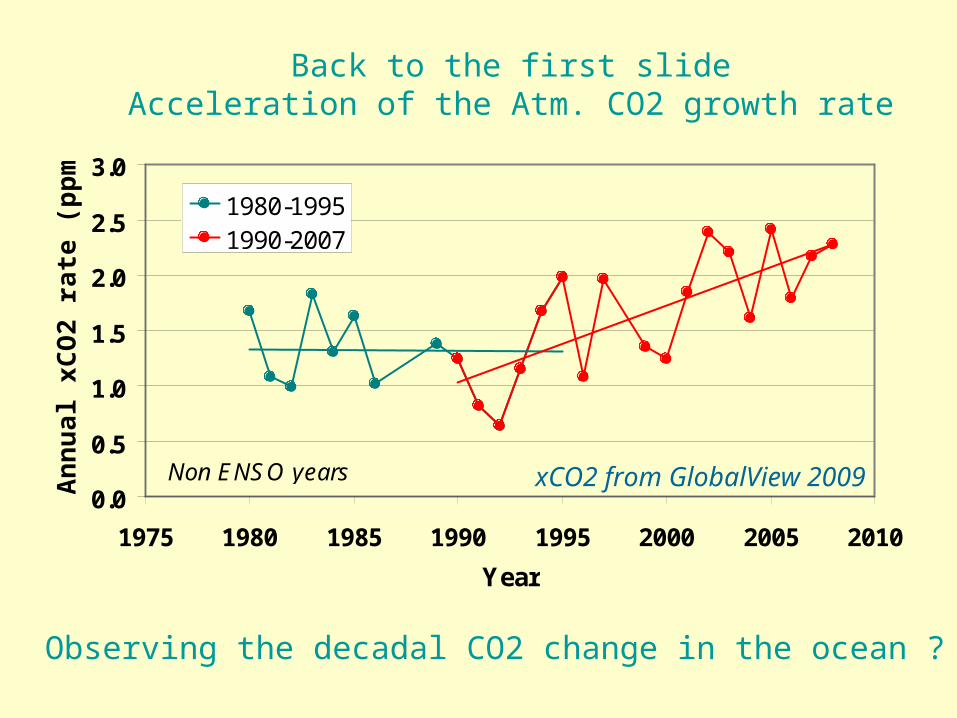
Non ENSO years xCO2 from GlobalView 2009
Observing the decadal CO2 change in the ocean ?
…. Acceleration of the Atm. CO2 growth rate since 90s

Global net flux: 2 (+/-1) PgC/yrImportant improvement, but climatology is for
a virtual (e.g. non ENSO) and fixed year (here 2000)What are the temporal variations of the ocean carbon sink ?
Air-Sea CO2 flux climatology (Takahashi et al, 2009)

Moving from the climatology to trendsOne global synthesis based on observations
(CO2 fluxes)
(adapted from Le Quéré et al., in rev, 2009)
????
??????
??
??
????
Sink decreasesSink increasesDifferent regions….different trends

Moving from the climatology to trends (1)A zoom in the North Atlantic (…Go game)
(adapted from Le Quéré et al., in rev 2009)Sink decreasesSink increases
????
????
Different regions….different trends
Schuster et al. DSR SOCOVV,2009
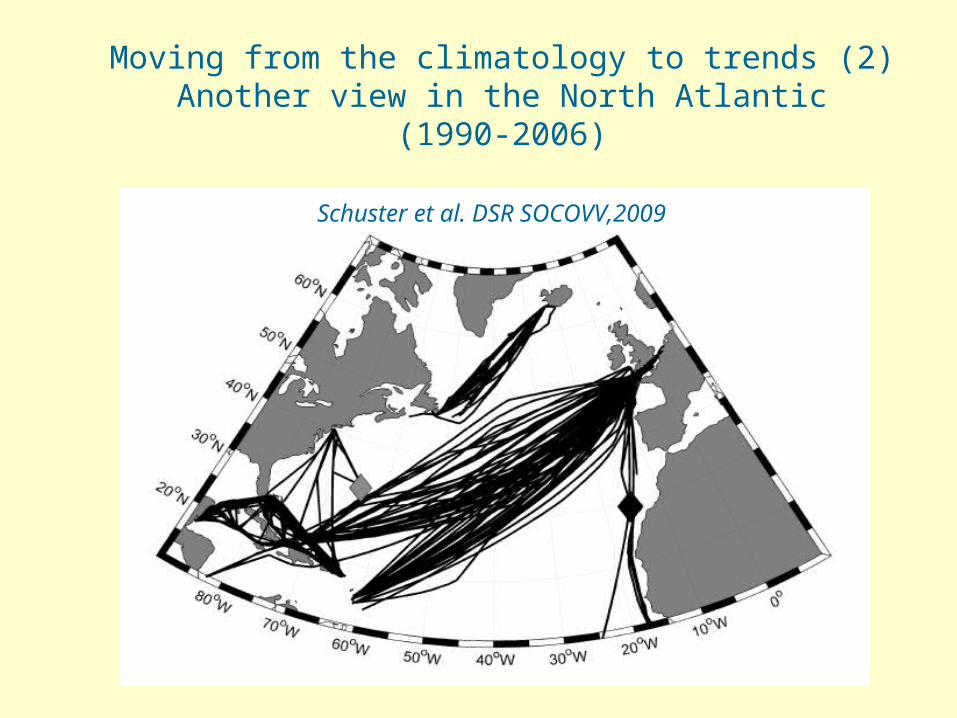
Moving from the climatology to trends (2)Another view in the North Atlantic
(1990-2006)

Schuster et al. DSR SOCOVV,2009
Annual trend in pCO2 (μatm/yr) between 1990 and 2006
The North Atlantic carbon sink decreases almost everywhereClear signal in the subpolar gyre
Atmospheric growth rate
pCO2 trendsubpoplar gyre
Different regions….different trends
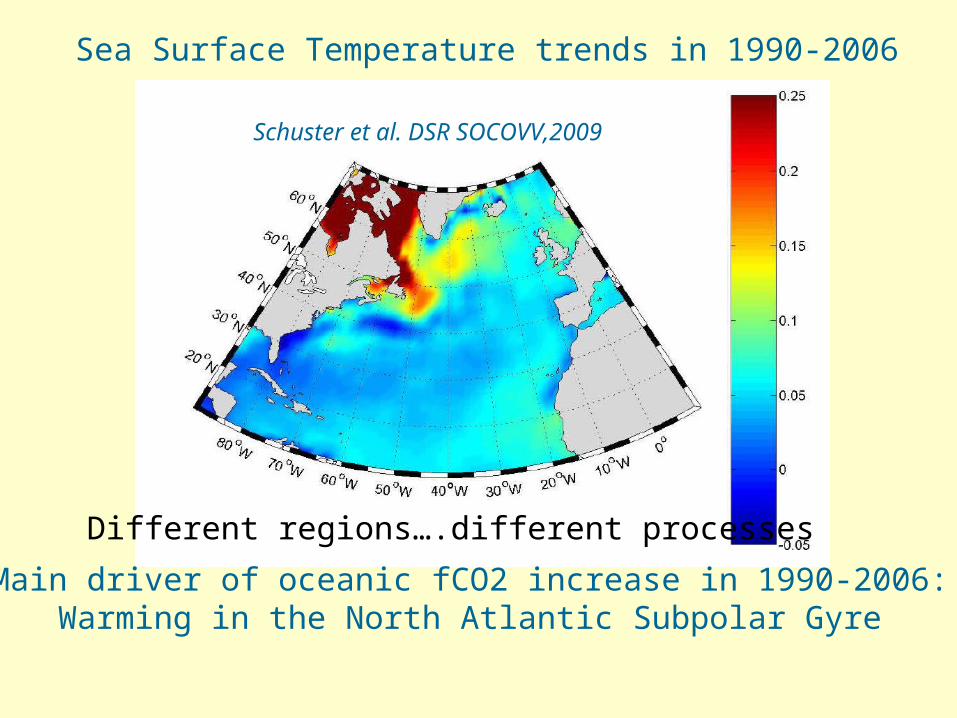
Schuster et al. DSR SOCOVV,2009
Main driver of oceanic fCO2 increase in 1990-2006:Warming in the North Atlantic Subpolar Gyre
Sea Surface Temperature trends in 1990-2006
Different regions….different processes

Another view ofNorth Atlantic
CO2 fluxes
???….???
CLIM
Schuster et al. DSR ,2009
Different models….different trends
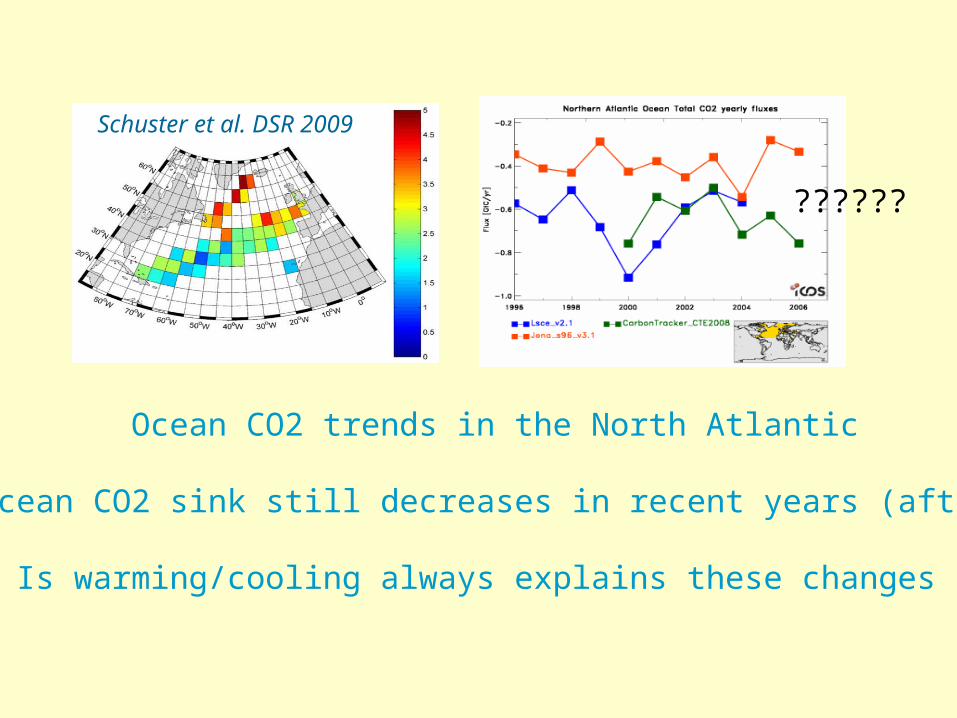
Ocean CO2 trends in the North Atlantic
Is the ocean CO2 sink still decreases in recent years (after 2006) ?
Is warming/cooling always explains these changes ?
Schuster et al. DSR 2009
??????
Acceleration of the sea surface fCO2 growth rate in the North Atlantic Subpolar Gyre (1993-2008).
N. Metzl, A Corbière, G. Reverdin, A.Lenton, T. Takahashi, A. Olsen,
T. Johannessen, D. Pierrot, R. Wanninkhof , S. R. Ólafsdóttir, J. Olafsson and M. Ramonet
CARBOOCEAN Final meeting, Bergen, 5-10/10/09

Another view of the sea surface fCO2 changesDecadal variations in the North Atlantic Subpolar Gyre 1993-2008

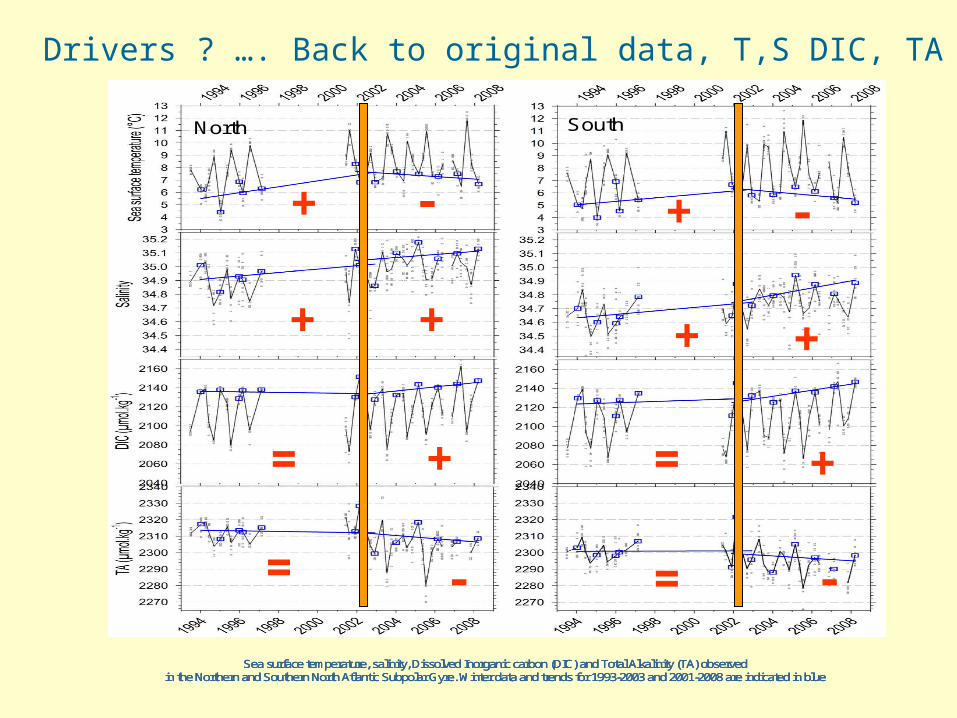
Sea surface temperature, salinity, Dissolved Inorganic carbon (DIC) and Total Alkalinity (TA) observed in the Northern and Southern North Atlantic Subpolar Gyre. Winter data and trends for 1993-2003 and 2001-2008 are indicated in blue
North South
Sea surface temperature, salinity, Dissolved Inorganic carbon (DIC) and Total Alkalinity (TA) observed in the Northern and Southern North Atlantic Subpolar Gyre. Winter data and trends for 1993-2003 and 2001-2008 are indicated in blue
Sea surface temperature, salinity, Dissolved Inorganic carbon (DIC) and Total Alkalinity (TA) observed in the Northern and Southern North Atlantic Subpolar Gyre. Winter data and trends for 1993-2003 and 2001-2008 are indicated in blue
North South
Original data, T,S DIC, TA used to calculate fCO2
Trends in winter

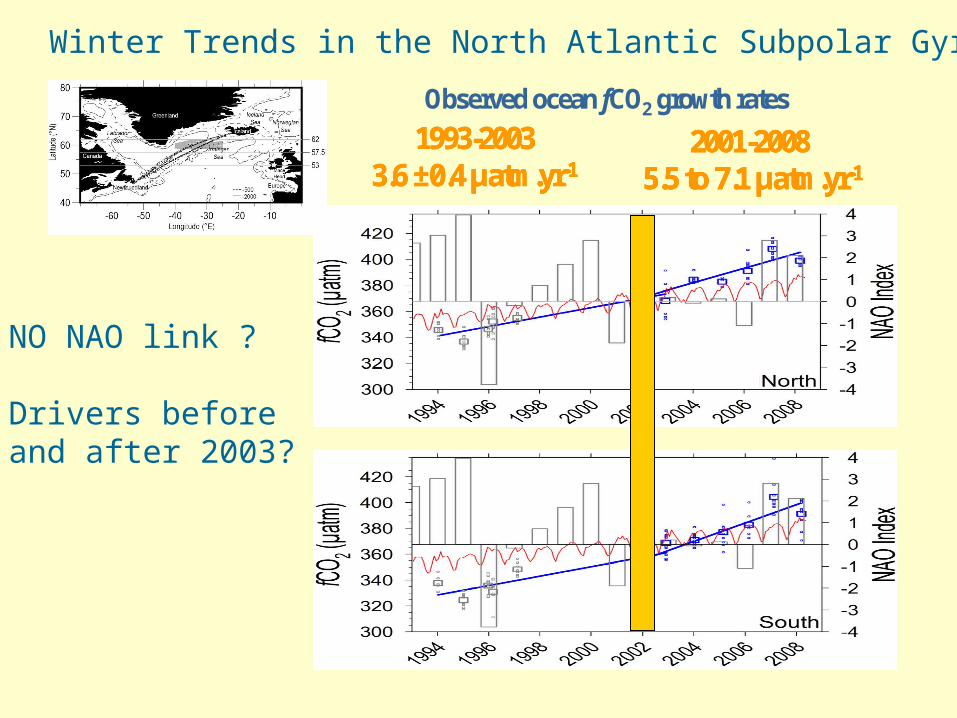
1993-20033.6 ±0.4 µatm.yr-1
2001-2008 5.5 to 7.1 µatm.yr-1
1993-20033.6 ±0.4 µatm.yr-1
2001-2008 5.5 to 7.1 µatm.yr-1
1993-20033.6 ±0.4 µatm.yr-1
2001-2008 5.5 to 7.1 µatm.yr-1
Observed ocean fCO2 growth rates
Winter Trends in the North Atlantic Subpolar Gyre
Different periods….different trends

For recent years:comparing fCO2cal and fCO2mes
fCO2 cal: 5-7 µatm/yrfCO2mes: 5-6 µatm/yr
Wanninkhof et al.Olsen et al.
1993-20033.6 ±0.4 µatm.yr-1
2001-2008 5.5 to 7.1 µatm.yr-1
1993-20033.6 ±0.4 µatm.yr-1
2001-2008 5.5 to 7.1 µatm.yr-1
1993-20033.6 ±0.4 µatm.yr-1
2001-2008 5.5 to 7.1 µatm.yr-1
Observed ocean fCO2 growth rates
Winter Trends in the North Atlantic Subpolar Gyre
NO NAO link ?
Drivers before and after 2003?
Sea surface temperature, salinity, Dissolved Inorganic carbon (DIC) and Total Alkalinity (TA) observed in the Northern and Southern North Atlantic Subpolar Gyre. Winter data and trends for 1993-2003 and 2001-2008 are indicated in blue
North South
Sea surface temperature, salinity, Dissolved Inorganic carbon (DIC) and Total Alkalinity (TA) observed in the Northern and Southern North Atlantic Subpolar Gyre. Winter data and trends for 1993-2003 and 2001-2008 are indicated in blue
Sea surface temperature, salinity, Dissolved Inorganic carbon (DIC) and Total Alkalinity (TA) observed in the Northern and Southern North Atlantic Subpolar Gyre. Winter data and trends for 1993-2003 and 2001-2008 are indicated in blue
North South
Drivers ? …. Back to original data, T,S DIC, TA
+ -
=
+ -
+ + + +
++=
= =- -
-4
-2
0
2
4
6
8
SST SSS DIC TA TOTAL OBS
Ra
te o
f fC
O2
ch
an
ge
(µ
atm
/yr)
1993-2003
2001-2008
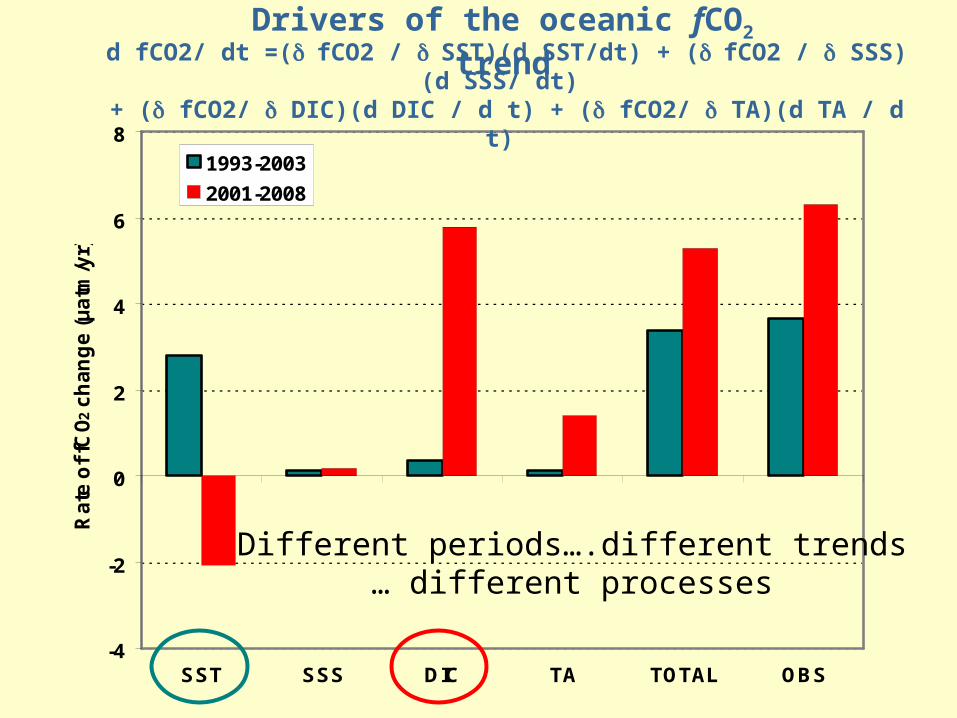
Drivers of the oceanic fCO2 trendd fCO2/ dt =(fCO2 / SST)(d SST/dt) + (fCO2 / SSS)(d SSS/ dt)
+ ( fCO2/ DIC)(d DIC / d t) + ( fCO2/ TA)(d TA / d t)
Different periods….different trends… different processes

Ratio DIC/TA: surface temporal changes and water column distribution
0
100
200
300
400
500
600
700
800
900
0.910 0.915 0.920 0.925 0.930 0.935 0.940
Ratio DIC/TA
De
pth
(m
)
1993
1995
1997
1999
2001
2003
2005
2007
2009
2011
Ye
ar
Glodap N
Glodap S
Suratlant N
Suratlant S
North/South contrast
Proposed scenario:rapid fCO2 increase
in recent years linked to vertical mixing/convection
(ARGO -Vage et al, 2008)
0.0
0.5
1.0
1.5
2.0
2.5
3.0
1975 1980 1985 1990 1995 2000 2005 2010
Year
An
nu
al x
CO
2 ra
te (
pp
m/y
r)
1980-19951990-2007
Non ENSO years
Back to the first slideAcceleration of the Atm. CO2 growth rate
xCO2 from GlobalView 2009
Observing the decadal CO2 change in the ocean ?

Ocean versus atmospheric CO2 increase
North Atlantic Subpolar Gyre
0
1
2
3
4
5
6
7
1975 1980 1985 1990 1995 2000 2005 2010
Year
An
nu
al x
CO
2 ra
te (
pp
m/y
r) 1980-19951990-2007
Non ENSO years
Ocean CO2 growth rate is faster than atmosphereThe ocean sink decreases
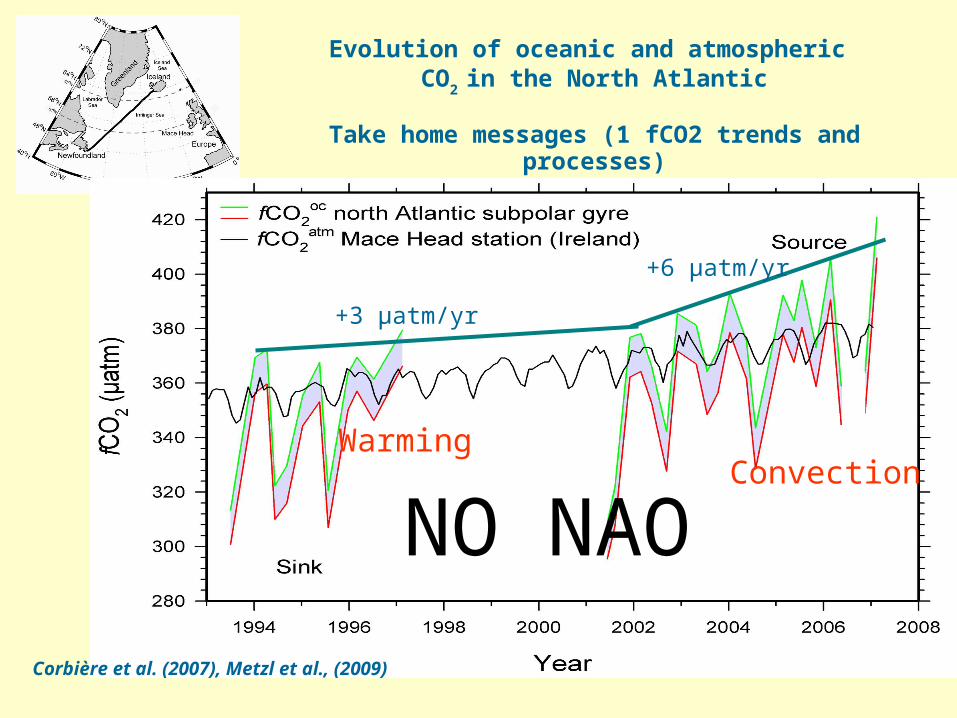
Evolution of oceanic and atmospheric CO
2 in the North Atlantic
Take home messages (1 fCO2 trends and processes)
+3 µatm/yr
+6 µatm/yr
WarmingConvection
Corbière et al. (2007), Metzl et al., (2009)
NO NAO

150
200
250
300
350
400
450
500
550
600
1992 1994 1996 1998 2000 2002 2004 2006 2008 2010
Year
fCO
2 (
µatm
)
pH = -0.043/decade
7.85
7.90
7.95
8.00
8.05
8.10
8.15
8.20
8.25
8.30
8.35
1992 1994 1996 1998 2000 2002 2004 2006 2008 2010
Year
pH
Evolution of oceanic CO2 in the North Atlantic
Take home message 2 (fCO2 and pH changes)
Metzl, Unpublished

Observed decadal changes of sea surface fCO2 (and fluxes)
Different regions………….. Different trends
Different inversions……… .Different trends
Different periods………….. Different trends
Different periods………….. Different processes
Next:Investigate different data-set (LDEO – SOCAT)Investigate different ocean and coupled models…………………..work in (different ) progress

SOCATUnder QC>7 Mdata
Takahashi et alDSR 2009> 3 Mdata
(r) Evolutions of surface ocean CO2
After SOCOVV meeting, 2 data-bases !!!!

Heat fluxes anomalies in winter (1999-2008)
Vage et al. 2008
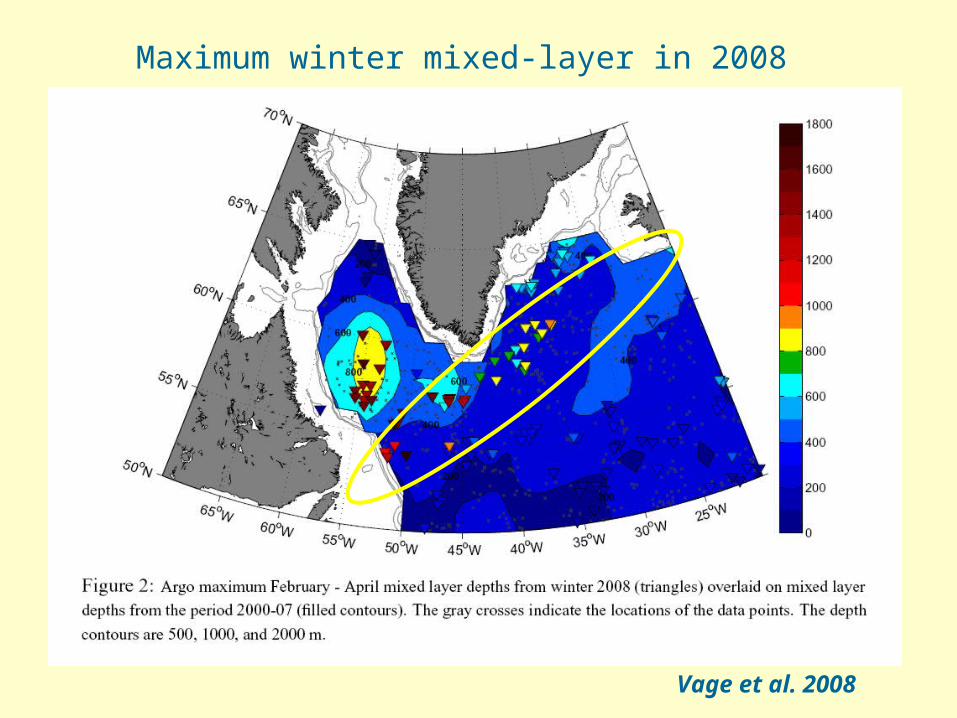
Maximum winter mixed-layer in 2008
Vage et al. 2008

Global Air-Sea Fluxes: view from three CC-CCC Models
1
1.5
2
2.5
3
3.5
1975 1980 1985 1990 1995 2000 2005 2010 2015 2020 2025
Year
Air
-Sea
CO
2 F
lux
(Pg
C/y
r) IPSL
UNIBE
BCCR
Temporal variations of Air-Sea CO2 fluxesrecent past, present and future
Coupled Climate Carbon Cycle Models (source, T.Roy LSCE/IPSL)
5yr 40 yr

Global Air-Sea Fluxes: view from three CC-CCC Models
1
1.5
2
2.5
3
3.5
1975 1980 1985 1990 1995 2000 2005 2010 2015 2020 2025
Year
Air
-Sea
CO
2 F
lux
(Pg
C/y
r) IPSL
UNIBE
BCCR
CCCC Models (source, T.Roy LSCE/IPSL)
Need to validate the temporal trends

Air-Sea CO2 flux basedon atmospheric CO2 data
Nm 8/3/09
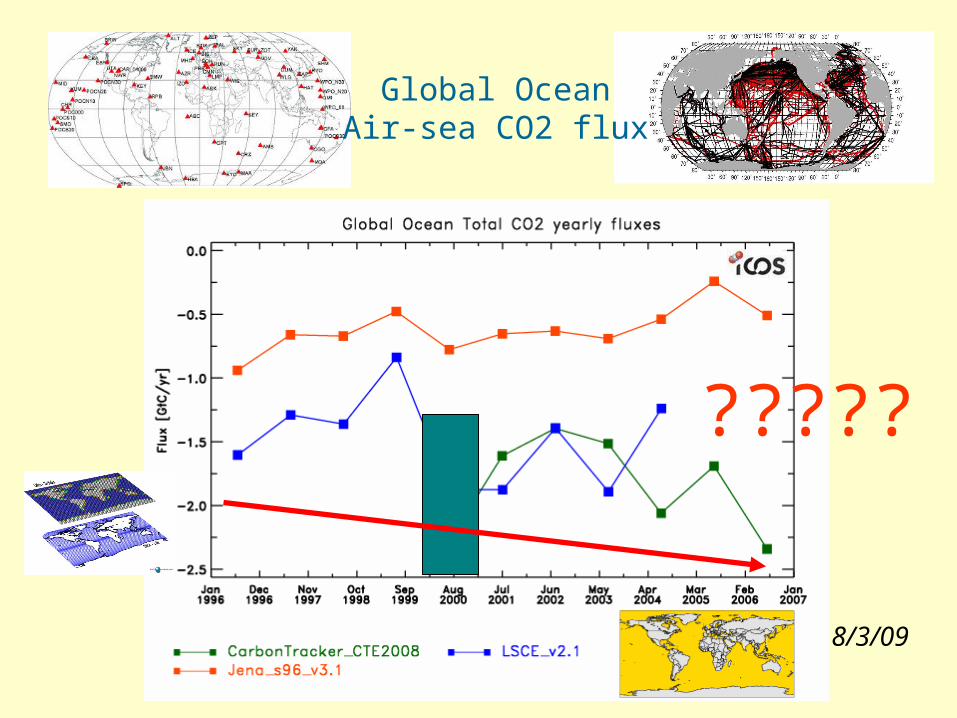
8/3/09
Global OceanAir-sea CO2 flux
?????


Schuster et al. DSR SOCOVV,2009
Annual trend in pCO2 (μatm/yr) between 1990 and 2006
The North Atlantic carbon sink decreases almost everywhereClear signal in the subpolar gyre
Atmospheric growth rate
pCO2 trendsubpoplar gyre