subseafloor sedimentary life in the south pacific gyre
TRANSCRIPT
Subseafloor sedimentary life in the South Pacific GyreSteven D’Hondta,1, Arthur J. Spivacka, Robert Pockalnya, Timothy G. Ferdelmanb, Jan P. Fischerb, Jens Kallmeyerc,Lewis J. Abramsd, David C. Smitha, Dennis Grahama, Franciszek Hasiuke, Heather Schruma, and Andrea M. Stancine
aGraduate School of Oceanography, University of Rhode Island, Narragansett Bay Campus, South Ferry Road, Narragansett, RI 02882; bMax PlanckInstitute for Marine Microbiology, Celsiusstrasse 1, D-28359 Bremen, Germany; cDepartment of Geosciences, University of Potsdam, Haus 27, Zi. 0.34,Karl-Liebknecht-Strasse 24, 14476 Golm, Germany; and dDepartment of Geography and Geology, University of North Carolina at Wilmington,DeLoach Hall, 601 South College Road, Wilmington, NC 28403; and eDepartment of Geological Sciences, University of Michigan,2534 C.C. Little Building, 1100 North University Avenue, Ann Arbor, MI 48109
Edited by Edward F. DeLong, Massachusetts Institute of Technology, Cambridge, MA, and approved May 6, 2009 (received for review November 23, 2008)
The low-productivity South Pacific Gyre (SPG) is Earth’s largest oce-anic province. Its sediment accumulates extraordinarily slowly (0.1–1m per million years). This sediment contains a living community thatis characterized by very low biomass and very low metabolic activity.At every depth in cored SPG sediment, mean cell abundances are 3 to4 orders of magnitude lower than at the same depths in all previouslyexplored subseafloor communities. The net rate of respiration by thesubseafloor sedimentary community at each SPG site is 1 to 3 ordersof magnitude lower than the rates at previously explored sites.Because of the low respiration rates and the thinness of the sediment,interstitial waters are oxic throughout the sediment column in mostof this region. Consequently, the sedimentary community of the SPGis predominantly aerobic, unlike previously explored subseafloorcommunities. Generation of H2 by radiolysis of water is a significantelectron-donor source for this community. The per-cell respirationrates of this community are about 2 orders of magnitude higher (inoxidation/reduction equivalents) than in previously explored anaer-obic subseafloor communities. Respiration rates and cell concentra-tions in subseafloor sediment throughout almost half of the worldocean may approach those in SPG sediment.
aerobic � biomass � oxic � radiolysis � respiration
L ife is previously unknown in the subseafloor sediment of the vastlow-productivity regions that dominate the open ocean. Past
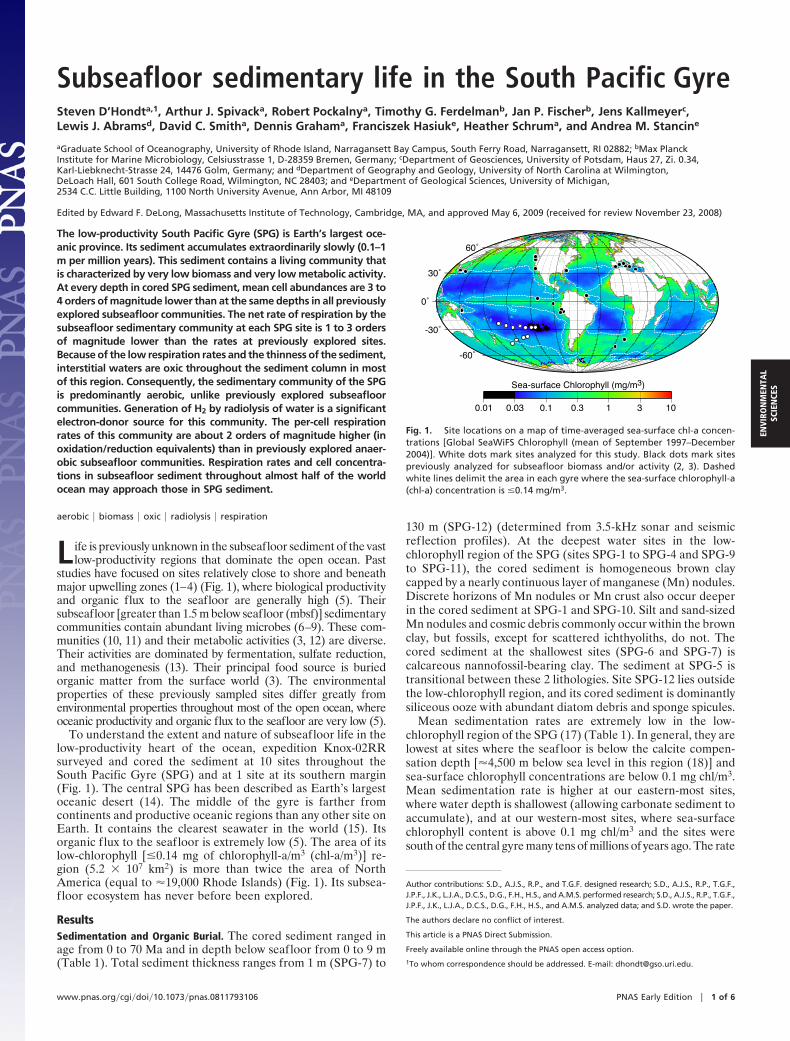
studies have focused on sites relatively close to shore and beneathmajor upwelling zones (1–4) (Fig. 1), where biological productivityand organic flux to the seafloor are generally high (5). Theirsubseafloor [greater than 1.5 m below seafloor (mbsf)] sedimentarycommunities contain abundant living microbes (6–9). These com-munities (10, 11) and their metabolic activities (3, 12) are diverse.Their activities are dominated by fermentation, sulfate reduction,and methanogenesis (13). Their principal food source is buriedorganic matter from the surface world (3). The environmentalproperties of these previously sampled sites differ greatly fromenvironmental properties throughout most of the open ocean, whereoceanic productivity and organic flux to the seafloor are very low (5).
To understand the extent and nature of subseafloor life in thelow-productivity heart of the ocean, expedition Knox-02RRsurveyed and cored the sediment at 10 sites throughout theSouth Pacific Gyre (SPG) and at 1 site at its southern margin(Fig. 1). The central SPG has been described as Earth’s largestoceanic desert (14). The middle of the gyre is farther fromcontinents and productive oceanic regions than any other site onEarth. It contains the clearest seawater in the world (15). Itsorganic flux to the seafloor is extremely low (5). The area of itslow-chlorophyll [�0.14 mg of chlorophyll-a/m3 (chl-a/m3)] re-gion (5.2 � 107 km2) is more than twice the area of NorthAmerica (equal to �19,000 Rhode Islands) (Fig. 1). Its subsea-floor ecosystem has never before been explored.
ResultsSedimentation and Organic Burial. The cored sediment ranged inage from 0 to 70 Ma and in depth below seafloor from 0 to 9 m(Table 1). Total sediment thickness ranges from 1 m (SPG-7) to
130 m (SPG-12) (determined from 3.5-kHz sonar and seismicreflection profiles). At the deepest water sites in the low-chlorophyll region of the SPG (sites SPG-1 to SPG-4 and SPG-9to SPG-11), the cored sediment is homogeneous brown claycapped by a nearly continuous layer of manganese (Mn) nodules.Discrete horizons of Mn nodules or Mn crust also occur deeperin the cored sediment at SPG-1 and SPG-10. Silt and sand-sizedMn nodules and cosmic debris commonly occur within the brownclay, but fossils, except for scattered ichthyoliths, do not. Thecored sediment at the shallowest sites (SPG-6 and SPG-7) iscalcareous nannofossil-bearing clay. The sediment at SPG-5 istransitional between these 2 lithologies. Site SPG-12 lies outsidethe low-chlorophyll region, and its cored sediment is dominantlysiliceous ooze with abundant diatom debris and sponge spicules.
Mean sedimentation rates are extremely low in the low-chlorophyll region of the SPG (17) (Table 1). In general, they arelowest at sites where the seafloor is below the calcite compen-sation depth [�4,500 m below sea level in this region (18)] andsea-surface chlorophyll concentrations are below 0.1 mg chl/m3.Mean sedimentation rate is higher at our eastern-most sites,where water depth is shallowest (allowing carbonate sediment toaccumulate), and at our western-most sites, where sea-surfacechlorophyll content is above 0.1 mg chl/m3 and the sites weresouth of the central gyre many tens of millions of years ago. The rate
Author contributions: S.D., A.J.S., R.P., and T.G.F. designed research; S.D., A.J.S., R.P., T.G.F.,J.P.F., J.K., L.J.A., D.C.S., D.G., F.H., H.S., and A.M.S. performed research; S.D., A.J.S., R.P., T.G.F.,J.P.F., J.K., L.J.A., D.C.S., D.G., F.H., H.S., and A.M.S. analyzed data; and S.D. wrote the paper.
The authors declare no conflict of interest.
This article is a PNAS Direct Submission.
Freely available online through the PNAS open access option.
1To whom correspondence should be addressed. E-mail: [email protected].
0.01 0.03 0.1 0.3 1 3 10
-60˚
-30˚
0˚
30˚
60˚
Sea-surface Chlorophyll (mg/m3)
Fig. 1. Site locations on a map of time-averaged sea-surface chl-a concen-trations [Global SeaWiFS Chlorophyll (mean of September 1997–December2004)]. White dots mark sites analyzed for this study. Black dots mark sitespreviously analyzed for subseafloor biomass and/or activity (2, 3). Dashedwhite lines delimit the area in each gyre where the sea-surface chlorophyll-a(chl-a) concentration is �0.14 mg/m3.
www.pnas.org�cgi�doi�10.1073�pnas.0811793106 PNAS Early Edition � 1 of 6
ENV
IRO
NM
ENTA
LSC
IEN
CES
is highest at SPG-12, just outside the central gyre, because ofsedimentation of siliceous debris. Mean sedimentation rates withinthe SPG are among the lowest that occur at the Earth’s surface. Thehighest SPG rates are, respectively, 1 and 2 orders of magnitudelower than rates at equatorial Pacific and Peru Margin sites, wheresubseafloor life has previously been studied (19, 20).
Organic carbon burial rates at the sediment surface in the brownclay-dominated sites of the low-chlorophyll region are also ex-tremely low (Table 1). The highest of these is more than 1 order ofmagnitude lower than organic carbon burial rates at sites wheresubseafloor sedimentary life has previously been studied [e.g., 4.5 �10�7 mol C/cm2 annually at equatorial Pacific Ocean DrillingProgram (ODP) Sites 1225 and 1226 and 3.1 � 10�6 mol C/cm2
annually at Peru Margin ODP Sites 1227 and 1230 (3)].Most of the buried organic matter is oxidized in the shallowest
portion of the sediment column. Burial of total organic carbon(TOC) below 1.5 mbsf ranges from 4.4 � 10�10 to 8.2 � 10�9 molC/cm2 annually (Table 1). TOC declines very little with increasingdepth below the initial few tens of centimeters below seafloor(cmbsf); for example, at SPG-3, it declines from 0.52% at 3 cmbsfto 0.26% at 23 cmbsf and 0.17% at 1.47 mbsf but then declines moreslowly to 0.09% at the base of the sediment column (5.17 mbsf). Ifthe TOC burial rate has been relatively constant over the 70 millionyears of sedimentation at SPG-3, the relative constancy of TOCcontent at depths greater than a few centimeters below seafloorindicates that organic matter at those depths is so recalcitrant orinaccessible that almost none of it has been oxidized since passingthrough the near-surface zone in its initial few million years after burial.
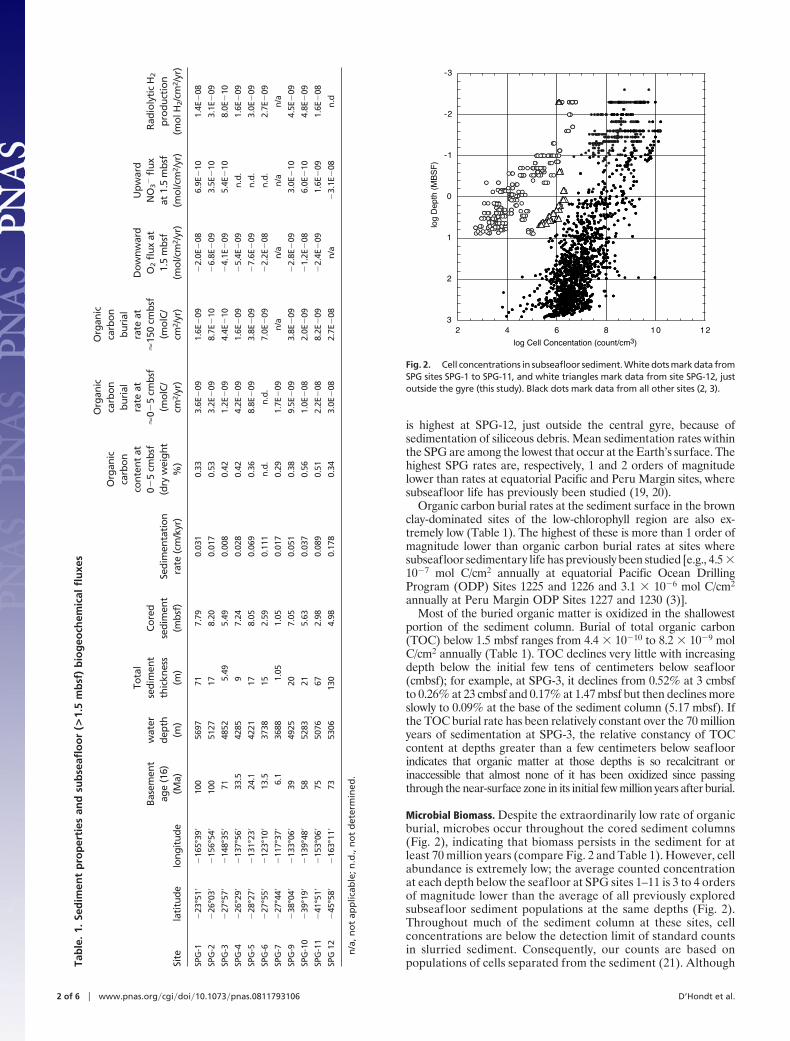
Microbial Biomass. Despite the extraordinarily low rate of organicburial, microbes occur throughout the cored sediment columns(Fig. 2), indicating that biomass persists in the sediment for atleast 70 million years (compare Fig. 2 and Table 1). However, cellabundance is extremely low; the average counted concentrationat each depth below the seafloor at SPG sites 1–11 is 3 to 4 ordersof magnitude lower than the average of all previously exploredsubseafloor sediment populations at the same depths (Fig. 2).Throughout much of the sediment column at these sites, cellconcentrations are below the detection limit of standard countsin slurried sediment. Consequently, our counts are based onpopulations of cells separated from the sediment (21). AlthoughTa
ble
.1.
Sed
imen
tp
rop
erti
esan
dsu
bse
aflo
or
(>1.
5m
bsf
)b
iog
eoch
emic
alfl
uxe
s
Site
lati
tude
long
itud
e
Base
men
tag
e(1
6)(M
a)
wat
erde
pth
(m)
Tota
lse
dim
ent
thic
knes
s(m
)
Core
dse
dim
ent
(mbs
f)Se
dim
enta
tion
rate
(cm
/kyr
)
Org
anic
carb
onco
nten
tat
0�5
cmbs
f(d
ryw
eigh
t%
)
Org
anic
carb
onbu
rial
rate
at�
0�5
cmbs
f(m
olC/
cm2 /
yr)
Org
anic
carb
onbu
rial
rate
at�
150
cmbs
f(m
olC/
cm2 /
yr)
Dow
nwar
dO
2fl
uxat
1.5
mbs
f(m
ol/c
m2 /
yr)
Upw
ard
NO
3�fl
uxat
1.5
mbs
f(m
ol/c
m2 /
yr)
Radi
olyt
icH
2
prod
ucti
on(m
olH
2/cm
2 /yr
)
SPG
-1�
23°5
1��
165°
39�
100
5697
717.
790.
031
0.33
3.6E
�09
1.6E
�09
�2.
0E�
086.
9E�
101.
4E�
08
SPG
-2�
26°0
3��
156°
54�
100
5127
178.
200.
017
0.53
3.2E
�09
8.7E
�10
�6.
8E�
093.
5E�
103.
1E�
09
SPG
-3�
27°5
7��
148°
35�
7148
525.
495.
490.
008
0.42
1.2E
�09
4.4E
�10
�4.
1E�
095.
4E�
108.
0E�
10
SPG
-4�
26°2
9��
137°
56�
33.5
4285
97.
240.
028
0.42
4.2E
�09
1.6E
�09
�5.
4E�
09n.
d.1.
6E�
09
SPG
-5�
28°2
7��
131°
23�
24.1
4221
178.
050.
069
0.36
8.8E
�09
3.8E
�09
�7.
6E�
09n.
d.3.
0E�
09
SPG
-6�
27°5
5��
123°
10�
13.5
3738
152.
590.
111
n.d.
n.d.
7.0E
�09
�2.
2E�
08n.
d.2.
7E�
09
SPG
-7�
27°4
4��
117°
37�
6.1
3688
1.05
1.05
0.01
70.
291.
7E�
09n/
an/
an/
an/
a
SPG
-9�
38°0
4��
133°
06�
3949
2520
7.05
0.05
10.
389.
5E�
093.
8E�
09�
2.8E
�09
3.0E
�10
4.5E
�09
SPG
-10
�39
°19�
�13
9°48
�58
5283
215.
630.
037
0.56
1.0E
�08
2.0E
�09
�1.
2E�
086.
0E�
104.
8E�
09
SPG
-11
�41
°51�
�15
3°06
�75
5076
672.
980.
089
0.51
2.2E
�08
8.2E
�09
�2.
4E�
091.
6E�
091.
6E�
08
SPG
12�
45°5
8��
163°
11�
7353
0613
04.
980.
178
0.34
3.0E
�08
2.7E
�08
n/a
�3.
1E�
08n.
d
n/a
,no
tap
plic
able
;n.d
.,n
ot
det
erm
ined
.
2 12
-2
-1
0
1
2
3
log Cell Concentation (count/cm3)
log
Dep
th (
MB
SF
)
-3
104 6 8
Fig. 2. Cell concentrations in subseafloor sediment. White dots mark data fromSPG sites SPG-1 to SPG-11, and white triangles mark data from site SPG-12, justoutside the gyre (this study). Black dots mark data from all other sites (2, 3).
2 of 6 � www.pnas.org�cgi�doi�10.1073�pnas.0811793106 D’Hondt et al.
counts of separated cells may slightly underestimate total cellconcentrations, there are not significant differences between theresults of the 2 techniques at SPG-12, where cell counts aretypically above the detection limit of the standard technique. Ifthe counts of separated cells underestimate total cell concen-tration by 10–30% (21), the effect is not significant on theorders-of-magnitude scale that distinguishes the SPG countsfrom counts of subseafloor populations in other regions (Fig. 2).
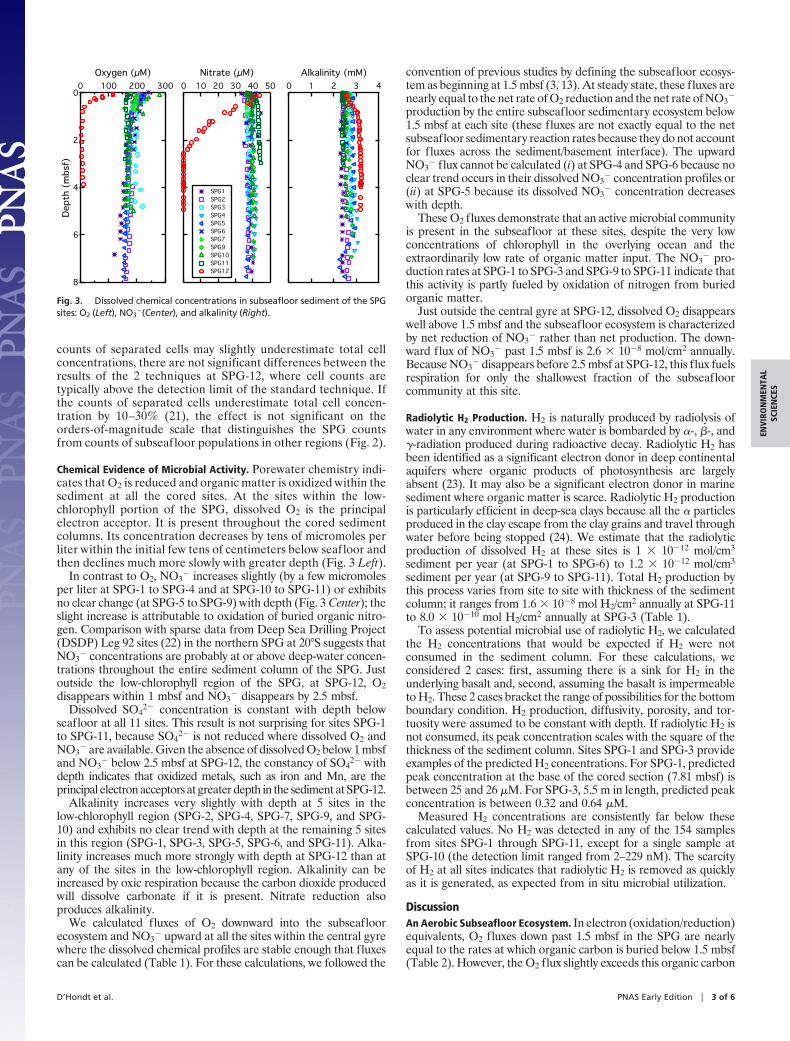
Chemical Evidence of Microbial Activity. Porewater chemistry indi-cates that O2 is reduced and organic matter is oxidized within thesediment at all the cored sites. At the sites within the low-chlorophyll portion of the SPG, dissolved O2 is the principalelectron acceptor. It is present throughout the cored sedimentcolumns. Its concentration decreases by tens of micromoles perliter within the initial few tens of centimeters below seafloor andthen declines much more slowly with greater depth (Fig. 3 Left).
In contrast to O2, NO3� increases slightly (by a few micromoles
per liter at SPG-1 to SPG-4 and at SPG-10 to SPG-11) or exhibitsno clear change (at SPG-5 to SPG-9) with depth (Fig. 3 Center); theslight increase is attributable to oxidation of buried organic nitro-gen. Comparison with sparse data from Deep Sea Drilling Project(DSDP) Leg 92 sites (22) in the northern SPG at 20°S suggests thatNO3
� concentrations are probably at or above deep-water concen-trations throughout the entire sediment column of the SPG. Justoutside the low-chlorophyll region of the SPG, at SPG-12, O2disappears within 1 mbsf and NO3
� disappears by 2.5 mbsf.Dissolved SO4
2� concentration is constant with depth belowseafloor at all 11 sites. This result is not surprising for sites SPG-1to SPG-11, because SO4
2� is not reduced where dissolved O2 andNO3
� are available. Given the absence of dissolved O2 below 1 mbsfand NO3
� below 2.5 mbsf at SPG-12, the constancy of SO42� with
depth indicates that oxidized metals, such as iron and Mn, are theprincipal electron acceptors at greater depth in the sediment at SPG-12.
Alkalinity increases very slightly with depth at 5 sites in thelow-chlorophyll region (SPG-2, SPG-4, SPG-7, SPG-9, and SPG-10) and exhibits no clear trend with depth at the remaining 5 sitesin this region (SPG-1, SPG-3, SPG-5, SPG-6, and SPG-11). Alka-linity increases much more strongly with depth at SPG-12 than atany of the sites in the low-chlorophyll region. Alkalinity can beincreased by oxic respiration because the carbon dioxide producedwill dissolve carbonate if it is present. Nitrate reduction alsoproduces alkalinity.
We calculated fluxes of O2 downward into the subseafloorecosystem and NO3
� upward at all the sites within the central gyrewhere the dissolved chemical profiles are stable enough that fluxescan be calculated (Table 1). For these calculations, we followed the
convention of previous studies by defining the subseafloor ecosys-tem as beginning at 1.5 mbsf (3, 13). At steady state, these fluxes arenearly equal to the net rate of O2 reduction and the net rate of NO3
�
production by the entire subseafloor sedimentary ecosystem below1.5 mbsf at each site (these fluxes are not exactly equal to the netsubseafloor sedimentary reaction rates because they do not accountfor fluxes across the sediment/basement interface). The upwardNO3
� flux cannot be calculated (i) at SPG-4 and SPG-6 because noclear trend occurs in their dissolved NO3
� concentration profiles or(ii) at SPG-5 because its dissolved NO3
� concentration decreaseswith depth.
These O2 fluxes demonstrate that an active microbial communityis present in the subseafloor at these sites, despite the very lowconcentrations of chlorophyll in the overlying ocean and theextraordinarily low rate of organic matter input. The NO3
� pro-duction rates at SPG-1 to SPG-3 and SPG-9 to SPG-11 indicate thatthis activity is partly fueled by oxidation of nitrogen from buriedorganic matter.
Just outside the central gyre at SPG-12, dissolved O2 disappearswell above 1.5 mbsf and the subseafloor ecosystem is characterizedby net reduction of NO3
� rather than net production. The down-ward flux of NO3
� past 1.5 mbsf is 2.6 � 10�8 mol/cm2 annually.Because NO3
� disappears before 2.5 mbsf at SPG-12, this flux fuelsrespiration for only the shallowest fraction of the subseafloorcommunity at this site.
Radiolytic H2 Production. H2 is naturally produced by radiolysis ofwater in any environment where water is bombarded by �-, �-, and�-radiation produced during radioactive decay. Radiolytic H2 hasbeen identified as a significant electron donor in deep continentalaquifers where organic products of photosynthesis are largelyabsent (23). It may also be a significant electron donor in marinesediment where organic matter is scarce. Radiolytic H2 productionis particularly efficient in deep-sea clays because all the � particlesproduced in the clay escape from the clay grains and travel throughwater before being stopped (24). We estimate that the radiolyticproduction of dissolved H2 at these sites is 1 � 10�12 mol/cm3
sediment per year (at SPG-1 to SPG-6) to 1.2 � 10�12 mol/cm3
sediment per year (at SPG-9 to SPG-11). Total H2 production bythis process varies from site to site with thickness of the sedimentcolumn; it ranges from 1.6 � 10�8 mol H2/cm2 annually at SPG-11to 8.0 � 10�10 mol H2/cm2 annually at SPG-3 (Table 1).
To assess potential microbial use of radiolytic H2, we calculatedthe H2 concentrations that would be expected if H2 were notconsumed in the sediment column. For these calculations, weconsidered 2 cases: first, assuming there is a sink for H2 in theunderlying basalt and, second, assuming the basalt is impermeableto H2. These 2 cases bracket the range of possibilities for the bottomboundary condition. H2 production, diffusivity, porosity, and tor-tuosity were assumed to be constant with depth. If radiolytic H2 isnot consumed, its peak concentration scales with the square of thethickness of the sediment column. Sites SPG-1 and SPG-3 provideexamples of the predicted H2 concentrations. For SPG-1, predictedpeak concentration at the base of the cored section (7.81 mbsf) isbetween 25 and 26 �M. For SPG-3, 5.5 m in length, predicted peakconcentration is between 0.32 and 0.64 �M.
Measured H2 concentrations are consistently far below thesecalculated values. No H2 was detected in any of the 154 samplesfrom sites SPG-1 through SPG-11, except for a single sample atSPG-10 (the detection limit ranged from 2–229 nM). The scarcityof H2 at all sites indicates that radiolytic H2 is removed as quicklyas it is generated, as expected from in situ microbial utilization.
DiscussionAn Aerobic Subseafloor Ecosystem. In electron (oxidation/reduction)equivalents, O2 fluxes down past 1.5 mbsf in the SPG are nearlyequal to the rates at which organic carbon is buried below 1.5 mbsf(Table 2). However, the O2 flux slightly exceeds this organic carbon
Fig. 3. Dissolved chemical concentrations in subseafloor sediment of the SPGsites: O2 (Left), NO3
�(Center), and alkalinity (Right).
D’Hondt et al. PNAS Early Edition � 3 of 6
ENV
IRO
NM
ENTA
LSC
IEN
CES
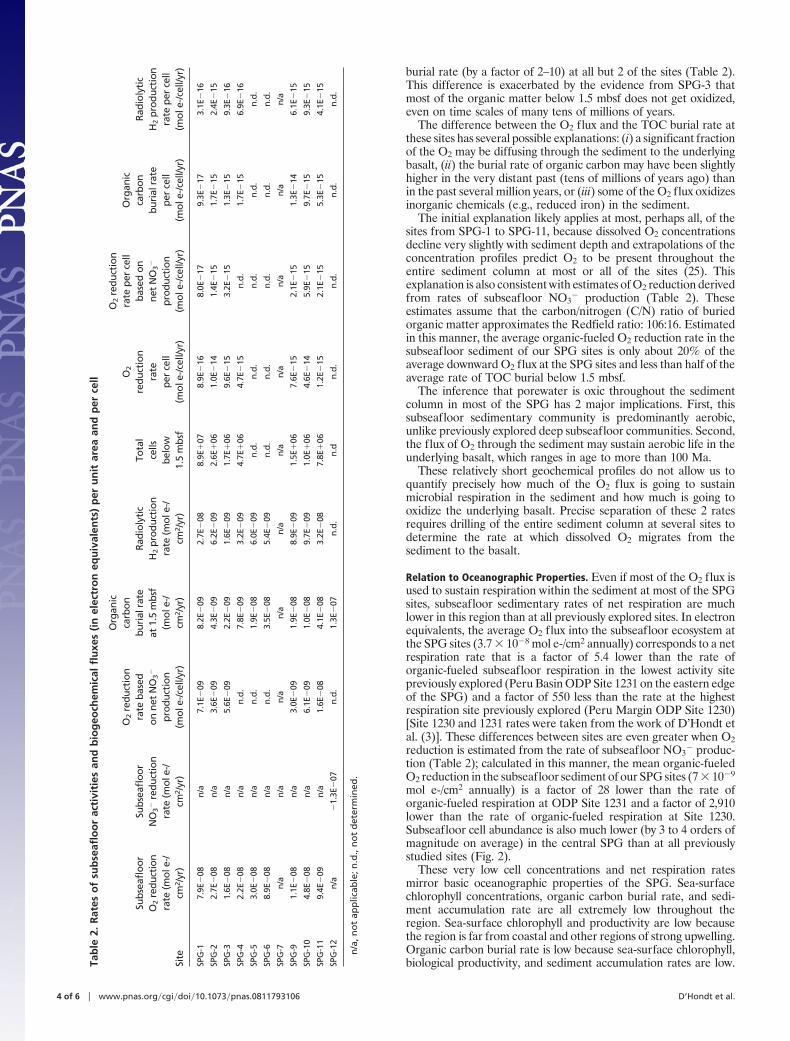
burial rate (by a factor of 2–10) at all but 2 of the sites (Table 2).This difference is exacerbated by the evidence from SPG-3 thatmost of the organic matter below 1.5 mbsf does not get oxidized,even on time scales of many tens of millions of years.
The difference between the O2 flux and the TOC burial rate atthese sites has several possible explanations: (i) a significant fractionof the O2 may be diffusing through the sediment to the underlyingbasalt, (ii) the burial rate of organic carbon may have been slightlyhigher in the very distant past (tens of millions of years ago) thanin the past several million years, or (iii) some of the O2 flux oxidizesinorganic chemicals (e.g., reduced iron) in the sediment.
The initial explanation likely applies at most, perhaps all, of thesites from SPG-1 to SPG-11, because dissolved O2 concentrationsdecline very slightly with sediment depth and extrapolations of theconcentration profiles predict O2 to be present throughout theentire sediment column at most or all of the sites (25). Thisexplanation is also consistent with estimates of O2 reduction derivedfrom rates of subseafloor NO3
� production (Table 2). Theseestimates assume that the carbon/nitrogen (C/N) ratio of buriedorganic matter approximates the Redfield ratio: 106:16. Estimatedin this manner, the average organic-fueled O2 reduction rate in thesubseafloor sediment of our SPG sites is only about 20% of theaverage downward O2 flux at the SPG sites and less than half of theaverage rate of TOC burial below 1.5 mbsf.
The inference that porewater is oxic throughout the sedimentcolumn in most of the SPG has 2 major implications. First, thissubseafloor sedimentary community is predominantly aerobic,unlike previously explored deep subseafloor communities. Second,the flux of O2 through the sediment may sustain aerobic life in theunderlying basalt, which ranges in age to more than 100 Ma.
These relatively short geochemical profiles do not allow us toquantify precisely how much of the O2 flux is going to sustainmicrobial respiration in the sediment and how much is going tooxidize the underlying basalt. Precise separation of these 2 ratesrequires drilling of the entire sediment column at several sites todetermine the rate at which dissolved O2 migrates from thesediment to the basalt.
Relation to Oceanographic Properties. Even if most of the O2 flux isused to sustain respiration within the sediment at most of the SPGsites, subseafloor sedimentary rates of net respiration are muchlower in this region than at all previously explored sites. In electronequivalents, the average O2 flux into the subseafloor ecosystem atthe SPG sites (3.7 � 10�8 mol e-/cm2 annually) corresponds to a netrespiration rate that is a factor of 5.4 lower than the rate oforganic-fueled subseafloor respiration in the lowest activity sitepreviously explored (Peru Basin ODP Site 1231 on the eastern edgeof the SPG) and a factor of 550 less than the rate at the highestrespiration site previously explored (Peru Margin ODP Site 1230)[Site 1230 and 1231 rates were taken from the work of D’Hondt etal. (3)]. These differences between sites are even greater when O2reduction is estimated from the rate of subseafloor NO3
� produc-tion (Table 2); calculated in this manner, the mean organic-fueledO2 reduction in the subseafloor sediment of our SPG sites (7 � 10�9
mol e-/cm2 annually) is a factor of 28 lower than the rate oforganic-fueled respiration at ODP Site 1231 and a factor of 2,910lower than the rate of organic-fueled respiration at Site 1230.Subseafloor cell abundance is also much lower (by 3 to 4 orders ofmagnitude on average) in the central SPG than at all previouslystudied sites (Fig. 2).
These very low cell concentrations and net respiration ratesmirror basic oceanographic properties of the SPG. Sea-surfacechlorophyll concentrations, organic carbon burial rate, and sedi-ment accumulation rate are all extremely low throughout theregion. Sea-surface chlorophyll and productivity are low becausethe region is far from coastal and other regions of strong upwelling.Organic carbon burial rate is low because sea-surface chlorophyll,biological productivity, and sediment accumulation rates are low.Ta
ble
2.R
ates
of
sub
seafl
oo
rac
tivi
ties
and
bio
geo
chem
ical
flu
xes
(in
elec
tro
neq
uiv
alen
ts)
per
un
itar
eaan
dp
erce
ll
Site
Subs
eafl
oor
O2
redu
ctio
nra
te(m
ole-
/cm
2 /yr
)
Subs
eafl
oor
NO
3�re
duct
ion
rate
(mol
e-/
cm2 /
yr)
O2
redu
ctio
nra
teba
sed
onne
tN
O3�
prod
ucti
on(m
ole-
/cel
l/yr)
Org
anic
carb
onbu
rial
rate
at1.
5m
bsf
(mol
e-/
cm2 /
yr)
Radi
olyt
icH
2pr
oduc
tion
rate
(mol
e-/
cm2 /
yr)
Tota
lce
llsbe
low
1.5
mbs
f
O2
redu
ctio
nra
tepe
rce
ll(m
ole-
/cel
l/yr)
O2
redu
ctio
nra
tepe
rce
llba
sed
onne
tN
O3�
prod
ucti
on(m
ole-
/cel
l/yr)
Org
anic
carb
onbu
rial
rate
per
cell
(mol
e-/c
ell/y
r)
Radi
olyt
icH
2pr
oduc
tion
rate
per
cell
(mol
e-/c
ell/y
r)
SPG
-17.
9E�
08n/
a7.
1E�
098.
2E�
092.
7E�
088.
9E�
078.
9E�
168.
0E�
179.
3E�
173.
1E�
16
SPG
-22.
7E�
08n/
a3.
6E�
094.
3E�
096.
2E�
092.
6E�
061.
0E�
141.
4E�
151.
7E�
152.
4E�
15
SPG
-31.
6E�
08n/
a5.
6E�
092.
2E�
091.
6E�
091.
7E�
069.
6E�
153.
2E�
151.
3E�
159.
3E�
16
SPG
-42.
2E�
08n/
an.
d.7.
8E�
093.
2E�
094.
7E�
064.
7E�
15n.
d.1.
7E�
156.
9E�
16
SPG
-53.
0E�
08n/
an.
d.1.
9E�
086.
0E�
09n.
d.n.
d.n.
d.n.
d.n.
d.
SPG
-68.
9E�
08n/
an.
d.3.
5E�
085.
4E�
09n.
d.n.
d.n.
d.n.
d.n.
d.
SPG
-7n/
an/
an/
an/
an/
an/
an/
an/
an/
an/
a
SPG
-91.
1E�
08n/
a3.
0E�
091.
9E�
088.
9E�
091.
5E�
067.
6E�
152.
1E�
151.
3E�
146.
1E�
15
SPG
-10
4.8E
�08
n/a
6.1E
�09
1.0E
�08
9.7E
�09
1.0E
�06
4.6E
�14
5.9E
�15
9.7E
�15
9.3E
�15
SPG
-11
9.4E
�09
n/a
1.6E
�08
4.1E
�08
3.2E
�08
7.8E
�06
1.2E
�15
2.1E
�15
5.3E
�15
4.1E
�15
SPG
-12
n/a
�1.
3E�
07n.
d.1.
3E�
07n.
d.n.
dn.
d.n.
d.n.
d.n.
d.
n/a
,no
tap
plic
able
;n.d
.,n
ot
det
erm
ined
.
4 of 6 � www.pnas.org�cgi�doi�10.1073�pnas.0811793106 D’Hondt et al.
Sedimentation rate is low because (i) the low productivity results ina very low production rate of biogenic debris; (ii) the great distancefrom shore leads to very low sediment transport from land; and (iii)throughout much of the region, the seafloor is below the carbonatecompensation depth, and biogenic carbonate consequently dis-solves in the water column and at the seafloor.
Potential Reliance on Radiolytic H2 Production. Our calculationsindicate that generation of H2 by radiolysis of the interstitial wateris a significant electron donor source for this community. Inelectron equivalents, we estimate the rate of H2 production by waterradiolysis at sites SPG-1, SPG-2, SPG-3, SPG-10, and SPG-11 toapproach or exceed the rate of organic carbon burial below 1.5 mbsf(Table 2). This equivalence implies that radiolysis of water providesroughly half of the electron donors used by the subseafloor sedi-mentary community at these sites and buried organic matterprovides the other half, if all the organic matter is completely used.If less of the organic matter is used, as indicated by the constancyof TOC concentration with depth at SPG-3, radiolytic H2 is theprincipal electron donor. Although microbial oxidation of this H2increases gross respiration in this ecosystem, it does not contributeto the net respiration calculated from downward O2 fluxes becausethe release of O2 by water radiolysis nearly stoichiometricallybalances the O2 used to oxidize the H2 (H2O � �1/2 O2 � H2).
H2 from water radiolysis may be the principal electron donor inthis sediment at depths greater than a few meters to a few tens ofmeters. Buried organic matter is probably the dominant food in theshallowest sediment because it tends to be oxidized at highest ratesin shallow sediment and at successively lower rates in deeper (andolder) sediment, where only the most recalcitrant or biologicallyinaccessible organic matter remains. In contrast, radiolytic H2production will be nearly constant throughout the sediment columnif porosity, grain size, and concentrations of radioactive elementsremain constant as our estimates assume; consequently, as organicoxidation declines with increasing depth below the seafloor in SPGsediment, H2 from water radiolysis is likely to become the dominantfood source. Recovery of the entire sediment column will ultimatelybe required to (i) quantify the respective roles of buried organicmatter and radiolytic H2 at each depth in the sediment column ateach site and (ii) test if H2 from water radiolysis is the dominantelectron donor at depth in SPG sediment.
Respiration per Cell. Organic-fueled respiration per cell can beindependently estimated from O2 fluxes, NO3
� fluxes, and organiccarbon burial rates at 1.5 mbsf (Table 2). The first approach assumesthat all the downward O2 flux is used for oxidation of organic matterin the sediment. The second approach assumes that a Redfield C/Nratio (106:16) can be used to calculate the rate of organic oxidationfrom the rate of NO3
� production (NO3� flux upward). The third
approach assumes that the organic carbon burial rate has beenconstant over time. These approaches are subject to differentuncertainties. The O2-based rates are overestimates to the extentthat O2 migrates through the sediment to the underlying basalt.Uncertainties in estimates from NO3
� fluxes may result from (i)NO3
� produced in the sediment diffusing to the underlying base-ment (as well as to the overlying ocean) and (ii) C/N ratios of buriedorganic matter differing from the Redfield ratio if organic nitrogenis oxidized faster than organic carbon. Estimates from organicburial rates may be overestimates because they assume that allorganic matter is eventually oxidized.
Potential gross respiration per cell can be estimated by adding anyof the above estimates to the in situ rate of radiolytic H2 productionper cell (Table 2). With any of these approaches (O2 flux, NO3
�
flux, or organic burial rate), gross respiration per cell is above ratesnecessary to counter aspartic acid racemization and DNA depuri-nation (26).
Respiration per cell appears to be much higher in the oxic SPGsediment than in previously explored anoxic sediment; in electron
equivalents, respiration per cell in the anoxic sediment of ODP Leg201 ranges between 1 � 10�17 and 5 � 10�17 mol e-/cell annually[calculated from fluxes and cell counts of ODP Sites 1226, 1227,1230, and 1231 (3, 27)]. This result is consistent with the calculationthat the energy requirement for biomass synthesis by aerobes ismore than 10 times the requirement for biomass synthesis byanaerobes (28).
Global Implications. These results have direct implications for globalpatterns of biomass and activity in subseafloor sediment. Severaloceanographic properties are at their extreme in the center of theSPG (e.g., sea-surface chlorophyll concentration, distance fromcontinents). The subseafloor sedimentary community of the centralSPG is likely to define the low-biomass low-activity end-member forglobal distributions of subseafloor biomass and respiration. How-ever, the other major ocean gyres resemble the SPG more closelythan they resemble the regions where subseafloor life was previ-ously explored. For example, sea-surface chlorophyll concentra-tions are below 0.14 mg chl/m3 in all the major ocean gyres (Fig. 1).Consequently, rates of organic-fueled respiration, cell concentra-tions, and metabolic reliance on radiolytic H2 in subseafloorsediment throughout almost half (48%) of the world ocean mayapproach the end-member values in SPG sediment.
Materials and MethodsTOC Content, Sedimentation Rate, and Burial Rates. TOC was measured at theUniversityofRhode IslandusingthetechniqueofVerardoetal. (29)andaCostechECS4010elementalanalyzer.For sitesSPG-2toSPG-12,meansedimentationrateswere calculated from crust age and sediment thickness. For SPG-1, mean sedi-mentation rate was calculated from the 20.1 mbsf depth of the 65-Ma Creta-ceous/Paleogene iridium anomaly at DSDP Site 596 (30). Organic carbon burialrates were calculated from TOC content and mean sedimentation rate andadjusted for porosity and wet bulk density. Surface burial of organic carbon isbased on TOC content of 0–5 cmbsf at sites SPG-1 to SPG-11 and 10–15 cmbsf atsite SPG-12. Burial of organic carbon at 150 cmbsf is based on TOC content ofsamples taken close to 150 cmbsf (between 143 and 167 cmbsf).
Sediment Physical Properties. Wet bulk density, grain density, and porosity weremeasured on discrete samples using the approach of Blum (31). Vertical conduc-tivity measurements were performed shipboard with a Brinkmann/MetrohmConductometerevery5cmoncores throughoutthecoredsedimentcolumns.Theconductivity probe consisted of two 2-mm-diameter platinum electrodes set 1 cmapart in a plastic block.
Cell Counts. At each site, 12–25 sediment samples were taken for shipboard cellcounts. Cells were separated from the sediment and counted using the techniqueofKallmeyeretal. (21).Ateverysite,ablanksamplewasprocessedbytreating500�L of 0.2-�m-filtered NaCl solution like a sediment sample through the entireprocess of cell extraction and counting. Because absolute cell concentrations maynot be accurately calculated from regression lines through log-transformed data(Fig. 2), average cell counts were calculated from nontransformed data. We useddata from Parkes et al. (2) and D’Hondt et al. (19) to calculate average concen-trations for previously explored communities.
Dissolved Chemical Concentrations. Interstitial waters were extracted from 5-cm-long whole rounds of cores using a Manheim-type hydraulic sediment press.
Alkalinity titrations were run on a Metrohm 809 Titrando with a MetrohmpH microelectrode, following the method of Gieskes et al. (32). Based onduplicate analyses of a control sample, precision is 0.5%.
Sulfate concentration was quantified with a Metrohm 861 Advanced Com-pact IC comprising an 853 CO2 suppressor, a thermal conductivity detector, a150- � 4.0-mm Metrosep A SUPP 5 150 column, and a 20-�L sample loop. AMetrohm 837 IC Eluent/Sample Degasser was coupled to the system. Based onduplicates, the 95% confidence limit is 0.25%.
Nitrate concentrations were analyzed with a Metrohm 844 UV/Vis CompactIC with a 150- � 4.0-mm Metrosep A SUPP 8 150 column. The pooled SD ofduplicates is 0.3%.
Ex situ dissolved O2 measurements were performed on thermally equilibratedintact whole rounds of cores. At SPG-1 and SPG-2, both custom-made microelec-trodes (33) and optodes (34) were used. The optodes, connected to a MicrosensorOxygen Meter Microx TX3 (Presens GmbH), were more stable and were used formeasurement at all other sites. Dissolved O2 concentration was determined by
D’Hondt et al. PNAS Early Edition � 5 of 6
ENV
IRO
NM
ENTA
LSC
IEN
CES
inserting a probe radially into the center of the core. Model calculations andradialprofilesshowedthattheO2 concentrationinthecorecenterofthecorewasnot affected by ambient air on the time scales of our analyses.
For dissolved H2 analyses, samples were collected with sterile 3-mL cutoffsyringes. The sample was then extruded directly into a vial, which was imme-diately filled completely with distilled H2O. A headspace was then created byinjecting H2-free gas (500 �L) through the septum while allowing an equalvolume of water to escape. The H2 was then given time to diffuse out of theinterstitial water (�24 h). Three hundred microliters of the headspace gas wasremoved and injected into a reduced gas analyzer (Trace Analytic ta3000). Theinstrument was calibrated with a 100.6-ppm H2 standard (Scott SpecialtyGases). Blanks were prepared by using vials with distilled H2O and the H2-freeheadspace. The average detection limit was 67 nM H2 (range: 2–229 nM). AtSPG-1, the headspace gas was laboratory air. Because these blanks containedtoo much H2 relative to the samples, we modified the procedure for theremaining sites by using bypass gas [carrier gas (N2) that has passed over themercury bed to remove traces of H2] for the headspace.
Chemical calculations. Dissolved chemical fluxes were calculated usingFick’s law,
F � �D/f� * �dC/dx�,
where dC/dx is the gradient of the dissolved chemical concentration profile at1.5 mbsf, D is the diffusion coefficient for the chemical in free solution, and fis the formation factor (measured as the ratio of the conductivity of seawaterto the conductivity of the saturated core). Diffusion coefficients are takenfrom the method of Schulz (35) and corrected for a temperature of 1.5 °C[bottom water temperature in this region (36)].
Our electron transport estimates make the following assumptions. Fourelectrons are accepted by reducing a molecule of O2, and 5 are acceptedduring reduction of NO3
� to N2. Eight electrons are donated by oxidizing amolecule of organic nitrogen (NH3
�) to NO3�, and 2 are donated by oxidizing
an H2 molecule to H2O. Because organic matter is a mix of molecules withcarbon in different redox states, the number of electrons donated by oxidizingorganic carbon is intermediate between the molecules with the most extreme
redox states; because the extreme redox states of organic carbon are carbo-hydrates [C (0)] and lipids [C (�II)], we assume that 5 electrons are donated byoxidation of each organic carbon molecule.
H2 yields from water radiolysis were calculated as described by Blair et al (24).These calculations use the H2 yields of Spinks and Woods (37); decay data fromEkstrom and Firestone (38); and the stopping power ratios of Aitken (39) for �-,�-,and�-radiation.Potassium-40abundancewascalculatedfromtotalpotassiumaccording to the method of Wedepohl (40). The average 238U, 232Th, and 40KconcentrationsforSPG-1toSPG-11wereassumedtobeequal totheaverage 238U,232Th, and 40K concentrations for DSDP Site 595A (SPG-1) [U 12.2 ppm (n 9)and Th 2.9 ppm (n 9) (41), K 1.56 wt% (n 15) (42)]. The average porosity andgrain density for SPG-1 to SPG-6 were assumed to be equal to the average measuredporosity(82%)andgraindensity(2.41g/cm3)forSPG-1(n27).Theaverageporosityand grain density for SPG-9 to SPG-11 were assumed to be equal to the averagemeasured porosity (76%) and grain density 2.43 g/cm3) for SPG-9 (n 18).
The H2 concentrations that would be expected from radiolytic H2 produc-tion if there were no in situ H2 utilization were calculated from these radiolyticH2 yields, by analytical solution of the continuity equation, using the sameporosity as in the H2 yield calculations, formation factor, and an H2 diffusioncoefficient corrected for 1.5 °C.
ACKNOWLEDGMENTS. The expedition would not have been possible withoutthe extraordinary effort of Captain Tom Desjardins; the crew of the RV RogerRevelle; and Knox-02RR shipboard science party members Rika Anderson,James Dorrance, Alan Durbin, Lee Ellett, Stephanie Forschner, Ruth Fuldauer,Howard Goldstein, William Griffith, Hannah Halm, Robert Harris, BenjaminHarrison, Gregory Horn, Mark Lever, Jon Meyer, Laura Morse, ChristopherMoser, Brandi Murphy, Axel Nordhausen, Lucian Parry, Ann Puschell, JustinRogers, Bruno Soffientino, Melissa Steinman, and Paul Walczak. Coring capa-bilities were provided by the Oregon State University Coring Facility, directedby Nicklas Pisias and funded by the U.S. National Science Foundation (NSF) ShipFacilities Program. The cored materials and discrete samples from the expe-dition are curated and stored by the Marine Geological Samples Laboratory atthe University of Rhode Island, directed by Steven Carey and funded by the NSFOcean Sciences Division. This project was funded by the Ocean Drilling Pro-gram of the NSF, the National Aeronautics and Space Administration Astro-biology Institute, and the Max Planck Institute for Marine Microbiology.
1. Whelan J, et al. (1986) Evidence for sulfate-reducing and methane-producing microor-ganisms in sediments from Sites 618, 619, and 622. Initial Reports Deep Sea Drilling Project96, eds Bouma AH, et al. (U.S. Government Printing Office, Washington), pp 767–775.
2. Parkes RJ, Cragg BA, Wellsbury P (2000) Recent studies on bacterial populations andprocesses in subseafloor sediments: A review. Hydrogeology J 8:11–28.
3. D’Hondt S, et al. (2004) Distributions of microbial activities in deep subseafloorsediments. Science 306:2216–2221.
4. Jørgensen BB, D’Hondt SL, Miller DJ (2006) Leg 201 synthesis: Controls on microbialcommunities in deeply buried sediments. Proceedings Ocean Drilling Program, Scien-tific Results, 201, eds Jørgensen BB, D’Hondt SL, Miller DJ (Ocean Drilling Program,College Station, TX), pp 1–45.
5. Jahnke RA (1996) The global ocean flux of particulate organic carbon: Areal distribu-tion and magnitude. Global Biogeochem Cycles 10:71–88.
6. Schippers A, et al. (2005) Prokaryotic cells of the deep sub-seafloor biosphere identifiedas living bacteria. Nature 433:861–864.
7. Sørensen KB, Teske A (2006) Stratified communities of active archaea in deep marinesubsurface sediments. Appl Environ Microbiol 72:4596–4603.
8. Biddle JF, et al. (2006) Heterotrophic Archaea dominate sedimentary subsurfaceecosystems off Peru. Proc Natl Acad Sci USA 103:3846–3851.
9. Lipp JS, Morono Y, Inagaki F, Hinrichs K-U (2008) Significant contribution of Archaeato extant biomass in marine subsurface sediments. Nature 454:991–994.
10. Inagaki F, et al. (2006) Biogeographical distribution and diversity of microbes inmethane hydrate-bearing deep marine sediments on the Pacific Ocean Margin. ProcNatl Sci USA 103:2815–2820.
11. Biddle JF, Fitz-Gibbon S, Schuster SC, Brenchley JE, House CH (2008) Metagenomicsignatures of the Peru Margin subseafloor biosphere. Proc Natl Acad Sci USA105:10583–10588.
12. Hinrichs K-U, et al. (2006) Biological formation of ethane and propane in the deepmarine subsurface. Proc Natl Acad Sci USA 103:14684–14689.
13. D’Hondt S, Rutherford S, Spivack AJ (2002) Metabolic activity of subsurface life indeep-sea sediments. Science 295:2067–2070.
14. Claustre H, Maritorena S (2003) The many shades of ocean blue. Science 302:1514–1515.15. Morel A, et al. (2007) Optical properties of the ‘‘clearest’’ natural waters. Limnol
Oceanogr 52:217–229.16. Muller RD, Roest WR, Royer J-Y, Gahagan LM, Sclater JG (1997) Digital isochrons of the
world’s ocean. J Geophys Res 102:3211–3214.17. Rea DK, et al. (2006) Broad region of no sediment in the southwest Pacific Basin.
Geology 34:873–876.18. Seibold E, Berger W (1982) The Seafloor (Springer-Verlag, Berlin Heidelberg New York).19. D’Hondt SL, et al. (2003) Controls on microbial communities in deeply buried sedi-
ments, Eastern Equatorial Pacific and Peru Margin, Sites 1225–1231, ProceedingsOcean Drilling Program, Initial Reports, 201, eds D’Hondt SL, Jørgensen BB, Miller DJ,(Ocean Drilling Program, College Station, TX).
20. Skilbeck CG, Fink, D (2006) Data report: Radiocarbon dating and sedimentation ratesfor Holocene-upper Pleistocene sediments, eastern equatorial pacific and Peru conti-nental margin. Proceedings Ocean Drilling Program, Scientific Results, 201, edsJørgensen BB, D’Hondt SL, Miller DJ (Ocean Drilling Program, College station, TX).
21. Kallmeyer J, Smith DC, Spivack AJ, D’Hondt S (2008) A new cell extraction procedureapplied to sediments from the deep subsurface biosphere. Limnol Oceanogr 6:236–245.
22. Gieskes JM, Boulegue J (1986) Interstitial water studies: Leg 92, Initial Reports Deep SeaDrilling Project 92, eds Leinen M, Rea DK, et al. (U.S. Government Printing Office,Washington), pp 423–429.
23. Lin L-H, et al. (2005) Radiolytic H2 in continental crust: Nuclear power for deepsubsurface microbial communities. Geochem Geophys Geosyst 6:Q07003, 10.1029/2004GC000907.
24. Blair CC, D’Hondt S, Spivack AJ, Kingsley RH (2007) Potential of radiolytic hydrogen formicrobial respiration in subseafloor sediments. Astrobiology 7:951–970.
25. Fischer JP, Ferdelman T, D’Hondt S, Wenzhoefer F (2007) Knox-02RR Shipboard Scien-tific Party Extreme oligotrophy in subsurface sediments of the South Pacific Gyre:Evidence from low oxygen fluxes. Goechimiba et Cosmochimica Acta 71(Suppl S):A281.
26. Price PB, Sowers T (2004) Temperature dependence of metabolic rates for microbialgrowth, maintenance and survival. Proc Natl Acad Sci USA 101:4631–4636.
27. Wang G, Spivack AJ, D’Hondt S (2006) Identification of respiration pathways in deepsubseafloor sediments using a CO2 mass-balance model. Astrobiology 6:230.
28. McCollom TM, Amend JP (2005) A thermodynamic assessment of energy requirementsfor biomass synthesis by chemolithoautotrophic micro-organisms in oxic and anoxicenvironments. Geobiology 3:135–144.
29. Verardo DJ, Froelich PN, McIntyre A (1990) Determination of organic carbon andnitrogen in marine sediments using the Carlo Erba NA-1500 Analyzer. Deep-SeaResearch 37:157–165.
30. Zhou L, Kyte FT, Bohor BF (1991) Cretaceous/Tertiary boundary of DSDP Site 596, SouthPacific. Geology 19:694–697.
31. Blum P (1997) Physical Properties Handbook—A guide to the shipboard measurementof physical properties of deep-sea cores by the Ocean Drilling Program. Ocean DrillingProject Technical Note (Ocean Drilling Program, College Station, TX).
32. Gieskes JM, Gamo T, Brumsack H (1991) Chemical Methods for Interstitial WaterAnalysis aboard JOIDES Resolution, Ocean Drilling Project Technical Note 15 (OceanDrilling Program, College Station, TX).
33. Revsbech NP, Jørgensen BB (1986) Microelectrodes: Their use in microbial ecology. AdvMicrob Ecol 9:293–352.
34. Klimant I, Meyer V, Kuhl M (1995) Fiber-optic oxygen sensors: A new tool in aquaticbiology. Limnol Oceanogr 40:1159–1165.
35. Schulz HD (2000) Quantification of early diagenesis: Dissolved constituents in marine porewater. Marine Geochemistry, eds Schulz HD, Zabel M (Springer, Berlin), pp 85–128.
36. Pickard GL, Emery WJ (1982) Descriptive Physical Oceanography: An Introduction(Pergamon, New York), 4th Ed.
37. Spinks JWT, Woods RJ (1990) An Introduction to Radiation Chemistry (John Wiley &Sons, New York).
38. Ekstrom LP, Firestone RB (1999) World Wide Web table of radioactive isotopes,database version 2/28/99. Available at http://ie.lbl.gov/toi/index.htm. Accessed Sep-tember 19, 2006.
39. Aitken MJ (1985) Thermoluminescence Dating (Academic, Orlando, FL).40. Wedepohl KH (1978) Handbook of Geochemistry (Springer, Berlin).41. Chan LH, Leeman WP, Plank T (2006) Lithium isotopic composition of marine sedi-
ments. Geochem Geophys Geosyst 7:Q06005, 10.1029/2005GC001202.42. Plank T, Langmuir CH (1998) The chemical composition of subducting sediment:
Implications for the crust and mantle. Chem Geol 145:325–394.
6 of 6 � www.pnas.org�cgi�doi�10.1073�pnas.0811793106 D’Hondt et al.